Tuscola, IL Map & Demographics
Tuscola Map
Tuscola Overview
$37,784
PER CAPITA INCOME
$88,007
AVG FAMILY INCOME
$66,791
AVG HOUSEHOLD INCOME
53.4%
WAGE / INCOME GAP [ % ]
46.6¢/ $1
WAGE / INCOME GAP [ $ ]
0.44
INEQUALITY / GINI INDEX
4,707
TOTAL POPULATION
2,372
MALE POPULATION
2,335
FEMALE POPULATION
101.58
MALES / 100 FEMALES
98.44
FEMALES / 100 MALES
37.6
MEDIAN AGE
2.8
AVG FAMILY SIZE
2.3
AVG HOUSEHOLD SIZE
2,659
LABOR FORCE [ PEOPLE ]
70.8%
PERCENT IN LABOR FORCE
2.1%
UNEMPLOYMENT RATE
Tuscola Zip Codes
Tuscola Area Codes
Income in Tuscola
Income Overview in Tuscola
Per Capita Income in Tuscola is $37,784, while median incomes of families and households are $88,007 and $66,791 respectively.
| Characteristic | Number | Measure |
| Per Capita Income | 4,707 | $37,784 |
| Median Family Income | 1,299 | $88,007 |
| Mean Family Income | 1,299 | $98,568 |
| Median Household Income | 2,045 | $66,791 |
| Mean Household Income | 2,045 | $86,421 |
| Income Deficit | 1,299 | $0 |
| Wage / Income Gap (%) | 4,707 | 53.38% |
| Wage / Income Gap ($) | 4,707 | 46.62¢ per $1 |
| Gini / Inequality Index | 4,707 | 0.44 |
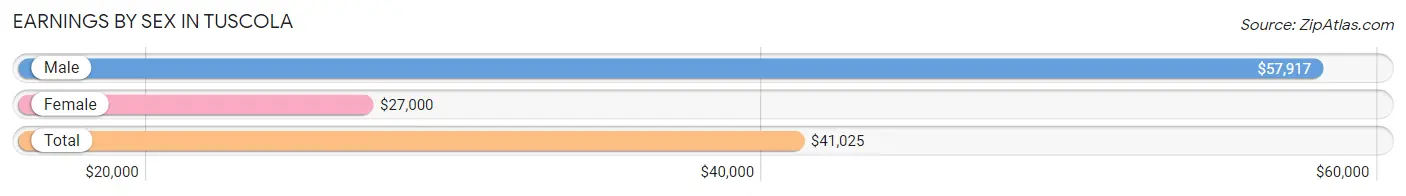
Earnings by Sex in Tuscola
Average Earnings in Tuscola are $41,025, $57,917 for men and $27,000 for women, a difference of 53.4%.
| Sex | Number | Average Earnings |
| Male | 1,559 (55.1%) | $57,917 |
| Female | 1,268 (44.9%) | $27,000 |
| Total | 2,827 (100.0%) | $41,025 |
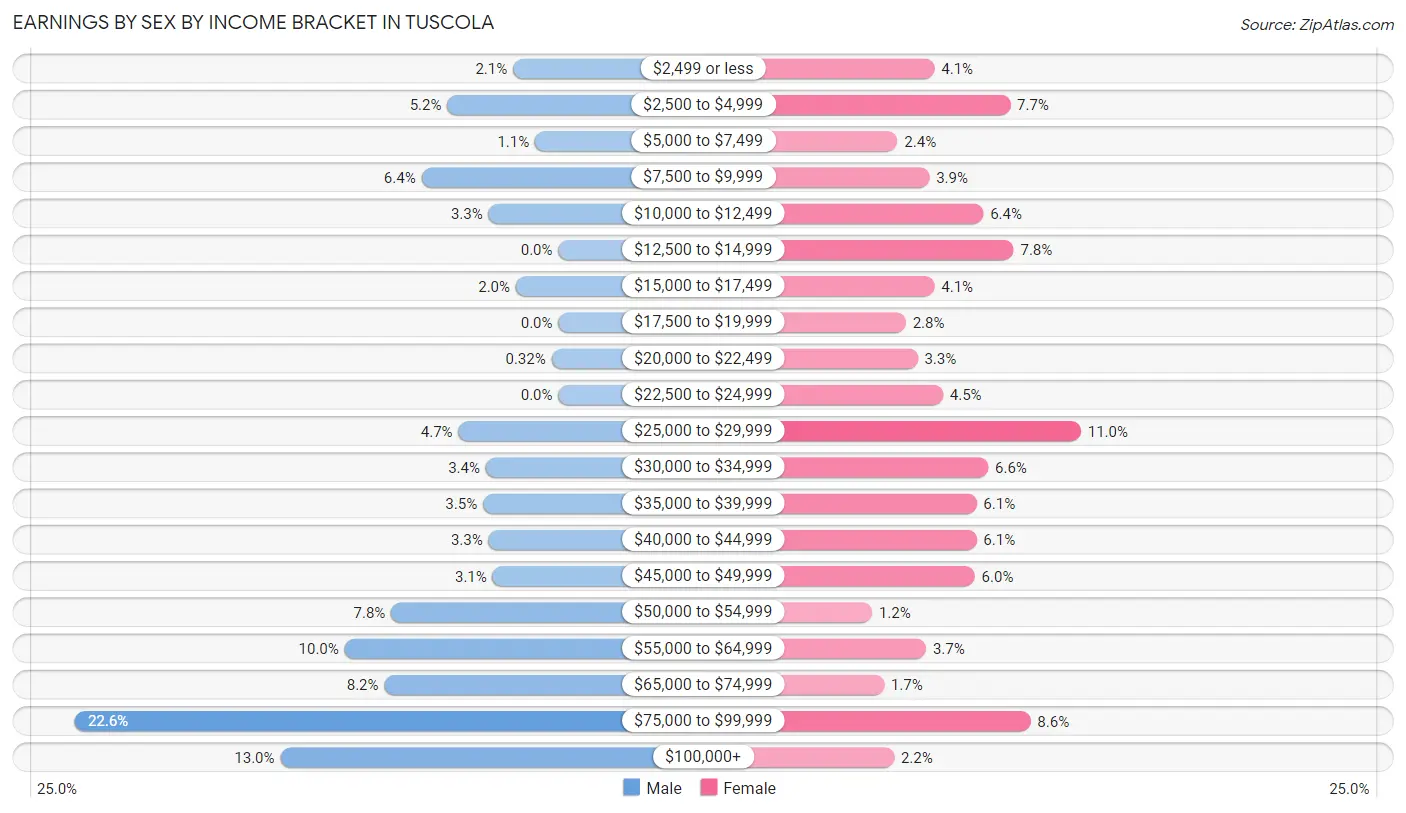
Earnings by Sex by Income Bracket in Tuscola
The most common earnings brackets in Tuscola are $75,000 to $99,999 for men (353 | 22.6%) and $25,000 to $29,999 for women (139 | 11.0%).
| Income | Male | Female |
| $2,499 or less | 33 (2.1%) | 52 (4.1%) |
| $2,500 to $4,999 | 81 (5.2%) | 97 (7.6%) |
| $5,000 to $7,499 | 17 (1.1%) | 30 (2.4%) |
| $7,500 to $9,999 | 100 (6.4%) | 49 (3.9%) |
| $10,000 to $12,499 | 51 (3.3%) | 81 (6.4%) |
| $12,500 to $14,999 | 0 (0.0%) | 99 (7.8%) |
| $15,000 to $17,499 | 31 (2.0%) | 52 (4.1%) |
| $17,500 to $19,999 | 0 (0.0%) | 35 (2.8%) |
| $20,000 to $22,499 | 5 (0.3%) | 42 (3.3%) |
| $22,500 to $24,999 | 0 (0.0%) | 57 (4.5%) |
| $25,000 to $29,999 | 73 (4.7%) | 139 (11.0%) |
| $30,000 to $34,999 | 53 (3.4%) | 84 (6.6%) |
| $35,000 to $39,999 | 55 (3.5%) | 77 (6.1%) |
| $40,000 to $44,999 | 51 (3.3%) | 77 (6.1%) |
| $45,000 to $49,999 | 48 (3.1%) | 76 (6.0%) |
| $50,000 to $54,999 | 122 (7.8%) | 15 (1.2%) |
| $55,000 to $64,999 | 156 (10.0%) | 47 (3.7%) |
| $65,000 to $74,999 | 127 (8.2%) | 22 (1.7%) |
| $75,000 to $99,999 | 353 (22.6%) | 109 (8.6%) |
| $100,000+ | 203 (13.0%) | 28 (2.2%) |
| Total | 1,559 (100.0%) | 1,268 (100.0%) |
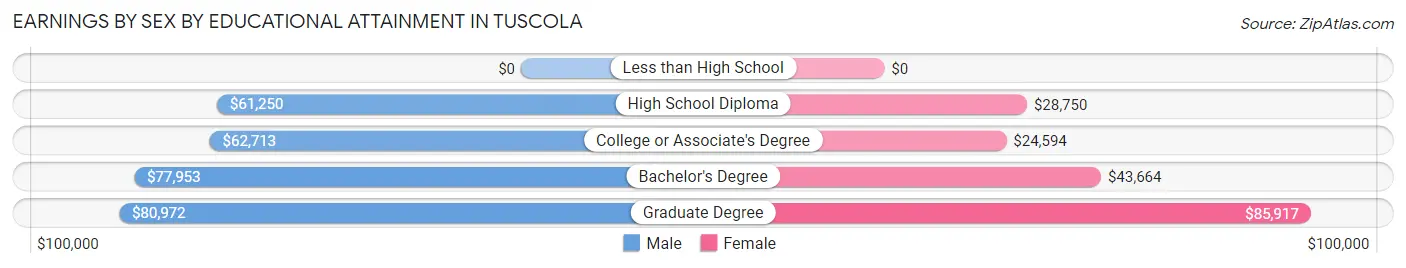
Earnings by Sex by Educational Attainment in Tuscola
Average earnings in Tuscola are $65,846 for men and $29,593 for women, a difference of 55.1%. Men with an educational attainment of graduate degree enjoy the highest average annual earnings of $80,972, while those with high school diploma education earn the least with $61,250. Women with an educational attainment of graduate degree earn the most with the average annual earnings of $85,917, while those with college or associate's degree education have the smallest earnings of $24,594.
| Educational Attainment | Male Income | Female Income |
| Less than High School | - | - |
| High School Diploma | $61,250 | $28,750 |
| College or Associate's Degree | $62,713 | $24,594 |
| Bachelor's Degree | $77,953 | $43,664 |
| Graduate Degree | $80,972 | $85,917 |
| Total | $65,846 | $29,593 |
Family Income in Tuscola
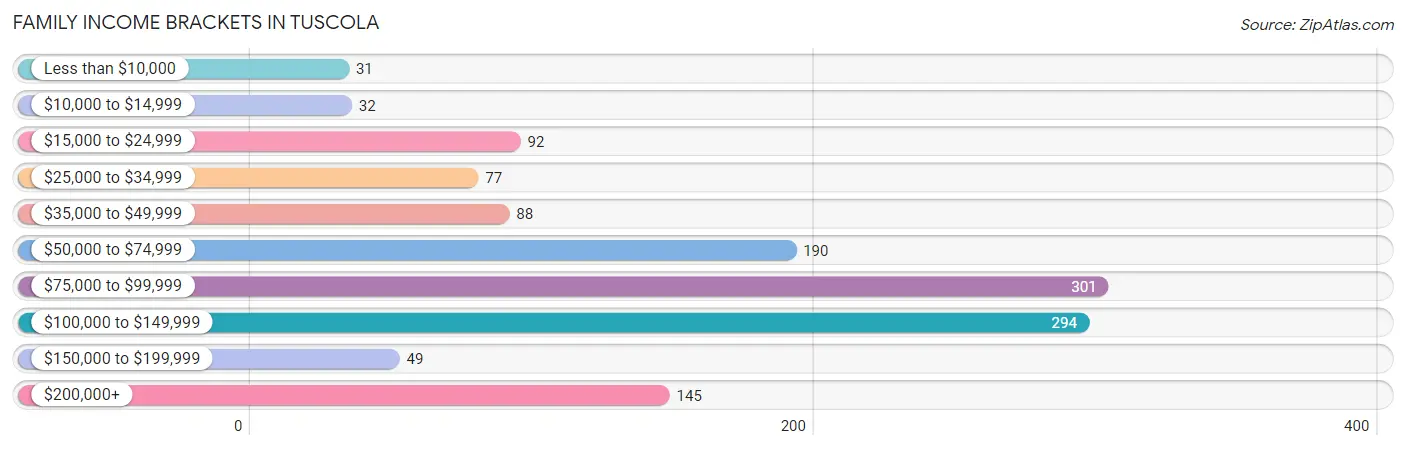
Family Income Brackets in Tuscola
According to the Tuscola family income data, there are 301 families falling into the $75,000 to $99,999 income range, which is the most common income bracket and makes up 23.2% of all families. Conversely, the less than $10,000 income bracket is the least frequent group with only 31 families (2.4%) belonging to this category.
| Income Bracket | # Families | % Families |
| Less than $10,000 | 31 | 2.4% |
| $10,000 to $14,999 | 32 | 2.5% |
| $15,000 to $24,999 | 92 | 7.1% |
| $25,000 to $34,999 | 77 | 5.9% |
| $35,000 to $49,999 | 88 | 6.8% |
| $50,000 to $74,999 | 190 | 14.6% |
| $75,000 to $99,999 | 301 | 23.2% |
| $100,000 to $149,999 | 294 | 22.6% |
| $150,000 to $199,999 | 49 | 3.8% |
| $200,000+ | 145 | 11.2% |
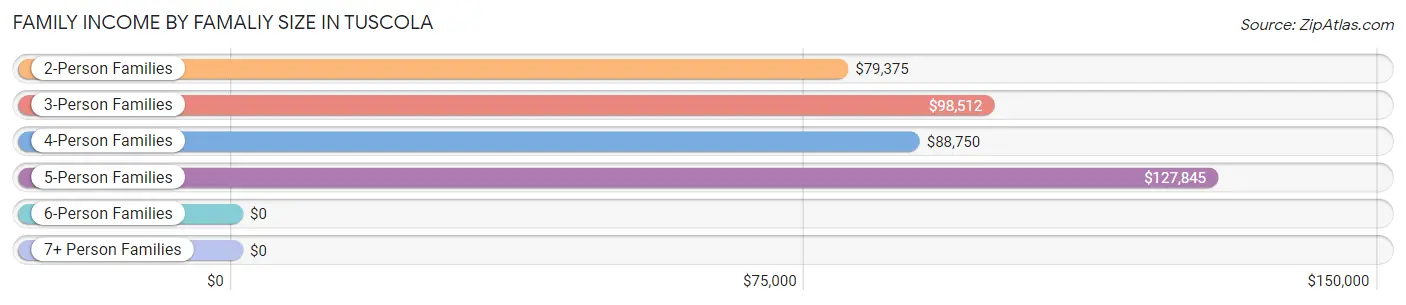
Family Income by Famaliy Size in Tuscola
5-person families (78 | 6.0%) account for the highest median family income in Tuscola with $127,845 per family, while 2-person families (650 | 50.0%) have the highest median income of $39,688 per family member.
| Income Bracket | # Families | Median Income |
| 2-Person Families | 650 (50.0%) | $79,375 |
| 3-Person Families | 275 (21.2%) | $98,512 |
| 4-Person Families | 286 (22.0%) | $88,750 |
| 5-Person Families | 78 (6.0%) | $127,845 |
| 6-Person Families | 0 (0.0%) | $0 |
| 7+ Person Families | 10 (0.8%) | $0 |
| Total | 1,299 (100.0%) | $88,007 |
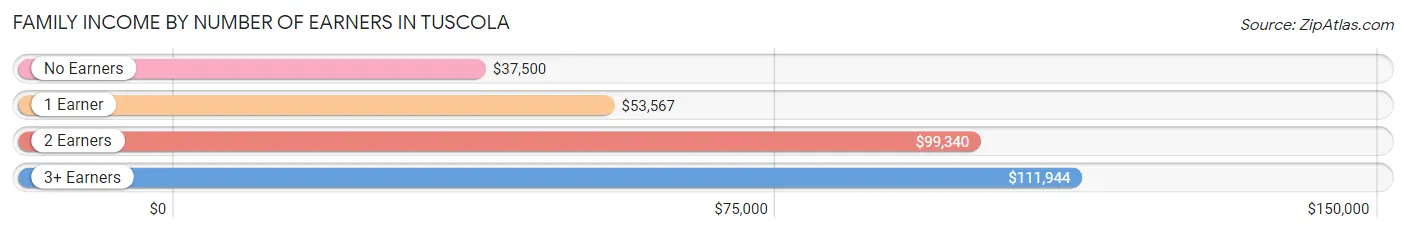
Family Income by Number of Earners in Tuscola
The median family income in Tuscola is $88,007, with families comprising 3+ earners (250) having the highest median family income of $111,944, while families with no earners (134) have the lowest median family income of $37,500, accounting for 19.3% and 10.3% of families, respectively.
| Number of Earners | # Families | Median Income |
| No Earners | 134 (10.3%) | $37,500 |
| 1 Earner | 320 (24.6%) | $53,567 |
| 2 Earners | 595 (45.8%) | $99,340 |
| 3+ Earners | 250 (19.3%) | $111,944 |
| Total | 1,299 (100.0%) | $88,007 |
Household Income in Tuscola
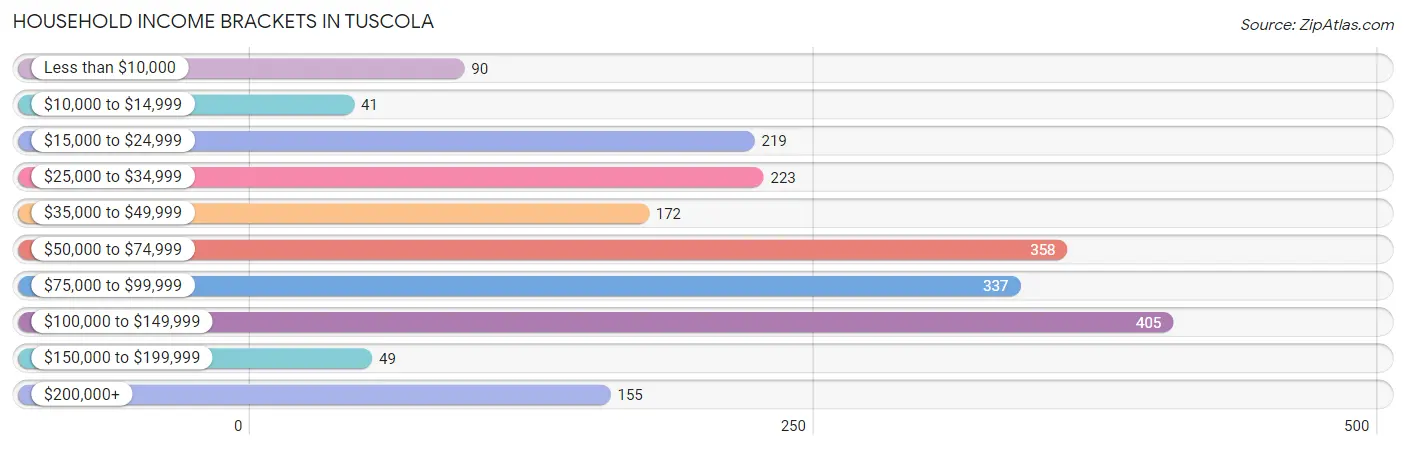
Household Income Brackets in Tuscola
With 405 households falling in the category, the $100,000 to $149,999 income range is the most frequent in Tuscola, accounting for 19.8% of all households. In contrast, only 41 households (2.0%) fall into the $10,000 to $14,999 income bracket, making it the least populous group.
| Income Bracket | # Households | % Households |
| Less than $10,000 | 90 | 4.4% |
| $10,000 to $14,999 | 41 | 2.0% |
| $15,000 to $24,999 | 219 | 10.7% |
| $25,000 to $34,999 | 223 | 10.9% |
| $35,000 to $49,999 | 172 | 8.4% |
| $50,000 to $74,999 | 358 | 17.5% |
| $75,000 to $99,999 | 337 | 16.5% |
| $100,000 to $149,999 | 405 | 19.8% |
| $150,000 to $199,999 | 49 | 2.4% |
| $200,000+ | 155 | 7.6% |
Household Income by Householder Age in Tuscola
The median household income in Tuscola is $66,791, with the highest median household income of $91,667 found in the 45 to 64 years age bracket for the primary householder. A total of 660 households (32.3%) fall into this category. Meanwhile, the 65+ years age bracket for the primary householder has the lowest median household income of $31,588, with 492 households (24.1%) in this group.
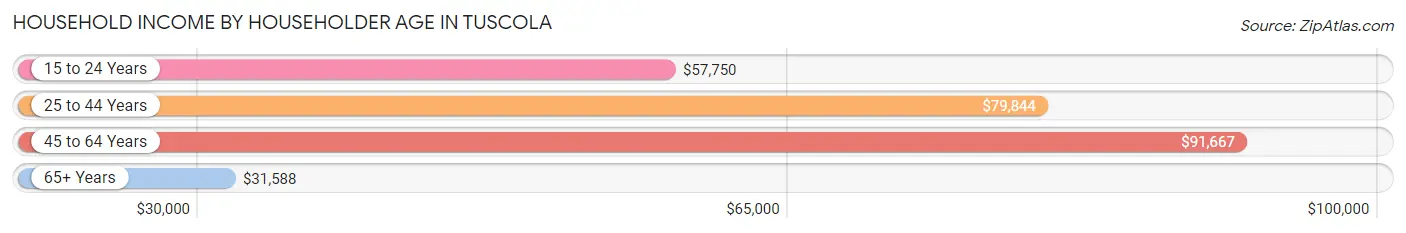
| Income Bracket | # Households | Median Income |
| 15 to 24 Years | 89 (4.3%) | $57,750 |
| 25 to 44 Years | 804 (39.3%) | $79,844 |
| 45 to 64 Years | 660 (32.3%) | $91,667 |
| 65+ Years | 492 (24.1%) | $31,588 |
| Total | 2,045 (100.0%) | $66,791 |
Poverty in Tuscola
Income Below Poverty by Sex and Age in Tuscola
With 5.8% poverty level for males and 13.4% for females among the residents of Tuscola, 12 to 14 year old males and 18 to 24 year old females are the most vulnerable to poverty, with 44 males (37.6%) and 78 females (37.9%) in their respective age groups living below the poverty level.
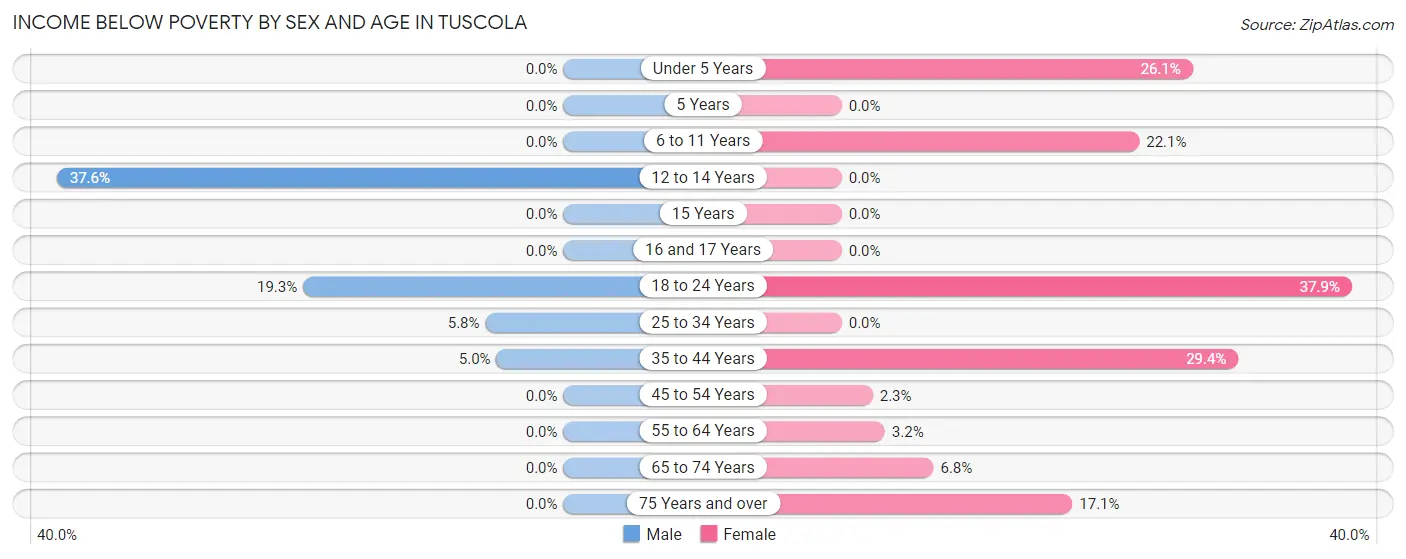
| Age Bracket | Male | Female |
| Under 5 Years | 0 (0.0%) | 62 (26.1%) |
| 5 Years | 0 (0.0%) | 0 (0.0%) |
| 6 to 11 Years | 0 (0.0%) | 19 (22.1%) |
| 12 to 14 Years | 44 (37.6%) | 0 (0.0%) |
| 15 Years | 0 (0.0%) | 0 (0.0%) |
| 16 and 17 Years | 0 (0.0%) | 0 (0.0%) |
| 18 to 24 Years | 46 (19.3%) | 78 (37.9%) |
| 25 to 34 Years | 23 (5.8%) | 0 (0.0%) |
| 35 to 44 Years | 17 (5.0%) | 83 (29.4%) |
| 45 to 54 Years | 0 (0.0%) | 7 (2.3%) |
| 55 to 64 Years | 0 (0.0%) | 9 (3.2%) |
| 65 to 74 Years | 0 (0.0%) | 13 (6.8%) |
| 75 Years and over | 0 (0.0%) | 38 (17.1%) |
| Total | 130 (5.8%) | 309 (13.4%) |
Income Above Poverty by Sex and Age in Tuscola
According to the poverty statistics in Tuscola, males aged under 5 years and females aged 5 years are the age groups that are most secure financially, with 100.0% of males and 100.0% of females in these age groups living above the poverty line.
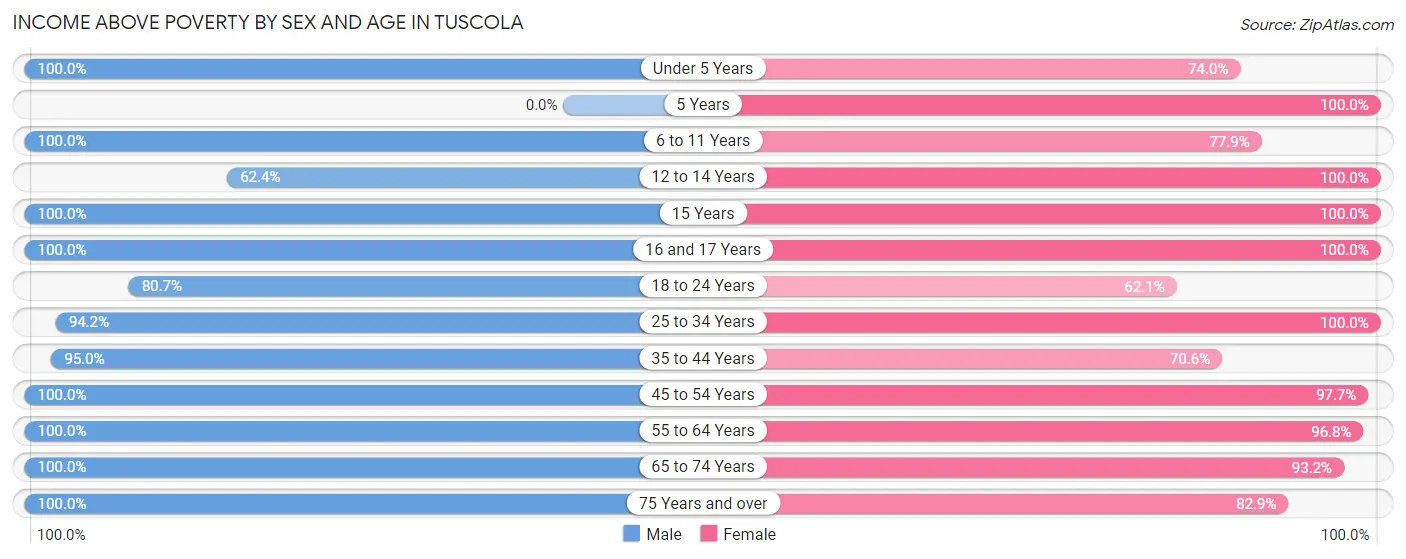
| Age Bracket | Male | Female |
| Under 5 Years | 89 (100.0%) | 176 (74.0%) |
| 5 Years | 0 (0.0%) | 84 (100.0%) |
| 6 to 11 Years | 161 (100.0%) | 67 (77.9%) |
| 12 to 14 Years | 73 (62.4%) | 17 (100.0%) |
| 15 Years | 14 (100.0%) | 42 (100.0%) |
| 16 and 17 Years | 28 (100.0%) | 65 (100.0%) |
| 18 to 24 Years | 192 (80.7%) | 128 (62.1%) |
| 25 to 34 Years | 374 (94.2%) | 282 (100.0%) |
| 35 to 44 Years | 325 (95.0%) | 199 (70.6%) |
| 45 to 54 Years | 283 (100.0%) | 297 (97.7%) |
| 55 to 64 Years | 333 (100.0%) | 272 (96.8%) |
| 65 to 74 Years | 121 (100.0%) | 178 (93.2%) |
| 75 Years and over | 139 (100.0%) | 184 (82.9%) |
| Total | 2,132 (94.3%) | 1,991 (86.6%) |
Income Below Poverty Among Married-Couple Families in Tuscola
The poverty statistics for married-couple families in Tuscola show that 1.6% or 17 of the total 1,066 families live below the poverty line. Families with 1 or 2 children have the highest poverty rate of 4.8%, comprising of 17 families. On the other hand, families with no children have the lowest poverty rate of 0.0%, which includes 0 families.
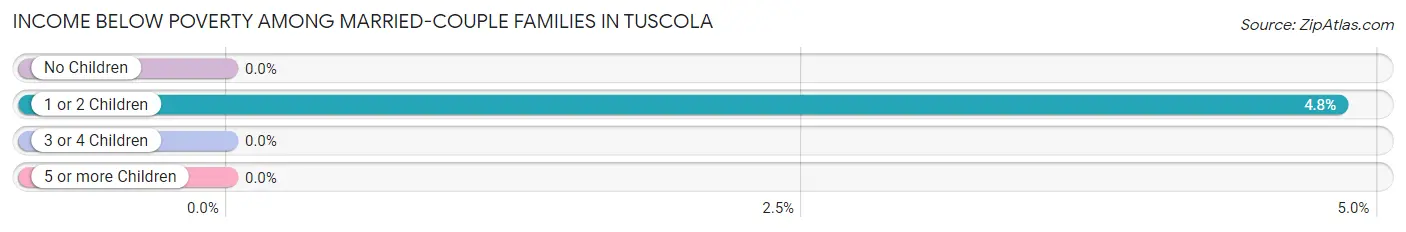
| Children | Above Poverty | Below Poverty |
| No Children | 653 (100.0%) | 0 (0.0%) |
| 1 or 2 Children | 335 (95.2%) | 17 (4.8%) |
| 3 or 4 Children | 51 (100.0%) | 0 (0.0%) |
| 5 or more Children | 10 (100.0%) | 0 (0.0%) |
| Total | 1,049 (98.4%) | 17 (1.6%) |
Income Below Poverty Among Single-Parent Households in Tuscola
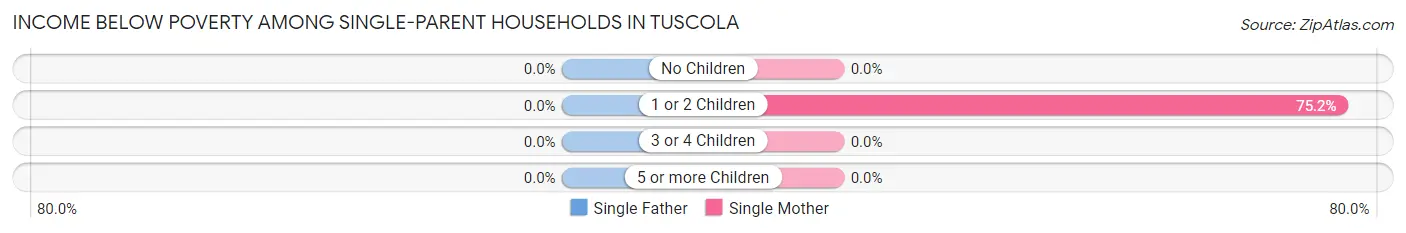
| Children | Single Father | Single Mother |
| No Children | 0 (0.0%) | 0 (0.0%) |
| 1 or 2 Children | 0 (0.0%) | 97 (75.2%) |
| 3 or 4 Children | 0 (0.0%) | 0 (0.0%) |
| 5 or more Children | 0 (0.0%) | 0 (0.0%) |
| Total | 0 (0.0%) | 97 (60.3%) |
Income Below Poverty Among Married-Couple vs Single-Parent Households in Tuscola
The poverty data for Tuscola shows that 17 of the married-couple family households (1.6%) and 97 of the single-parent households (41.6%) are living below the poverty level. Within the married-couple family households, those with 1 or 2 children have the highest poverty rate, with 17 households (4.8%) falling below the poverty line. Among the single-parent households, those with 1 or 2 children have the highest poverty rate, with 97 household (50.8%) living below poverty.
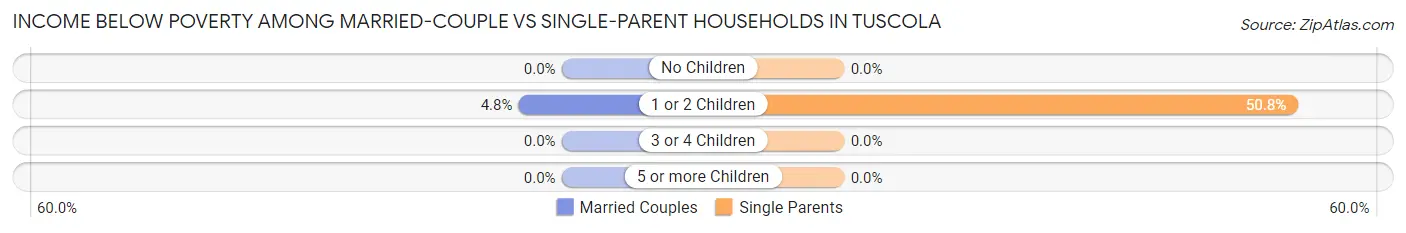
| Children | Married-Couple Families | Single-Parent Households |
| No Children | 0 (0.0%) | 0 (0.0%) |
| 1 or 2 Children | 17 (4.8%) | 97 (50.8%) |
| 3 or 4 Children | 0 (0.0%) | 0 (0.0%) |
| 5 or more Children | 0 (0.0%) | 0 (0.0%) |
| Total | 17 (1.6%) | 97 (41.6%) |
Race in Tuscola
The most populous races in Tuscola are White / Caucasian (4,345 | 92.3%), Two or more Races (183 | 3.9%), and Hispanic or Latino (132 | 2.8%).
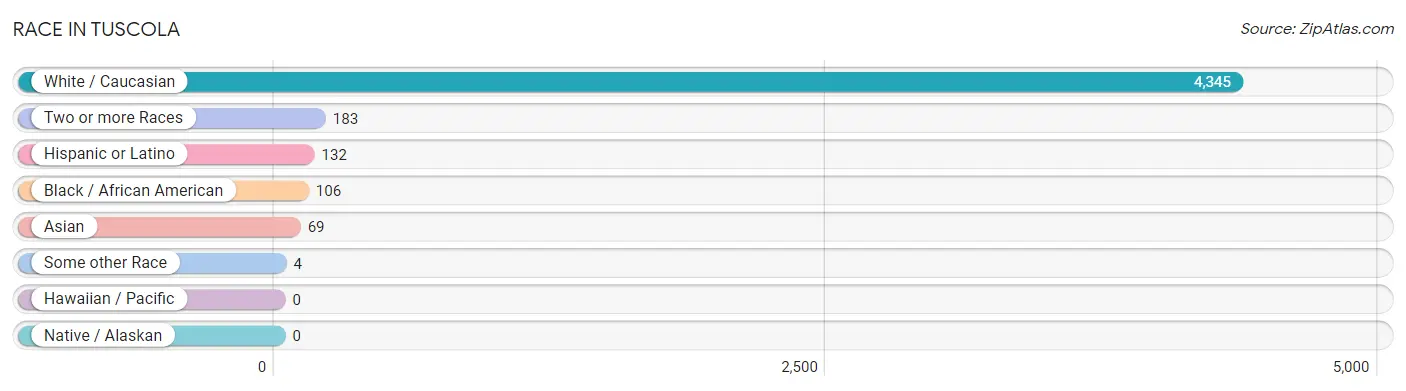
| Race | # Population | % Population |
| Asian | 69 | 1.5% |
| Black / African American | 106 | 2.2% |
| Hawaiian / Pacific | 0 | 0.0% |
| Hispanic or Latino | 132 | 2.8% |
| Native / Alaskan | 0 | 0.0% |
| White / Caucasian | 4,345 | 92.3% |
| Two or more Races | 183 | 3.9% |
| Some other Race | 4 | 0.1% |
| Total | 4,707 | 100.0% |
Ancestry in Tuscola
The most populous ancestries reported in Tuscola are German (1,127 | 23.9%), English (877 | 18.6%), Irish (601 | 12.8%), American (429 | 9.1%), and European (243 | 5.2%), together accounting for 69.6% of all Tuscola residents.
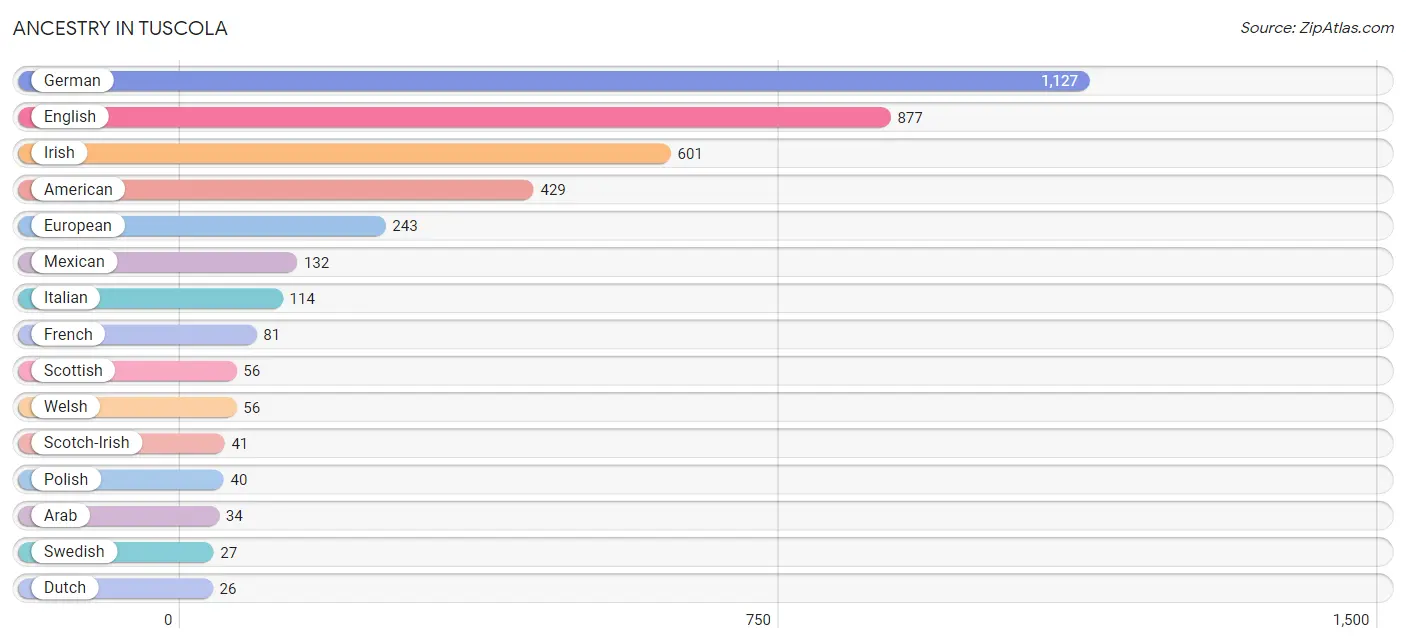
| Ancestry | # Population | % Population |
| American | 429 | 9.1% |
| Arab | 34 | 0.7% |
| Australian | 18 | 0.4% |
| Bhutanese | 16 | 0.3% |
| Canadian | 7 | 0.2% |
| Cherokee | 23 | 0.5% |
| Dutch | 26 | 0.5% |
| Dutch West Indian | 11 | 0.2% |
| English | 877 | 18.6% |
| European | 243 | 5.2% |
| French | 81 | 1.7% |
| German | 1,127 | 23.9% |
| Irish | 601 | 12.8% |
| Italian | 114 | 2.4% |
| Korean | 11 | 0.2% |
| Mexican | 132 | 2.8% |
| Norwegian | 10 | 0.2% |
| Pennsylvania German | 7 | 0.2% |
| Polish | 40 | 0.9% |
| Potawatomi | 3 | 0.1% |
| Romanian | 20 | 0.4% |
| Scotch-Irish | 41 | 0.9% |
| Scottish | 56 | 1.2% |
| Swedish | 27 | 0.6% |
| Thai | 19 | 0.4% |
| Ukrainian | 7 | 0.2% |
| Welsh | 56 | 1.2% | View All 27 Rows |
Immigrants in Tuscola
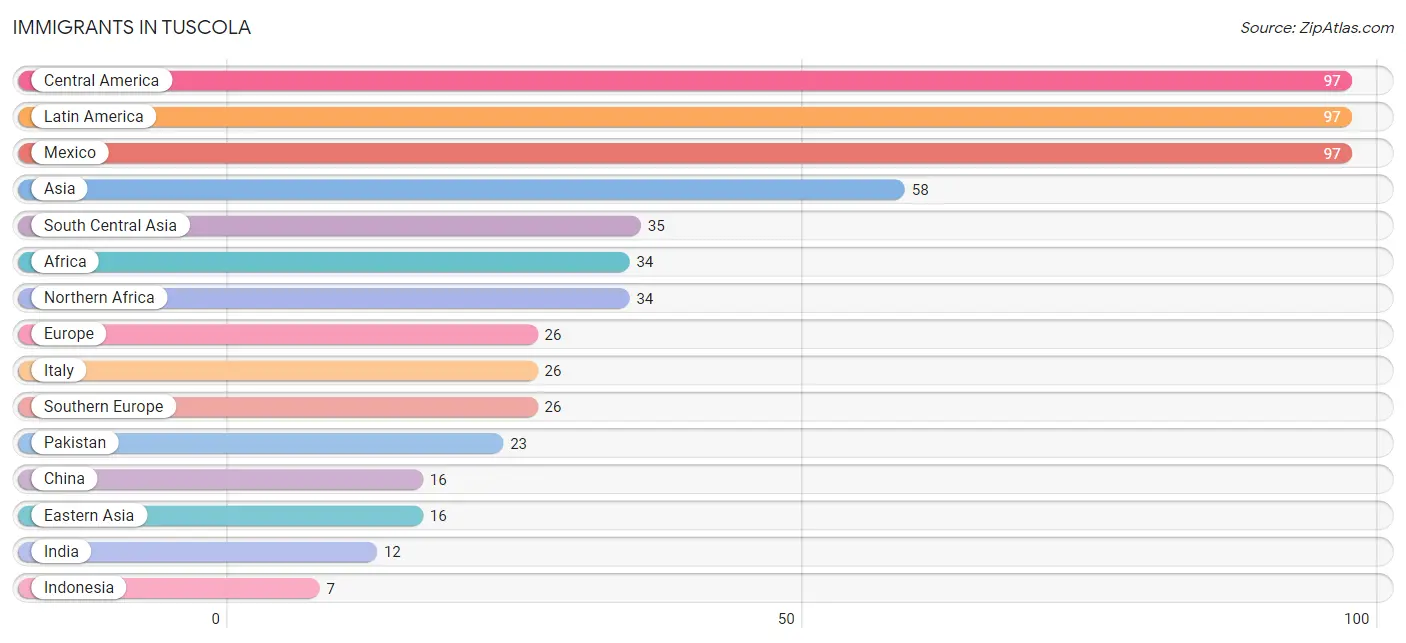
The most numerous immigrant groups reported in Tuscola came from Central America (97 | 2.1%), Latin America (97 | 2.1%), Mexico (97 | 2.1%), Asia (58 | 1.2%), and South Central Asia (35 | 0.7%), together accounting for 8.2% of all Tuscola residents.
| Immigration Origin | # Population | % Population |
| Africa | 34 | 0.7% |
| Asia | 58 | 1.2% |
| Central America | 97 | 2.1% |
| China | 16 | 0.3% |
| Eastern Asia | 16 | 0.3% |
| Europe | 26 | 0.5% |
| India | 12 | 0.3% |
| Indonesia | 7 | 0.2% |
| Italy | 26 | 0.5% |
| Latin America | 97 | 2.1% |
| Mexico | 97 | 2.1% |
| Northern Africa | 34 | 0.7% |
| Pakistan | 23 | 0.5% |
| South Central Asia | 35 | 0.7% |
| South Eastern Asia | 7 | 0.2% |
| Southern Europe | 26 | 0.5% | View All 16 Rows |
Sex and Age in Tuscola
Sex and Age in Tuscola
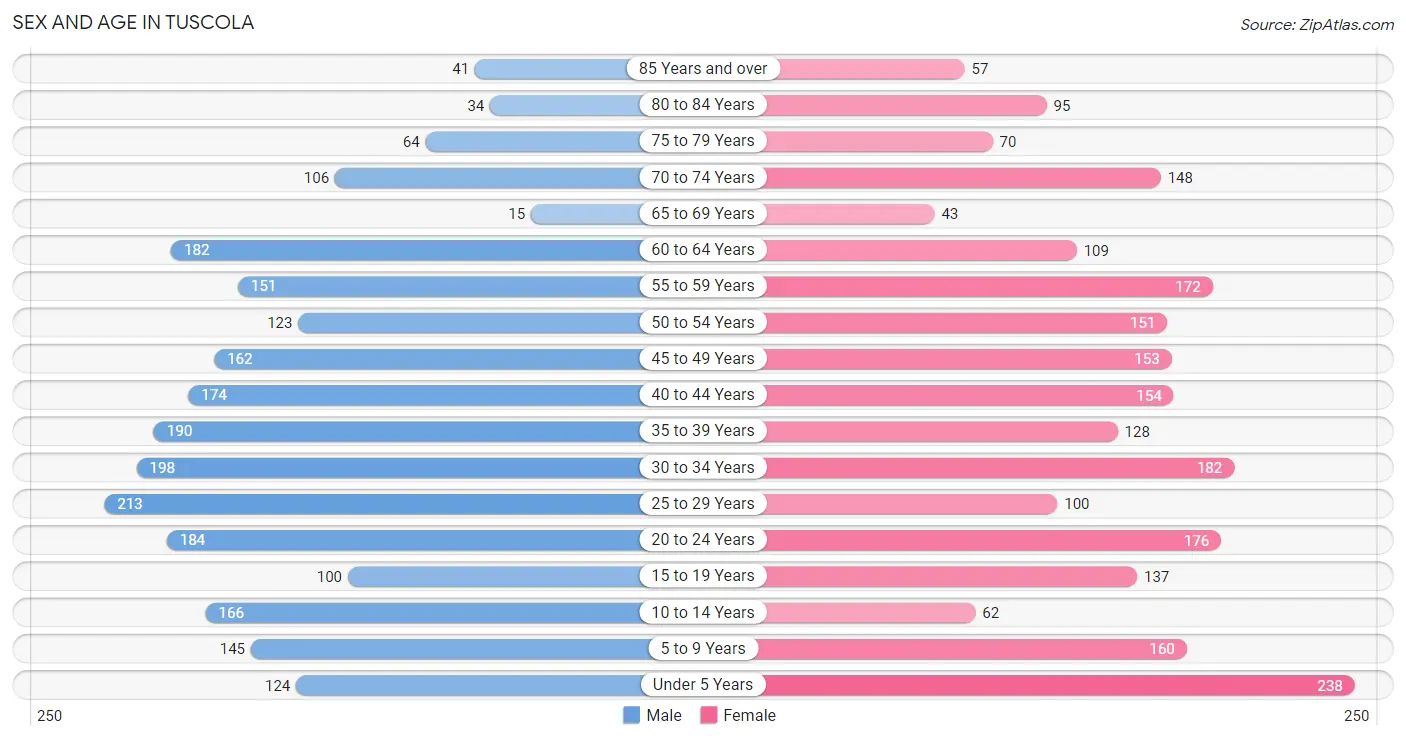
The most populous age groups in Tuscola are 25 to 29 Years (213 | 9.0%) for men and Under 5 Years (238 | 10.2%) for women.
| Age Bracket | Male | Female |
| Under 5 Years | 124 (5.2%) | 238 (10.2%) |
| 5 to 9 Years | 145 (6.1%) | 160 (6.9%) |
| 10 to 14 Years | 166 (7.0%) | 62 (2.7%) |
| 15 to 19 Years | 100 (4.2%) | 137 (5.9%) |
| 20 to 24 Years | 184 (7.8%) | 176 (7.5%) |
| 25 to 29 Years | 213 (9.0%) | 100 (4.3%) |
| 30 to 34 Years | 198 (8.4%) | 182 (7.8%) |
| 35 to 39 Years | 190 (8.0%) | 128 (5.5%) |
| 40 to 44 Years | 174 (7.3%) | 154 (6.6%) |
| 45 to 49 Years | 162 (6.8%) | 153 (6.6%) |
| 50 to 54 Years | 123 (5.2%) | 151 (6.5%) |
| 55 to 59 Years | 151 (6.4%) | 172 (7.4%) |
| 60 to 64 Years | 182 (7.7%) | 109 (4.7%) |
| 65 to 69 Years | 15 (0.6%) | 43 (1.8%) |
| 70 to 74 Years | 106 (4.5%) | 148 (6.3%) |
| 75 to 79 Years | 64 (2.7%) | 70 (3.0%) |
| 80 to 84 Years | 34 (1.4%) | 95 (4.1%) |
| 85 Years and over | 41 (1.7%) | 57 (2.4%) |
| Total | 2,372 (100.0%) | 2,335 (100.0%) |
Families and Households in Tuscola
Median Family Size in Tuscola
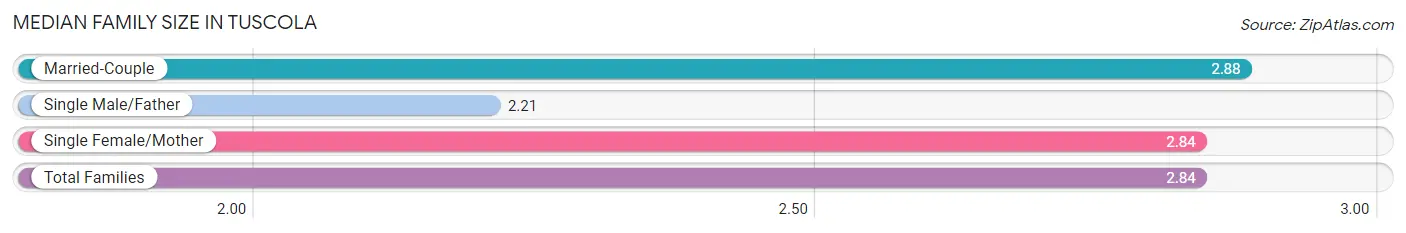
The median family size in Tuscola is 2.84 persons per family, with married-couple families (1,066 | 82.1%) accounting for the largest median family size of 2.88 persons per family. On the other hand, single male/father families (72 | 5.5%) represent the smallest median family size with 2.21 persons per family.
| Family Type | # Families | Family Size |
| Married-Couple | 1,066 (82.1%) | 2.88 |
| Single Male/Father | 72 (5.5%) | 2.21 |
| Single Female/Mother | 161 (12.4%) | 2.84 |
| Total Families | 1,299 (100.0%) | 2.84 |
Median Household Size in Tuscola
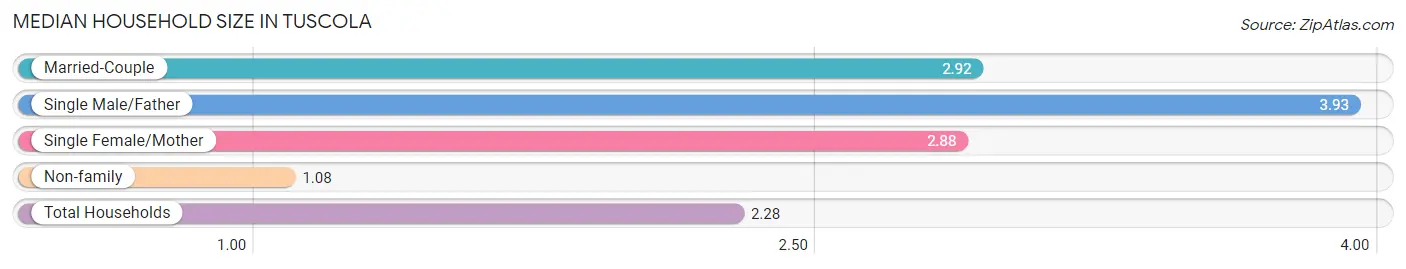
The median household size in Tuscola is 2.28 persons per household, with single male/father households (72 | 3.5%) accounting for the largest median household size of 3.93 persons per household. non-family households (746 | 36.5%) represent the smallest median household size with 1.08 persons per household.
| Household Type | # Households | Household Size |
| Married-Couple | 1,066 (52.1%) | 2.92 |
| Single Male/Father | 72 (3.5%) | 3.93 |
| Single Female/Mother | 161 (7.9%) | 2.88 |
| Non-family | 746 (36.5%) | 1.08 |
| Total Households | 2,045 (100.0%) | 2.28 |
Household Size by Marriage Status in Tuscola
Out of a total of 2,045 households in Tuscola, 1,299 (63.5%) are family households, while 746 (36.5%) are nonfamily households. The most numerous type of family households are 2-person households, comprising 608, and the most common type of nonfamily households are 1-person households, comprising 697.
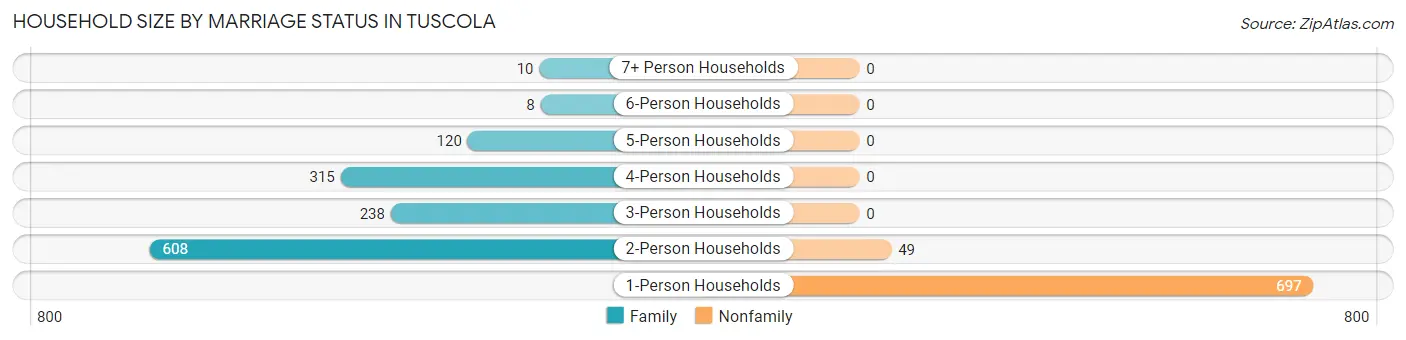
| Household Size | Family Households | Nonfamily Households |
| 1-Person Households | - | 697 (34.1%) |
| 2-Person Households | 608 (29.7%) | 49 (2.4%) |
| 3-Person Households | 238 (11.6%) | 0 (0.0%) |
| 4-Person Households | 315 (15.4%) | 0 (0.0%) |
| 5-Person Households | 120 (5.9%) | 0 (0.0%) |
| 6-Person Households | 8 (0.4%) | 0 (0.0%) |
| 7+ Person Households | 10 (0.5%) | 0 (0.0%) |
| Total | 1,299 (63.5%) | 746 (36.5%) |
Female Fertility in Tuscola
Fertility by Age in Tuscola
Average fertility rate in Tuscola is 80.0 births per 1,000 women. Women in the age bracket of 20 to 34 years have the highest fertility rate with 92.0 births per 1,000 women. Women in the age bracket of 20 to 34 years acount for 50.0% of all women with births.
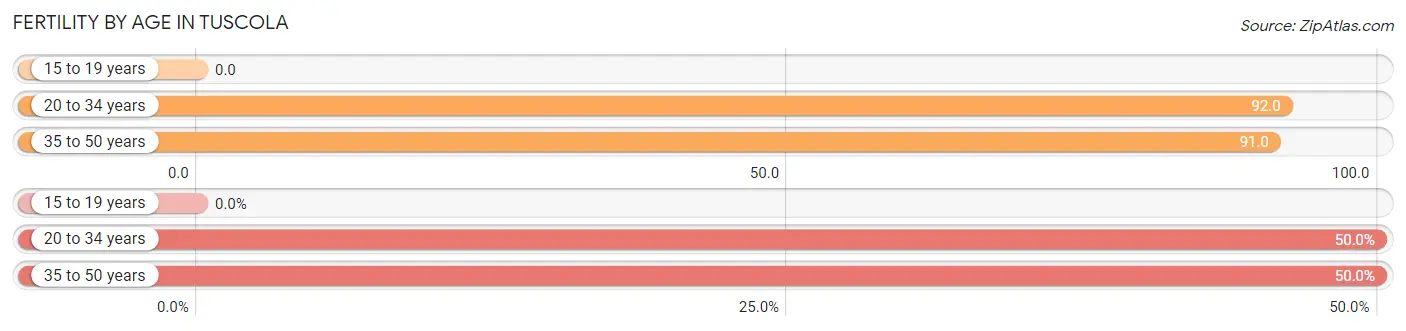
| Age Bracket | Women with Births | Births / 1,000 Women |
| 15 to 19 years | 0 (0.0%) | 0.0 |
| 20 to 34 years | 42 (50.0%) | 92.0 |
| 35 to 50 years | 42 (50.0%) | 91.0 |
| Total | 84 (100.0%) | 80.0 |
Fertility by Age by Marriage Status in Tuscola
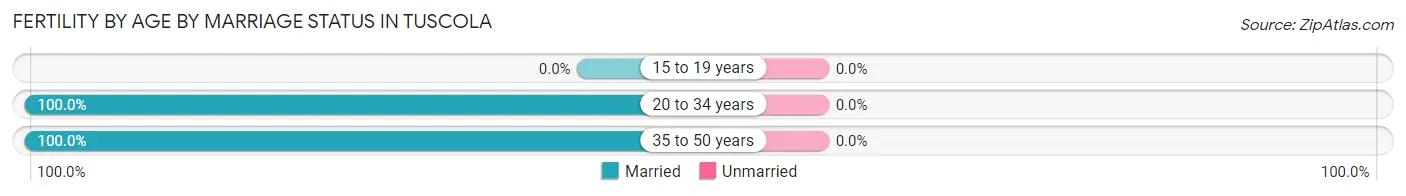
| Age Bracket | Married | Unmarried |
| 15 to 19 years | 0 (0.0%) | 0 (0.0%) |
| 20 to 34 years | 42 (100.0%) | 0 (0.0%) |
| 35 to 50 years | 42 (100.0%) | 0 (0.0%) |
| Total | 84 (100.0%) | 0 (0.0%) |
Fertility by Education in Tuscola
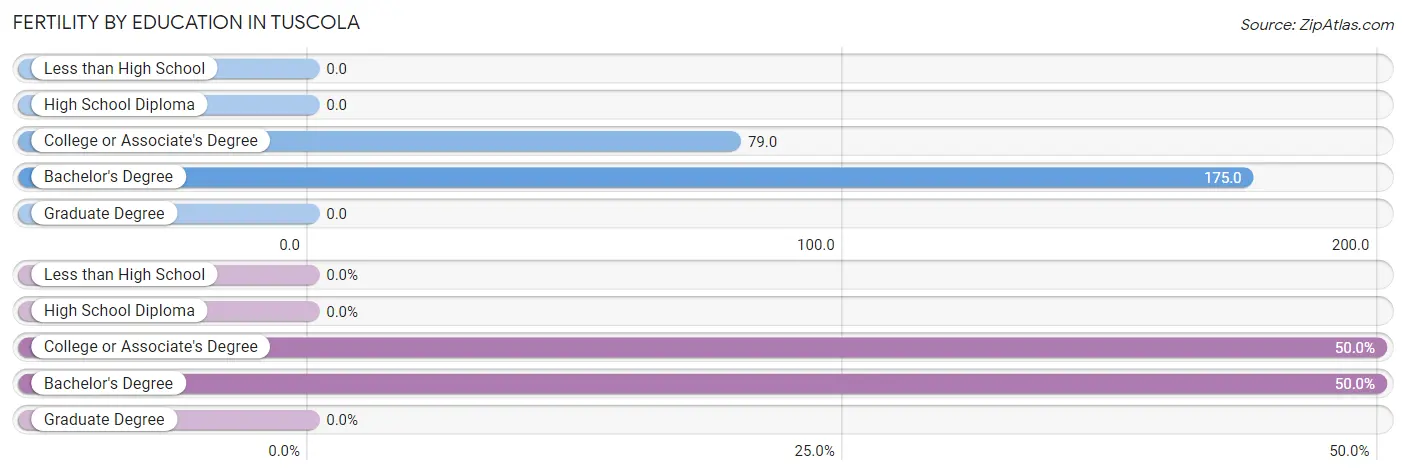
| Educational Attainment | Women with Births | Births / 1,000 Women |
| Less than High School | 0 (0.0%) | 0.0 |
| High School Diploma | 0 (0.0%) | 0.0 |
| College or Associate's Degree | 42 (50.0%) | 79.0 |
| Bachelor's Degree | 42 (50.0%) | 175.0 |
| Graduate Degree | 0 (0.0%) | 0.0 |
| Total | 84 (100.0%) | 80.0 |
Fertility by Education by Marriage Status in Tuscola
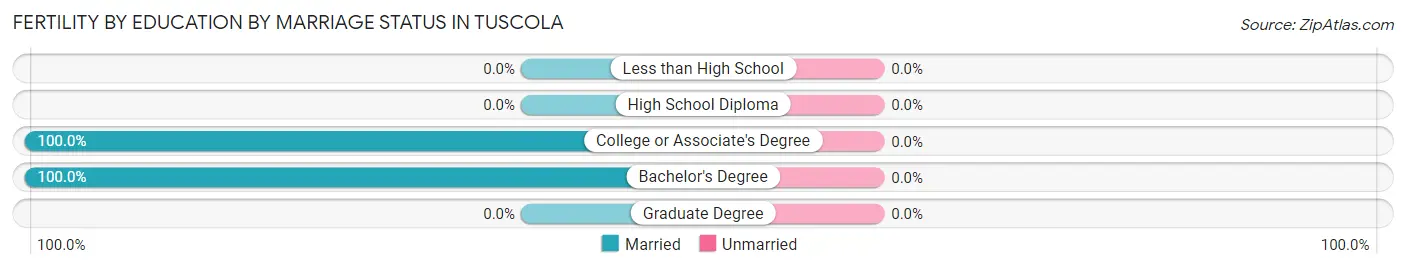
| Educational Attainment | Married | Unmarried |
| Less than High School | 0 (0.0%) | 0 (0.0%) |
| High School Diploma | 0 (0.0%) | 0 (0.0%) |
| College or Associate's Degree | 42 (100.0%) | 0 (0.0%) |
| Bachelor's Degree | 42 (100.0%) | 0 (0.0%) |
| Graduate Degree | 0 (0.0%) | 0 (0.0%) |
| Total | 84 (100.0%) | 0 (0.0%) |
Employment Characteristics in Tuscola
Employment by Class of Employer in Tuscola
Among the 2,499 employed individuals in Tuscola, private company employees (1,724 | 69.0%), local government employees (207 | 8.3%), and self-employed (not incorporated) (161 | 6.4%) make up the most common classes of employment.
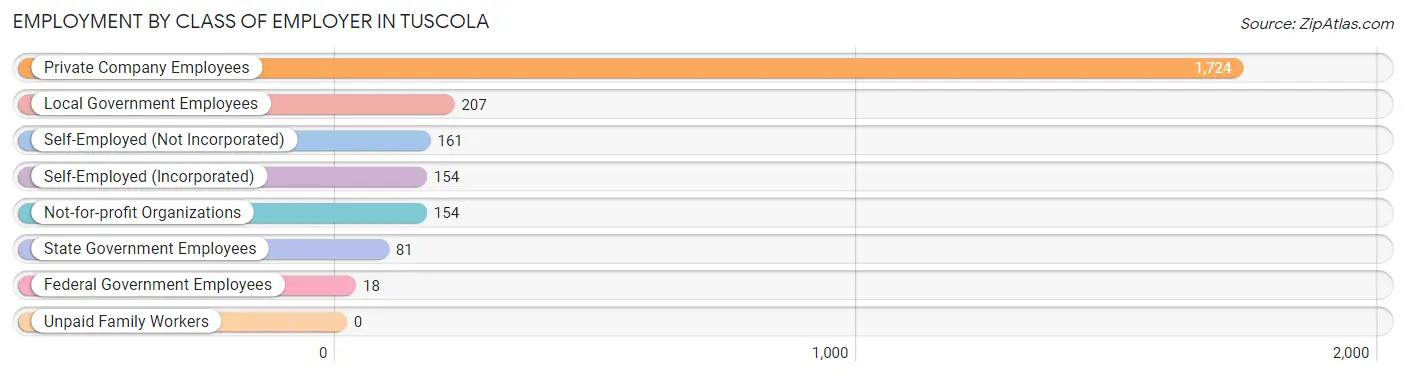
| Employer Class | # Employees | % Employees |
| Private Company Employees | 1,724 | 69.0% |
| Self-Employed (Incorporated) | 154 | 6.2% |
| Self-Employed (Not Incorporated) | 161 | 6.4% |
| Not-for-profit Organizations | 154 | 6.2% |
| Local Government Employees | 207 | 8.3% |
| State Government Employees | 81 | 3.2% |
| Federal Government Employees | 18 | 0.7% |
| Unpaid Family Workers | 0 | 0.0% |
| Total | 2,499 | 100.0% |
Employment Status by Age in Tuscola
According to the labor force statistics for Tuscola, out of the total population over 16 years of age (3,756), 70.8% or 2,659 individuals are in the labor force, with 2.1% or 56 of them unemployed. The age group with the highest labor force participation rate is 55 to 59 years, with 100.0% or 323 individuals in the labor force. Within the labor force, the 60 to 64 years age range has the highest percentage of unemployed individuals, with 9.1% or 18 of them being unemployed.
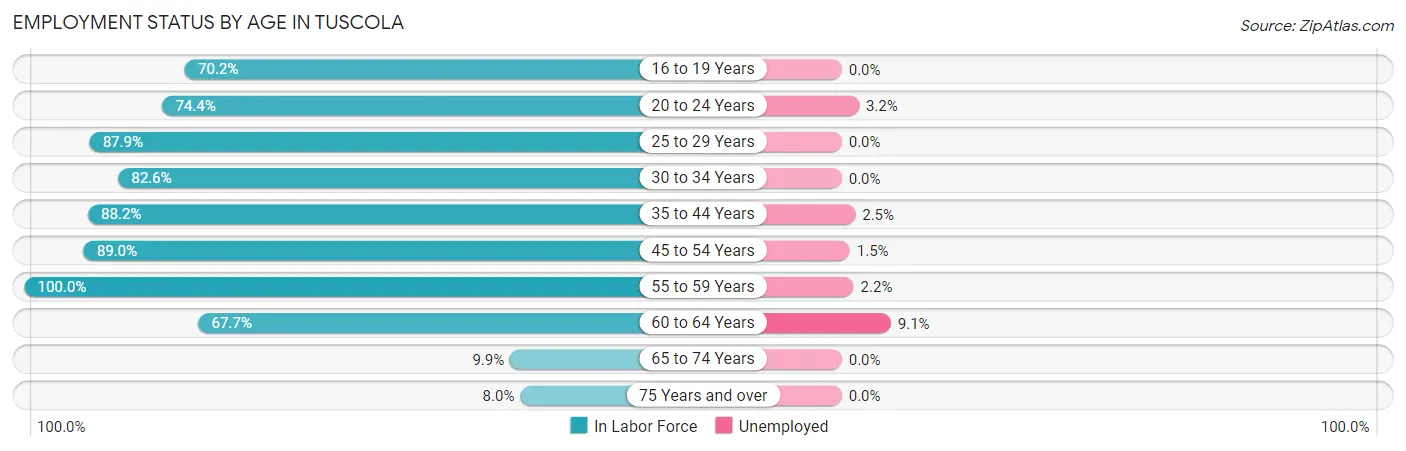
| Age Bracket | In Labor Force | Unemployed |
| 16 to 19 Years | 127 (70.2%) | 0 (0.0%) |
| 20 to 24 Years | 268 (74.4%) | 9 (3.2%) |
| 25 to 29 Years | 275 (87.9%) | 0 (0.0%) |
| 30 to 34 Years | 314 (82.6%) | 0 (0.0%) |
| 35 to 44 Years | 570 (88.2%) | 14 (2.5%) |
| 45 to 54 Years | 524 (89.0%) | 8 (1.5%) |
| 55 to 59 Years | 323 (100.0%) | 7 (2.2%) |
| 60 to 64 Years | 197 (67.7%) | 18 (9.1%) |
| 65 to 74 Years | 31 (9.9%) | 0 (0.0%) |
| 75 Years and over | 29 (8.0%) | 0 (0.0%) |
| Total | 2,659 (70.8%) | 56 (2.1%) |
Employment Status by Educational Attainment in Tuscola
According to labor force statistics for Tuscola, 86.7% of individuals (2,204) out of the total population between 25 and 64 years of age (2,542) are in the labor force, with 2.1% or 46 of them being unemployed. The group with the highest labor force participation rate are those with the educational attainment of college / associate degree, with 88.1% or 932 individuals in the labor force. Within the labor force, individuals with high school diploma education have the highest percentage of unemployment, with 2.5% or 13 of them being unemployed.
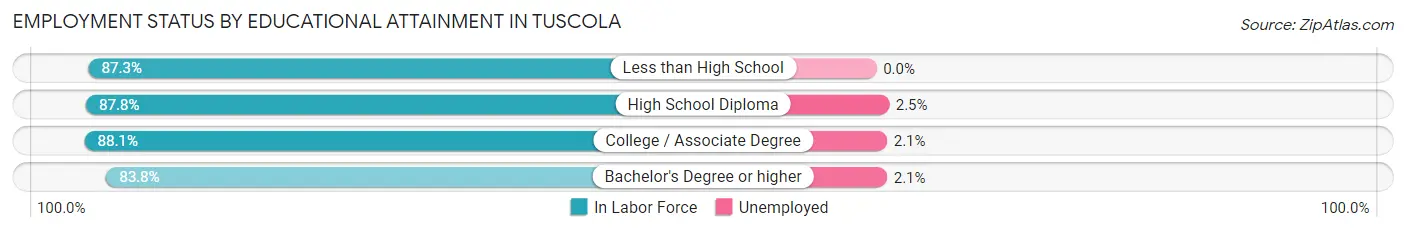
| Educational Attainment | In Labor Force | Unemployed |
| Less than High School | 96 (87.3%) | 0 (0.0%) |
| High School Diploma | 523 (87.8%) | 15 (2.5%) |
| College / Associate Degree | 932 (88.1%) | 22 (2.1%) |
| Bachelor's Degree or higher | 652 (83.8%) | 16 (2.1%) |
| Total | 2,204 (86.7%) | 53 (2.1%) |
Employment Occupations by Sex in Tuscola
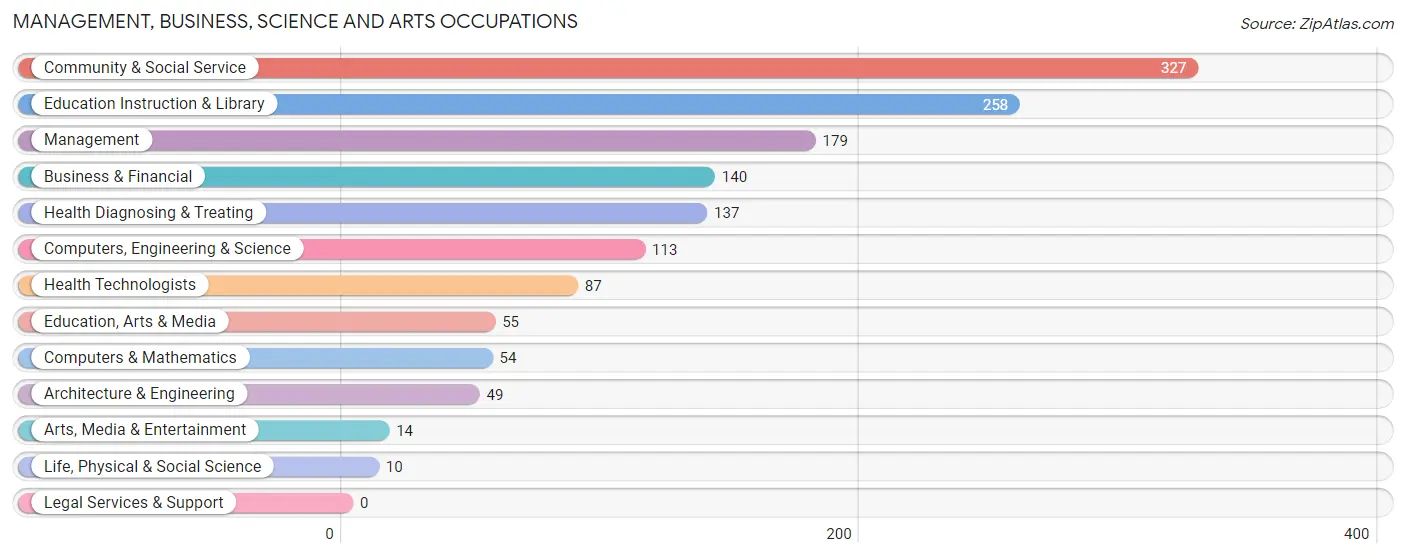
Management, Business, Science and Arts Occupations
The most common Management, Business, Science and Arts occupations in Tuscola are Community & Social Service (327 | 12.7%), Education Instruction & Library (258 | 10.0%), Management (179 | 6.9%), Business & Financial (140 | 5.4%), and Health Diagnosing & Treating (137 | 5.3%).
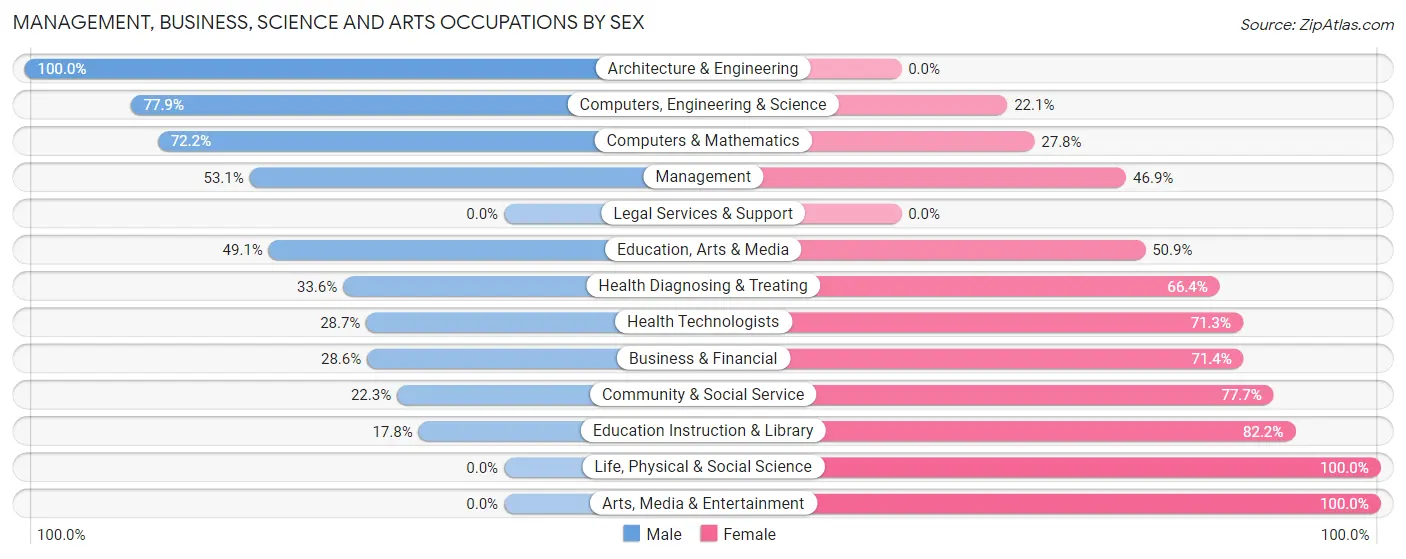
Management, Business, Science and Arts Occupations by Sex
Within the Management, Business, Science and Arts occupations in Tuscola, the most male-oriented occupations are Architecture & Engineering (100.0%), Computers, Engineering & Science (77.9%), and Computers & Mathematics (72.2%), while the most female-oriented occupations are Life, Physical & Social Science (100.0%), Arts, Media & Entertainment (100.0%), and Education Instruction & Library (82.2%).
| Occupation | Male | Female |
| Management | 95 (53.1%) | 84 (46.9%) |
| Business & Financial | 40 (28.6%) | 100 (71.4%) |
| Computers, Engineering & Science | 88 (77.9%) | 25 (22.1%) |
| Computers & Mathematics | 39 (72.2%) | 15 (27.8%) |
| Architecture & Engineering | 49 (100.0%) | 0 (0.0%) |
| Life, Physical & Social Science | 0 (0.0%) | 10 (100.0%) |
| Community & Social Service | 73 (22.3%) | 254 (77.7%) |
| Education, Arts & Media | 27 (49.1%) | 28 (50.9%) |
| Legal Services & Support | 0 (0.0%) | 0 (0.0%) |
| Education Instruction & Library | 46 (17.8%) | 212 (82.2%) |
| Arts, Media & Entertainment | 0 (0.0%) | 14 (100.0%) |
| Health Diagnosing & Treating | 46 (33.6%) | 91 (66.4%) |
| Health Technologists | 25 (28.7%) | 62 (71.3%) |
| Total (Category) | 342 (38.2%) | 554 (61.8%) |
| Total (Overall) | 1,430 (55.3%) | 1,155 (44.7%) |
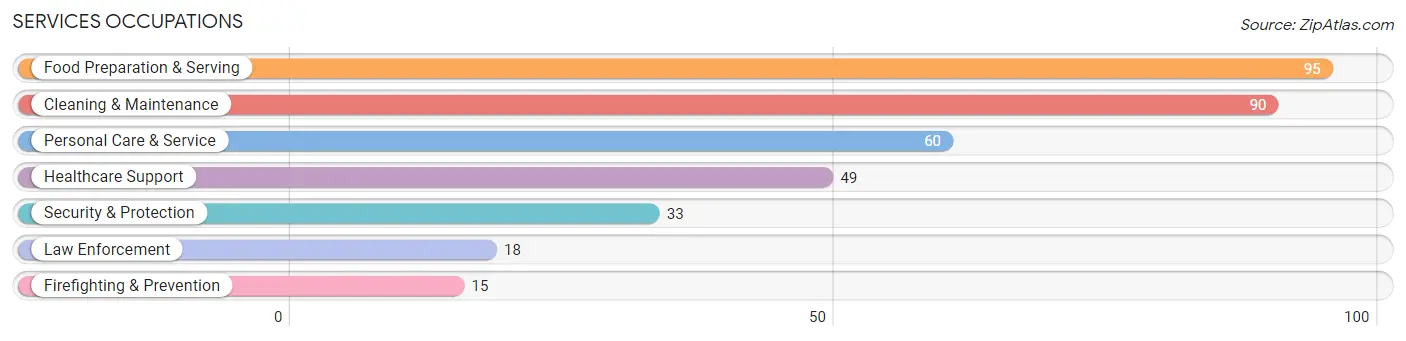
Services Occupations
The most common Services occupations in Tuscola are Food Preparation & Serving (95 | 3.7%), Cleaning & Maintenance (90 | 3.5%), Personal Care & Service (60 | 2.3%), Healthcare Support (49 | 1.9%), and Security & Protection (33 | 1.3%).
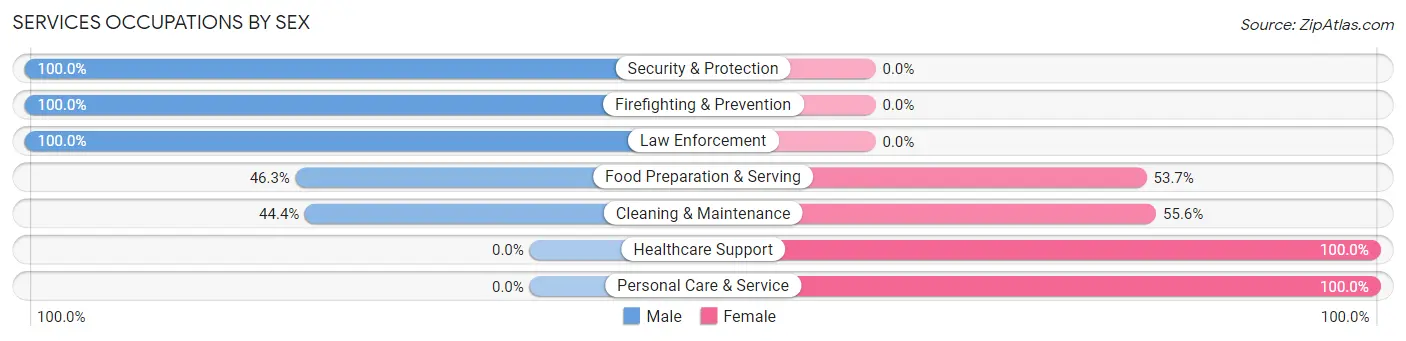
Services Occupations by Sex
Within the Services occupations in Tuscola, the most male-oriented occupations are Security & Protection (100.0%), Firefighting & Prevention (100.0%), and Law Enforcement (100.0%), while the most female-oriented occupations are Healthcare Support (100.0%), Personal Care & Service (100.0%), and Cleaning & Maintenance (55.6%).
| Occupation | Male | Female |
| Healthcare Support | 0 (0.0%) | 49 (100.0%) |
| Security & Protection | 33 (100.0%) | 0 (0.0%) |
| Firefighting & Prevention | 15 (100.0%) | 0 (0.0%) |
| Law Enforcement | 18 (100.0%) | 0 (0.0%) |
| Food Preparation & Serving | 44 (46.3%) | 51 (53.7%) |
| Cleaning & Maintenance | 40 (44.4%) | 50 (55.6%) |
| Personal Care & Service | 0 (0.0%) | 60 (100.0%) |
| Total (Category) | 117 (35.8%) | 210 (64.2%) |
| Total (Overall) | 1,430 (55.3%) | 1,155 (44.7%) |
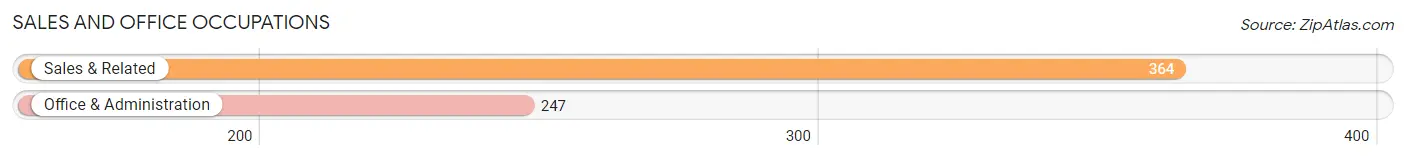
Sales and Office Occupations
The most common Sales and Office occupations in Tuscola are Sales & Related (364 | 14.1%), and Office & Administration (247 | 9.6%).
Sales and Office Occupations by Sex

| Occupation | Male | Female |
| Sales & Related | 236 (64.8%) | 128 (35.2%) |
| Office & Administration | 44 (17.8%) | 203 (82.2%) |
| Total (Category) | 280 (45.8%) | 331 (54.2%) |
| Total (Overall) | 1,430 (55.3%) | 1,155 (44.7%) |
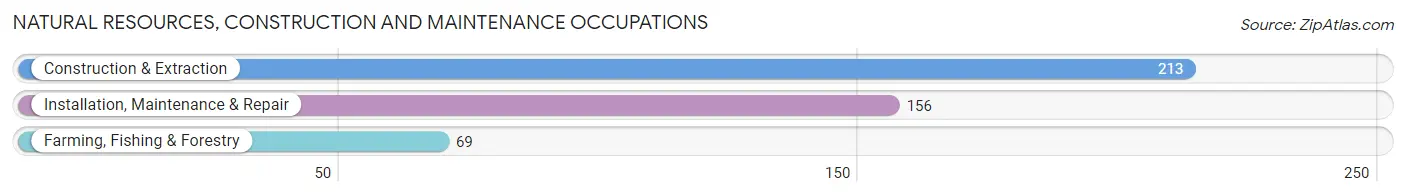
Natural Resources, Construction and Maintenance Occupations
The most common Natural Resources, Construction and Maintenance occupations in Tuscola are Construction & Extraction (213 | 8.2%), Installation, Maintenance & Repair (156 | 6.0%), and Farming, Fishing & Forestry (69 | 2.7%).
Natural Resources, Construction and Maintenance Occupations by Sex
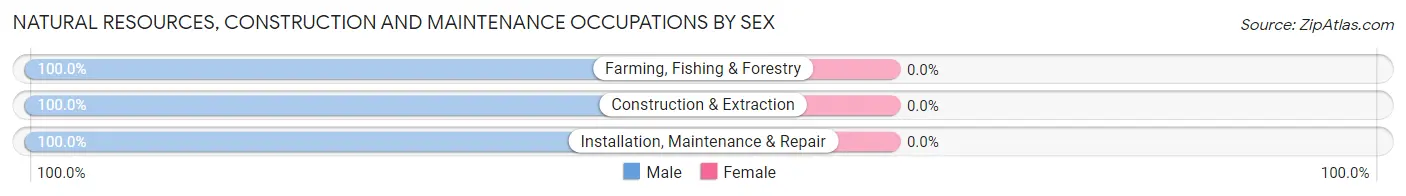
| Occupation | Male | Female |
| Farming, Fishing & Forestry | 69 (100.0%) | 0 (0.0%) |
| Construction & Extraction | 213 (100.0%) | 0 (0.0%) |
| Installation, Maintenance & Repair | 156 (100.0%) | 0 (0.0%) |
| Total (Category) | 438 (100.0%) | 0 (0.0%) |
| Total (Overall) | 1,430 (55.3%) | 1,155 (44.7%) |
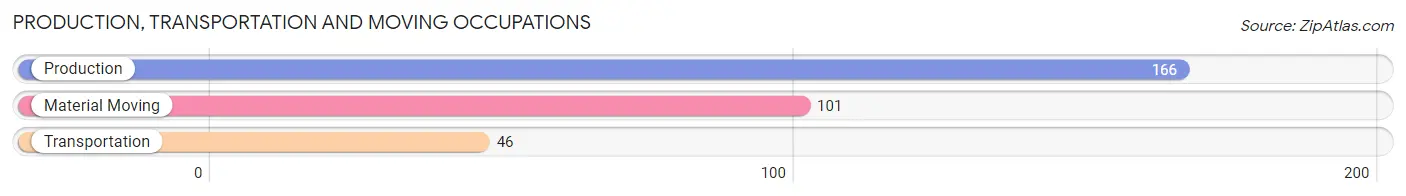
Production, Transportation and Moving Occupations
The most common Production, Transportation and Moving occupations in Tuscola are Production (166 | 6.4%), Material Moving (101 | 3.9%), and Transportation (46 | 1.8%).
Production, Transportation and Moving Occupations by Sex
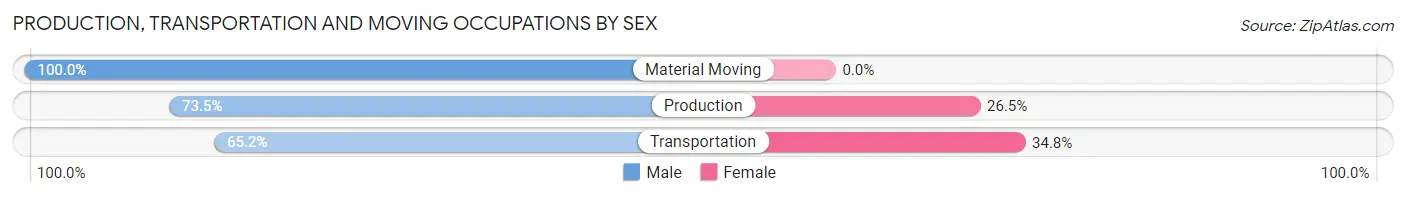
| Occupation | Male | Female |
| Production | 122 (73.5%) | 44 (26.5%) |
| Transportation | 30 (65.2%) | 16 (34.8%) |
| Material Moving | 101 (100.0%) | 0 (0.0%) |
| Total (Category) | 253 (80.8%) | 60 (19.2%) |
| Total (Overall) | 1,430 (55.3%) | 1,155 (44.7%) |
Employment Industries by Sex in Tuscola
Employment Industries in Tuscola
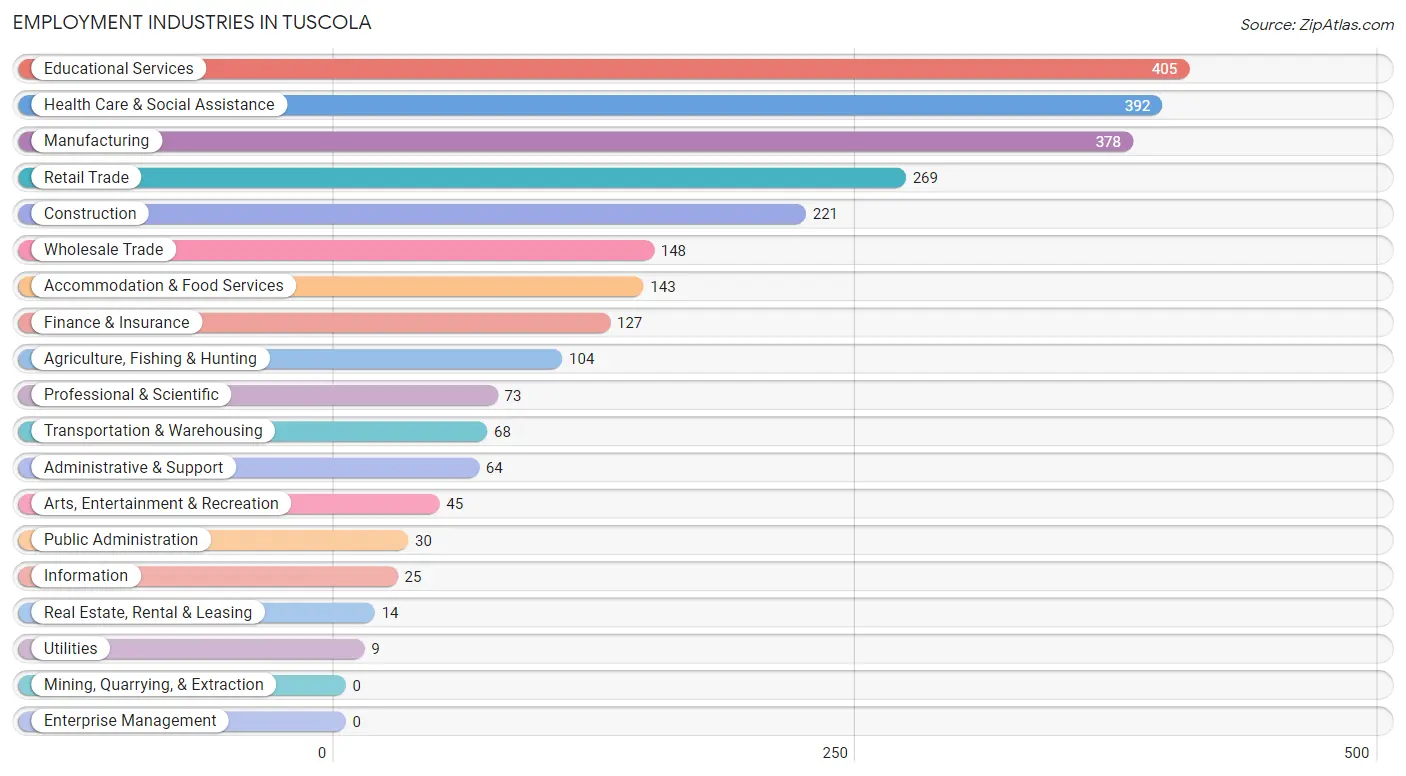
The major employment industries in Tuscola include Educational Services (405 | 15.7%), Health Care & Social Assistance (392 | 15.2%), Manufacturing (378 | 14.6%), Retail Trade (269 | 10.4%), and Construction (221 | 8.6%).
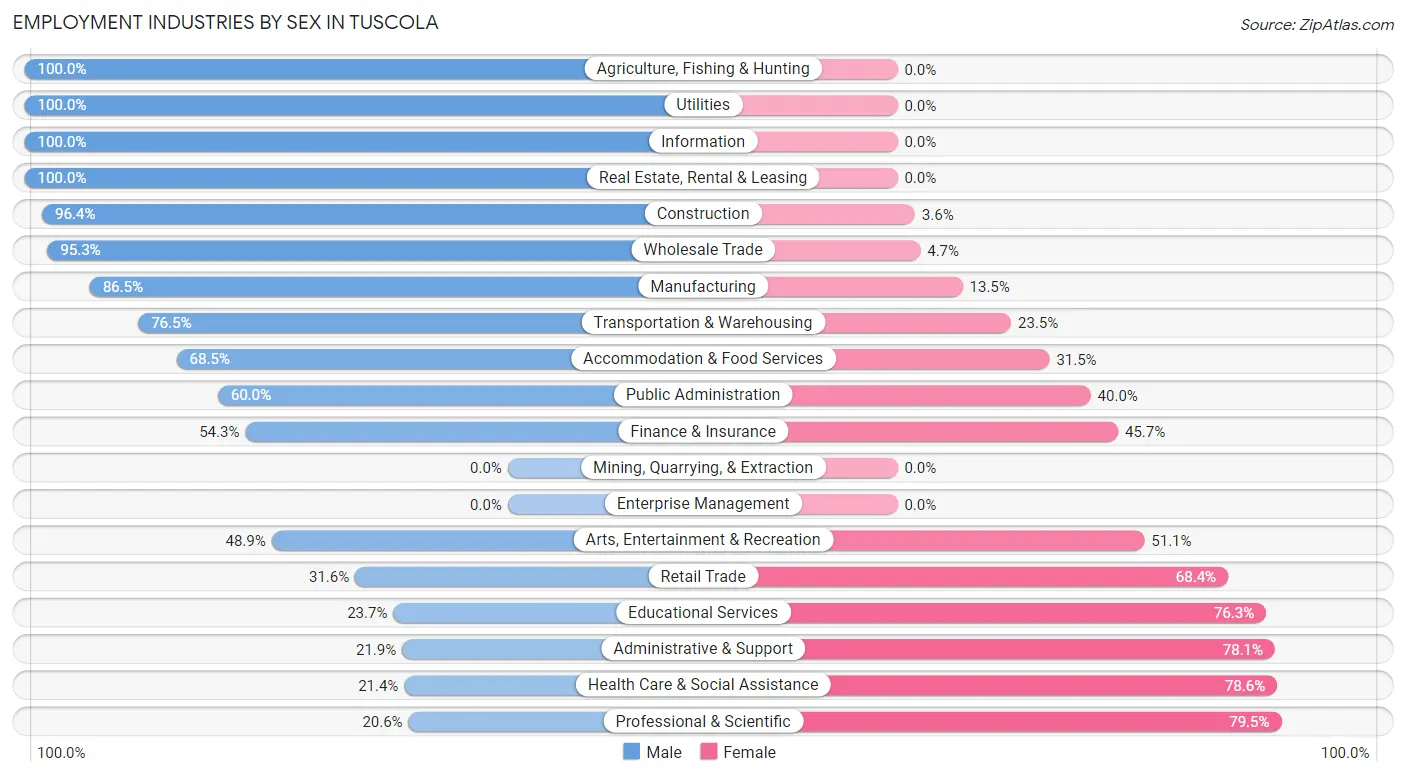
Employment Industries by Sex in Tuscola
The Tuscola industries that see more men than women are Agriculture, Fishing & Hunting (100.0%), Utilities (100.0%), and Information (100.0%), whereas the industries that tend to have a higher number of women are Professional & Scientific (79.4%), Health Care & Social Assistance (78.6%), and Administrative & Support (78.1%).
| Industry | Male | Female |
| Agriculture, Fishing & Hunting | 104 (100.0%) | 0 (0.0%) |
| Mining, Quarrying, & Extraction | 0 (0.0%) | 0 (0.0%) |
| Construction | 213 (96.4%) | 8 (3.6%) |
| Manufacturing | 327 (86.5%) | 51 (13.5%) |
| Wholesale Trade | 141 (95.3%) | 7 (4.7%) |
| Retail Trade | 85 (31.6%) | 184 (68.4%) |
| Transportation & Warehousing | 52 (76.5%) | 16 (23.5%) |
| Utilities | 9 (100.0%) | 0 (0.0%) |
| Information | 25 (100.0%) | 0 (0.0%) |
| Finance & Insurance | 69 (54.3%) | 58 (45.7%) |
| Real Estate, Rental & Leasing | 14 (100.0%) | 0 (0.0%) |
| Professional & Scientific | 15 (20.5%) | 58 (79.4%) |
| Enterprise Management | 0 (0.0%) | 0 (0.0%) |
| Administrative & Support | 14 (21.9%) | 50 (78.1%) |
| Educational Services | 96 (23.7%) | 309 (76.3%) |
| Health Care & Social Assistance | 84 (21.4%) | 308 (78.6%) |
| Arts, Entertainment & Recreation | 22 (48.9%) | 23 (51.1%) |
| Accommodation & Food Services | 98 (68.5%) | 45 (31.5%) |
| Public Administration | 18 (60.0%) | 12 (40.0%) |
| Total | 1,430 (55.3%) | 1,155 (44.7%) |
Education in Tuscola
School Enrollment in Tuscola
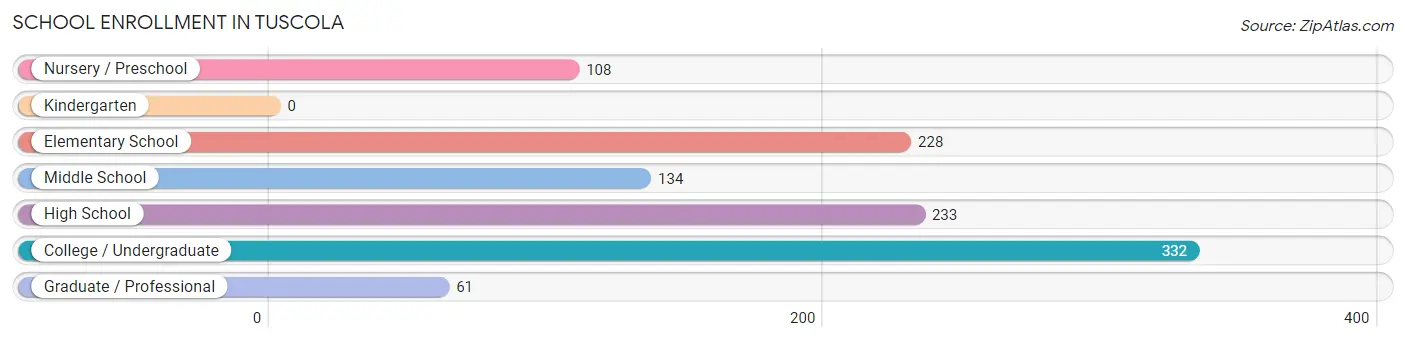
The most common levels of schooling among the 1,096 students in Tuscola are college / undergraduate (332 | 30.3%), high school (233 | 21.3%), and elementary school (228 | 20.8%).
| School Level | # Students | % Students |
| Nursery / Preschool | 108 | 9.9% |
| Kindergarten | 0 | 0.0% |
| Elementary School | 228 | 20.8% |
| Middle School | 134 | 12.2% |
| High School | 233 | 21.3% |
| College / Undergraduate | 332 | 30.3% |
| Graduate / Professional | 61 | 5.6% |
| Total | 1,096 | 100.0% |
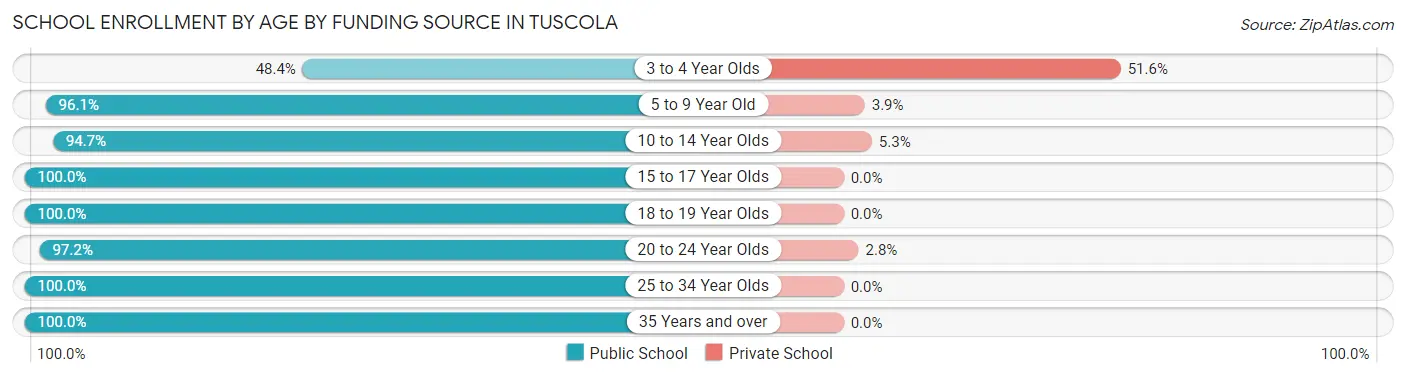
School Enrollment by Age by Funding Source in Tuscola
Out of a total of 1,096 students who are enrolled in schools in Tuscola, 44 (4.0%) attend a private institution, while the remaining 1,052 (96.0%) are enrolled in public schools. The age group of 3 to 4 year olds has the highest likelihood of being enrolled in private schools, with 16 (51.6% in the age bracket) enrolled. Conversely, the age group of 15 to 17 year olds has the lowest likelihood of being enrolled in a private school, with 149 (100.0% in the age bracket) attending a public institution.
| Age Bracket | Public School | Private School |
| 3 to 4 Year Olds | 15 (48.4%) | 16 (51.6%) |
| 5 to 9 Year Old | 293 (96.1%) | 12 (3.9%) |
| 10 to 14 Year Olds | 198 (94.7%) | 11 (5.3%) |
| 15 to 17 Year Olds | 149 (100.0%) | 0 (0.0%) |
| 18 to 19 Year Olds | 70 (100.0%) | 0 (0.0%) |
| 20 to 24 Year Olds | 175 (97.2%) | 5 (2.8%) |
| 25 to 34 Year Olds | 79 (100.0%) | 0 (0.0%) |
| 35 Years and over | 73 (100.0%) | 0 (0.0%) |
| Total | 1,052 (96.0%) | 44 (4.0%) |
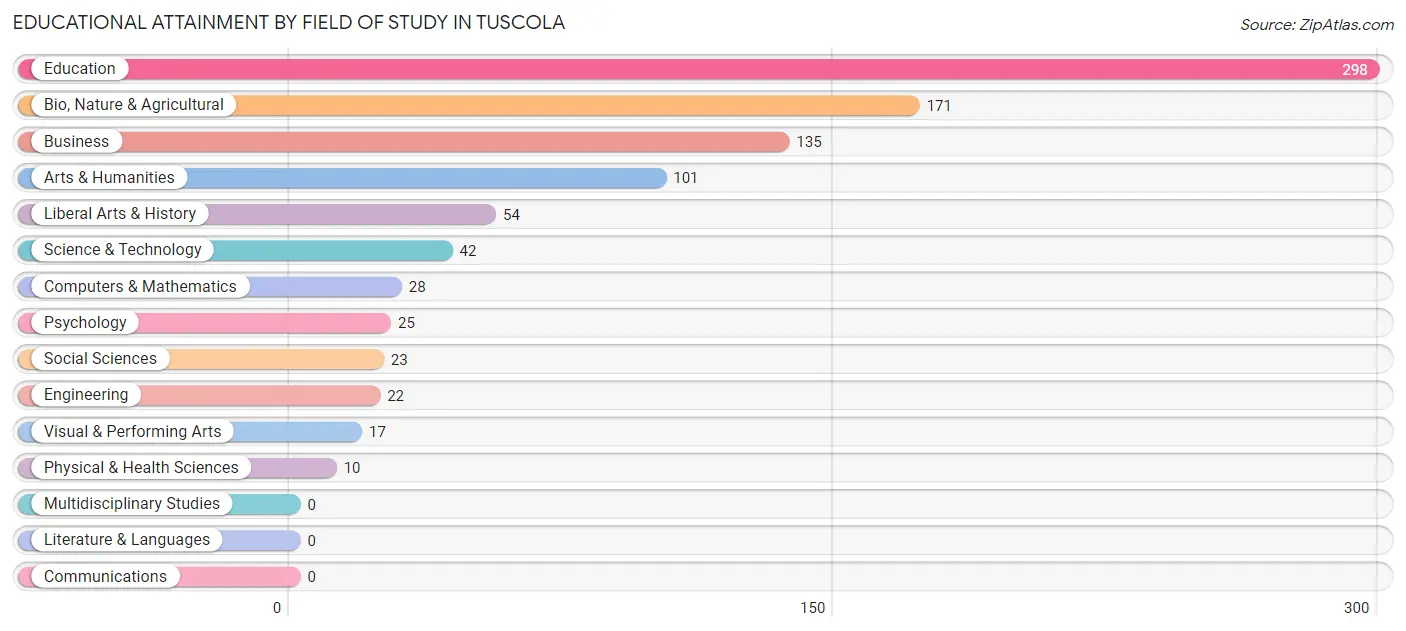
Educational Attainment by Field of Study in Tuscola
Education (298 | 32.2%), bio, nature & agricultural (171 | 18.5%), business (135 | 14.6%), arts & humanities (101 | 10.9%), and liberal arts & history (54 | 5.8%) are the most common fields of study among 926 individuals in Tuscola who have obtained a bachelor's degree or higher.
| Field of Study | # Graduates | % Graduates |
| Computers & Mathematics | 28 | 3.0% |
| Bio, Nature & Agricultural | 171 | 18.5% |
| Physical & Health Sciences | 10 | 1.1% |
| Psychology | 25 | 2.7% |
| Social Sciences | 23 | 2.5% |
| Engineering | 22 | 2.4% |
| Multidisciplinary Studies | 0 | 0.0% |
| Science & Technology | 42 | 4.5% |
| Business | 135 | 14.6% |
| Education | 298 | 32.2% |
| Literature & Languages | 0 | 0.0% |
| Liberal Arts & History | 54 | 5.8% |
| Visual & Performing Arts | 17 | 1.8% |
| Communications | 0 | 0.0% |
| Arts & Humanities | 101 | 10.9% |
| Total | 926 | 100.0% |
Transportation & Commute in Tuscola
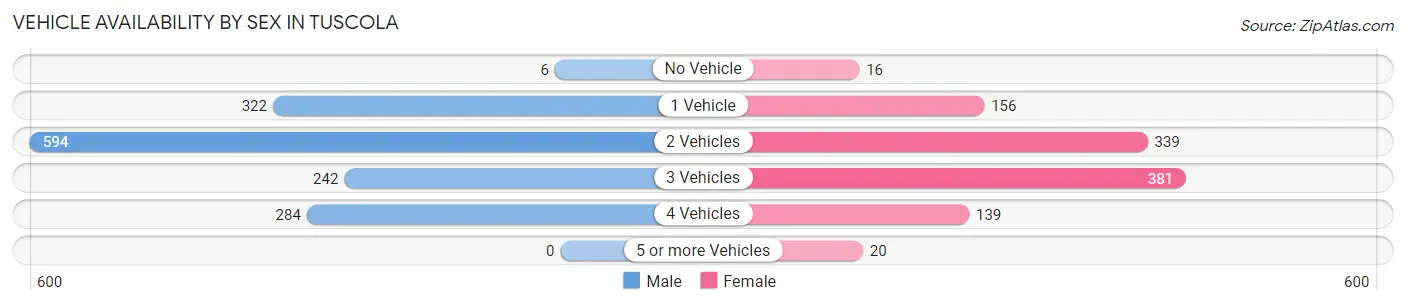
Vehicle Availability by Sex in Tuscola
The most prevalent vehicle ownership categories in Tuscola are males with 2 vehicles (594, accounting for 41.0%) and females with 2 vehicles (339, making up 56.5%).
| Vehicles Available | Male | Female |
| No Vehicle | 6 (0.4%) | 16 (1.5%) |
| 1 Vehicle | 322 (22.2%) | 156 (14.8%) |
| 2 Vehicles | 594 (41.0%) | 339 (32.3%) |
| 3 Vehicles | 242 (16.7%) | 381 (36.2%) |
| 4 Vehicles | 284 (19.6%) | 139 (13.2%) |
| 5 or more Vehicles | 0 (0.0%) | 20 (1.9%) |
| Total | 1,448 (100.0%) | 1,051 (100.0%) |
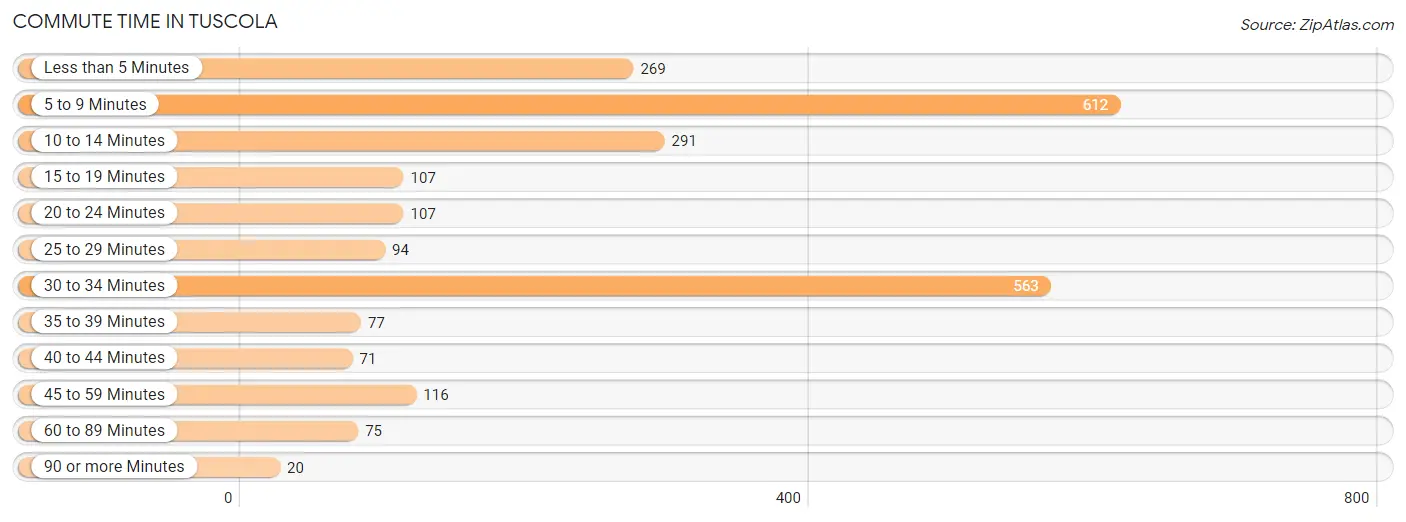
Commute Time in Tuscola
The most frequently occuring commute durations in Tuscola are 5 to 9 minutes (612 commuters, 25.5%), 30 to 34 minutes (563 commuters, 23.4%), and 10 to 14 minutes (291 commuters, 12.1%).
| Commute Time | # Commuters | % Commuters |
| Less than 5 Minutes | 269 | 11.2% |
| 5 to 9 Minutes | 612 | 25.5% |
| 10 to 14 Minutes | 291 | 12.1% |
| 15 to 19 Minutes | 107 | 4.4% |
| 20 to 24 Minutes | 107 | 4.4% |
| 25 to 29 Minutes | 94 | 3.9% |
| 30 to 34 Minutes | 563 | 23.4% |
| 35 to 39 Minutes | 77 | 3.2% |
| 40 to 44 Minutes | 71 | 3.0% |
| 45 to 59 Minutes | 116 | 4.8% |
| 60 to 89 Minutes | 75 | 3.1% |
| 90 or more Minutes | 20 | 0.8% |
Commute Time by Sex in Tuscola
The most common commute times in Tuscola are 5 to 9 minutes (397 commuters, 28.7%) for males and 30 to 34 minutes (274 commuters, 26.9%) for females.
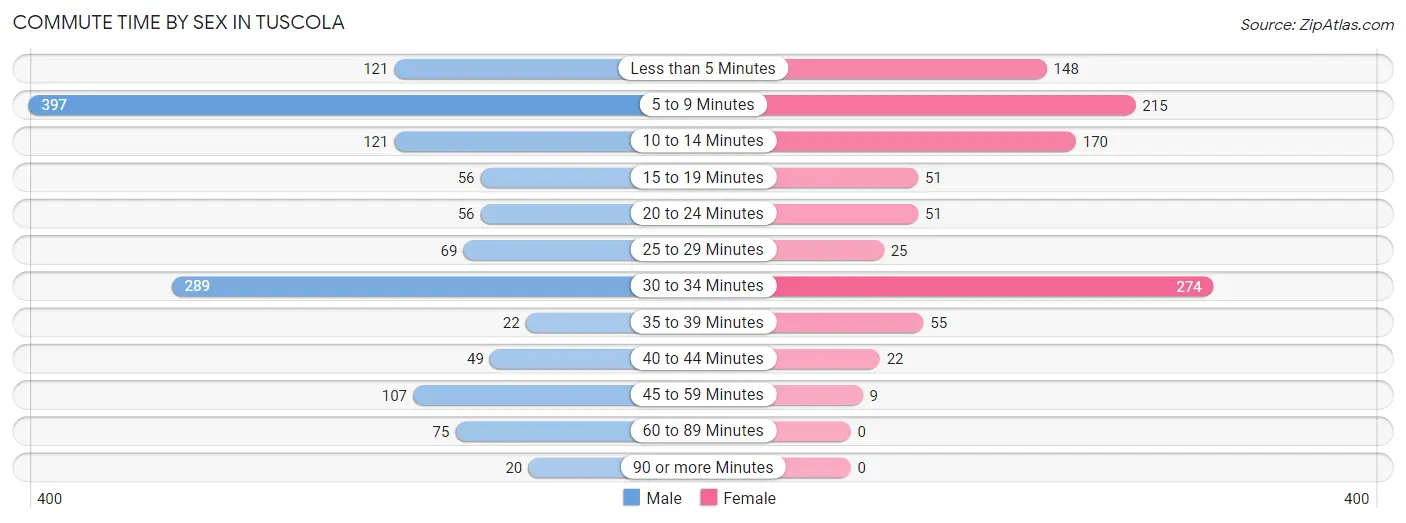
| Commute Time | Male | Female |
| Less than 5 Minutes | 121 (8.8%) | 148 (14.5%) |
| 5 to 9 Minutes | 397 (28.7%) | 215 (21.1%) |
| 10 to 14 Minutes | 121 (8.8%) | 170 (16.7%) |
| 15 to 19 Minutes | 56 (4.1%) | 51 (5.0%) |
| 20 to 24 Minutes | 56 (4.1%) | 51 (5.0%) |
| 25 to 29 Minutes | 69 (5.0%) | 25 (2.5%) |
| 30 to 34 Minutes | 289 (20.9%) | 274 (26.9%) |
| 35 to 39 Minutes | 22 (1.6%) | 55 (5.4%) |
| 40 to 44 Minutes | 49 (3.5%) | 22 (2.2%) |
| 45 to 59 Minutes | 107 (7.7%) | 9 (0.9%) |
| 60 to 89 Minutes | 75 (5.4%) | 0 (0.0%) |
| 90 or more Minutes | 20 (1.5%) | 0 (0.0%) |
Time of Departure to Work by Sex in Tuscola
The most frequent times of departure to work in Tuscola are 6:30 AM to 6:59 AM (264, 19.1%) for males and 7:30 AM to 7:59 AM (293, 28.7%) for females.
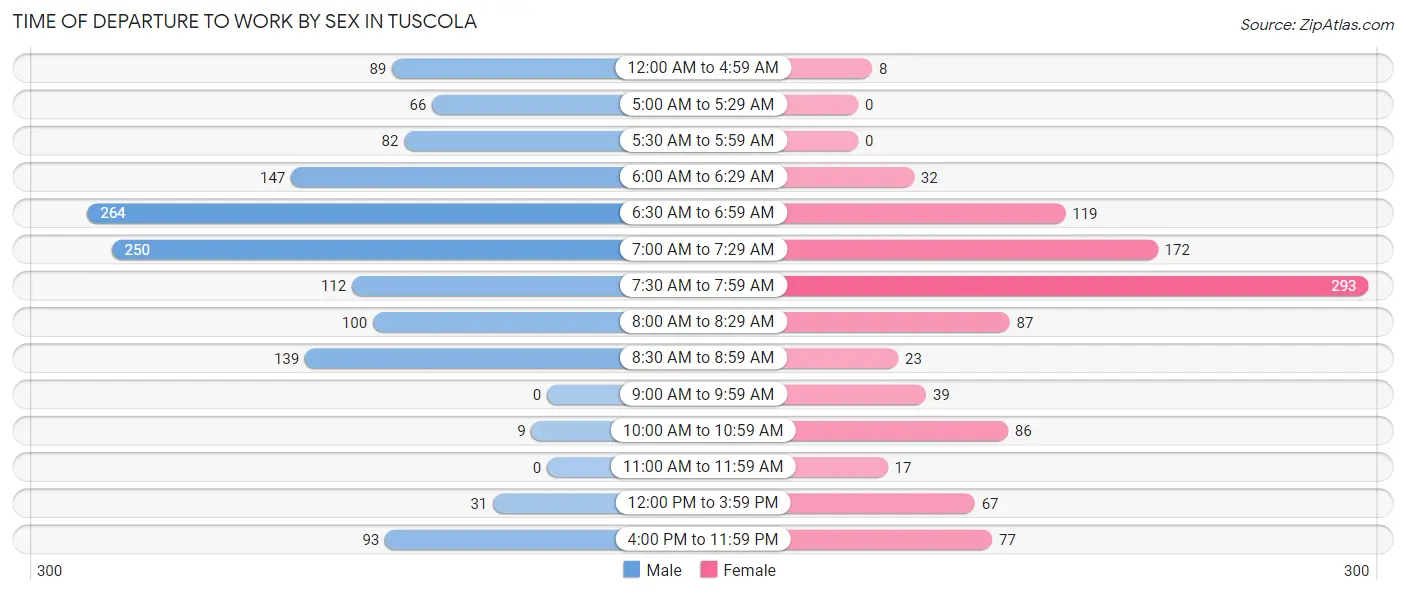
| Time of Departure | Male | Female |
| 12:00 AM to 4:59 AM | 89 (6.4%) | 8 (0.8%) |
| 5:00 AM to 5:29 AM | 66 (4.8%) | 0 (0.0%) |
| 5:30 AM to 5:59 AM | 82 (5.9%) | 0 (0.0%) |
| 6:00 AM to 6:29 AM | 147 (10.6%) | 32 (3.1%) |
| 6:30 AM to 6:59 AM | 264 (19.1%) | 119 (11.7%) |
| 7:00 AM to 7:29 AM | 250 (18.1%) | 172 (16.9%) |
| 7:30 AM to 7:59 AM | 112 (8.1%) | 293 (28.7%) |
| 8:00 AM to 8:29 AM | 100 (7.2%) | 87 (8.5%) |
| 8:30 AM to 8:59 AM | 139 (10.1%) | 23 (2.2%) |
| 9:00 AM to 9:59 AM | 0 (0.0%) | 39 (3.8%) |
| 10:00 AM to 10:59 AM | 9 (0.6%) | 86 (8.4%) |
| 11:00 AM to 11:59 AM | 0 (0.0%) | 17 (1.7%) |
| 12:00 PM to 3:59 PM | 31 (2.2%) | 67 (6.6%) |
| 4:00 PM to 11:59 PM | 93 (6.7%) | 77 (7.5%) |
| Total | 1,382 (100.0%) | 1,020 (100.0%) |
Housing Occupancy in Tuscola
Occupancy by Ownership in Tuscola
Of the total 2,045 dwellings in Tuscola, owner-occupied units account for 1,507 (73.7%), while renter-occupied units make up 538 (26.3%).
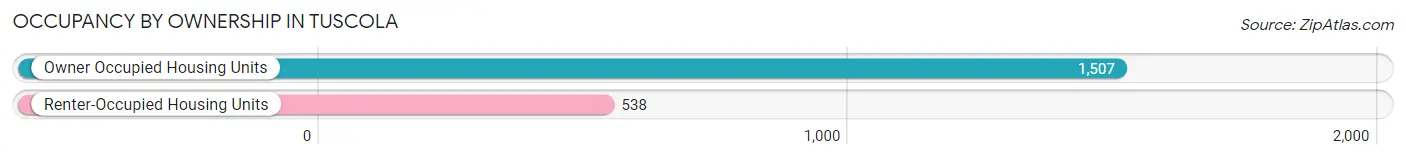
| Occupancy | # Housing Units | % Housing Units |
| Owner Occupied Housing Units | 1,507 | 73.7% |
| Renter-Occupied Housing Units | 538 | 26.3% |
| Total Occupied Housing Units | 2,045 | 100.0% |
Occupancy by Household Size in Tuscola
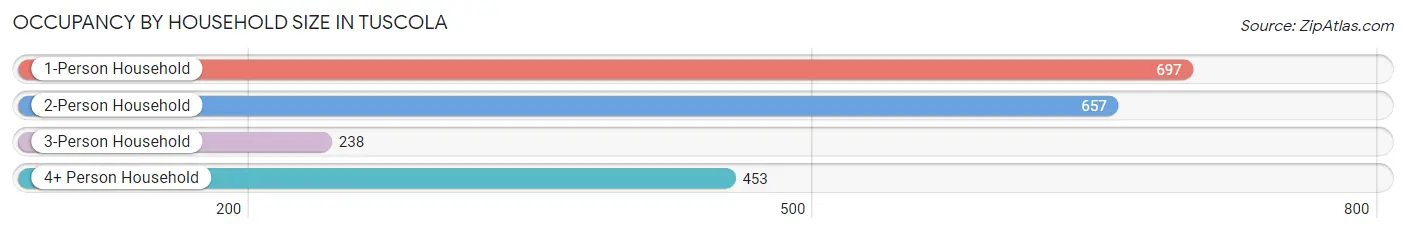
| Household Size | # Housing Units | % Housing Units |
| 1-Person Household | 697 | 34.1% |
| 2-Person Household | 657 | 32.1% |
| 3-Person Household | 238 | 11.6% |
| 4+ Person Household | 453 | 22.2% |
| Total Housing Units | 2,045 | 100.0% |
Occupancy by Ownership by Household Size in Tuscola
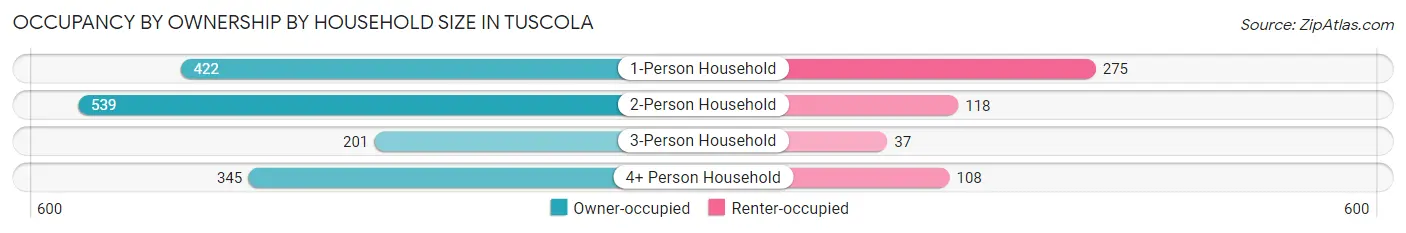
| Household Size | Owner-occupied | Renter-occupied |
| 1-Person Household | 422 (60.6%) | 275 (39.5%) |
| 2-Person Household | 539 (82.0%) | 118 (18.0%) |
| 3-Person Household | 201 (84.5%) | 37 (15.5%) |
| 4+ Person Household | 345 (76.2%) | 108 (23.8%) |
| Total Housing Units | 1,507 (73.7%) | 538 (26.3%) |
Occupancy by Educational Attainment in Tuscola
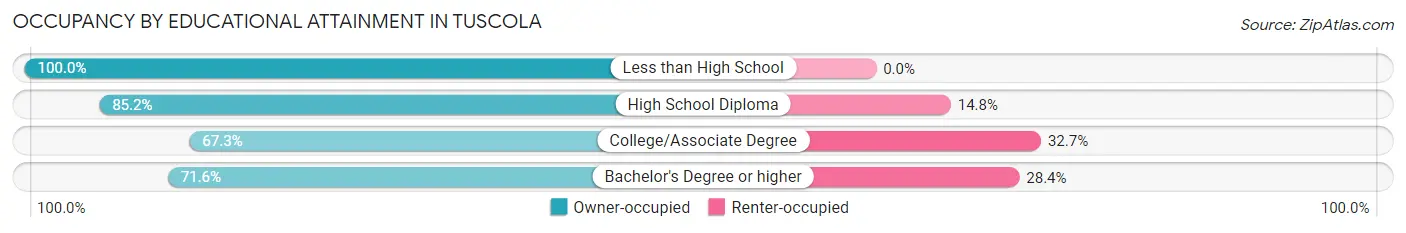
| Household Size | Owner-occupied | Renter-occupied |
| Less than High School | 24 (100.0%) | 0 (0.0%) |
| High School Diploma | 472 (85.2%) | 82 (14.8%) |
| College/Associate Degree | 620 (67.3%) | 301 (32.7%) |
| Bachelor's Degree or higher | 391 (71.6%) | 155 (28.4%) |
Occupancy by Age of Householder in Tuscola
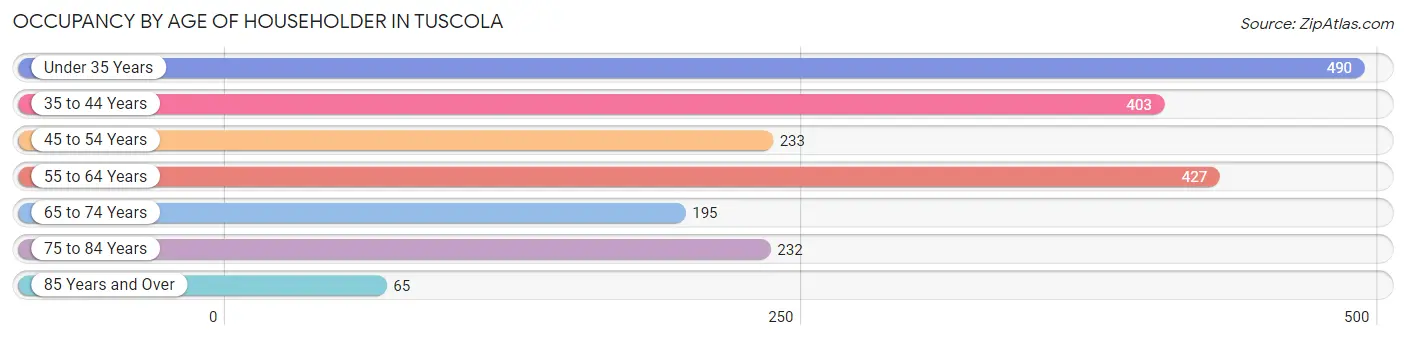
| Age Bracket | # Households | % Households |
| Under 35 Years | 490 | 24.0% |
| 35 to 44 Years | 403 | 19.7% |
| 45 to 54 Years | 233 | 11.4% |
| 55 to 64 Years | 427 | 20.9% |
| 65 to 74 Years | 195 | 9.5% |
| 75 to 84 Years | 232 | 11.3% |
| 85 Years and Over | 65 | 3.2% |
| Total | 2,045 | 100.0% |
Housing Finances in Tuscola
Median Income by Occupancy in Tuscola
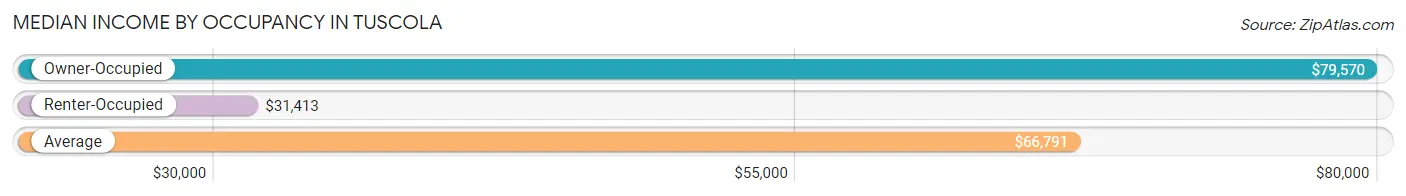
| Occupancy Type | # Households | Median Income |
| Owner-Occupied | 1,507 (73.7%) | $79,570 |
| Renter-Occupied | 538 (26.3%) | $31,413 |
| Average | 2,045 (100.0%) | $66,791 |
Occupancy by Householder Income Bracket in Tuscola
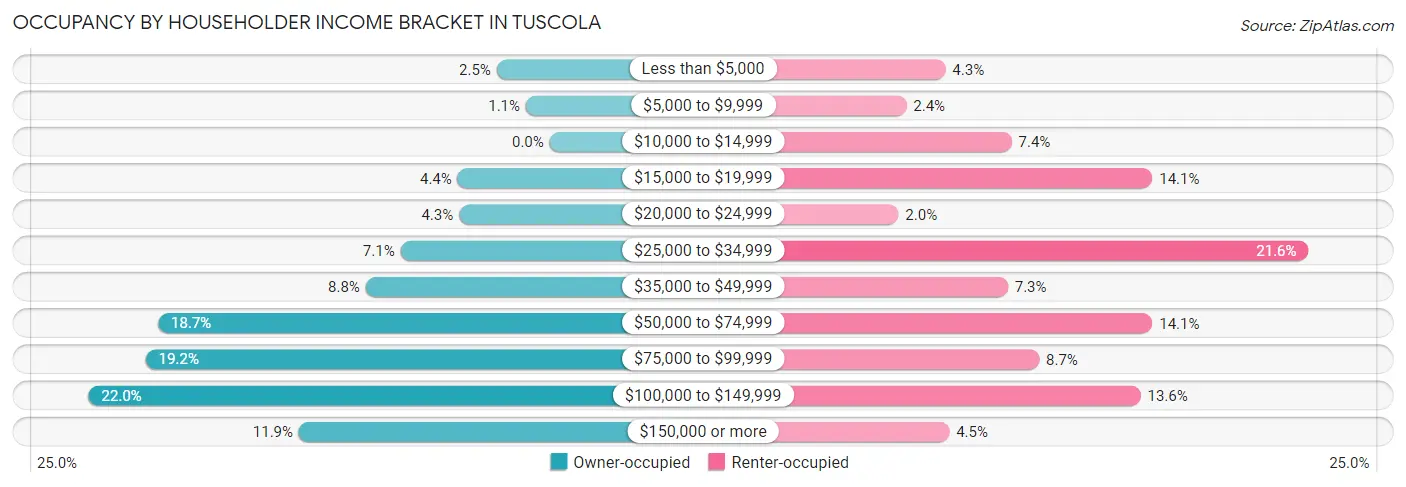
| Income Bracket | Owner-occupied | Renter-occupied |
| Less than $5,000 | 38 (2.5%) | 23 (4.3%) |
| $5,000 to $9,999 | 17 (1.1%) | 13 (2.4%) |
| $10,000 to $14,999 | 0 (0.0%) | 40 (7.4%) |
| $15,000 to $19,999 | 66 (4.4%) | 76 (14.1%) |
| $20,000 to $24,999 | 65 (4.3%) | 11 (2.0%) |
| $25,000 to $34,999 | 107 (7.1%) | 116 (21.6%) |
| $35,000 to $49,999 | 132 (8.8%) | 39 (7.2%) |
| $50,000 to $74,999 | 281 (18.6%) | 76 (14.1%) |
| $75,000 to $99,999 | 290 (19.2%) | 47 (8.7%) |
| $100,000 to $149,999 | 331 (22.0%) | 73 (13.6%) |
| $150,000 or more | 180 (11.9%) | 24 (4.5%) |
| Total | 1,507 (100.0%) | 538 (100.0%) |
Monthly Housing Cost Tiers in Tuscola
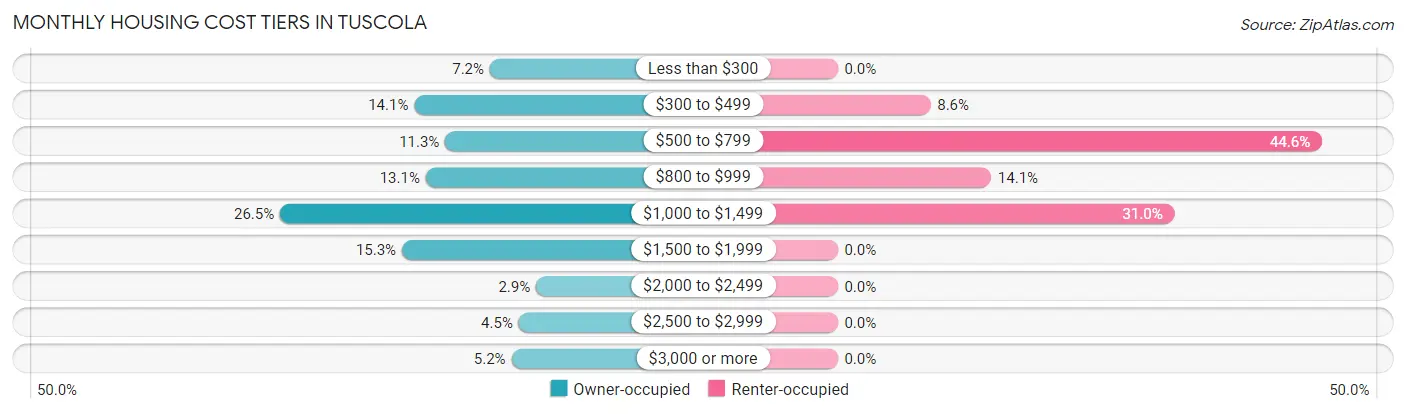
| Monthly Cost | Owner-occupied | Renter-occupied |
| Less than $300 | 108 (7.2%) | 0 (0.0%) |
| $300 to $499 | 213 (14.1%) | 46 (8.6%) |
| $500 to $799 | 170 (11.3%) | 240 (44.6%) |
| $800 to $999 | 197 (13.1%) | 76 (14.1%) |
| $1,000 to $1,499 | 399 (26.5%) | 167 (31.0%) |
| $1,500 to $1,999 | 230 (15.3%) | 0 (0.0%) |
| $2,000 to $2,499 | 44 (2.9%) | 0 (0.0%) |
| $2,500 to $2,999 | 68 (4.5%) | 0 (0.0%) |
| $3,000 or more | 78 (5.2%) | 0 (0.0%) |
| Total | 1,507 (100.0%) | 538 (100.0%) |
Physical Housing Characteristics in Tuscola
Housing Structures in Tuscola
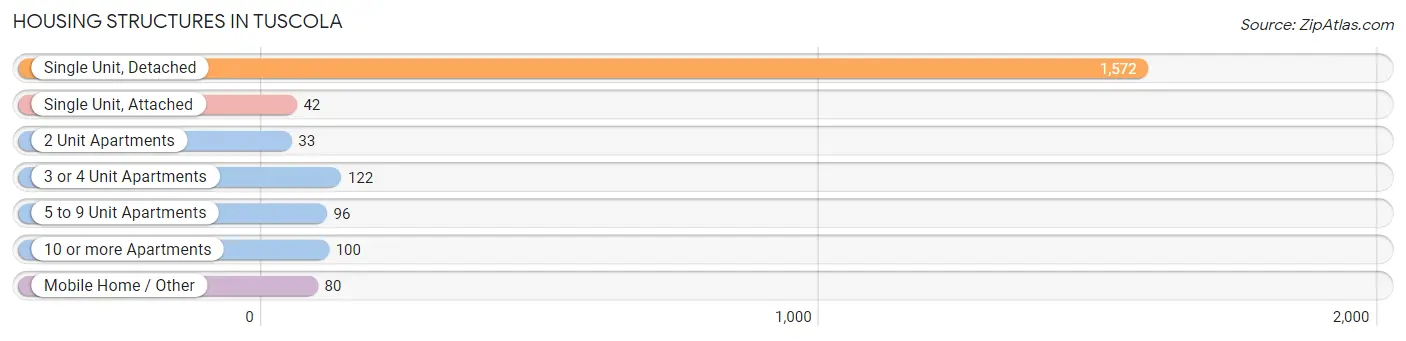
| Structure Type | # Housing Units | % Housing Units |
| Single Unit, Detached | 1,572 | 76.9% |
| Single Unit, Attached | 42 | 2.1% |
| 2 Unit Apartments | 33 | 1.6% |
| 3 or 4 Unit Apartments | 122 | 6.0% |
| 5 to 9 Unit Apartments | 96 | 4.7% |
| 10 or more Apartments | 100 | 4.9% |
| Mobile Home / Other | 80 | 3.9% |
| Total | 2,045 | 100.0% |
Housing Structures by Occupancy in Tuscola
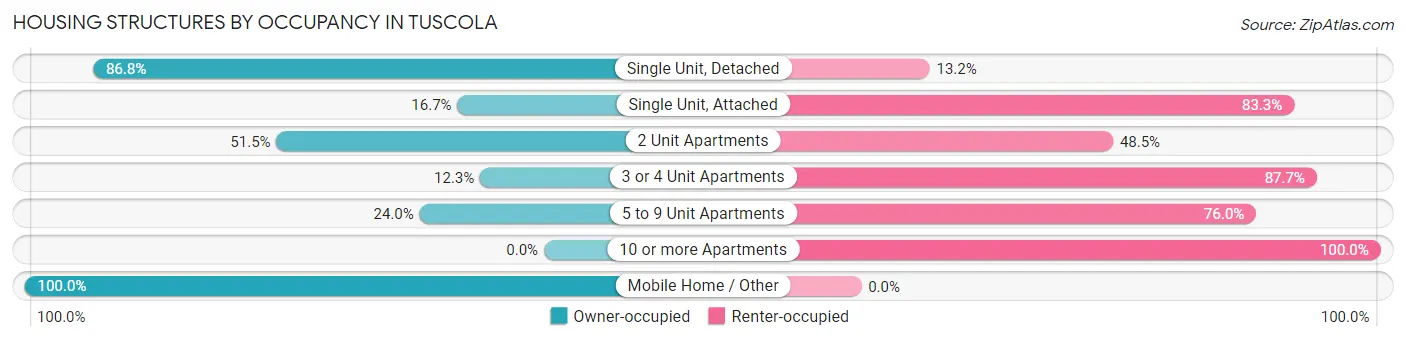
| Structure Type | Owner-occupied | Renter-occupied |
| Single Unit, Detached | 1,365 (86.8%) | 207 (13.2%) |
| Single Unit, Attached | 7 (16.7%) | 35 (83.3%) |
| 2 Unit Apartments | 17 (51.5%) | 16 (48.5%) |
| 3 or 4 Unit Apartments | 15 (12.3%) | 107 (87.7%) |
| 5 to 9 Unit Apartments | 23 (24.0%) | 73 (76.0%) |
| 10 or more Apartments | 0 (0.0%) | 100 (100.0%) |
| Mobile Home / Other | 80 (100.0%) | 0 (0.0%) |
| Total | 1,507 (73.7%) | 538 (26.3%) |
Housing Structures by Number of Rooms in Tuscola
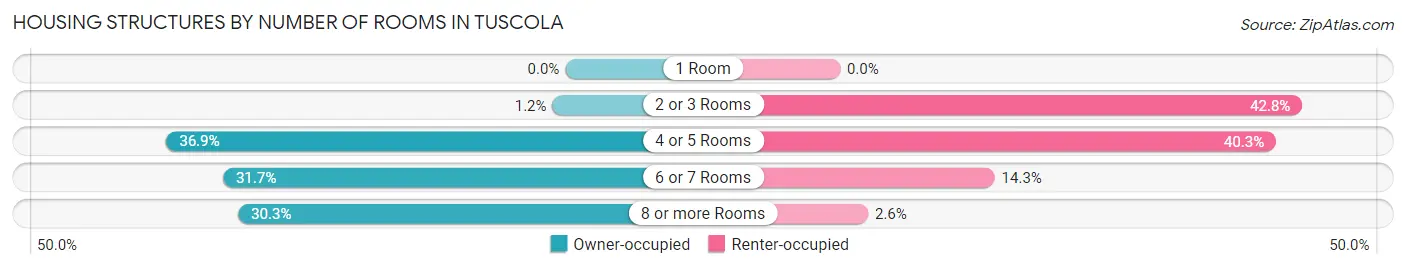
| Number of Rooms | Owner-occupied | Renter-occupied |
| 1 Room | 0 (0.0%) | 0 (0.0%) |
| 2 or 3 Rooms | 18 (1.2%) | 230 (42.7%) |
| 4 or 5 Rooms | 556 (36.9%) | 217 (40.3%) |
| 6 or 7 Rooms | 477 (31.7%) | 77 (14.3%) |
| 8 or more Rooms | 456 (30.3%) | 14 (2.6%) |
| Total | 1,507 (100.0%) | 538 (100.0%) |
Housing Structure by Heating Type in Tuscola
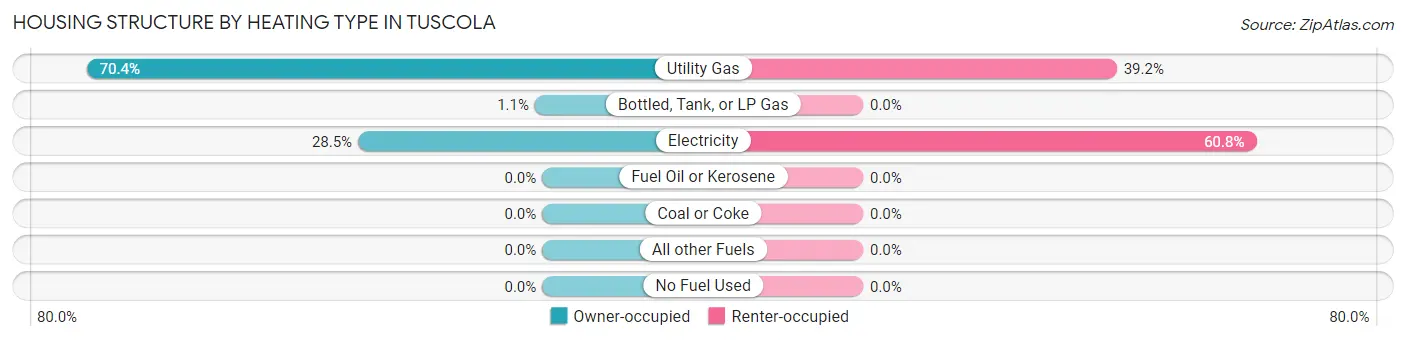
| Heating Type | Owner-occupied | Renter-occupied |
| Utility Gas | 1,061 (70.4%) | 211 (39.2%) |
| Bottled, Tank, or LP Gas | 17 (1.1%) | 0 (0.0%) |
| Electricity | 429 (28.5%) | 327 (60.8%) |
| Fuel Oil or Kerosene | 0 (0.0%) | 0 (0.0%) |
| Coal or Coke | 0 (0.0%) | 0 (0.0%) |
| All other Fuels | 0 (0.0%) | 0 (0.0%) |
| No Fuel Used | 0 (0.0%) | 0 (0.0%) |
| Total | 1,507 (100.0%) | 538 (100.0%) |
Household Vehicle Usage in Tuscola
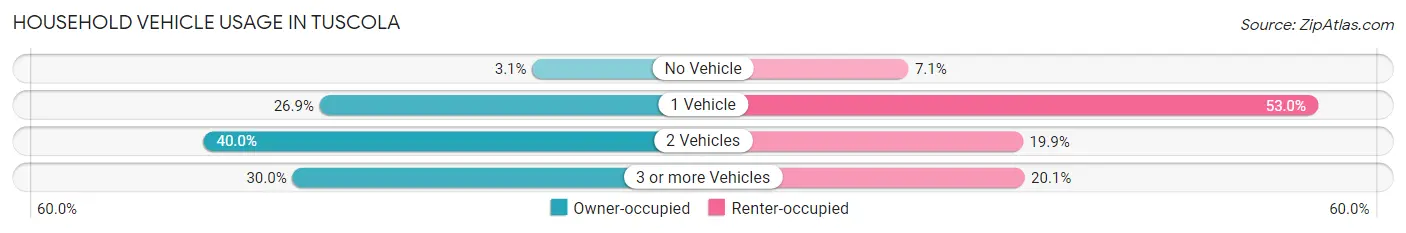
| Vehicles per Household | Owner-occupied | Renter-occupied |
| No Vehicle | 47 (3.1%) | 38 (7.1%) |
| 1 Vehicle | 406 (26.9%) | 285 (53.0%) |
| 2 Vehicles | 602 (40.0%) | 107 (19.9%) |
| 3 or more Vehicles | 452 (30.0%) | 108 (20.1%) |
| Total | 1,507 (100.0%) | 538 (100.0%) |
Real Estate & Mortgages in Tuscola
Real Estate and Mortgage Overview in Tuscola
| Characteristic | Without Mortgage | With Mortgage |
| Housing Units | 527 | 980 |
| Median Property Value | $101,800 | $160,300 |
| Median Household Income | $39,402 | $161 |
| Monthly Housing Costs | $443 | $78 |
| Real Estate Taxes | $1,660 | $61 |
Property Value by Mortgage Status in Tuscola
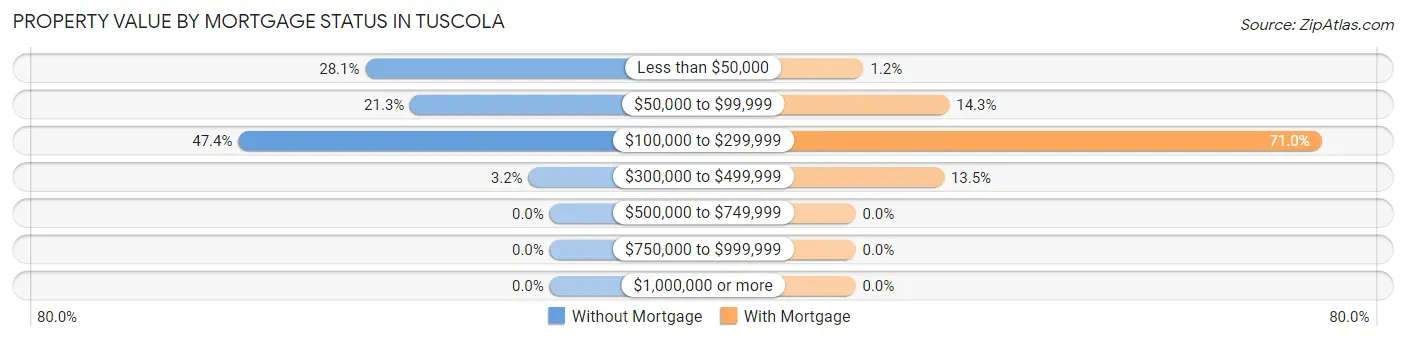
| Property Value | Without Mortgage | With Mortgage |
| Less than $50,000 | 148 (28.1%) | 12 (1.2%) |
| $50,000 to $99,999 | 112 (21.2%) | 140 (14.3%) |
| $100,000 to $299,999 | 250 (47.4%) | 696 (71.0%) |
| $300,000 to $499,999 | 17 (3.2%) | 132 (13.5%) |
| $500,000 to $749,999 | 0 (0.0%) | 0 (0.0%) |
| $750,000 to $999,999 | 0 (0.0%) | 0 (0.0%) |
| $1,000,000 or more | 0 (0.0%) | 0 (0.0%) |
| Total | 527 (100.0%) | 980 (100.0%) |
Household Income by Mortgage Status in Tuscola
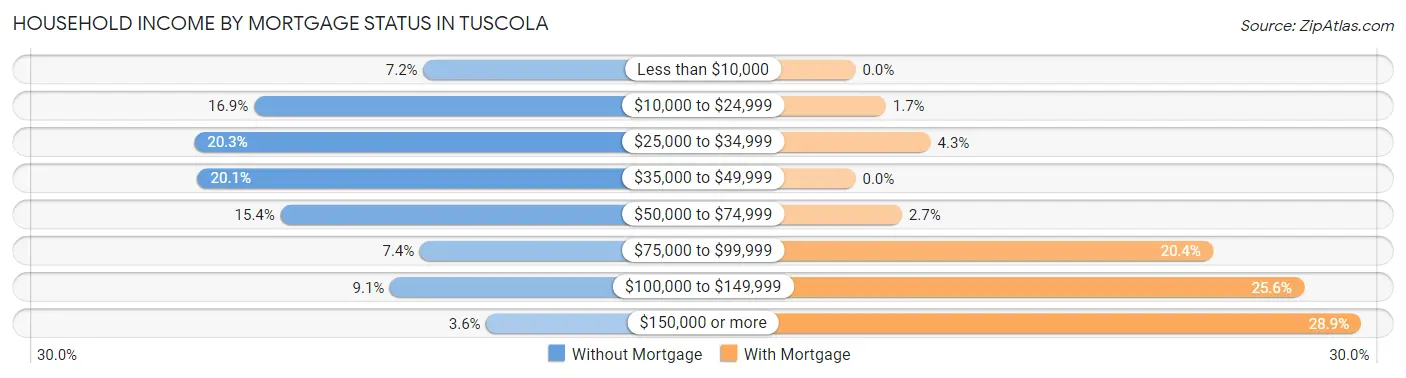
| Household Income | Without Mortgage | With Mortgage |
| Less than $10,000 | 38 (7.2%) | 0 (0.0%) |
| $10,000 to $24,999 | 89 (16.9%) | 17 (1.7%) |
| $25,000 to $34,999 | 107 (20.3%) | 42 (4.3%) |
| $35,000 to $49,999 | 106 (20.1%) | 0 (0.0%) |
| $50,000 to $74,999 | 81 (15.4%) | 26 (2.6%) |
| $75,000 to $99,999 | 39 (7.4%) | 200 (20.4%) |
| $100,000 to $149,999 | 48 (9.1%) | 251 (25.6%) |
| $150,000 or more | 19 (3.6%) | 283 (28.9%) |
| Total | 527 (100.0%) | 980 (100.0%) |
Property Value to Household Income Ratio in Tuscola
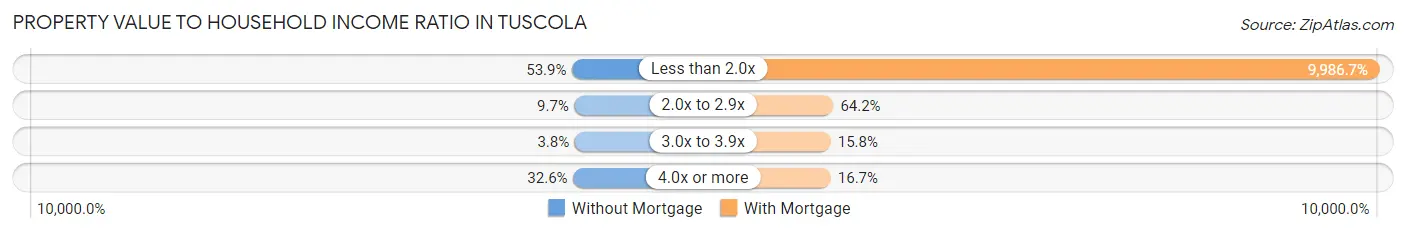
| Value-to-Income Ratio | Without Mortgage | With Mortgage |
| Less than 2.0x | 284 (53.9%) | 97,870 (9,986.7%) |
| 2.0x to 2.9x | 51 (9.7%) | 629 (64.2%) |
| 3.0x to 3.9x | 20 (3.8%) | 155 (15.8%) |
| 4.0x or more | 172 (32.6%) | 164 (16.7%) |
| Total | 527 (100.0%) | 980 (100.0%) |
Real Estate Taxes by Mortgage Status in Tuscola
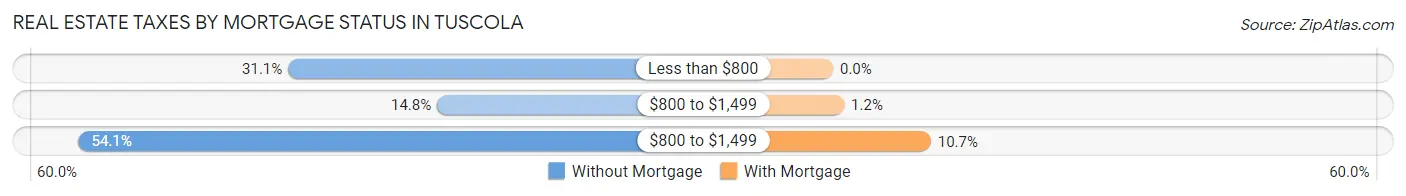
| Property Taxes | Without Mortgage | With Mortgage |
| Less than $800 | 164 (31.1%) | 0 (0.0%) |
| $800 to $1,499 | 78 (14.8%) | 12 (1.2%) |
| $800 to $1,499 | 285 (54.1%) | 105 (10.7%) |
| Total | 527 (100.0%) | 980 (100.0%) |
Health & Disability in Tuscola
Health Insurance Coverage by Age in Tuscola
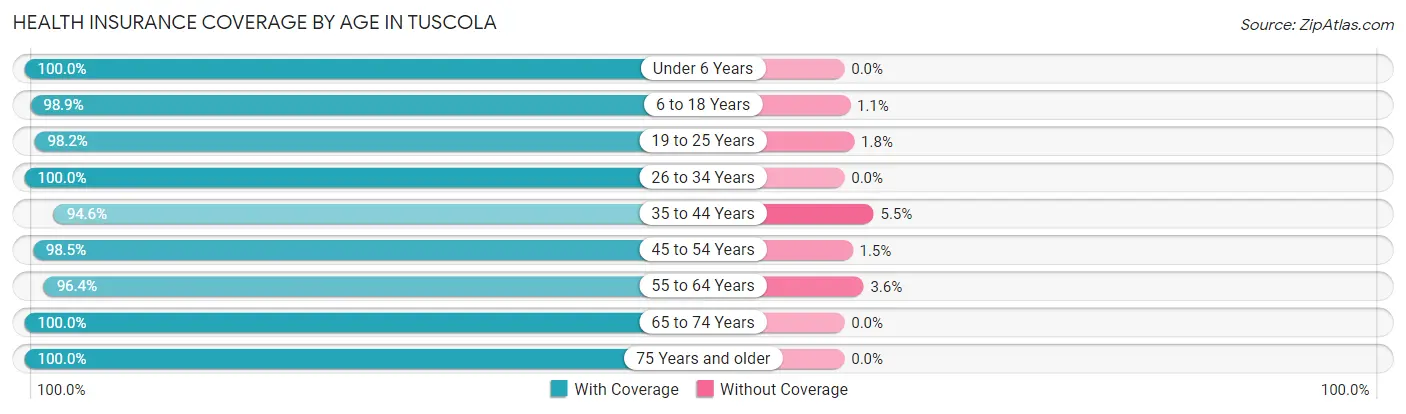
| Age Bracket | With Coverage | Without Coverage |
| Under 6 Years | 446 (100.0%) | 0 (0.0%) |
| 6 to 18 Years | 646 (98.9%) | 7 (1.1%) |
| 19 to 25 Years | 427 (98.2%) | 8 (1.8%) |
| 26 to 34 Years | 615 (100.0%) | 0 (0.0%) |
| 35 to 44 Years | 590 (94.6%) | 34 (5.4%) |
| 45 to 54 Years | 578 (98.5%) | 9 (1.5%) |
| 55 to 64 Years | 592 (96.4%) | 22 (3.6%) |
| 65 to 74 Years | 312 (100.0%) | 0 (0.0%) |
| 75 Years and older | 361 (100.0%) | 0 (0.0%) |
| Total | 4,567 (98.3%) | 80 (1.7%) |
Health Insurance Coverage by Citizenship Status in Tuscola
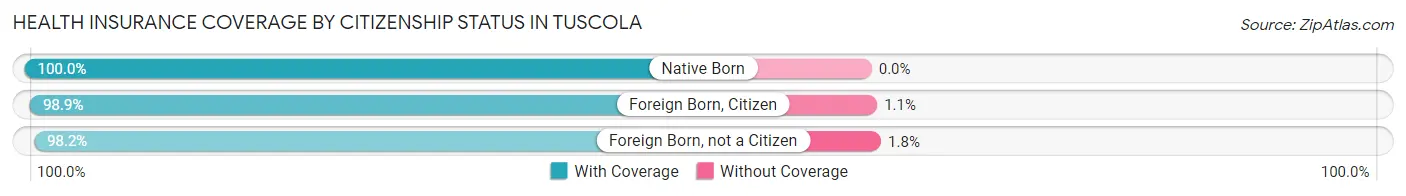
| Citizenship Status | With Coverage | Without Coverage |
| Native Born | 446 (100.0%) | 0 (0.0%) |
| Foreign Born, Citizen | 646 (98.9%) | 7 (1.1%) |
| Foreign Born, not a Citizen | 427 (98.2%) | 8 (1.8%) |
Health Insurance Coverage by Household Income in Tuscola
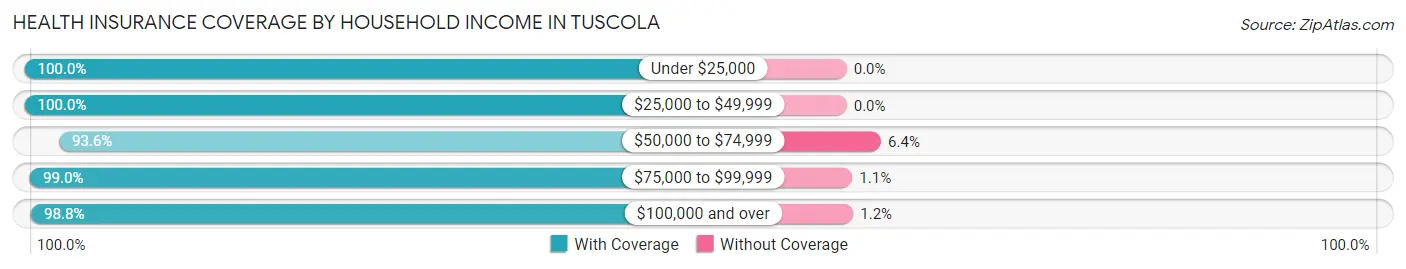
| Household Income | With Coverage | Without Coverage |
| Under $25,000 | 651 (100.0%) | 0 (0.0%) |
| $25,000 to $49,999 | 592 (100.0%) | 0 (0.0%) |
| $50,000 to $74,999 | 712 (93.6%) | 49 (6.4%) |
| $75,000 to $99,999 | 851 (99.0%) | 9 (1.1%) |
| $100,000 and over | 1,761 (98.8%) | 22 (1.2%) |
Public vs Private Health Insurance Coverage by Age in Tuscola
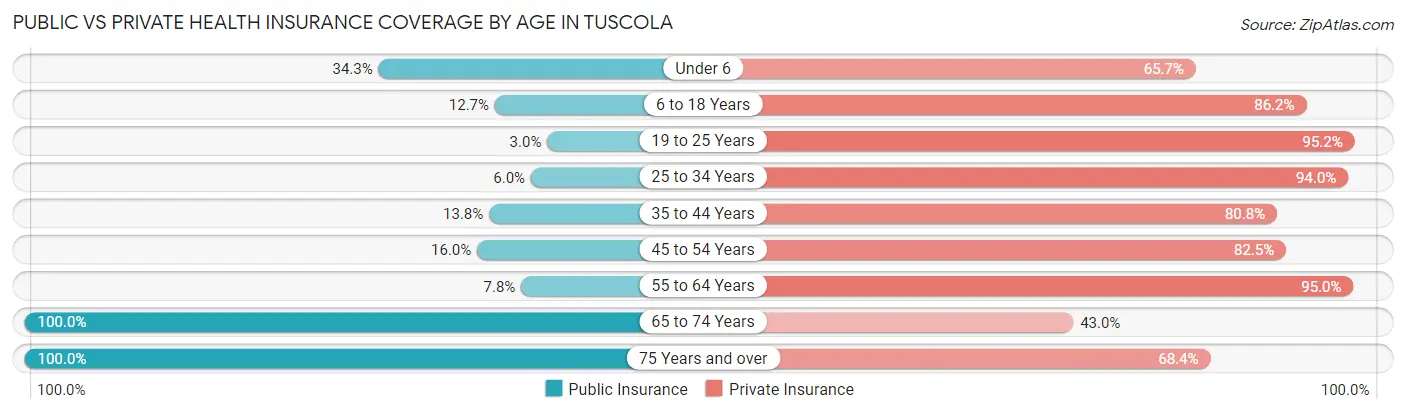
| Age Bracket | Public Insurance | Private Insurance |
| Under 6 | 153 (34.3%) | 293 (65.7%) |
| 6 to 18 Years | 83 (12.7%) | 563 (86.2%) |
| 19 to 25 Years | 13 (3.0%) | 414 (95.2%) |
| 25 to 34 Years | 37 (6.0%) | 578 (94.0%) |
| 35 to 44 Years | 86 (13.8%) | 504 (80.8%) |
| 45 to 54 Years | 94 (16.0%) | 484 (82.5%) |
| 55 to 64 Years | 48 (7.8%) | 583 (95.0%) |
| 65 to 74 Years | 312 (100.0%) | 134 (42.9%) |
| 75 Years and over | 361 (100.0%) | 247 (68.4%) |
| Total | 1,187 (25.5%) | 3,800 (81.8%) |
Disability Status by Sex by Age in Tuscola
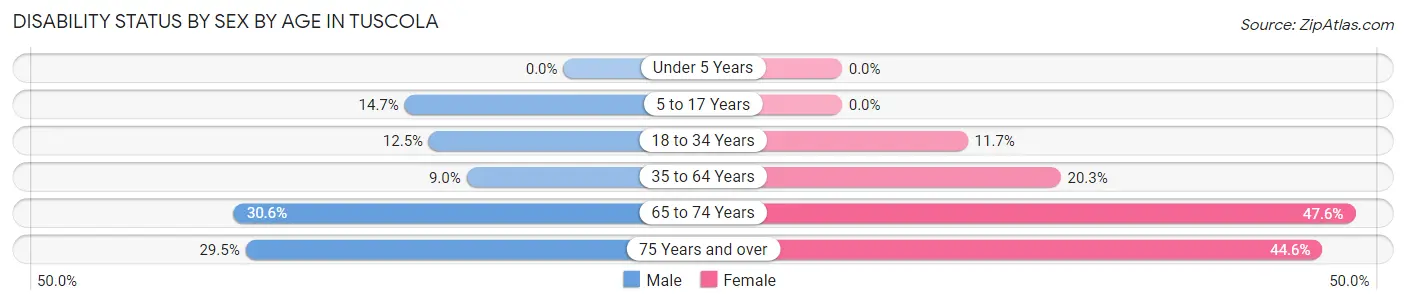
| Age Bracket | Male | Female |
| Under 5 Years | 0 (0.0%) | 0 (0.0%) |
| 5 to 17 Years | 52 (14.7%) | 0 (0.0%) |
| 18 to 34 Years | 77 (12.5%) | 57 (11.7%) |
| 35 to 64 Years | 86 (9.0%) | 176 (20.3%) |
| 65 to 74 Years | 37 (30.6%) | 91 (47.6%) |
| 75 Years and over | 41 (29.5%) | 99 (44.6%) |
Disability Class by Sex by Age in Tuscola
Disability Class: Hearing Difficulty
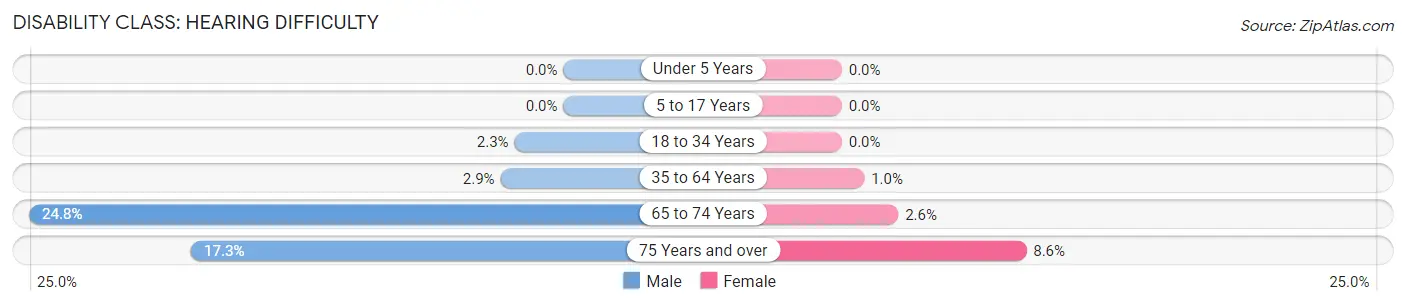
| Age Bracket | Male | Female |
| Under 5 Years | 0 (0.0%) | 0 (0.0%) |
| 5 to 17 Years | 0 (0.0%) | 0 (0.0%) |
| 18 to 34 Years | 14 (2.3%) | 0 (0.0%) |
| 35 to 64 Years | 28 (2.9%) | 9 (1.0%) |
| 65 to 74 Years | 30 (24.8%) | 5 (2.6%) |
| 75 Years and over | 24 (17.3%) | 19 (8.6%) |
Disability Class: Vision Difficulty
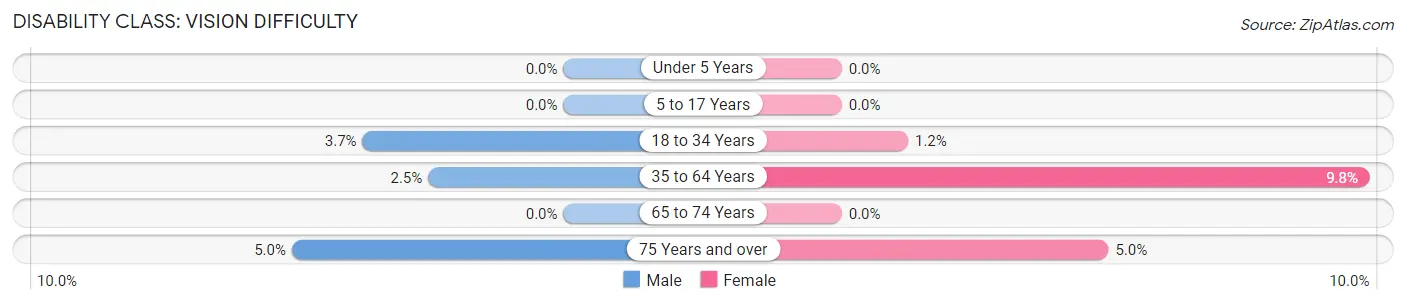
| Age Bracket | Male | Female |
| Under 5 Years | 0 (0.0%) | 0 (0.0%) |
| 5 to 17 Years | 0 (0.0%) | 0 (0.0%) |
| 18 to 34 Years | 23 (3.7%) | 6 (1.2%) |
| 35 to 64 Years | 24 (2.5%) | 85 (9.8%) |
| 65 to 74 Years | 0 (0.0%) | 0 (0.0%) |
| 75 Years and over | 7 (5.0%) | 11 (5.0%) |
Disability Class: Cognitive Difficulty
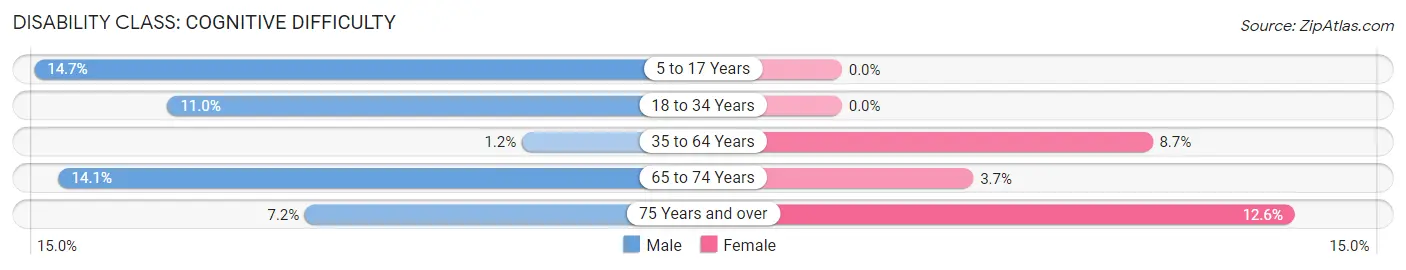
| Age Bracket | Male | Female |
| 5 to 17 Years | 52 (14.7%) | 0 (0.0%) |
| 18 to 34 Years | 68 (11.0%) | 0 (0.0%) |
| 35 to 64 Years | 11 (1.1%) | 75 (8.6%) |
| 65 to 74 Years | 17 (14.1%) | 7 (3.7%) |
| 75 Years and over | 10 (7.2%) | 28 (12.6%) |
Disability Class: Ambulatory Difficulty
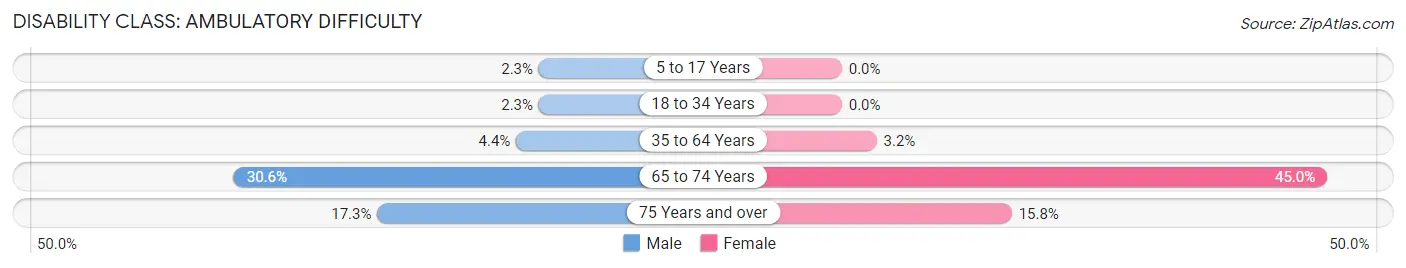
| Age Bracket | Male | Female |
| 5 to 17 Years | 8 (2.3%) | 0 (0.0%) |
| 18 to 34 Years | 14 (2.3%) | 0 (0.0%) |
| 35 to 64 Years | 42 (4.4%) | 28 (3.2%) |
| 65 to 74 Years | 37 (30.6%) | 86 (45.0%) |
| 75 Years and over | 24 (17.3%) | 35 (15.8%) |
Disability Class: Self-Care Difficulty
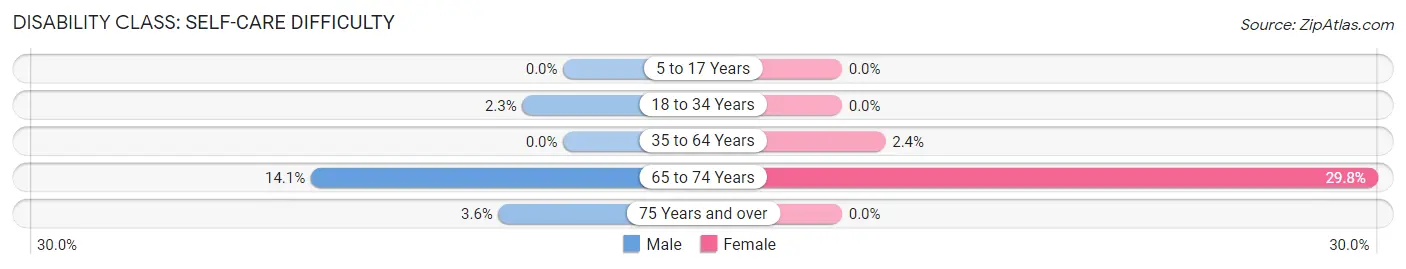
| Age Bracket | Male | Female |
| 5 to 17 Years | 0 (0.0%) | 0 (0.0%) |
| 18 to 34 Years | 14 (2.3%) | 0 (0.0%) |
| 35 to 64 Years | 0 (0.0%) | 21 (2.4%) |
| 65 to 74 Years | 17 (14.1%) | 57 (29.8%) |
| 75 Years and over | 5 (3.6%) | 0 (0.0%) |
Technology Access in Tuscola
Computing Device Access in Tuscola
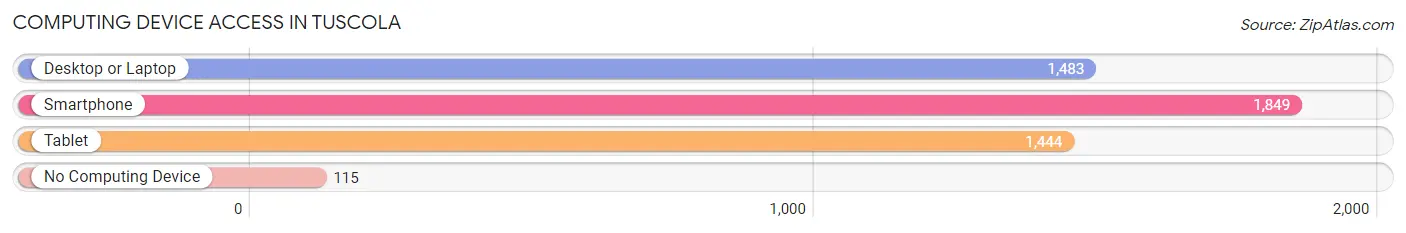
| Device Type | # Households | % Households |
| Desktop or Laptop | 1,483 | 72.5% |
| Smartphone | 1,849 | 90.4% |
| Tablet | 1,444 | 70.6% |
| No Computing Device | 115 | 5.6% |
| Total | 2,045 | 100.0% |
Internet Access in Tuscola
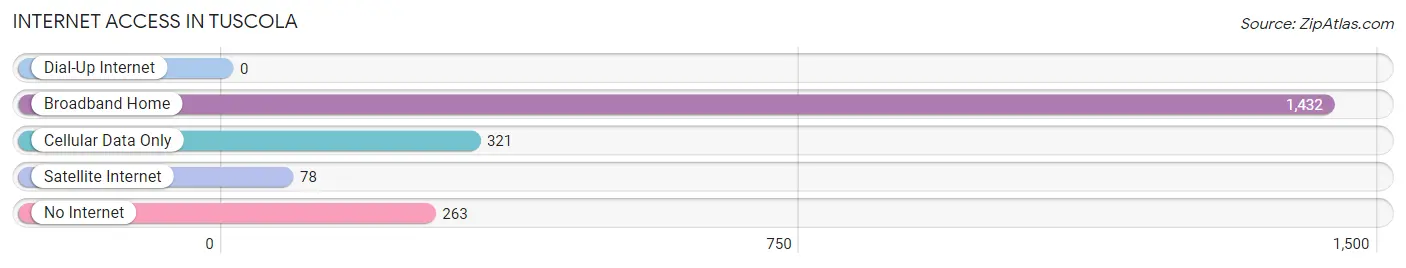
| Internet Type | # Households | % Households |
| Dial-Up Internet | 0 | 0.0% |
| Broadband Home | 1,432 | 70.0% |
| Cellular Data Only | 321 | 15.7% |
| Satellite Internet | 78 | 3.8% |
| No Internet | 263 | 12.9% |
| Total | 2,045 | 100.0% |
Tuscola Summary
Tuscola is a small city located in Douglas County, Illinois. It is situated in the east-central part of the state, about 25 miles south of Champaign and about 50 miles north of Decatur. The city has a population of 4,480 as of the 2010 census, making it the largest city in Douglas County.
History
Tuscola was founded in 1854 by a group of settlers from Tuscola County, Michigan. The city was named after the county in Michigan, which was in turn named after the Tuscola River. The first settlers were mostly farmers, and the city quickly grew to become an important agricultural center. The first post office was established in 1855, and the first school was built in 1856.
In 1872, the Chicago and Eastern Illinois Railroad was built through Tuscola, connecting it to the larger cities of Champaign and Decatur. This allowed the city to become an important shipping center for the surrounding area. The railroad also brought new businesses and industries to the city, including a flour mill, a brickyard, and a furniture factory.
Geography
Tuscola is located in east-central Illinois, about 25 miles south of Champaign and about 50 miles north of Decatur. The city is situated in the heart of the Douglas County, and is surrounded by rolling hills and farmland. The city is located at the intersection of two major highways, U.S. Route 45 and Illinois Route 49.
The climate in Tuscola is typical of the Midwest, with hot summers and cold winters. The average temperature in July is 81°F, and the average temperature in January is 24°F. The city receives an average of 40 inches of precipitation per year, with most of it falling in the spring and summer months.
Economy
Tuscola’s economy is largely based on agriculture and manufacturing. The city is home to several large farms, which produce corn, soybeans, and other crops. The city is also home to several manufacturing companies, including a furniture factory, a brickyard, and a flour mill.
The city is also home to several retail stores, restaurants, and other businesses. The city’s largest employer is the Tuscola Community Unit School District, which employs over 500 people.
Demographics
As of the 2010 census, Tuscola had a population of 4,480. The racial makeup of the city was 97.2% White, 0.7% African American, 0.3% Native American, 0.3% Asian, 0.2% from other races, and 1.5% from two or more races. Hispanic or Latino of any race were 1.2% of the population.
The median household income in Tuscola was $45,938, and the median family income was $54,844. The per capita income for the city was $20,945. About 11.2% of families and 14.2% of the population were below the poverty line, including 19.2% of those under age 18 and 8.2% of those age 65 or over.
Common Questions
What is Per Capita Income in Tuscola?
Per Capita income in Tuscola is $37,784.
What is the Median Family Income in Tuscola?
Median Family Income in Tuscola is $88,007.
What is the Median Household income in Tuscola?
Median Household Income in Tuscola is $66,791.
What is Income or Wage Gap in Tuscola?
Income or Wage Gap in Tuscola is 53.4%.
Women in Tuscola earn 46.6 cents for every dollar earned by a man.
What is Inequality or Gini Index in Tuscola?
Inequality or Gini Index in Tuscola is 0.44.
What is the Total Population of Tuscola?
Total Population of Tuscola is 4,707.
What is the Total Male Population of Tuscola?
Total Male Population of Tuscola is 2,372.
What is the Total Female Population of Tuscola?
Total Female Population of Tuscola is 2,335.
What is the Ratio of Males per 100 Females in Tuscola?
There are 101.58 Males per 100 Females in Tuscola.
What is the Ratio of Females per 100 Males in Tuscola?
There are 98.44 Females per 100 Males in Tuscola.
What is the Median Population Age in Tuscola?
Median Population Age in Tuscola is 37.6 Years.
What is the Average Family Size in Tuscola
Average Family Size in Tuscola is 2.8 People.
What is the Average Household Size in Tuscola
Average Household Size in Tuscola is 2.3 People.
How Large is the Labor Force in Tuscola?
There are 2,659 People in the Labor Forcein in Tuscola.
What is the Percentage of People in the Labor Force in Tuscola?
70.8% of People are in the Labor Force in Tuscola.
What is the Unemployment Rate in Tuscola?
Unemployment Rate in Tuscola is 2.1%.