Cities with the Most Immigrants from Northern Africa in Georgia
RELATED REPORTS & OPTIONS
Northern Africa
Georgia
Compare Cities
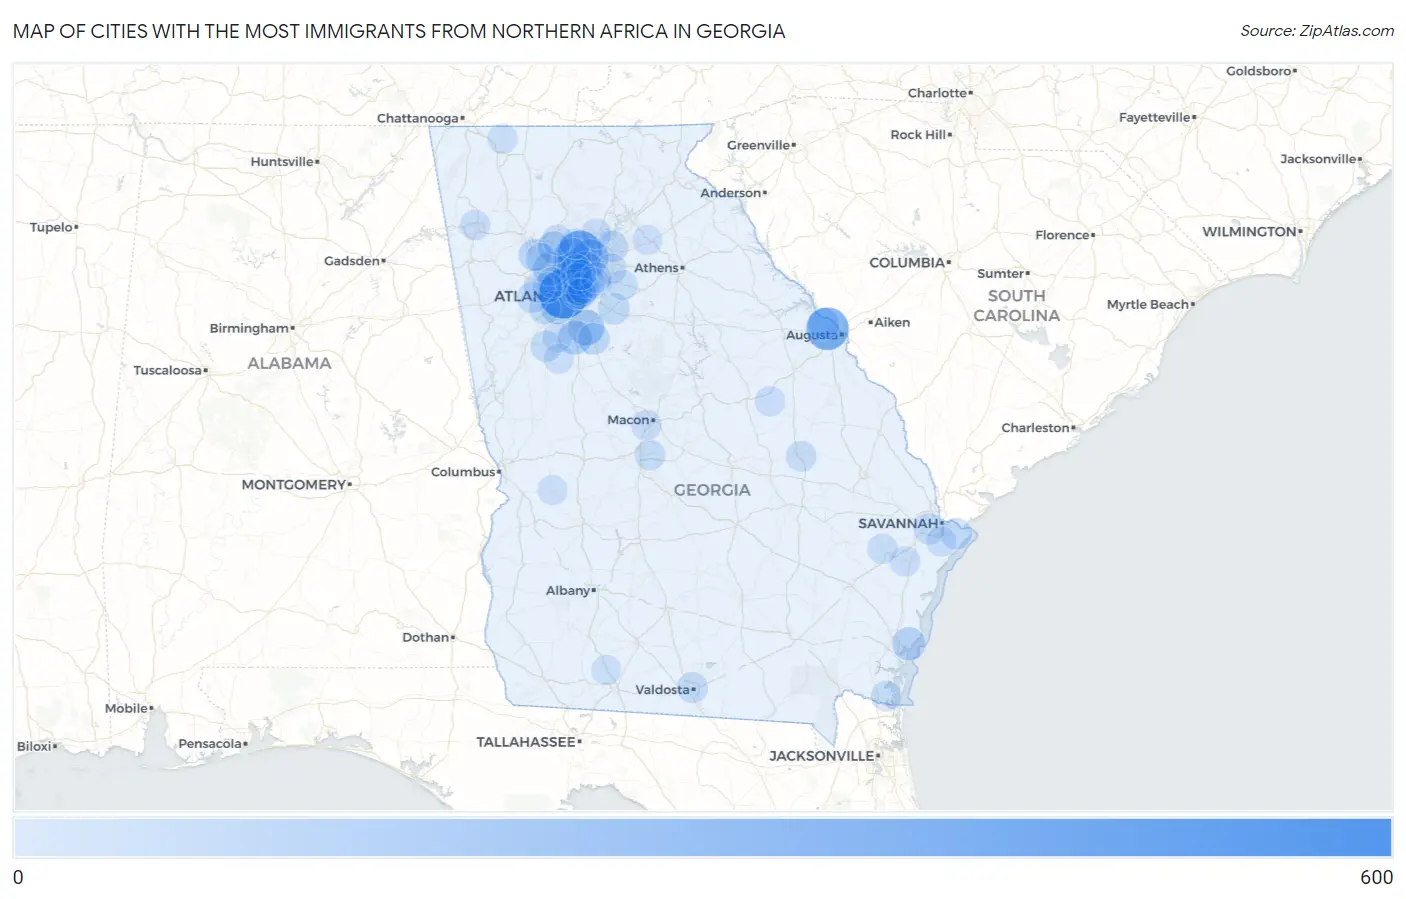
Map of Cities with the Most Immigrants from Northern Africa in Georgia
0
600
Cities with the Most Immigrants from Northern Africa in Georgia
| City | Northern Africa | vs State | vs National | |
| 1. | Atlanta | 533 | 6,834(7.80%)#1 | 421,832(0.13%)#110 |
| 2. | Alpharetta | 373 | 6,834(5.46%)#2 | 421,832(0.09%)#167 |
| 3. | Martinez | 337 | 6,834(4.93%)#3 | 421,832(0.08%)#197 |
| 4. | Athens-Clarke County Unified Government (Balance) | 233 | 6,834(3.41%)#4 | 421,832(0.06%)#301 |
| 5. | Brookhaven | 233 | 6,834(3.41%)#5 | 421,832(0.06%)#303 |
| 6. | Sandy Springs | 195 | 6,834(2.85%)#6 | 421,832(0.05%)#379 |
| 7. | Johns Creek | 180 | 6,834(2.63%)#7 | 421,832(0.04%)#414 |
| 8. | Roswell | 168 | 6,834(2.46%)#8 | 421,832(0.04%)#436 |
| 9. | Stockbridge | 153 | 6,834(2.24%)#9 | 421,832(0.04%)#479 |
| 10. | Lovejoy | 106 | 6,834(1.55%)#10 | 421,832(0.03%)#664 |
| 11. | North Druid Hills | 103 | 6,834(1.51%)#11 | 421,832(0.02%)#682 |
| 12. | Marietta | 94 | 6,834(1.38%)#12 | 421,832(0.02%)#731 |
| 13. | East Point | 86 | 6,834(1.26%)#13 | 421,832(0.02%)#774 |
| 14. | St Simons | 84 | 6,834(1.23%)#14 | 421,832(0.02%)#782 |
| 15. | Scottdale | 83 | 6,834(1.21%)#15 | 421,832(0.02%)#792 |
| 16. | North Decatur | 77 | 6,834(1.13%)#16 | 421,832(0.02%)#834 |
| 17. | Acworth | 65 | 6,834(0.95%)#17 | 421,832(0.02%)#953 |
| 18. | Woodstock | 55 | 6,834(0.80%)#18 | 421,832(0.01%)#1,060 |
| 19. | Peachtree Corners | 50 | 6,834(0.73%)#19 | 421,832(0.01%)#1,122 |
| 20. | Augusta-Richmond County Consolidated Government (Balance) | 44 | 6,834(0.64%)#20 | 421,832(0.01%)#1,212 |
| 21. | Mcdonough | 43 | 6,834(0.63%)#21 | 421,832(0.01%)#1,242 |
| 22. | Evans | 42 | 6,834(0.61%)#22 | 421,832(0.01%)#1,260 |
| 23. | Clarkston | 42 | 6,834(0.61%)#23 | 421,832(0.01%)#1,265 |
| 24. | South Fulton | 36 | 6,834(0.53%)#24 | 421,832(0.01%)#1,365 |
| 25. | Tucker | 36 | 6,834(0.53%)#25 | 421,832(0.01%)#1,371 |
| 26. | Chamblee | 36 | 6,834(0.53%)#26 | 421,832(0.01%)#1,375 |
| 27. | Conyers | 36 | 6,834(0.53%)#27 | 421,832(0.01%)#1,382 |
| 28. | Kennesaw | 33 | 6,834(0.48%)#28 | 421,832(0.01%)#1,451 |
| 29. | Buford | 33 | 6,834(0.48%)#29 | 421,832(0.01%)#1,458 |
| 30. | Wilmington Island | 32 | 6,834(0.47%)#30 | 421,832(0.01%)#1,476 |
| 31. | Peachtree City | 30 | 6,834(0.44%)#31 | 421,832(0.01%)#1,514 |
| 32. | Douglasville | 29 | 6,834(0.42%)#32 | 421,832(0.01%)#1,541 |
| 33. | Savannah | 28 | 6,834(0.41%)#33 | 421,832(0.01%)#1,562 |
| 34. | Dunwoody | 24 | 6,834(0.35%)#34 | 421,832(0.01%)#1,681 |
| 35. | Valdosta | 23 | 6,834(0.34%)#35 | 421,832(0.01%)#1,713 |
| 36. | Decatur | 21 | 6,834(0.31%)#36 | 421,832(0.00%)#1,783 |
| 37. | Lawrenceville | 19 | 6,834(0.28%)#37 | 421,832(0.00%)#1,850 |
| 38. | Austell | 19 | 6,834(0.28%)#38 | 421,832(0.00%)#1,869 |
| 39. | Warner Robins | 18 | 6,834(0.26%)#39 | 421,832(0.00%)#1,879 |
| 40. | Mountain Park | 17 | 6,834(0.25%)#40 | 421,832(0.00%)#1,947 |
| 41. | Swainsboro | 15 | 6,834(0.22%)#41 | 421,832(0.00%)#2,077 |
| 42. | Smyrna | 14 | 6,834(0.20%)#42 | 421,832(0.00%)#2,106 |
| 43. | Milton | 14 | 6,834(0.20%)#43 | 421,832(0.00%)#2,109 |
| 44. | St Marys | 14 | 6,834(0.20%)#44 | 421,832(0.00%)#2,118 |
| 45. | Holly Springs | 13 | 6,834(0.19%)#45 | 421,832(0.00%)#2,165 |
| 46. | Lilburn | 12 | 6,834(0.18%)#46 | 421,832(0.00%)#2,229 |
| 47. | Montgomery | 12 | 6,834(0.18%)#47 | 421,832(0.00%)#2,252 |
| 48. | Avondale Estates | 12 | 6,834(0.18%)#48 | 421,832(0.00%)#2,257 |
| 49. | Macon Bibb County | 10 | 6,834(0.15%)#49 | 421,832(0.00%)#2,312 |
| 50. | Midway | 10 | 6,834(0.15%)#50 | 421,832(0.00%)#2,376 |
| 51. | Loganville | 9 | 6,834(0.13%)#51 | 421,832(0.00%)#2,418 |
| 52. | Mableton | 8 | 6,834(0.12%)#52 | 421,832(0.00%)#2,459 |
| 53. | Rome | 8 | 6,834(0.12%)#53 | 421,832(0.00%)#2,461 |
| 54. | Cumming | 8 | 6,834(0.12%)#54 | 421,832(0.00%)#2,487 |
| 55. | Davisboro | 6 | 6,834(0.09%)#55 | 421,832(0.00%)#2,633 |
| 56. | Fort Stewart | 5 | 6,834(0.07%)#56 | 421,832(0.00%)#2,675 |
| 57. | Fayetteville | 3 | 6,834(0.04%)#57 | 421,832(0.00%)#2,792 |
| 58. | Varnell | 3 | 6,834(0.04%)#58 | 421,832(0.00%)#2,804 |
| 59. | Brooks | 3 | 6,834(0.04%)#59 | 421,832(0.00%)#2,826 |
| 60. | Buena Vista | 2 | 6,834(0.03%)#60 | 421,832(0.00%)#2,854 |
| 61. | Pendergrass | 2 | 6,834(0.03%)#61 | 421,832(0.00%)#2,856 |
| 62. | Ochlocknee | 2 | 6,834(0.03%)#62 | 421,832(0.00%)#2,875 |
| 63. | Doraville | 1 | 6,834(0.01%)#63 | 421,832(0.00%)#2,899 |
Common Questions
What are the Top 10 Cities with the Most Immigrants from Northern Africa in Georgia?
Top 10 Cities with the Most Immigrants from Northern Africa in Georgia are:
#1
533
#2
373
#3
337
#4
233
#5
195
#6
180
#7
168
#8
153
#9
106
#10
103
What city has the Most Immigrants from Northern Africa in Georgia?
Atlanta has the Most Immigrants from Northern Africa in Georgia with 533.
What is the Total Immigrants from Northern Africa in the State of Georgia?
Total Immigrants from Northern Africa in Georgia is 6,834.
What is the Total Immigrants from Northern Africa in the United States?
Total Immigrants from Northern Africa in the United States is 421,832.