Moline, IL Map & Demographics
Moline Map
Moline Overview
$34,724
PER CAPITA INCOME
$85,788
AVG FAMILY INCOME
$63,553
AVG HOUSEHOLD INCOME
29.5%
WAGE / INCOME GAP [ % ]
70.5¢/ $1
WAGE / INCOME GAP [ $ ]
$12,309
FAMILY INCOME DEFICIT
0.44
INEQUALITY / GINI INDEX
42,452
TOTAL POPULATION
21,026
MALE POPULATION
21,426
FEMALE POPULATION
98.13
MALES / 100 FEMALES
101.90
FEMALES / 100 MALES
38.8
MEDIAN AGE
2.9
AVG FAMILY SIZE
2.3
AVG HOUSEHOLD SIZE
21,719
LABOR FORCE [ PEOPLE ]
64.4%
PERCENT IN LABOR FORCE
6.7%
UNEMPLOYMENT RATE
Moline Zip Codes
Moline Area Codes
Income in Moline
Income Overview in Moline
Per Capita Income in Moline is $34,724, while median incomes of families and households are $85,788 and $63,553 respectively.
| Characteristic | Number | Measure |
| Per Capita Income | 42,452 | $34,724 |
| Median Family Income | 11,304 | $85,788 |
| Mean Family Income | 11,304 | $97,777 |
| Median Household Income | 18,267 | $63,553 |
| Mean Household Income | 18,267 | $80,950 |
| Income Deficit | 11,304 | $12,309 |
| Wage / Income Gap (%) | 42,452 | 29.52% |
| Wage / Income Gap ($) | 42,452 | 70.48¢ per $1 |
| Gini / Inequality Index | 42,452 | 0.44 |
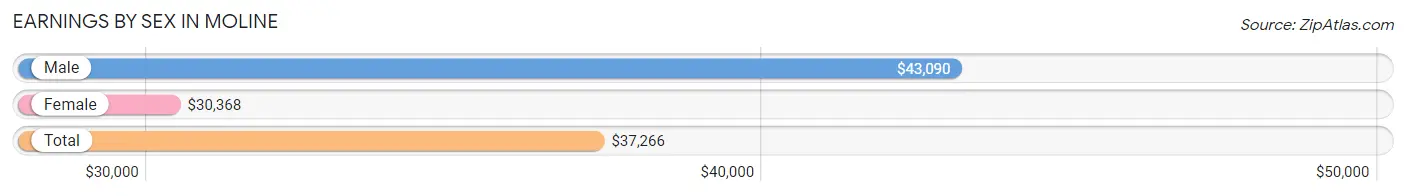
Earnings by Sex in Moline
Average Earnings in Moline are $37,266, $43,090 for men and $30,368 for women, a difference of 29.5%.
| Sex | Number | Average Earnings |
| Male | 11,885 (53.0%) | $43,090 |
| Female | 10,527 (47.0%) | $30,368 |
| Total | 22,412 (100.0%) | $37,266 |
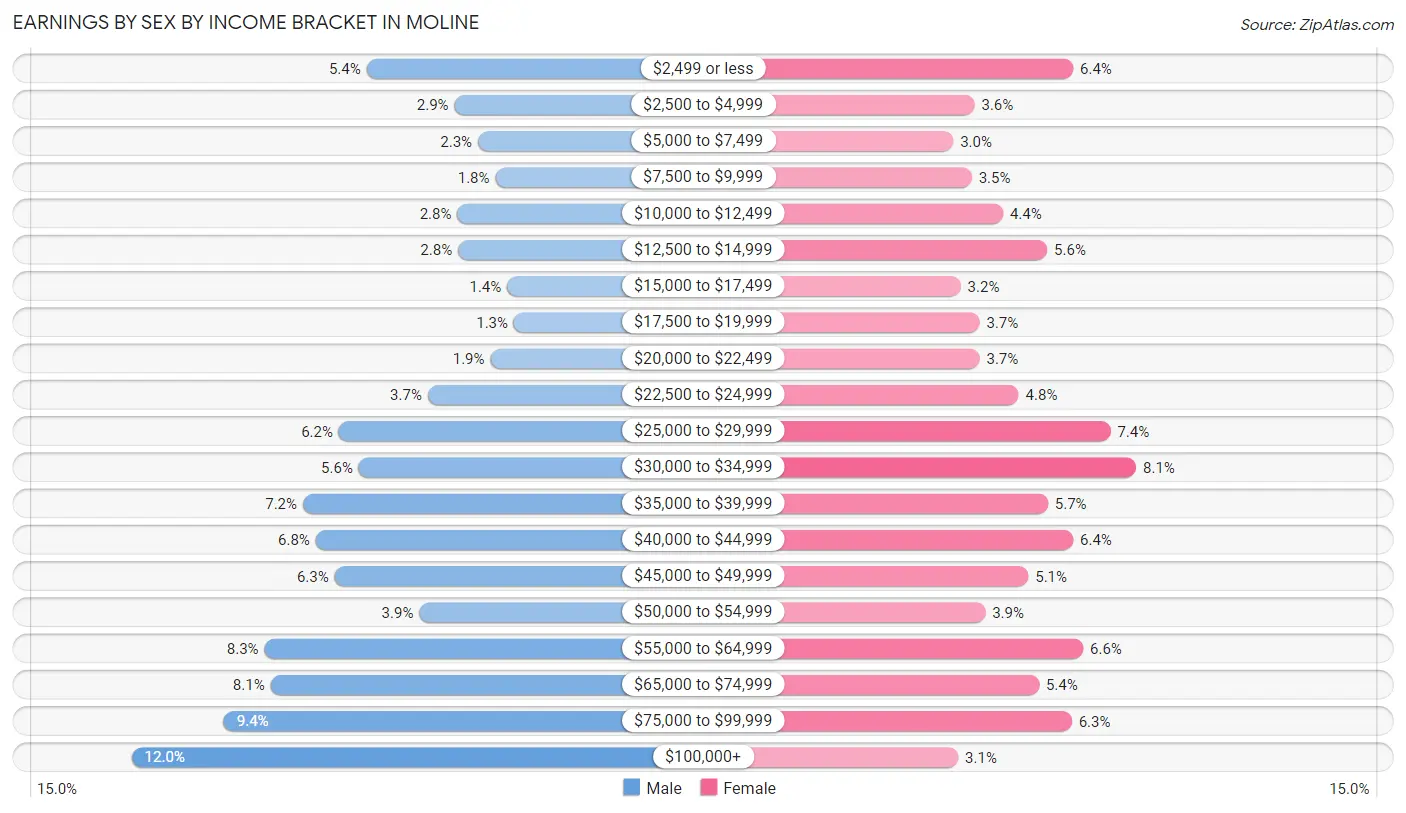
Earnings by Sex by Income Bracket in Moline
The most common earnings brackets in Moline are $100,000+ for men (1,425 | 12.0%) and $30,000 to $34,999 for women (856 | 8.1%).
| Income | Male | Female |
| $2,499 or less | 641 (5.4%) | 669 (6.4%) |
| $2,500 to $4,999 | 347 (2.9%) | 378 (3.6%) |
| $5,000 to $7,499 | 269 (2.3%) | 315 (3.0%) |
| $7,500 to $9,999 | 210 (1.8%) | 369 (3.5%) |
| $10,000 to $12,499 | 338 (2.8%) | 462 (4.4%) |
| $12,500 to $14,999 | 335 (2.8%) | 593 (5.6%) |
| $15,000 to $17,499 | 171 (1.4%) | 337 (3.2%) |
| $17,500 to $19,999 | 149 (1.3%) | 393 (3.7%) |
| $20,000 to $22,499 | 227 (1.9%) | 393 (3.7%) |
| $22,500 to $24,999 | 436 (3.7%) | 508 (4.8%) |
| $25,000 to $29,999 | 733 (6.2%) | 780 (7.4%) |
| $30,000 to $34,999 | 667 (5.6%) | 856 (8.1%) |
| $35,000 to $39,999 | 853 (7.2%) | 595 (5.7%) |
| $40,000 to $44,999 | 811 (6.8%) | 670 (6.4%) |
| $45,000 to $49,999 | 747 (6.3%) | 537 (5.1%) |
| $50,000 to $54,999 | 465 (3.9%) | 410 (3.9%) |
| $55,000 to $64,999 | 982 (8.3%) | 699 (6.6%) |
| $65,000 to $74,999 | 962 (8.1%) | 568 (5.4%) |
| $75,000 to $99,999 | 1,117 (9.4%) | 665 (6.3%) |
| $100,000+ | 1,425 (12.0%) | 330 (3.1%) |
| Total | 11,885 (100.0%) | 10,527 (100.0%) |
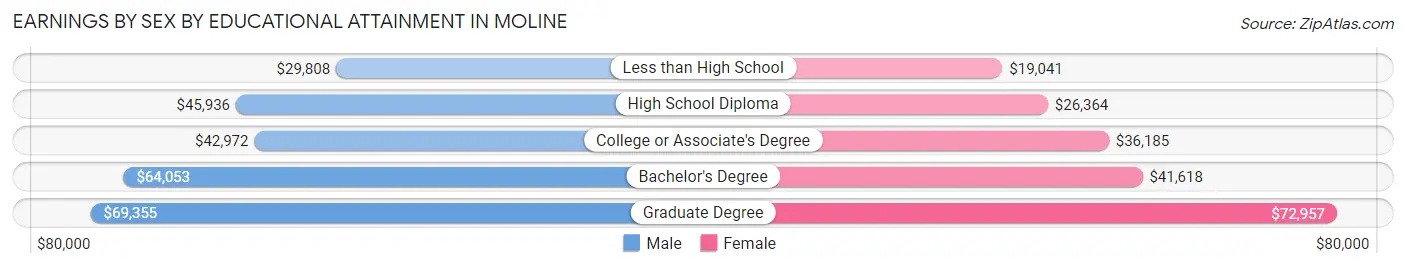
Earnings by Sex by Educational Attainment in Moline
Average earnings in Moline are $47,575 for men and $33,979 for women, a difference of 28.6%. Men with an educational attainment of graduate degree enjoy the highest average annual earnings of $69,355, while those with less than high school education earn the least with $29,808. Women with an educational attainment of graduate degree earn the most with the average annual earnings of $72,957, while those with less than high school education have the smallest earnings of $19,041.
| Educational Attainment | Male Income | Female Income |
| Less than High School | $29,808 | $19,041 |
| High School Diploma | $45,936 | $26,364 |
| College or Associate's Degree | $42,972 | $36,185 |
| Bachelor's Degree | $64,053 | $41,618 |
| Graduate Degree | $69,355 | $72,957 |
| Total | $47,575 | $33,979 |
Family Income in Moline
Family Income Brackets in Moline
According to the Moline family income data, there are 2,871 families falling into the $100,000 to $149,999 income range, which is the most common income bracket and makes up 25.4% of all families. Conversely, the $10,000 to $14,999 income bracket is the least frequent group with only 158 families (1.4%) belonging to this category.
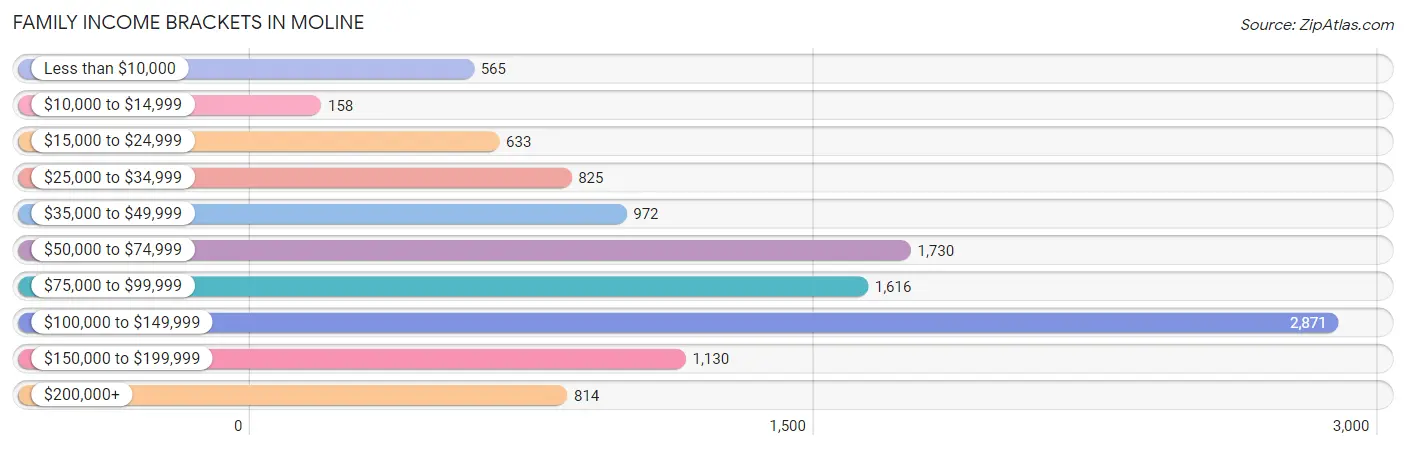
| Income Bracket | # Families | % Families |
| Less than $10,000 | 565 | 5.0% |
| $10,000 to $14,999 | 158 | 1.4% |
| $15,000 to $24,999 | 633 | 5.6% |
| $25,000 to $34,999 | 825 | 7.3% |
| $35,000 to $49,999 | 972 | 8.6% |
| $50,000 to $74,999 | 1,730 | 15.3% |
| $75,000 to $99,999 | 1,616 | 14.3% |
| $100,000 to $149,999 | 2,871 | 25.4% |
| $150,000 to $199,999 | 1,130 | 10.0% |
| $200,000+ | 814 | 7.2% |
Family Income by Famaliy Size in Moline
5-person families (731 | 6.5%) account for the highest median family income in Moline with $112,679 per family, while 2-person families (5,832 | 51.6%) have the highest median income of $41,284 per family member.
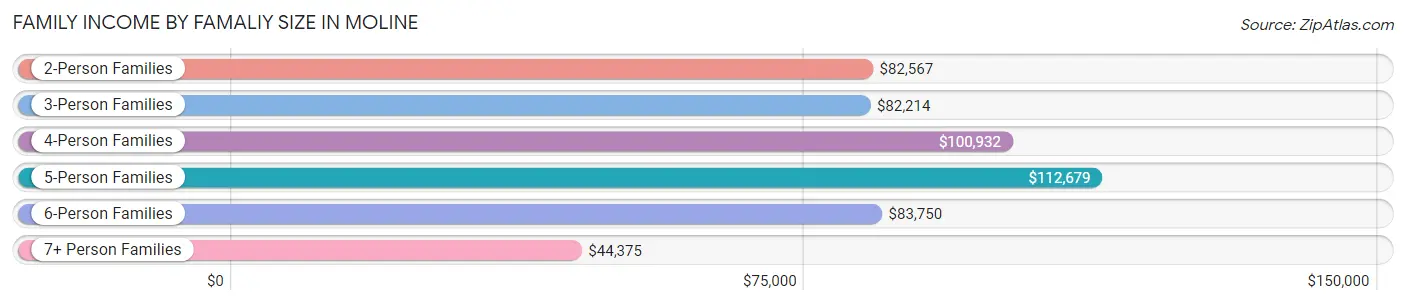
| Income Bracket | # Families | Median Income |
| 2-Person Families | 5,832 (51.6%) | $82,567 |
| 3-Person Families | 2,163 (19.1%) | $82,214 |
| 4-Person Families | 2,049 (18.1%) | $100,932 |
| 5-Person Families | 731 (6.5%) | $112,679 |
| 6-Person Families | 361 (3.2%) | $83,750 |
| 7+ Person Families | 168 (1.5%) | $44,375 |
| Total | 11,304 (100.0%) | $85,788 |
Family Income by Number of Earners in Moline
The median family income in Moline is $85,788, with families comprising 3+ earners (1,409) having the highest median family income of $129,162, while families with 1 earner (3,605) have the lowest median family income of $53,880, accounting for 12.5% and 31.9% of families, respectively.
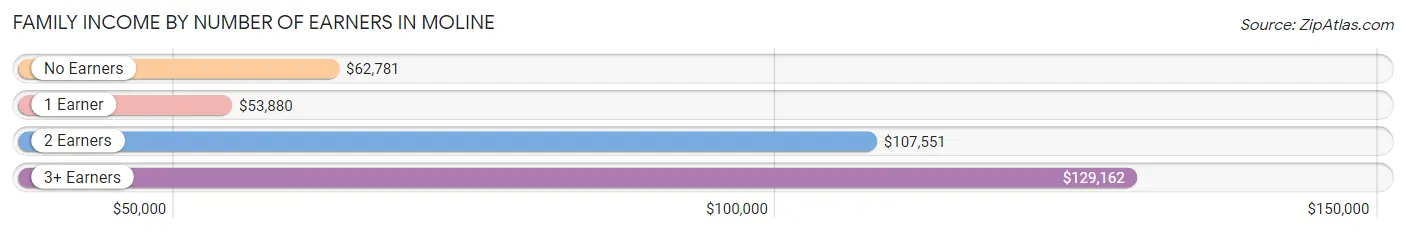
| Number of Earners | # Families | Median Income |
| No Earners | 1,758 (15.5%) | $62,781 |
| 1 Earner | 3,605 (31.9%) | $53,880 |
| 2 Earners | 4,532 (40.1%) | $107,551 |
| 3+ Earners | 1,409 (12.5%) | $129,162 |
| Total | 11,304 (100.0%) | $85,788 |
Household Income in Moline
Household Income Brackets in Moline
With 3,489 households falling in the category, the $100,000 to $149,999 income range is the most frequent in Moline, accounting for 19.1% of all households. In contrast, only 712 households (3.9%) fall into the $10,000 to $14,999 income bracket, making it the least populous group.
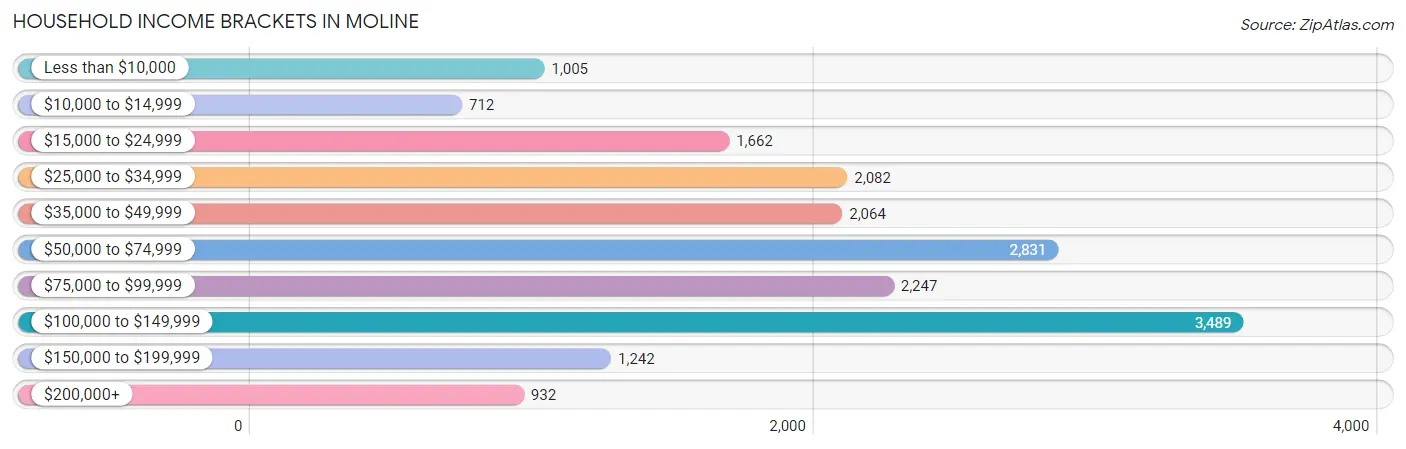
| Income Bracket | # Households | % Households |
| Less than $10,000 | 1,005 | 5.5% |
| $10,000 to $14,999 | 712 | 3.9% |
| $15,000 to $24,999 | 1,662 | 9.1% |
| $25,000 to $34,999 | 2,082 | 11.4% |
| $35,000 to $49,999 | 2,064 | 11.3% |
| $50,000 to $74,999 | 2,831 | 15.5% |
| $75,000 to $99,999 | 2,247 | 12.3% |
| $100,000 to $149,999 | 3,489 | 19.1% |
| $150,000 to $199,999 | 1,242 | 6.8% |
| $200,000+ | 932 | 5.1% |
Household Income by Householder Age in Moline
The median household income in Moline is $63,553, with the highest median household income of $78,652 found in the 45 to 64 years age bracket for the primary householder. A total of 5,993 households (32.8%) fall into this category. Meanwhile, the 15 to 24 years age bracket for the primary householder has the lowest median household income of $39,115, with 809 households (4.4%) in this group.
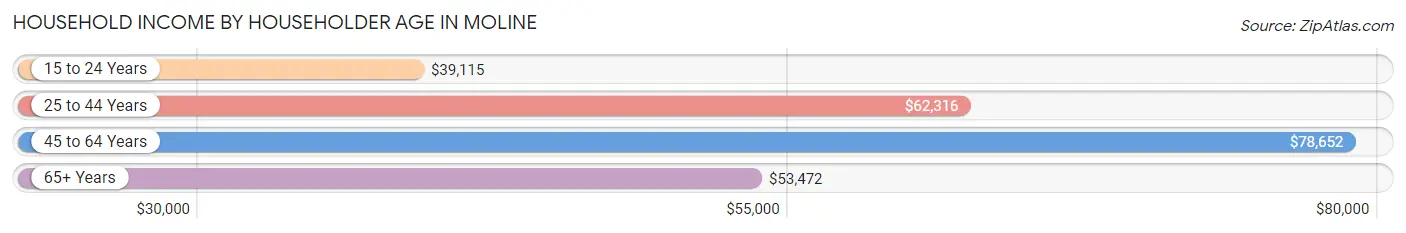
| Income Bracket | # Households | Median Income |
| 15 to 24 Years | 809 (4.4%) | $39,115 |
| 25 to 44 Years | 5,907 (32.3%) | $62,316 |
| 45 to 64 Years | 5,993 (32.8%) | $78,652 |
| 65+ Years | 5,558 (30.4%) | $53,472 |
| Total | 18,267 (100.0%) | $63,553 |
Poverty in Moline
Income Below Poverty by Sex and Age in Moline
With 15.1% poverty level for males and 15.8% for females among the residents of Moline, 6 to 11 year old males and 5 year old females are the most vulnerable to poverty, with 674 males (37.3%) and 232 females (62.7%) in their respective age groups living below the poverty level.
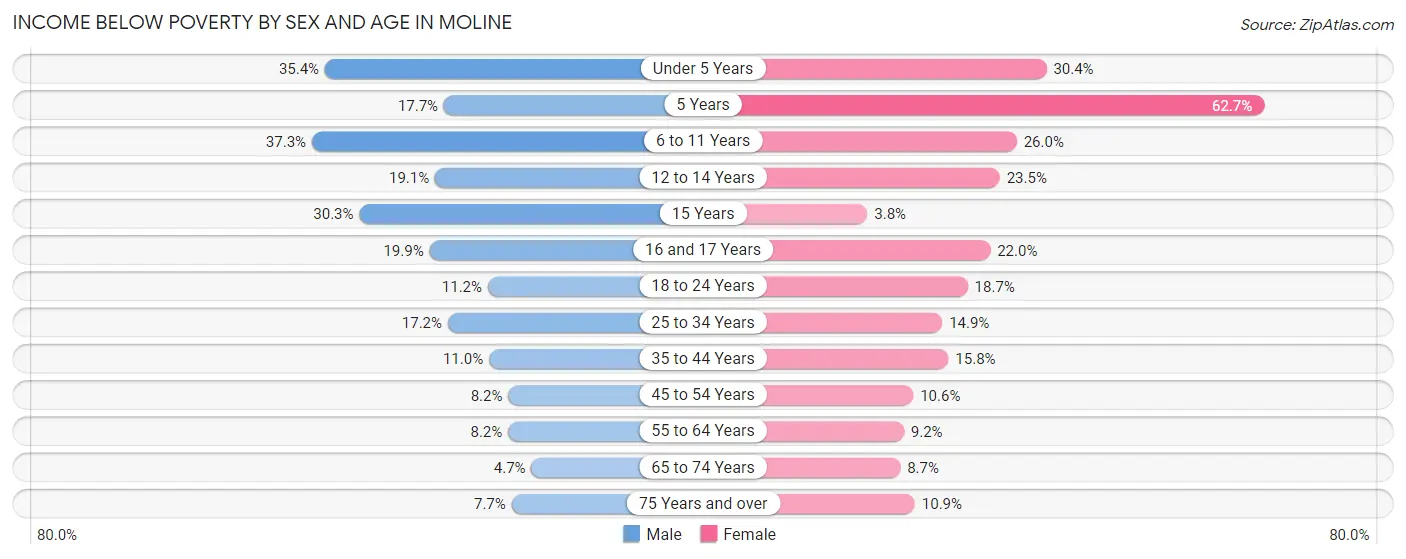
| Age Bracket | Male | Female |
| Under 5 Years | 509 (35.4%) | 317 (30.4%) |
| 5 Years | 25 (17.7%) | 232 (62.7%) |
| 6 to 11 Years | 674 (37.3%) | 409 (26.0%) |
| 12 to 14 Years | 177 (19.1%) | 185 (23.4%) |
| 15 Years | 83 (30.3%) | 8 (3.8%) |
| 16 and 17 Years | 97 (19.9%) | 136 (22.0%) |
| 18 to 24 Years | 176 (11.2%) | 265 (18.7%) |
| 25 to 34 Years | 457 (17.2%) | 475 (14.9%) |
| 35 to 44 Years | 337 (11.0%) | 419 (15.8%) |
| 45 to 54 Years | 199 (8.2%) | 229 (10.6%) |
| 55 to 64 Years | 211 (8.2%) | 245 (9.2%) |
| 65 to 74 Years | 87 (4.7%) | 234 (8.7%) |
| 75 Years and over | 127 (7.7%) | 197 (10.8%) |
| Total | 3,159 (15.1%) | 3,351 (15.8%) |
Income Above Poverty by Sex and Age in Moline
According to the poverty statistics in Moline, males aged 65 to 74 years and females aged 15 years are the age groups that are most secure financially, with 95.3% of males and 96.2% of females in these age groups living above the poverty line.
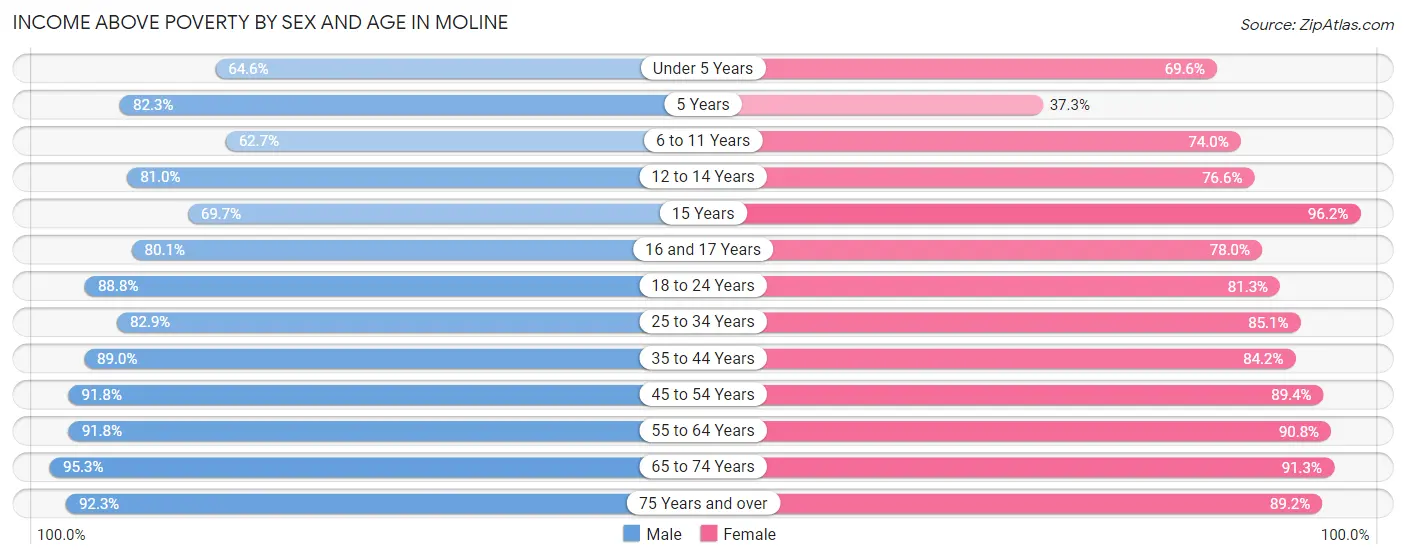
| Age Bracket | Male | Female |
| Under 5 Years | 929 (64.6%) | 726 (69.6%) |
| 5 Years | 116 (82.3%) | 138 (37.3%) |
| 6 to 11 Years | 1,131 (62.7%) | 1,165 (74.0%) |
| 12 to 14 Years | 752 (80.9%) | 604 (76.5%) |
| 15 Years | 191 (69.7%) | 203 (96.2%) |
| 16 and 17 Years | 391 (80.1%) | 481 (78.0%) |
| 18 to 24 Years | 1,394 (88.8%) | 1,153 (81.3%) |
| 25 to 34 Years | 2,207 (82.9%) | 2,710 (85.1%) |
| 35 to 44 Years | 2,716 (89.0%) | 2,228 (84.2%) |
| 45 to 54 Years | 2,236 (91.8%) | 1,930 (89.4%) |
| 55 to 64 Years | 2,361 (91.8%) | 2,414 (90.8%) |
| 65 to 74 Years | 1,748 (95.3%) | 2,461 (91.3%) |
| 75 Years and over | 1,527 (92.3%) | 1,619 (89.1%) |
| Total | 17,699 (84.9%) | 17,832 (84.2%) |
Income Below Poverty Among Married-Couple Families in Moline
The poverty statistics for married-couple families in Moline show that 5.3% or 430 of the total 8,122 families live below the poverty line. Families with 5 or more children have the highest poverty rate of 89.7%, comprising of 70 families. On the other hand, families with no children have the lowest poverty rate of 2.2%, which includes 110 families.
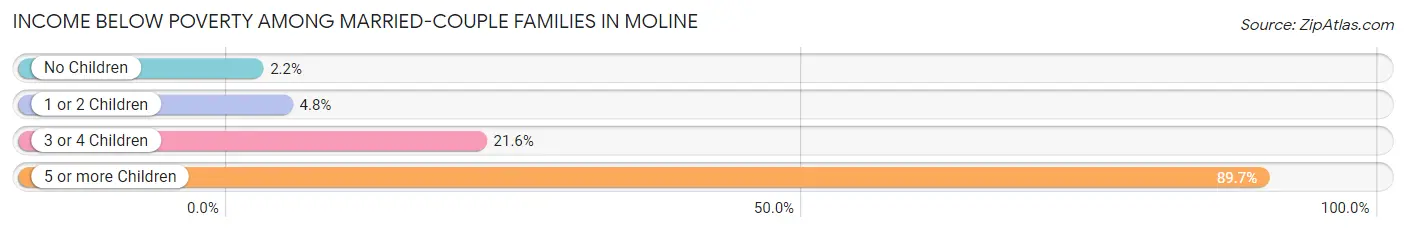
| Children | Above Poverty | Below Poverty |
| No Children | 4,924 (97.8%) | 110 (2.2%) |
| 1 or 2 Children | 2,264 (95.3%) | 113 (4.8%) |
| 3 or 4 Children | 496 (78.4%) | 137 (21.6%) |
| 5 or more Children | 8 (10.3%) | 70 (89.7%) |
| Total | 7,692 (94.7%) | 430 (5.3%) |
Income Below Poverty Among Single-Parent Households in Moline
According to the poverty data in Moline, 30.1% or 268 single-father households and 29.4% or 675 single-mother households are living below the poverty line. Among single-father households, those with 3 or 4 children have the highest poverty rate, with 65 households (72.2%) experiencing poverty. Likewise, among single-mother households, those with 5 or more children have the highest poverty rate, with 5 households (100.0%) falling below the poverty line.
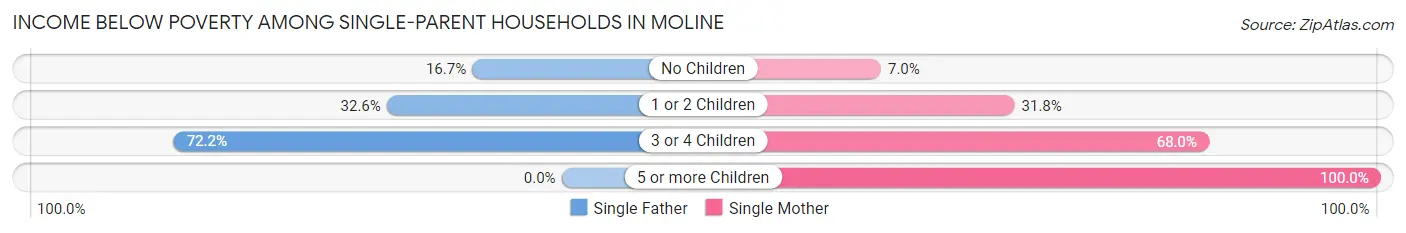
| Children | Single Father | Single Mother |
| No Children | 60 (16.7%) | 54 (7.0%) |
| 1 or 2 Children | 143 (32.6%) | 363 (31.8%) |
| 3 or 4 Children | 65 (72.2%) | 253 (68.0%) |
| 5 or more Children | 0 (0.0%) | 5 (100.0%) |
| Total | 268 (30.1%) | 675 (29.4%) |
Income Below Poverty Among Married-Couple vs Single-Parent Households in Moline
The poverty data for Moline shows that 430 of the married-couple family households (5.3%) and 943 of the single-parent households (29.6%) are living below the poverty level. Within the married-couple family households, those with 5 or more children have the highest poverty rate, with 70 households (89.7%) falling below the poverty line. Among the single-parent households, those with 5 or more children have the highest poverty rate, with 5 household (100.0%) living below poverty.
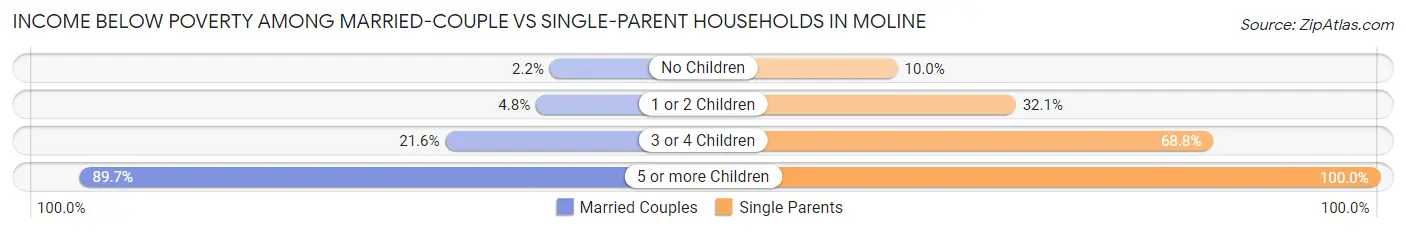
| Children | Married-Couple Families | Single-Parent Households |
| No Children | 110 (2.2%) | 114 (10.0%) |
| 1 or 2 Children | 113 (4.8%) | 506 (32.1%) |
| 3 or 4 Children | 137 (21.6%) | 318 (68.8%) |
| 5 or more Children | 70 (89.7%) | 5 (100.0%) |
| Total | 430 (5.3%) | 943 (29.6%) |
Race in Moline
The most populous races in Moline are White / Caucasian (31,273 | 73.7%), Hispanic or Latino (7,368 | 17.4%), and Black / African American (3,993 | 9.4%).
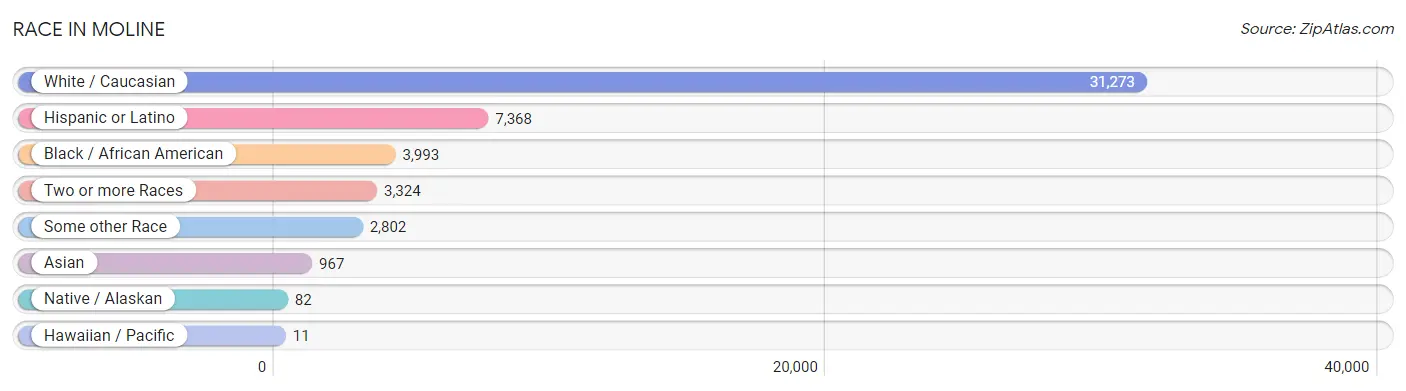
| Race | # Population | % Population |
| Asian | 967 | 2.3% |
| Black / African American | 3,993 | 9.4% |
| Hawaiian / Pacific | 11 | 0.0% |
| Hispanic or Latino | 7,368 | 17.4% |
| Native / Alaskan | 82 | 0.2% |
| White / Caucasian | 31,273 | 73.7% |
| Two or more Races | 3,324 | 7.8% |
| Some other Race | 2,802 | 6.6% |
| Total | 42,452 | 100.0% |
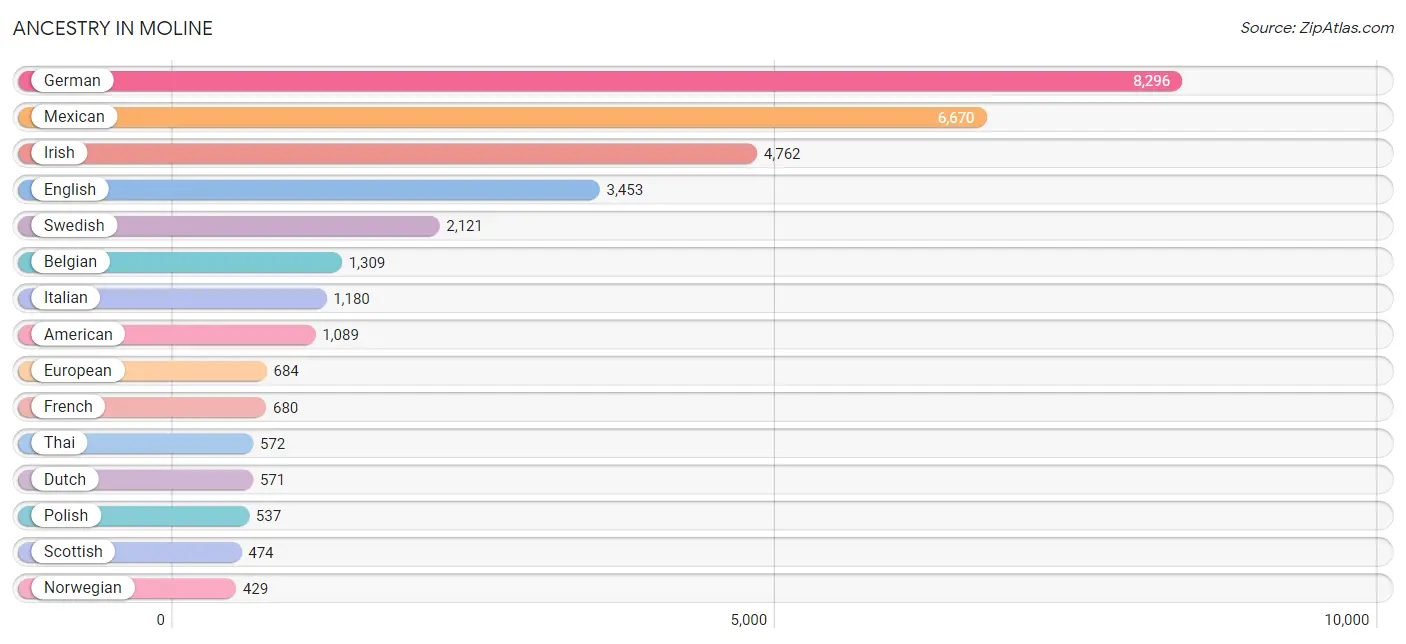
Ancestry in Moline
The most populous ancestries reported in Moline are German (8,296 | 19.5%), Mexican (6,670 | 15.7%), Irish (4,762 | 11.2%), English (3,453 | 8.1%), and Swedish (2,121 | 5.0%), together accounting for 59.6% of all Moline residents.
| Ancestry | # Population | % Population |
| African | 386 | 0.9% |
| Alaska Native | 31 | 0.1% |
| American | 1,089 | 2.6% |
| Arab | 129 | 0.3% |
| Armenian | 11 | 0.0% |
| Austrian | 37 | 0.1% |
| Belgian | 1,309 | 3.1% |
| Belizean | 18 | 0.0% |
| Bhutanese | 1 | 0.0% |
| Blackfeet | 16 | 0.0% |
| Brazilian | 6 | 0.0% |
| British | 177 | 0.4% |
| Burmese | 27 | 0.1% |
| Canadian | 5 | 0.0% |
| Central American | 47 | 0.1% |
| Central American Indian | 21 | 0.1% |
| Cherokee | 31 | 0.1% |
| Cheyenne | 7 | 0.0% |
| Chilean | 16 | 0.0% |
| Chippewa | 10 | 0.0% |
| Choctaw | 10 | 0.0% |
| Colombian | 32 | 0.1% |
| Croatian | 21 | 0.1% |
| Cuban | 12 | 0.0% |
| Czech | 153 | 0.4% |
| Czechoslovakian | 13 | 0.0% |
| Danish | 144 | 0.3% |
| Dominican | 10 | 0.0% |
| Dutch | 571 | 1.3% |
| Eastern European | 113 | 0.3% |
| Ecuadorian | 1 | 0.0% |
| English | 3,453 | 8.1% |
| European | 684 | 1.6% |
| Filipino | 33 | 0.1% |
| Finnish | 78 | 0.2% |
| French | 680 | 1.6% |
| French Canadian | 64 | 0.2% |
| German | 8,296 | 19.5% |
| German Russian | 6 | 0.0% |
| Greek | 207 | 0.5% |
| Hungarian | 77 | 0.2% |
| Indian (Asian) | 49 | 0.1% |
| Indonesian | 199 | 0.5% |
| Irish | 4,762 | 11.2% |
| Italian | 1,180 | 2.8% |
| Japanese | 8 | 0.0% |
| Korean | 296 | 0.7% |
| Lebanese | 42 | 0.1% |
| Liberian | 5 | 0.0% |
| Lithuanian | 109 | 0.3% |
| Macedonian | 6 | 0.0% |
| Malaysian | 9 | 0.0% |
| Mexican | 6,670 | 15.7% |
| Mexican American Indian | 35 | 0.1% |
| Moroccan | 52 | 0.1% |
| Native Hawaiian | 19 | 0.0% |
| Navajo | 19 | 0.0% |
| Northern European | 111 | 0.3% |
| Norwegian | 429 | 1.0% |
| Pakistani | 11 | 0.0% |
| Panamanian | 20 | 0.1% |
| Pennsylvania German | 9 | 0.0% |
| Polish | 537 | 1.3% |
| Puerto Rican | 146 | 0.3% |
| Romanian | 2 | 0.0% |
| Russian | 148 | 0.4% |
| Salvadoran | 27 | 0.1% |
| Scandinavian | 233 | 0.5% |
| Scotch-Irish | 275 | 0.6% |
| Scottish | 474 | 1.1% |
| Slavic | 17 | 0.0% |
| Slovak | 2 | 0.0% |
| Slovene | 14 | 0.0% |
| South American | 125 | 0.3% |
| South American Indian | 21 | 0.1% |
| Spaniard | 94 | 0.2% |
| Sri Lankan | 9 | 0.0% |
| Subsaharan African | 402 | 0.9% |
| Swedish | 2,121 | 5.0% |
| Swiss | 65 | 0.2% |
| Syrian | 28 | 0.1% |
| Thai | 572 | 1.3% |
| Turkish | 10 | 0.0% |
| Ukrainian | 25 | 0.1% |
| Venezuelan | 76 | 0.2% |
| Welsh | 194 | 0.5% |
| Yugoslavian | 35 | 0.1% | View All 87 Rows |
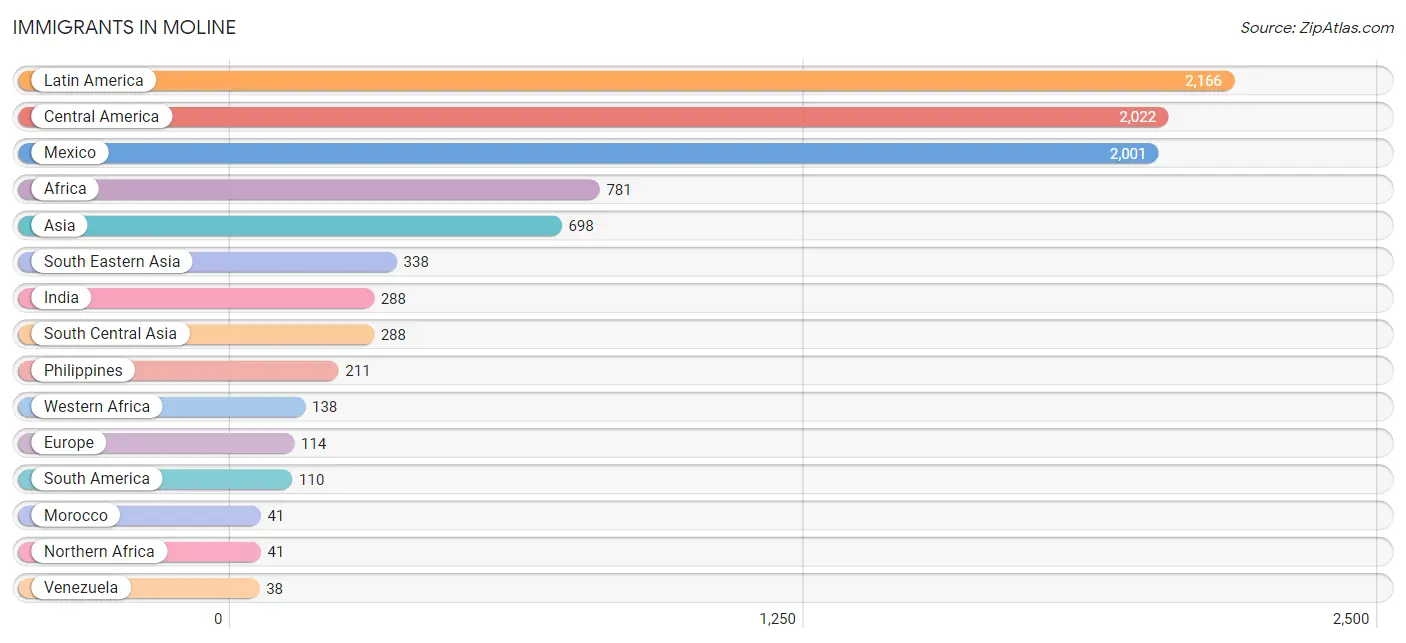
Immigrants in Moline
The most numerous immigrant groups reported in Moline came from Latin America (2,166 | 5.1%), Central America (2,022 | 4.8%), Mexico (2,001 | 4.7%), Africa (781 | 1.8%), and Asia (698 | 1.6%), together accounting for 18.0% of all Moline residents.
| Immigration Origin | # Population | % Population |
| Africa | 781 | 1.8% |
| Asia | 698 | 1.6% |
| Australia | 9 | 0.0% |
| Belize | 21 | 0.1% |
| Brazil | 16 | 0.0% |
| Cambodia | 1 | 0.0% |
| Caribbean | 34 | 0.1% |
| Central America | 2,022 | 4.8% |
| Chile | 16 | 0.0% |
| China | 21 | 0.1% |
| Colombia | 15 | 0.0% |
| Cuba | 12 | 0.0% |
| Eastern Asia | 37 | 0.1% |
| Eastern Europe | 33 | 0.1% |
| Ecuador | 25 | 0.1% |
| England | 22 | 0.1% |
| Europe | 114 | 0.3% |
| Germany | 33 | 0.1% |
| Greece | 14 | 0.0% |
| India | 288 | 0.7% |
| Japan | 1 | 0.0% |
| Korea | 15 | 0.0% |
| Latin America | 2,166 | 5.1% |
| Mexico | 2,001 | 4.7% |
| Morocco | 41 | 0.1% |
| Northern Africa | 41 | 0.1% |
| Northern Europe | 34 | 0.1% |
| Oceania | 9 | 0.0% |
| Philippines | 211 | 0.5% |
| Poland | 4 | 0.0% |
| Russia | 17 | 0.0% |
| Scotland | 12 | 0.0% |
| South America | 110 | 0.3% |
| South Central Asia | 288 | 0.7% |
| South Eastern Asia | 338 | 0.8% |
| Southern Europe | 14 | 0.0% |
| Syria | 30 | 0.1% |
| Taiwan | 21 | 0.1% |
| Thailand | 17 | 0.0% |
| Trinidad and Tobago | 22 | 0.1% |
| Turkey | 5 | 0.0% |
| Ukraine | 12 | 0.0% |
| Venezuela | 38 | 0.1% |
| Vietnam | 36 | 0.1% |
| Western Africa | 138 | 0.3% |
| Western Asia | 35 | 0.1% |
| Western Europe | 33 | 0.1% | View All 47 Rows |
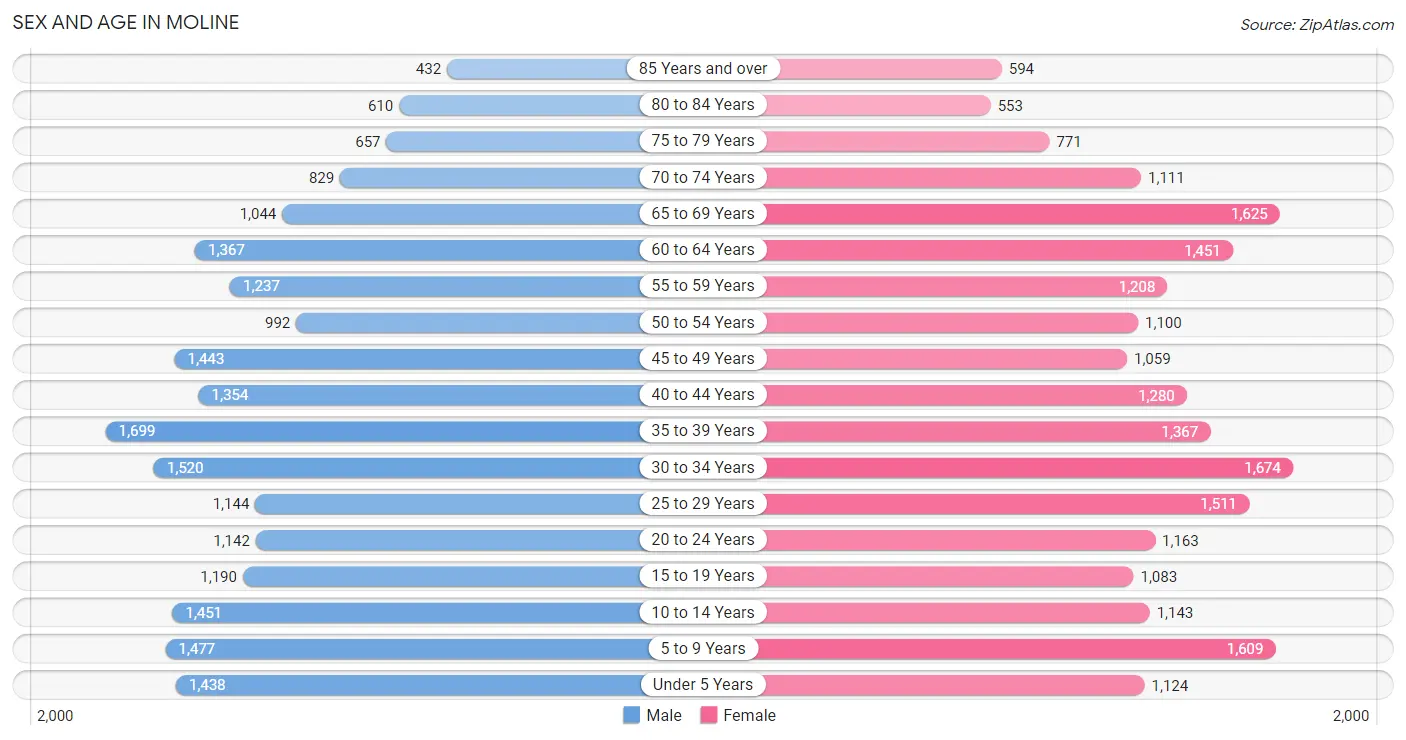
Sex and Age in Moline
Sex and Age in Moline
The most populous age groups in Moline are 35 to 39 Years (1,699 | 8.1%) for men and 30 to 34 Years (1,674 | 7.8%) for women.
| Age Bracket | Male | Female |
| Under 5 Years | 1,438 (6.8%) | 1,124 (5.2%) |
| 5 to 9 Years | 1,477 (7.0%) | 1,609 (7.5%) |
| 10 to 14 Years | 1,451 (6.9%) | 1,143 (5.3%) |
| 15 to 19 Years | 1,190 (5.7%) | 1,083 (5.1%) |
| 20 to 24 Years | 1,142 (5.4%) | 1,163 (5.4%) |
| 25 to 29 Years | 1,144 (5.4%) | 1,511 (7.0%) |
| 30 to 34 Years | 1,520 (7.2%) | 1,674 (7.8%) |
| 35 to 39 Years | 1,699 (8.1%) | 1,367 (6.4%) |
| 40 to 44 Years | 1,354 (6.4%) | 1,280 (6.0%) |
| 45 to 49 Years | 1,443 (6.9%) | 1,059 (4.9%) |
| 50 to 54 Years | 992 (4.7%) | 1,100 (5.1%) |
| 55 to 59 Years | 1,237 (5.9%) | 1,208 (5.6%) |
| 60 to 64 Years | 1,367 (6.5%) | 1,451 (6.8%) |
| 65 to 69 Years | 1,044 (5.0%) | 1,625 (7.6%) |
| 70 to 74 Years | 829 (3.9%) | 1,111 (5.2%) |
| 75 to 79 Years | 657 (3.1%) | 771 (3.6%) |
| 80 to 84 Years | 610 (2.9%) | 553 (2.6%) |
| 85 Years and over | 432 (2.1%) | 594 (2.8%) |
| Total | 21,026 (100.0%) | 21,426 (100.0%) |
Families and Households in Moline
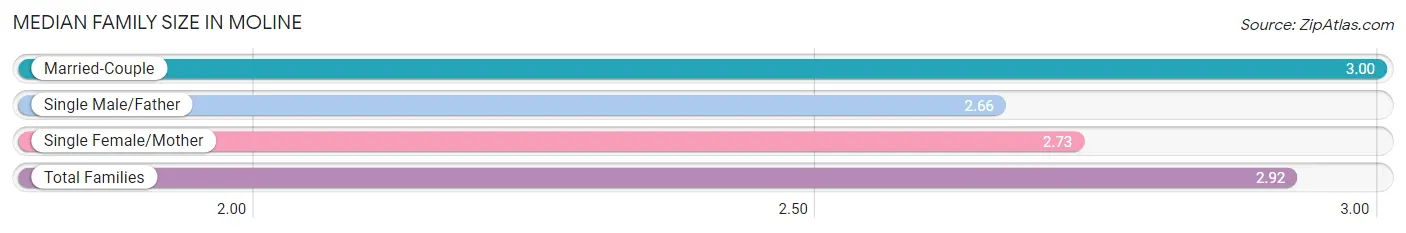
Median Family Size in Moline
The median family size in Moline is 2.92 persons per family, with married-couple families (8,122 | 71.9%) accounting for the largest median family size of 3 persons per family. On the other hand, single male/father families (889 | 7.9%) represent the smallest median family size with 2.66 persons per family.
| Family Type | # Families | Family Size |
| Married-Couple | 8,122 (71.9%) | 3.00 |
| Single Male/Father | 889 (7.9%) | 2.66 |
| Single Female/Mother | 2,293 (20.3%) | 2.73 |
| Total Families | 11,304 (100.0%) | 2.92 |
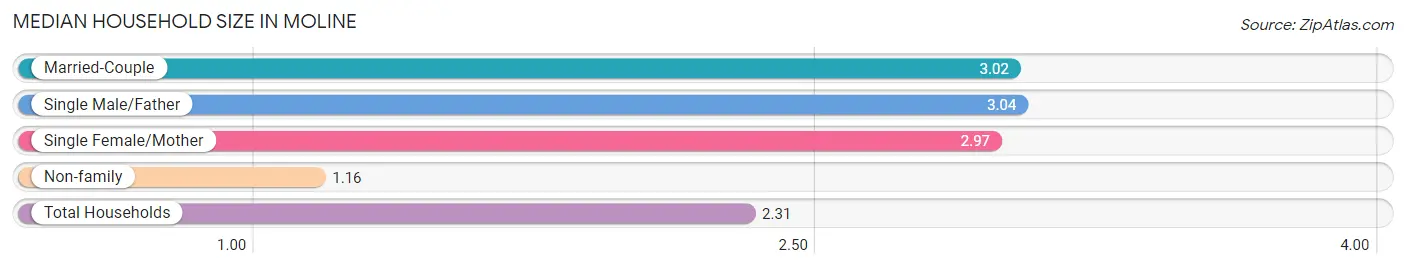
Median Household Size in Moline
The median household size in Moline is 2.31 persons per household, with single male/father households (889 | 4.9%) accounting for the largest median household size of 3.04 persons per household. non-family households (6,963 | 38.1%) represent the smallest median household size with 1.16 persons per household.
| Household Type | # Households | Household Size |
| Married-Couple | 8,122 (44.5%) | 3.02 |
| Single Male/Father | 889 (4.9%) | 3.04 |
| Single Female/Mother | 2,293 (12.6%) | 2.97 |
| Non-family | 6,963 (38.1%) | 1.16 |
| Total Households | 18,267 (100.0%) | 2.31 |
Household Size by Marriage Status in Moline
Out of a total of 18,267 households in Moline, 11,304 (61.9%) are family households, while 6,963 (38.1%) are nonfamily households. The most numerous type of family households are 2-person households, comprising 5,425, and the most common type of nonfamily households are 1-person households, comprising 6,118.
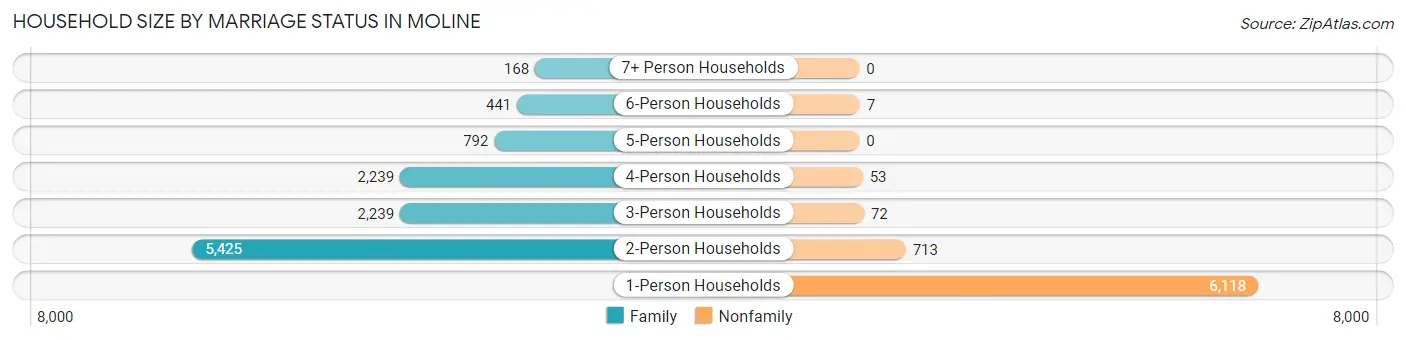
| Household Size | Family Households | Nonfamily Households |
| 1-Person Households | - | 6,118 (33.5%) |
| 2-Person Households | 5,425 (29.7%) | 713 (3.9%) |
| 3-Person Households | 2,239 (12.3%) | 72 (0.4%) |
| 4-Person Households | 2,239 (12.3%) | 53 (0.3%) |
| 5-Person Households | 792 (4.3%) | 0 (0.0%) |
| 6-Person Households | 441 (2.4%) | 7 (0.0%) |
| 7+ Person Households | 168 (0.9%) | 0 (0.0%) |
| Total | 11,304 (61.9%) | 6,963 (38.1%) |
Female Fertility in Moline
Fertility by Age in Moline
Average fertility rate in Moline is 52.0 births per 1,000 women. Women in the age bracket of 20 to 34 years have the highest fertility rate with 93.0 births per 1,000 women. Women in the age bracket of 20 to 34 years acount for 82.8% of all women with births.
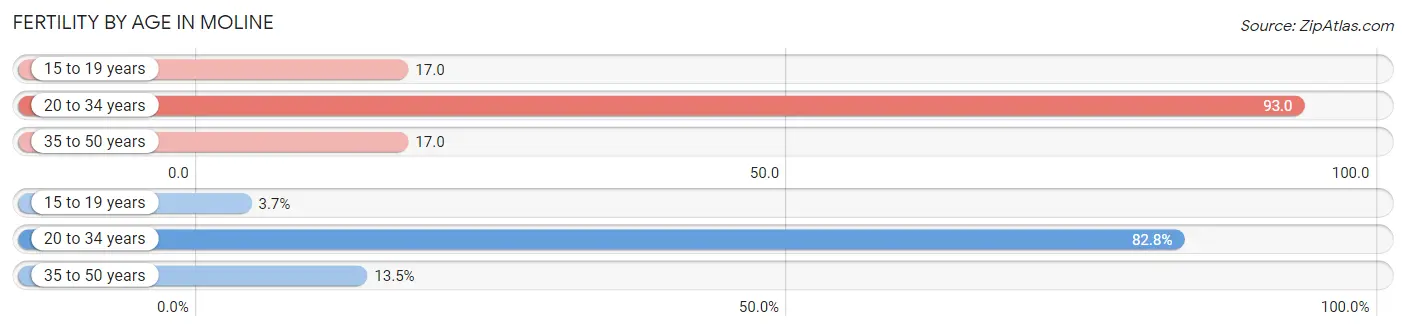
| Age Bracket | Women with Births | Births / 1,000 Women |
| 15 to 19 years | 18 (3.7%) | 17.0 |
| 20 to 34 years | 404 (82.8%) | 93.0 |
| 35 to 50 years | 66 (13.5%) | 17.0 |
| Total | 488 (100.0%) | 52.0 |
Fertility by Age by Marriage Status in Moline
49.4% of women with births (488) in Moline are married. The highest percentage of unmarried women with births falls into 15 to 19 years age bracket with 100.0% of them unmarried at the time of birth, while the lowest percentage of unmarried women with births belong to 20 to 34 years age bracket with 47.0% of them unmarried.
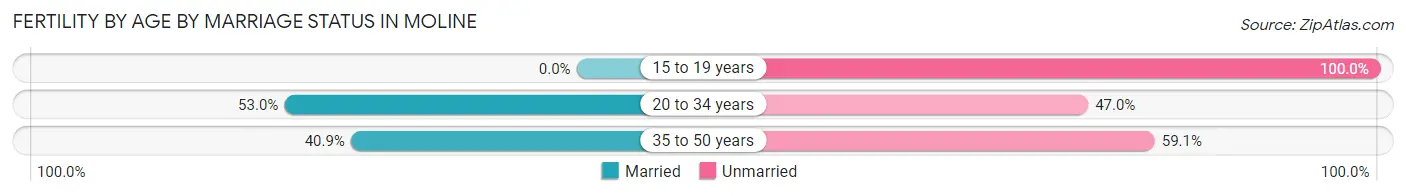
| Age Bracket | Married | Unmarried |
| 15 to 19 years | 0 (0.0%) | 18 (100.0%) |
| 20 to 34 years | 214 (53.0%) | 190 (47.0%) |
| 35 to 50 years | 27 (40.9%) | 39 (59.1%) |
| Total | 241 (49.4%) | 247 (50.6%) |
Fertility by Education in Moline
Average fertility rate in Moline is 52.0 births per 1,000 women. Women with the education attainment of high school diploma have the highest fertility rate of 99.0 births per 1,000 women, while women with the education attainment of less than high school have the lowest fertility at 14.0 births per 1,000 women. Women with the education attainment of high school diploma represent 38.5% of all women with births.
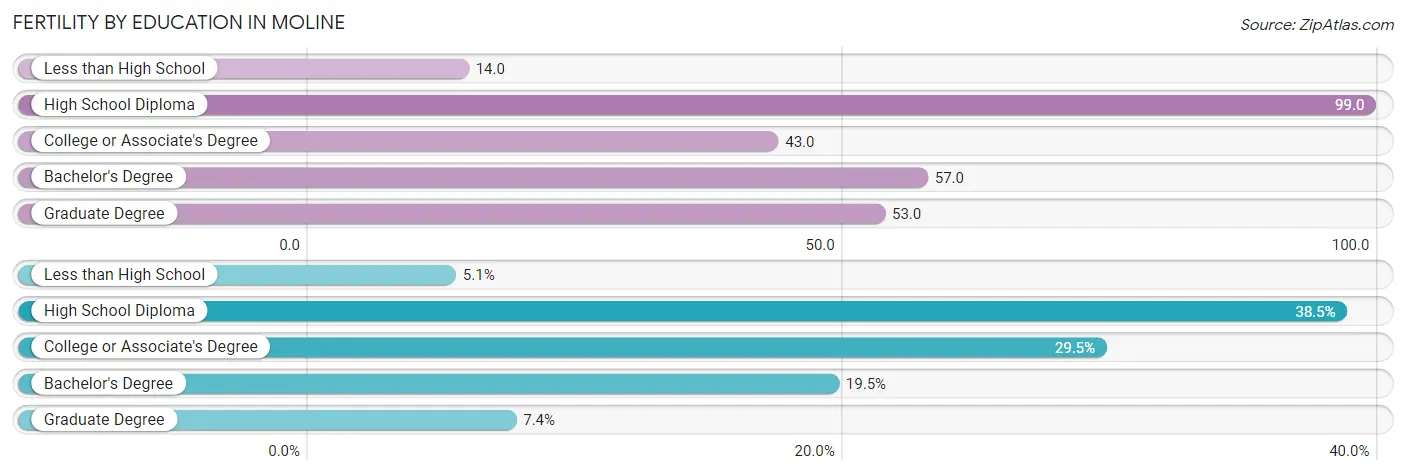
| Educational Attainment | Women with Births | Births / 1,000 Women |
| Less than High School | 25 (5.1%) | 14.0 |
| High School Diploma | 188 (38.5%) | 99.0 |
| College or Associate's Degree | 144 (29.5%) | 43.0 |
| Bachelor's Degree | 95 (19.5%) | 57.0 |
| Graduate Degree | 36 (7.4%) | 53.0 |
| Total | 488 (100.0%) | 52.0 |
Fertility by Education by Marriage Status in Moline
50.6% of women with births in Moline are unmarried. Women with the educational attainment of less than high school are most likely to be married with 100.0% of them married at childbirth, while women with the educational attainment of high school diploma are least likely to be married with 78.7% of them unmarried at childbirth.
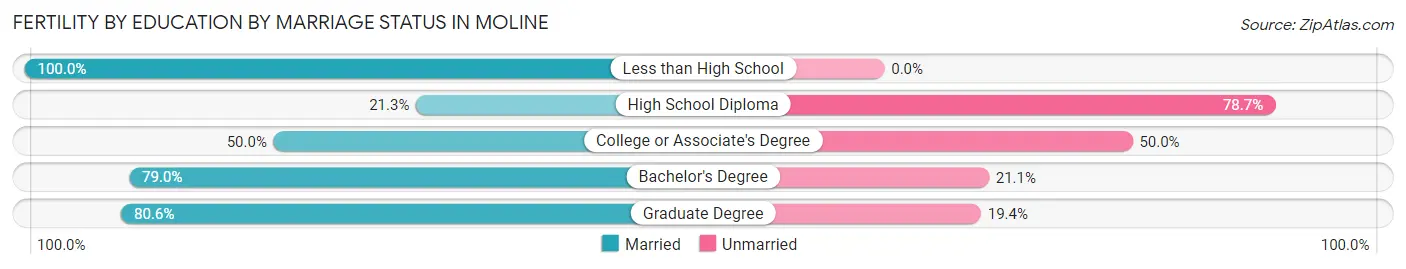
| Educational Attainment | Married | Unmarried |
| Less than High School | 25 (100.0%) | 0 (0.0%) |
| High School Diploma | 40 (21.3%) | 148 (78.7%) |
| College or Associate's Degree | 72 (50.0%) | 72 (50.0%) |
| Bachelor's Degree | 75 (78.9%) | 20 (21.0%) |
| Graduate Degree | 29 (80.6%) | 7 (19.4%) |
| Total | 241 (49.4%) | 247 (50.6%) |
Employment Characteristics in Moline
Employment by Class of Employer in Moline
Among the 19,845 employed individuals in Moline, private company employees (13,935 | 70.2%), not-for-profit organizations (1,839 | 9.3%), and local government employees (1,469 | 7.4%) make up the most common classes of employment.
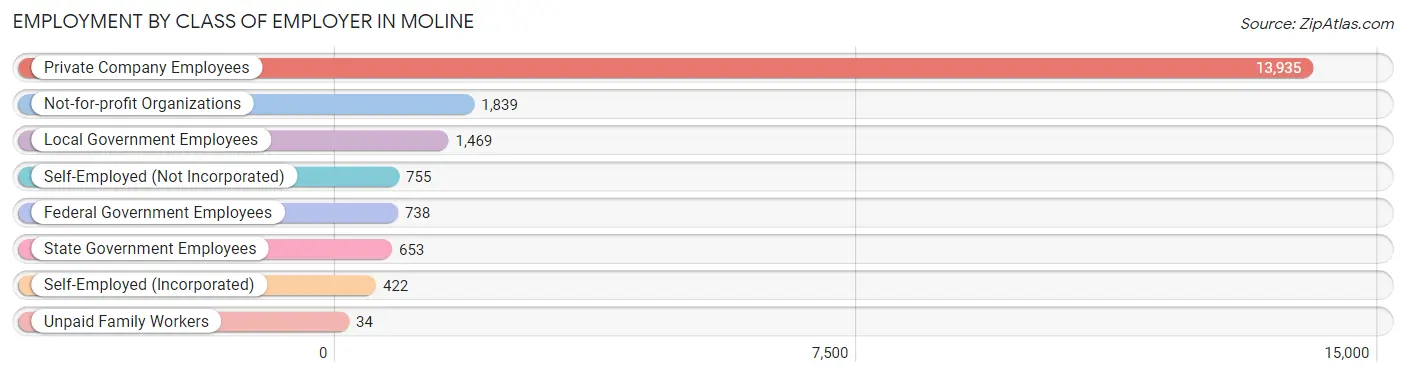
| Employer Class | # Employees | % Employees |
| Private Company Employees | 13,935 | 70.2% |
| Self-Employed (Incorporated) | 422 | 2.1% |
| Self-Employed (Not Incorporated) | 755 | 3.8% |
| Not-for-profit Organizations | 1,839 | 9.3% |
| Local Government Employees | 1,469 | 7.4% |
| State Government Employees | 653 | 3.3% |
| Federal Government Employees | 738 | 3.7% |
| Unpaid Family Workers | 34 | 0.2% |
| Total | 19,845 | 100.0% |
Employment Status by Age in Moline
According to the labor force statistics for Moline, out of the total population over 16 years of age (33,725), 64.4% or 21,719 individuals are in the labor force, with 6.7% or 1,455 of them unemployed. The age group with the highest labor force participation rate is 25 to 29 years, with 89.0% or 2,363 individuals in the labor force. Within the labor force, the 75 years and over age range has the highest percentage of unemployed individuals, with 18.8% or 45 of them being unemployed.
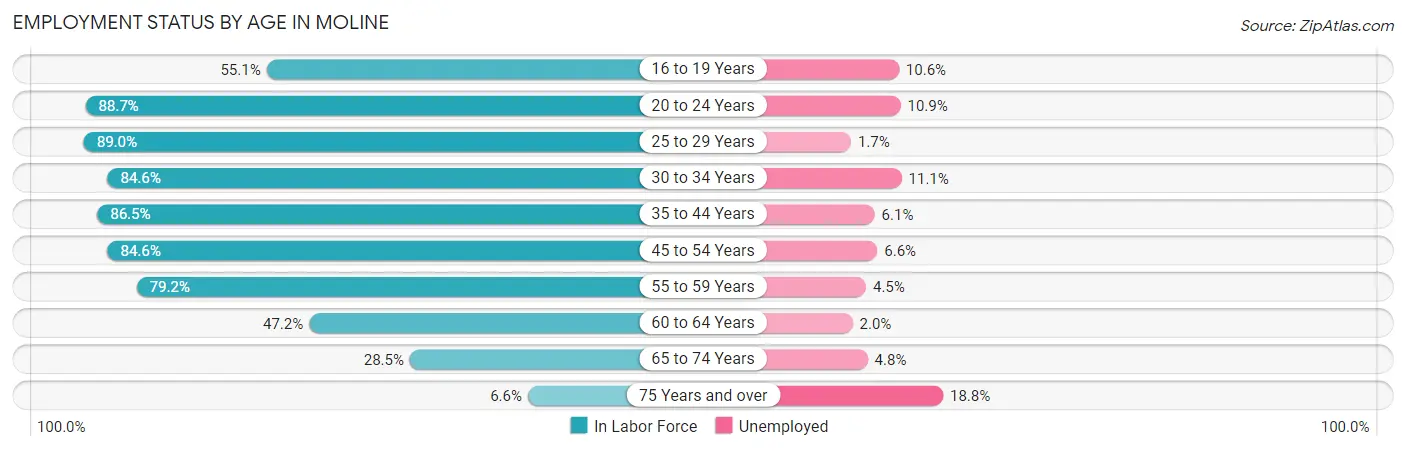
| Age Bracket | In Labor Force | Unemployed |
| 16 to 19 Years | 985 (55.1%) | 104 (10.6%) |
| 20 to 24 Years | 2,045 (88.7%) | 223 (10.9%) |
| 25 to 29 Years | 2,363 (89.0%) | 40 (1.7%) |
| 30 to 34 Years | 2,702 (84.6%) | 300 (11.1%) |
| 35 to 44 Years | 4,930 (86.5%) | 301 (6.1%) |
| 45 to 54 Years | 3,887 (84.6%) | 257 (6.6%) |
| 55 to 59 Years | 1,936 (79.2%) | 87 (4.5%) |
| 60 to 64 Years | 1,330 (47.2%) | 27 (2.0%) |
| 65 to 74 Years | 1,314 (28.5%) | 63 (4.8%) |
| 75 Years and over | 239 (6.6%) | 45 (18.8%) |
| Total | 21,719 (64.4%) | 1,455 (6.7%) |
Employment Status by Educational Attainment in Moline
According to labor force statistics for Moline, 80.1% of individuals (17,146) out of the total population between 25 and 64 years of age (21,406) are in the labor force, with 5.9% or 1,012 of them being unemployed. The group with the highest labor force participation rate are those with the educational attainment of bachelor's degree or higher, with 85.8% or 5,047 individuals in the labor force. Within the labor force, individuals with less than high school education have the highest percentage of unemployment, with 20.4% or 319 of them being unemployed.
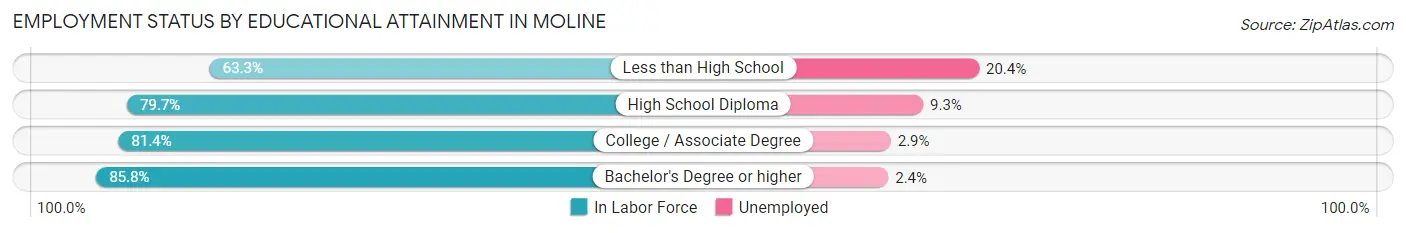
| Educational Attainment | In Labor Force | Unemployed |
| Less than High School | 1,564 (63.3%) | 504 (20.4%) |
| High School Diploma | 4,135 (79.7%) | 482 (9.3%) |
| College / Associate Degree | 6,402 (81.4%) | 228 (2.9%) |
| Bachelor's Degree or higher | 5,047 (85.8%) | 141 (2.4%) |
| Total | 17,146 (80.1%) | 1,263 (5.9%) |
Employment Occupations by Sex in Moline
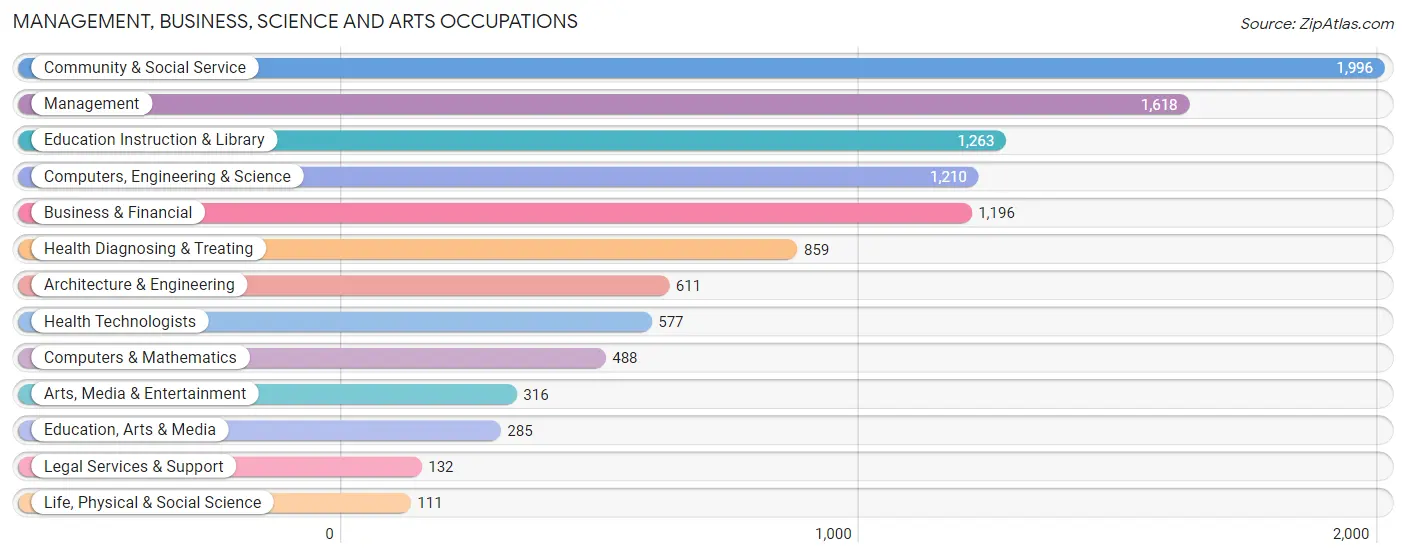
Management, Business, Science and Arts Occupations
The most common Management, Business, Science and Arts occupations in Moline are Community & Social Service (1,996 | 9.9%), Management (1,618 | 8.0%), Education Instruction & Library (1,263 | 6.2%), Computers, Engineering & Science (1,210 | 6.0%), and Business & Financial (1,196 | 5.9%).
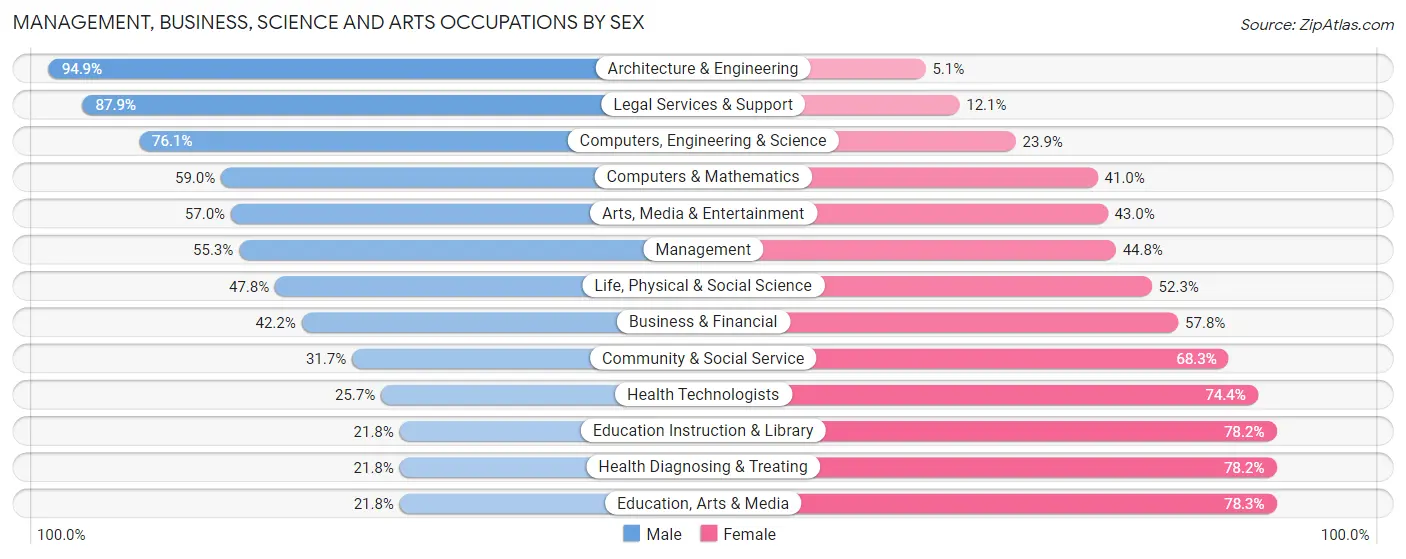
Management, Business, Science and Arts Occupations by Sex
Within the Management, Business, Science and Arts occupations in Moline, the most male-oriented occupations are Architecture & Engineering (94.9%), Legal Services & Support (87.9%), and Computers, Engineering & Science (76.1%), while the most female-oriented occupations are Education, Arts & Media (78.2%), Education Instruction & Library (78.2%), and Health Diagnosing & Treating (78.2%).
| Occupation | Male | Female |
| Management | 894 (55.2%) | 724 (44.8%) |
| Business & Financial | 505 (42.2%) | 691 (57.8%) |
| Computers, Engineering & Science | 921 (76.1%) | 289 (23.9%) |
| Computers & Mathematics | 288 (59.0%) | 200 (41.0%) |
| Architecture & Engineering | 580 (94.9%) | 31 (5.1%) |
| Life, Physical & Social Science | 53 (47.7%) | 58 (52.2%) |
| Community & Social Service | 633 (31.7%) | 1,363 (68.3%) |
| Education, Arts & Media | 62 (21.7%) | 223 (78.2%) |
| Legal Services & Support | 116 (87.9%) | 16 (12.1%) |
| Education Instruction & Library | 275 (21.8%) | 988 (78.2%) |
| Arts, Media & Entertainment | 180 (57.0%) | 136 (43.0%) |
| Health Diagnosing & Treating | 187 (21.8%) | 672 (78.2%) |
| Health Technologists | 148 (25.7%) | 429 (74.4%) |
| Total (Category) | 3,140 (45.7%) | 3,739 (54.3%) |
| Total (Overall) | 10,806 (53.4%) | 9,428 (46.6%) |
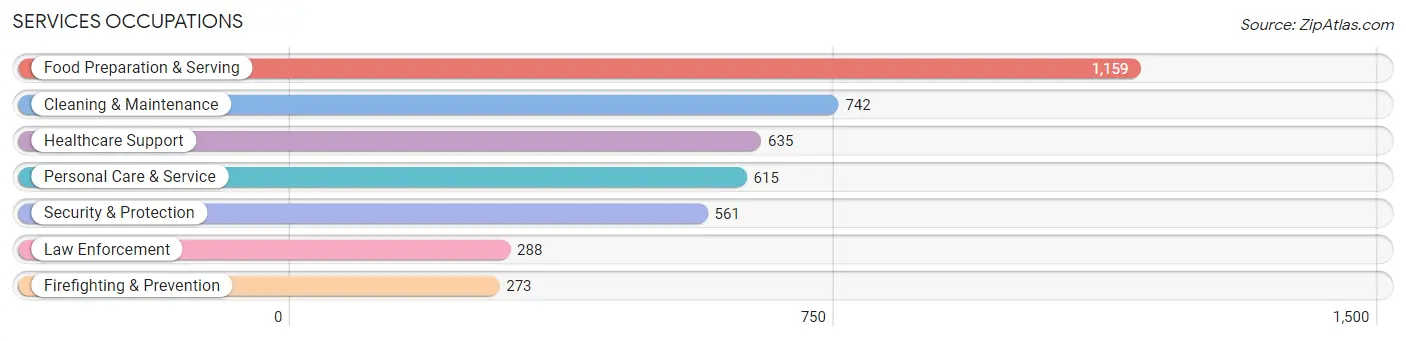
Services Occupations
The most common Services occupations in Moline are Food Preparation & Serving (1,159 | 5.7%), Cleaning & Maintenance (742 | 3.7%), Healthcare Support (635 | 3.1%), Personal Care & Service (615 | 3.0%), and Security & Protection (561 | 2.8%).
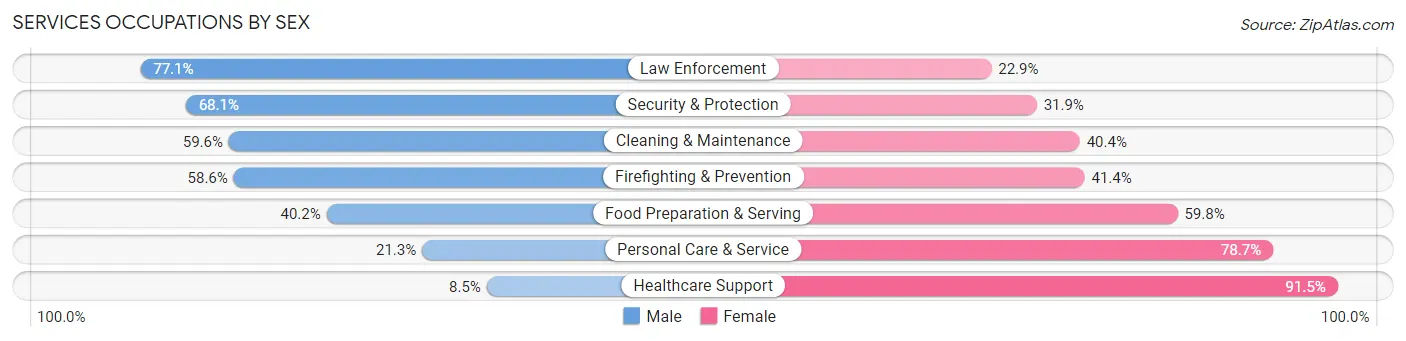
Services Occupations by Sex
Within the Services occupations in Moline, the most male-oriented occupations are Law Enforcement (77.1%), Security & Protection (68.1%), and Cleaning & Maintenance (59.6%), while the most female-oriented occupations are Healthcare Support (91.5%), Personal Care & Service (78.7%), and Food Preparation & Serving (59.8%).
| Occupation | Male | Female |
| Healthcare Support | 54 (8.5%) | 581 (91.5%) |
| Security & Protection | 382 (68.1%) | 179 (31.9%) |
| Firefighting & Prevention | 160 (58.6%) | 113 (41.4%) |
| Law Enforcement | 222 (77.1%) | 66 (22.9%) |
| Food Preparation & Serving | 466 (40.2%) | 693 (59.8%) |
| Cleaning & Maintenance | 442 (59.6%) | 300 (40.4%) |
| Personal Care & Service | 131 (21.3%) | 484 (78.7%) |
| Total (Category) | 1,475 (39.7%) | 2,237 (60.3%) |
| Total (Overall) | 10,806 (53.4%) | 9,428 (46.6%) |
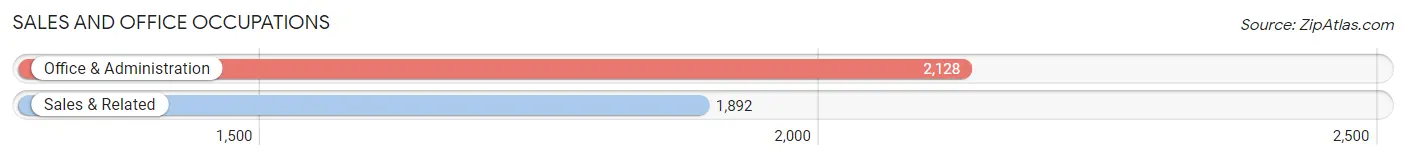
Sales and Office Occupations
The most common Sales and Office occupations in Moline are Office & Administration (2,128 | 10.5%), and Sales & Related (1,892 | 9.3%).
Sales and Office Occupations by Sex
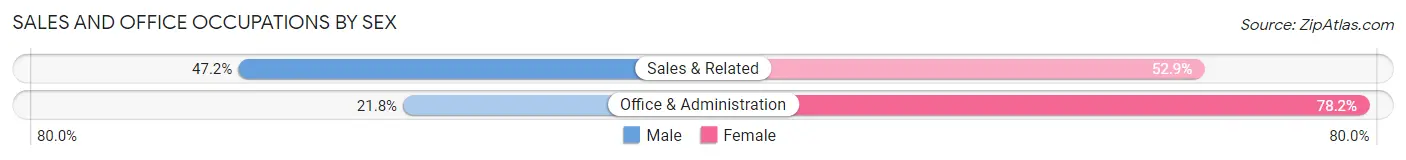
| Occupation | Male | Female |
| Sales & Related | 892 (47.1%) | 1,000 (52.8%) |
| Office & Administration | 464 (21.8%) | 1,664 (78.2%) |
| Total (Category) | 1,356 (33.7%) | 2,664 (66.3%) |
| Total (Overall) | 10,806 (53.4%) | 9,428 (46.6%) |
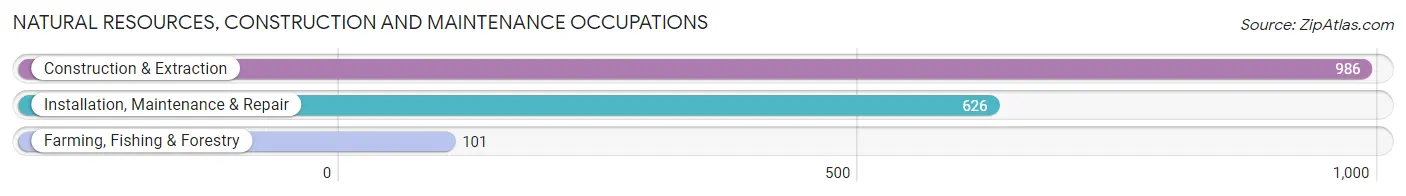
Natural Resources, Construction and Maintenance Occupations
The most common Natural Resources, Construction and Maintenance occupations in Moline are Construction & Extraction (986 | 4.9%), Installation, Maintenance & Repair (626 | 3.1%), and Farming, Fishing & Forestry (101 | 0.5%).
Natural Resources, Construction and Maintenance Occupations by Sex
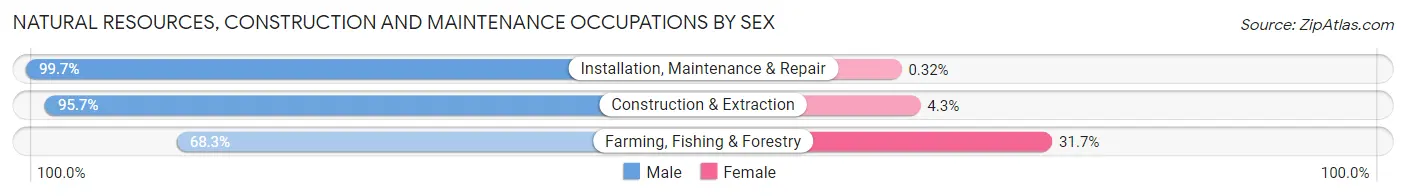
| Occupation | Male | Female |
| Farming, Fishing & Forestry | 69 (68.3%) | 32 (31.7%) |
| Construction & Extraction | 944 (95.7%) | 42 (4.3%) |
| Installation, Maintenance & Repair | 624 (99.7%) | 2 (0.3%) |
| Total (Category) | 1,637 (95.6%) | 76 (4.4%) |
| Total (Overall) | 10,806 (53.4%) | 9,428 (46.6%) |
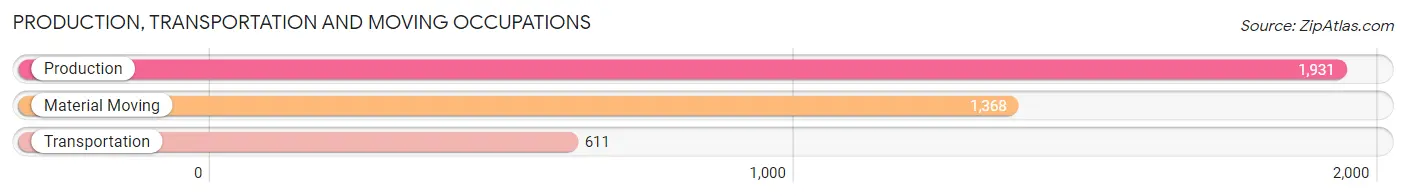
Production, Transportation and Moving Occupations
The most common Production, Transportation and Moving occupations in Moline are Production (1,931 | 9.5%), Material Moving (1,368 | 6.8%), and Transportation (611 | 3.0%).
Production, Transportation and Moving Occupations by Sex
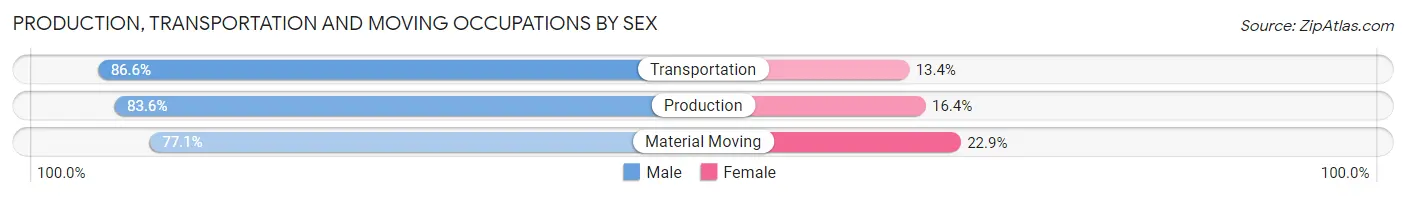
| Occupation | Male | Female |
| Production | 1,614 (83.6%) | 317 (16.4%) |
| Transportation | 529 (86.6%) | 82 (13.4%) |
| Material Moving | 1,055 (77.1%) | 313 (22.9%) |
| Total (Category) | 3,198 (81.8%) | 712 (18.2%) |
| Total (Overall) | 10,806 (53.4%) | 9,428 (46.6%) |
Employment Industries by Sex in Moline
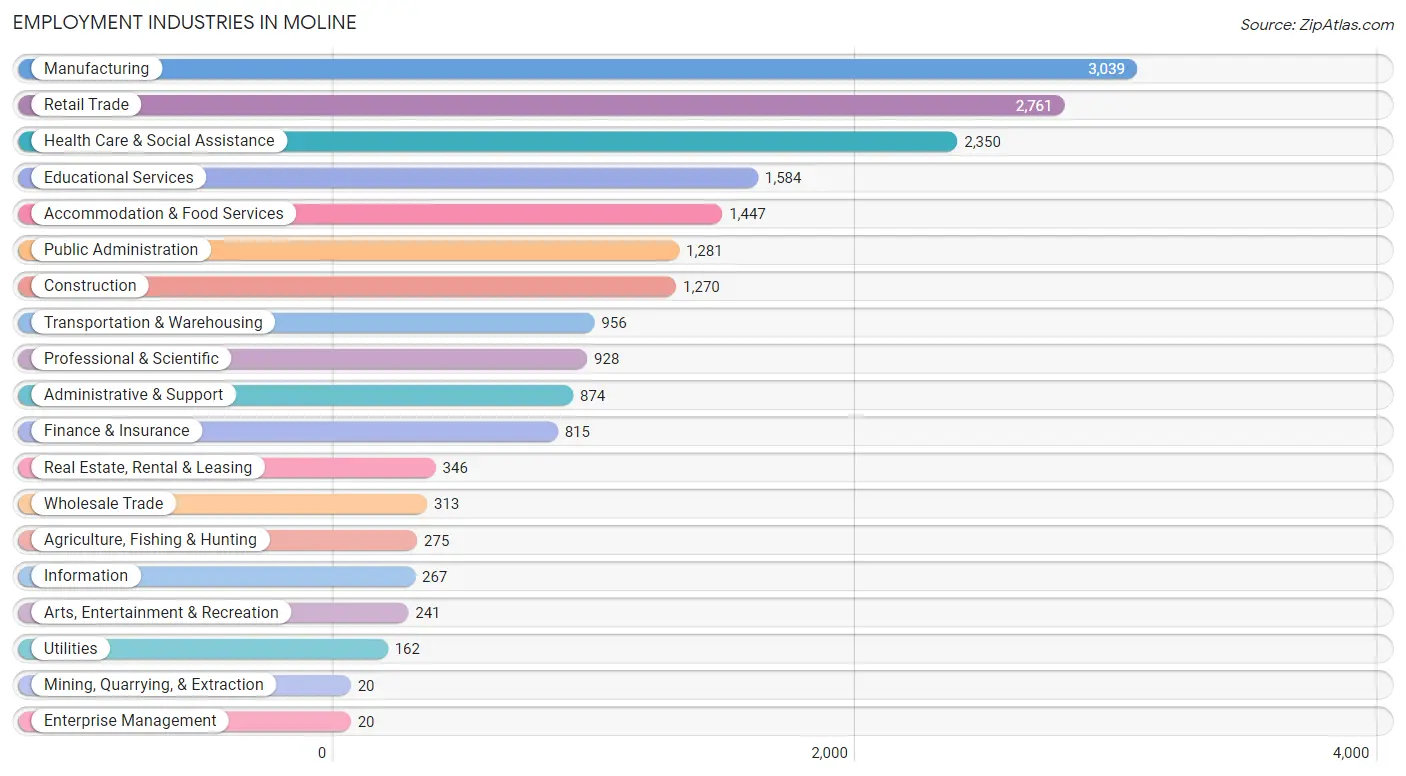
Employment Industries in Moline
The major employment industries in Moline include Manufacturing (3,039 | 15.0%), Retail Trade (2,761 | 13.7%), Health Care & Social Assistance (2,350 | 11.6%), Educational Services (1,584 | 7.8%), and Accommodation & Food Services (1,447 | 7.1%).
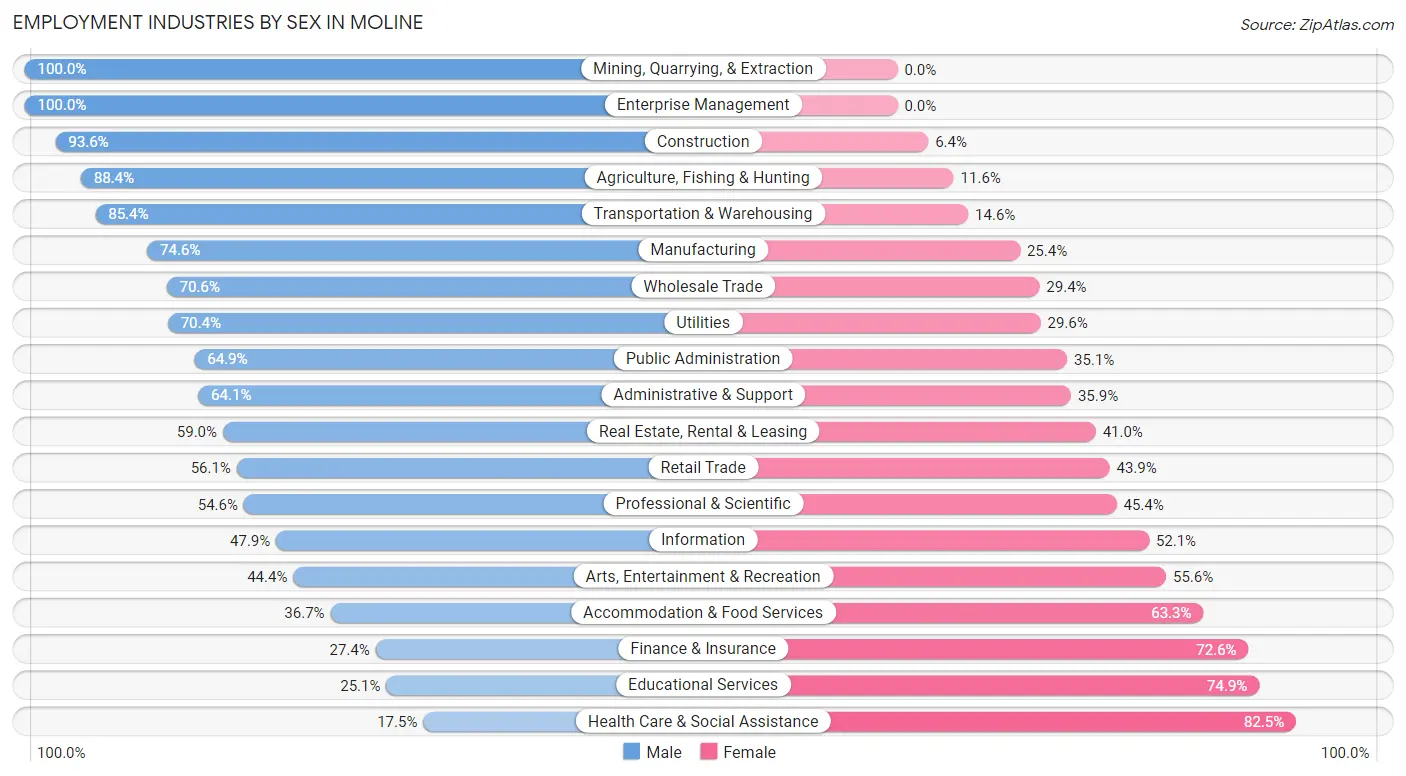
Employment Industries by Sex in Moline
The Moline industries that see more men than women are Mining, Quarrying, & Extraction (100.0%), Enterprise Management (100.0%), and Construction (93.6%), whereas the industries that tend to have a higher number of women are Health Care & Social Assistance (82.5%), Educational Services (74.9%), and Finance & Insurance (72.6%).
| Industry | Male | Female |
| Agriculture, Fishing & Hunting | 243 (88.4%) | 32 (11.6%) |
| Mining, Quarrying, & Extraction | 20 (100.0%) | 0 (0.0%) |
| Construction | 1,189 (93.6%) | 81 (6.4%) |
| Manufacturing | 2,268 (74.6%) | 771 (25.4%) |
| Wholesale Trade | 221 (70.6%) | 92 (29.4%) |
| Retail Trade | 1,549 (56.1%) | 1,212 (43.9%) |
| Transportation & Warehousing | 816 (85.4%) | 140 (14.6%) |
| Utilities | 114 (70.4%) | 48 (29.6%) |
| Information | 128 (47.9%) | 139 (52.1%) |
| Finance & Insurance | 223 (27.4%) | 592 (72.6%) |
| Real Estate, Rental & Leasing | 204 (59.0%) | 142 (41.0%) |
| Professional & Scientific | 507 (54.6%) | 421 (45.4%) |
| Enterprise Management | 20 (100.0%) | 0 (0.0%) |
| Administrative & Support | 560 (64.1%) | 314 (35.9%) |
| Educational Services | 398 (25.1%) | 1,186 (74.9%) |
| Health Care & Social Assistance | 411 (17.5%) | 1,939 (82.5%) |
| Arts, Entertainment & Recreation | 107 (44.4%) | 134 (55.6%) |
| Accommodation & Food Services | 531 (36.7%) | 916 (63.3%) |
| Public Administration | 831 (64.9%) | 450 (35.1%) |
| Total | 10,806 (53.4%) | 9,428 (46.6%) |
Education in Moline
School Enrollment in Moline
The most common levels of schooling among the 9,665 students in Moline are middle school (2,242 | 23.2%), elementary school (2,134 | 22.1%), and high school (2,030 | 21.0%).
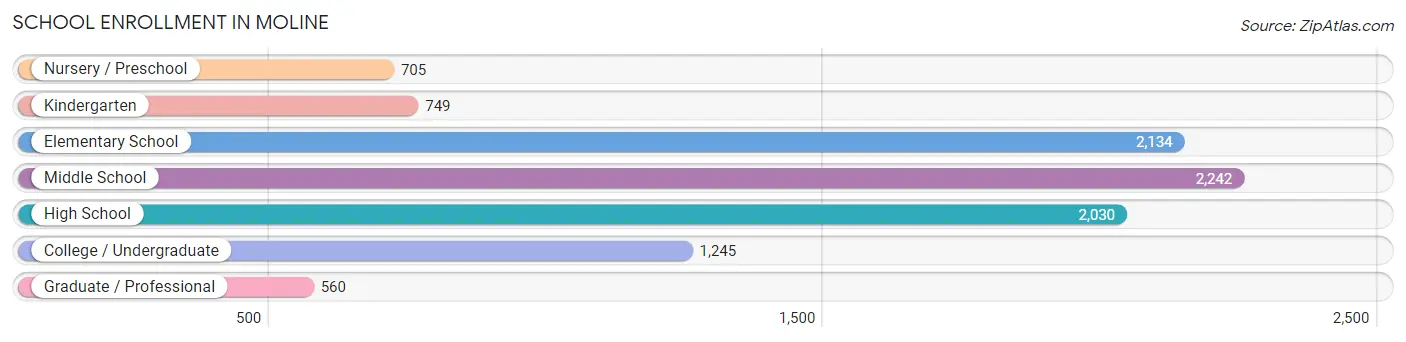
| School Level | # Students | % Students |
| Nursery / Preschool | 705 | 7.3% |
| Kindergarten | 749 | 7.7% |
| Elementary School | 2,134 | 22.1% |
| Middle School | 2,242 | 23.2% |
| High School | 2,030 | 21.0% |
| College / Undergraduate | 1,245 | 12.9% |
| Graduate / Professional | 560 | 5.8% |
| Total | 9,665 | 100.0% |
School Enrollment by Age by Funding Source in Moline
Out of a total of 9,665 students who are enrolled in schools in Moline, 1,527 (15.8%) attend a private institution, while the remaining 8,138 (84.2%) are enrolled in public schools. The age group of 35 years and over has the highest likelihood of being enrolled in private schools, with 131 (32.4% in the age bracket) enrolled. Conversely, the age group of 18 to 19 year olds has the lowest likelihood of being enrolled in a private school, with 359 (96.3% in the age bracket) attending a public institution.
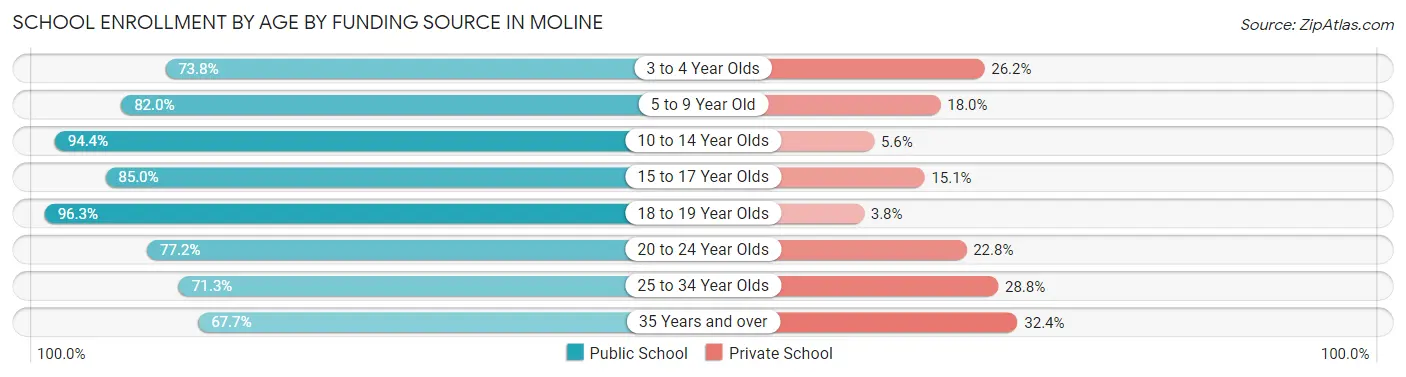
| Age Bracket | Public School | Private School |
| 3 to 4 Year Olds | 386 (73.8%) | 137 (26.2%) |
| 5 to 9 Year Old | 2,427 (82.0%) | 533 (18.0%) |
| 10 to 14 Year Olds | 2,408 (94.4%) | 144 (5.6%) |
| 15 to 17 Year Olds | 1,310 (85.0%) | 232 (15.0%) |
| 18 to 19 Year Olds | 359 (96.3%) | 14 (3.7%) |
| 20 to 24 Year Olds | 568 (77.2%) | 168 (22.8%) |
| 25 to 34 Year Olds | 409 (71.3%) | 165 (28.7%) |
| 35 Years and over | 274 (67.6%) | 131 (32.4%) |
| Total | 8,138 (84.2%) | 1,527 (15.8%) |
Educational Attainment by Field of Study in Moline
Education (1,534 | 16.4%), business (1,430 | 15.3%), social sciences (1,000 | 10.7%), arts & humanities (834 | 8.9%), and science & technology (704 | 7.5%) are the most common fields of study among 9,342 individuals in Moline who have obtained a bachelor's degree or higher.
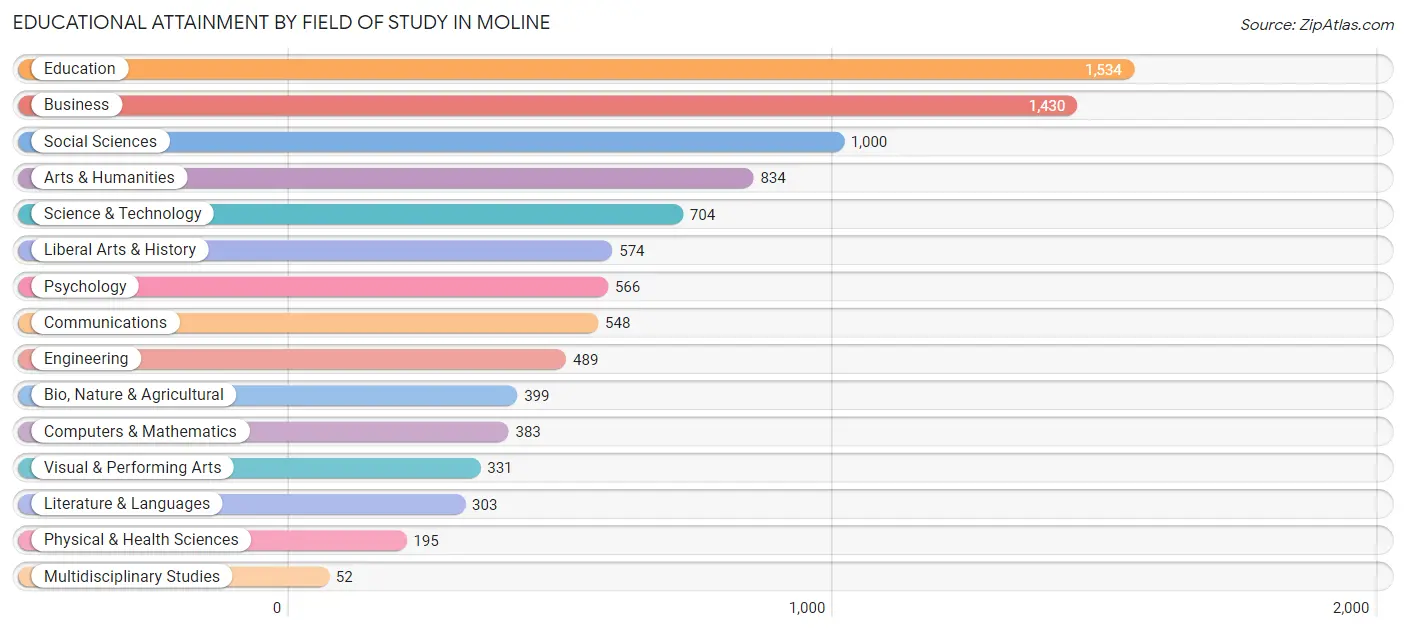
| Field of Study | # Graduates | % Graduates |
| Computers & Mathematics | 383 | 4.1% |
| Bio, Nature & Agricultural | 399 | 4.3% |
| Physical & Health Sciences | 195 | 2.1% |
| Psychology | 566 | 6.1% |
| Social Sciences | 1,000 | 10.7% |
| Engineering | 489 | 5.2% |
| Multidisciplinary Studies | 52 | 0.6% |
| Science & Technology | 704 | 7.5% |
| Business | 1,430 | 15.3% |
| Education | 1,534 | 16.4% |
| Literature & Languages | 303 | 3.2% |
| Liberal Arts & History | 574 | 6.1% |
| Visual & Performing Arts | 331 | 3.5% |
| Communications | 548 | 5.9% |
| Arts & Humanities | 834 | 8.9% |
| Total | 9,342 | 100.0% |
Transportation & Commute in Moline
Vehicle Availability by Sex in Moline
The most prevalent vehicle ownership categories in Moline are males with 2 vehicles (5,147, accounting for 47.9%) and females with 2 vehicles (3,972, making up 56.6%).
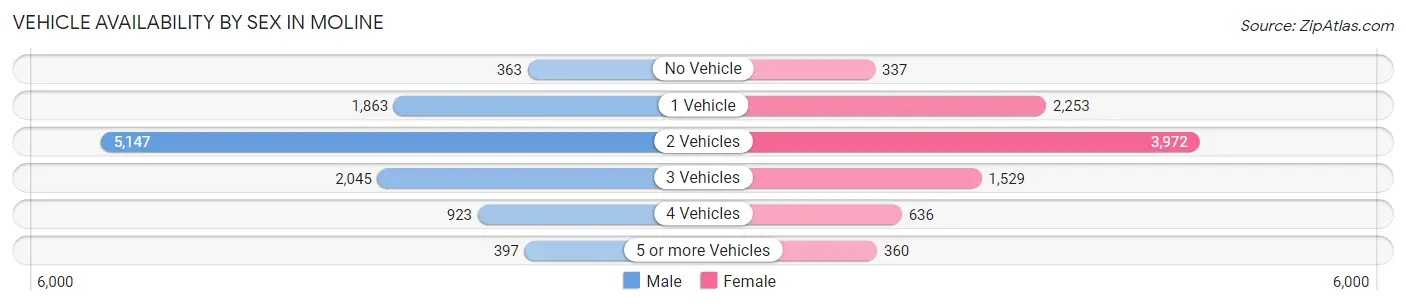
| Vehicles Available | Male | Female |
| No Vehicle | 363 (3.4%) | 337 (3.7%) |
| 1 Vehicle | 1,863 (17.3%) | 2,253 (24.8%) |
| 2 Vehicles | 5,147 (47.9%) | 3,972 (43.7%) |
| 3 Vehicles | 2,045 (19.0%) | 1,529 (16.8%) |
| 4 Vehicles | 923 (8.6%) | 636 (7.0%) |
| 5 or more Vehicles | 397 (3.7%) | 360 (4.0%) |
| Total | 10,738 (100.0%) | 9,087 (100.0%) |
Commute Time in Moline
The most frequently occuring commute durations in Moline are 15 to 19 minutes (5,039 commuters, 27.0%), 10 to 14 minutes (3,877 commuters, 20.7%), and 5 to 9 minutes (2,924 commuters, 15.6%).
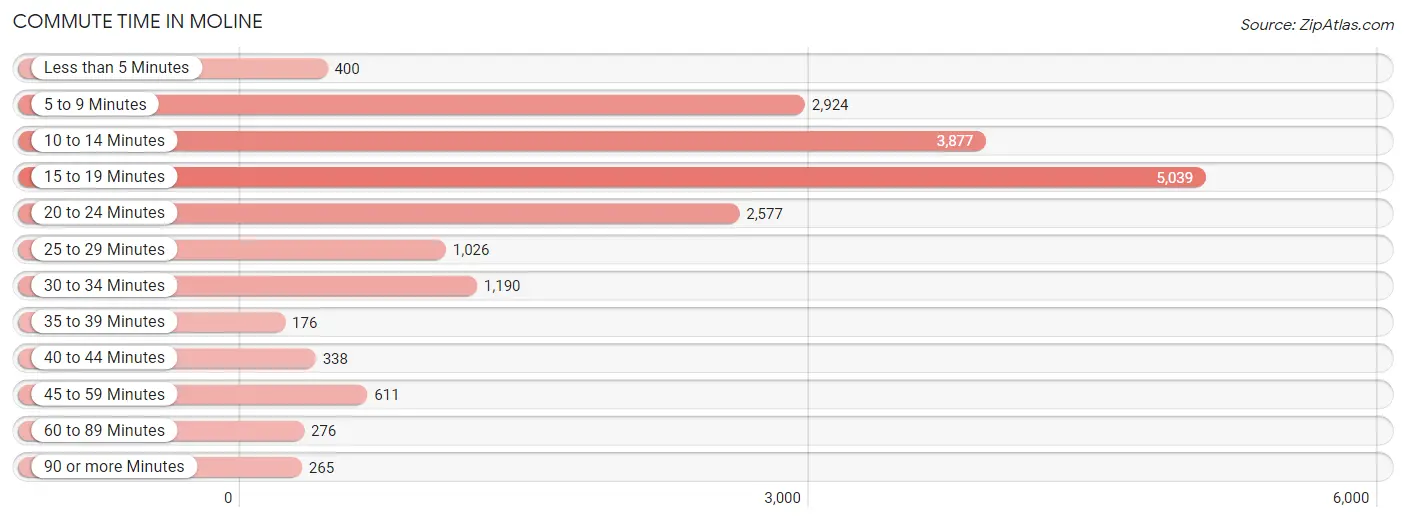
| Commute Time | # Commuters | % Commuters |
| Less than 5 Minutes | 400 | 2.1% |
| 5 to 9 Minutes | 2,924 | 15.6% |
| 10 to 14 Minutes | 3,877 | 20.7% |
| 15 to 19 Minutes | 5,039 | 27.0% |
| 20 to 24 Minutes | 2,577 | 13.8% |
| 25 to 29 Minutes | 1,026 | 5.5% |
| 30 to 34 Minutes | 1,190 | 6.4% |
| 35 to 39 Minutes | 176 | 0.9% |
| 40 to 44 Minutes | 338 | 1.8% |
| 45 to 59 Minutes | 611 | 3.3% |
| 60 to 89 Minutes | 276 | 1.5% |
| 90 or more Minutes | 265 | 1.4% |
Commute Time by Sex in Moline
The most common commute times in Moline are 15 to 19 minutes (2,943 commuters, 28.6%) for males and 10 to 14 minutes (2,120 commuters, 25.2%) for females.
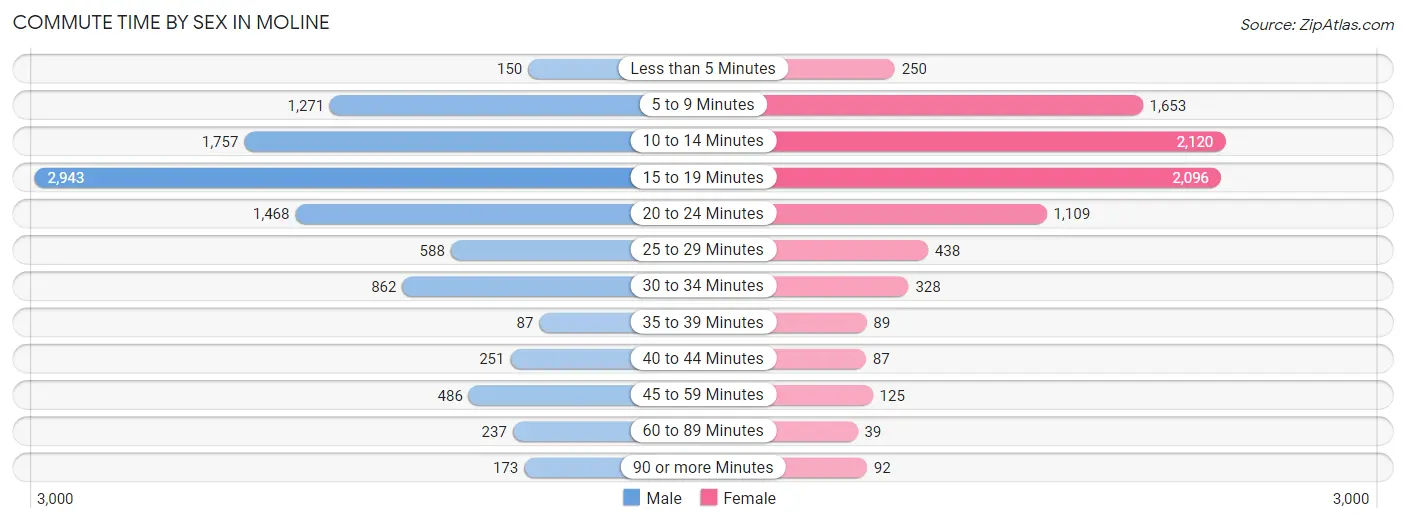
| Commute Time | Male | Female |
| Less than 5 Minutes | 150 (1.5%) | 250 (3.0%) |
| 5 to 9 Minutes | 1,271 (12.4%) | 1,653 (19.6%) |
| 10 to 14 Minutes | 1,757 (17.1%) | 2,120 (25.2%) |
| 15 to 19 Minutes | 2,943 (28.6%) | 2,096 (24.9%) |
| 20 to 24 Minutes | 1,468 (14.3%) | 1,109 (13.2%) |
| 25 to 29 Minutes | 588 (5.7%) | 438 (5.2%) |
| 30 to 34 Minutes | 862 (8.4%) | 328 (3.9%) |
| 35 to 39 Minutes | 87 (0.9%) | 89 (1.1%) |
| 40 to 44 Minutes | 251 (2.4%) | 87 (1.0%) |
| 45 to 59 Minutes | 486 (4.7%) | 125 (1.5%) |
| 60 to 89 Minutes | 237 (2.3%) | 39 (0.5%) |
| 90 or more Minutes | 173 (1.7%) | 92 (1.1%) |
Time of Departure to Work by Sex in Moline
The most frequent times of departure to work in Moline are 7:30 AM to 7:59 AM (1,263, 12.3%) for males and 7:30 AM to 7:59 AM (1,665, 19.8%) for females.
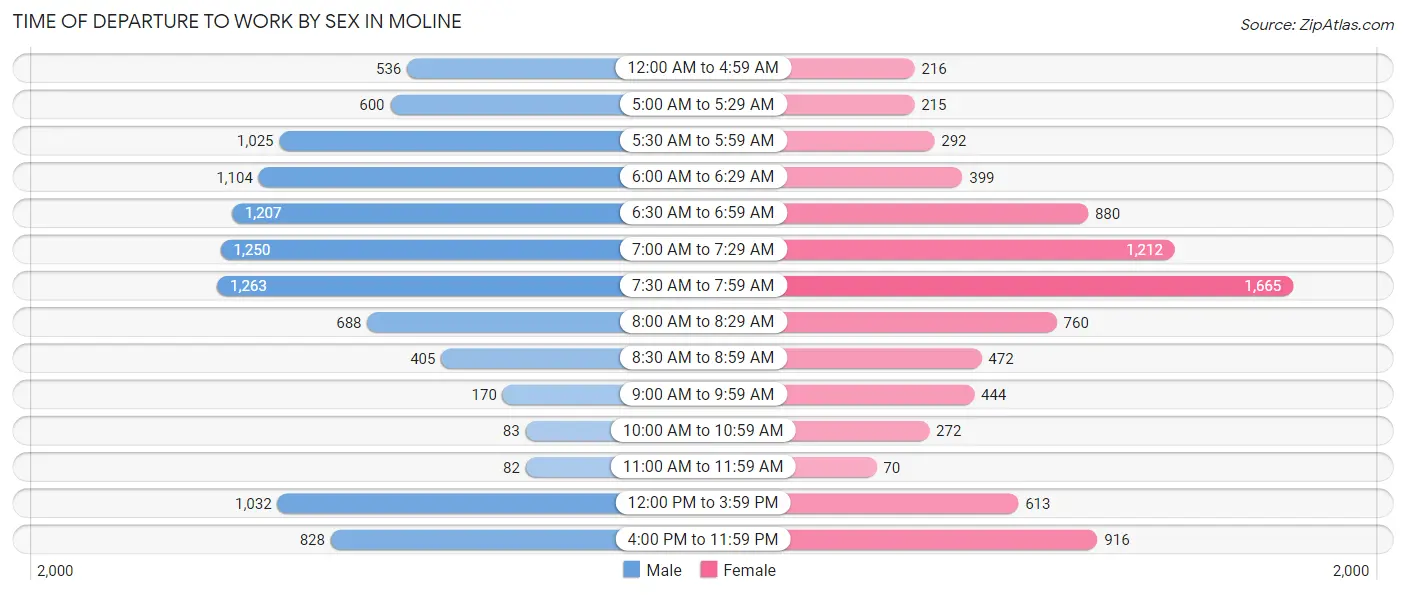
| Time of Departure | Male | Female |
| 12:00 AM to 4:59 AM | 536 (5.2%) | 216 (2.6%) |
| 5:00 AM to 5:29 AM | 600 (5.8%) | 215 (2.5%) |
| 5:30 AM to 5:59 AM | 1,025 (10.0%) | 292 (3.5%) |
| 6:00 AM to 6:29 AM | 1,104 (10.7%) | 399 (4.7%) |
| 6:30 AM to 6:59 AM | 1,207 (11.7%) | 880 (10.4%) |
| 7:00 AM to 7:29 AM | 1,250 (12.2%) | 1,212 (14.4%) |
| 7:30 AM to 7:59 AM | 1,263 (12.3%) | 1,665 (19.8%) |
| 8:00 AM to 8:29 AM | 688 (6.7%) | 760 (9.0%) |
| 8:30 AM to 8:59 AM | 405 (3.9%) | 472 (5.6%) |
| 9:00 AM to 9:59 AM | 170 (1.7%) | 444 (5.3%) |
| 10:00 AM to 10:59 AM | 83 (0.8%) | 272 (3.2%) |
| 11:00 AM to 11:59 AM | 82 (0.8%) | 70 (0.8%) |
| 12:00 PM to 3:59 PM | 1,032 (10.1%) | 613 (7.3%) |
| 4:00 PM to 11:59 PM | 828 (8.1%) | 916 (10.9%) |
| Total | 10,273 (100.0%) | 8,426 (100.0%) |
Housing Occupancy in Moline
Occupancy by Ownership in Moline
Of the total 18,267 dwellings in Moline, owner-occupied units account for 12,120 (66.3%), while renter-occupied units make up 6,147 (33.7%).
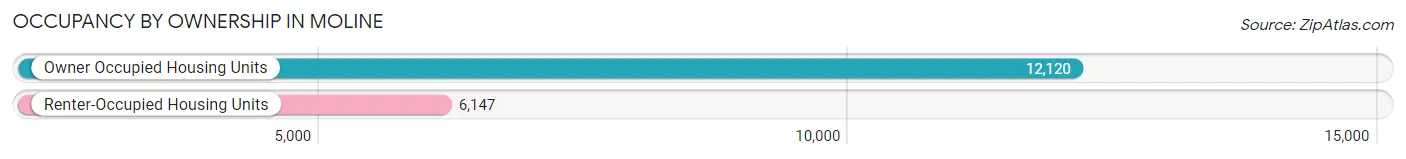
| Occupancy | # Housing Units | % Housing Units |
| Owner Occupied Housing Units | 12,120 | 66.3% |
| Renter-Occupied Housing Units | 6,147 | 33.7% |
| Total Occupied Housing Units | 18,267 | 100.0% |
Occupancy by Household Size in Moline
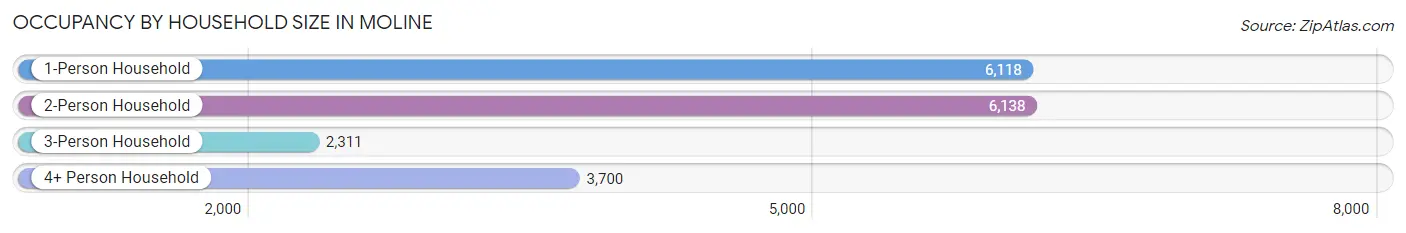
| Household Size | # Housing Units | % Housing Units |
| 1-Person Household | 6,118 | 33.5% |
| 2-Person Household | 6,138 | 33.6% |
| 3-Person Household | 2,311 | 12.7% |
| 4+ Person Household | 3,700 | 20.3% |
| Total Housing Units | 18,267 | 100.0% |
Occupancy by Ownership by Household Size in Moline
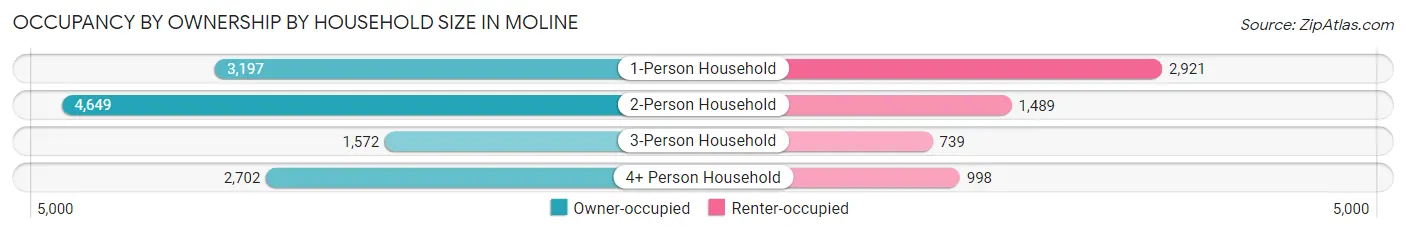
| Household Size | Owner-occupied | Renter-occupied |
| 1-Person Household | 3,197 (52.3%) | 2,921 (47.7%) |
| 2-Person Household | 4,649 (75.7%) | 1,489 (24.3%) |
| 3-Person Household | 1,572 (68.0%) | 739 (32.0%) |
| 4+ Person Household | 2,702 (73.0%) | 998 (27.0%) |
| Total Housing Units | 12,120 (66.3%) | 6,147 (33.7%) |
Occupancy by Educational Attainment in Moline
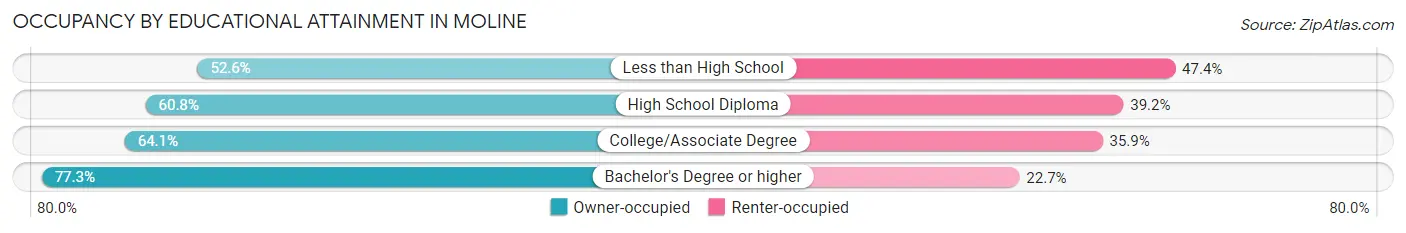
| Household Size | Owner-occupied | Renter-occupied |
| Less than High School | 836 (52.6%) | 754 (47.4%) |
| High School Diploma | 2,575 (60.8%) | 1,660 (39.2%) |
| College/Associate Degree | 4,404 (64.1%) | 2,467 (35.9%) |
| Bachelor's Degree or higher | 4,305 (77.3%) | 1,266 (22.7%) |
Occupancy by Age of Householder in Moline
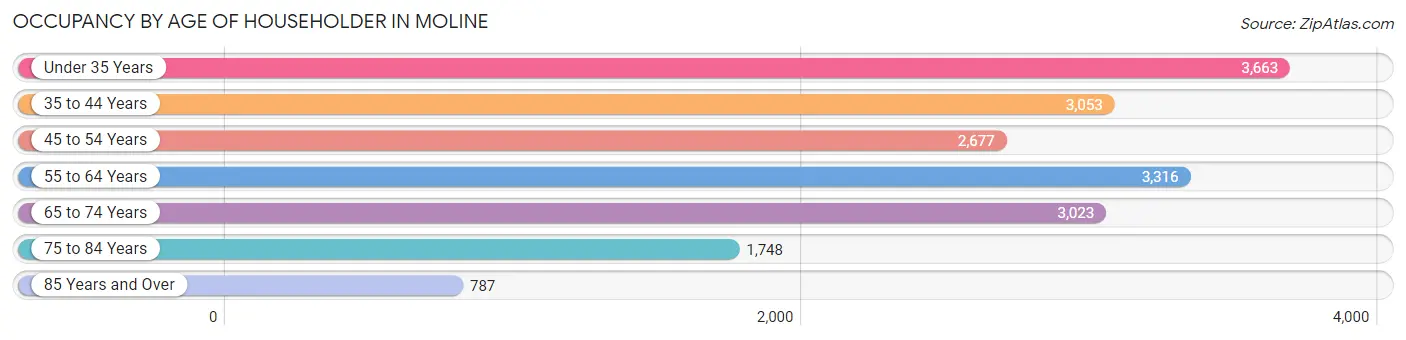
| Age Bracket | # Households | % Households |
| Under 35 Years | 3,663 | 20.1% |
| 35 to 44 Years | 3,053 | 16.7% |
| 45 to 54 Years | 2,677 | 14.6% |
| 55 to 64 Years | 3,316 | 18.1% |
| 65 to 74 Years | 3,023 | 16.6% |
| 75 to 84 Years | 1,748 | 9.6% |
| 85 Years and Over | 787 | 4.3% |
| Total | 18,267 | 100.0% |
Housing Finances in Moline
Median Income by Occupancy in Moline
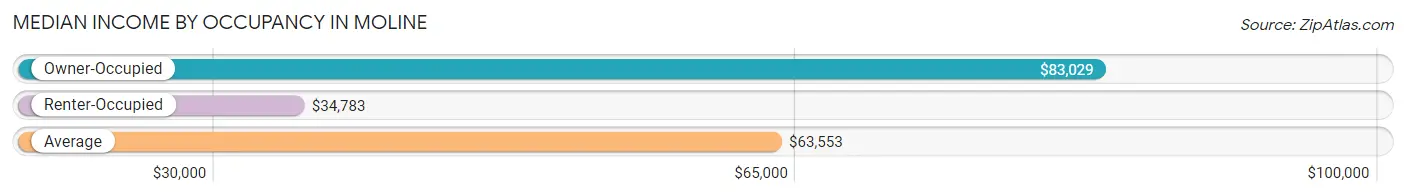
| Occupancy Type | # Households | Median Income |
| Owner-Occupied | 12,120 (66.3%) | $83,029 |
| Renter-Occupied | 6,147 (33.7%) | $34,783 |
| Average | 18,267 (100.0%) | $63,553 |
Occupancy by Householder Income Bracket in Moline
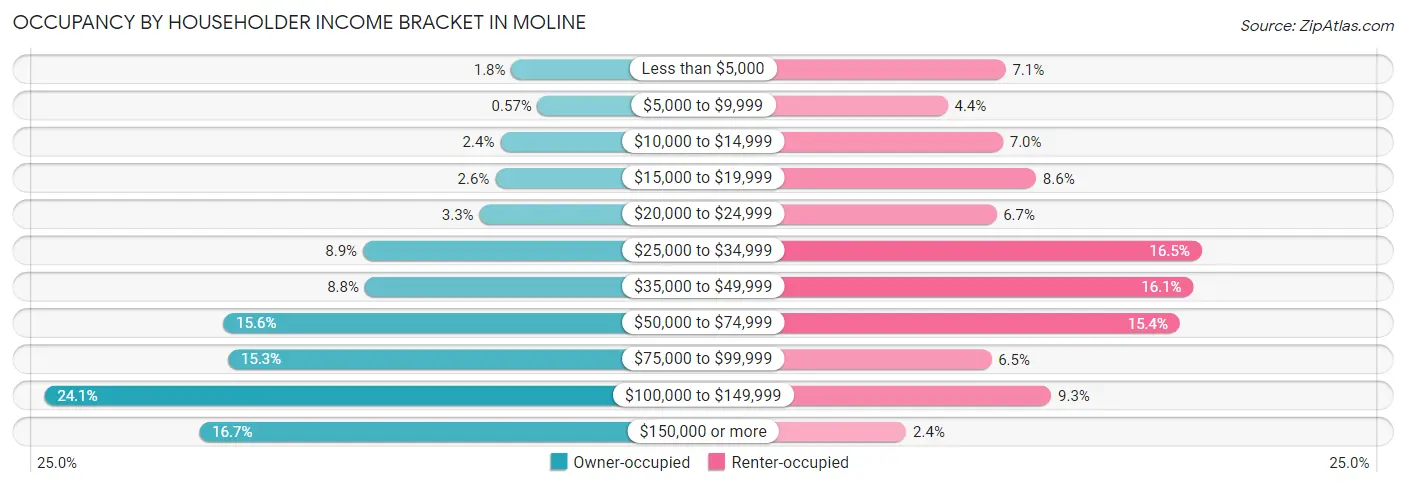
| Income Bracket | Owner-occupied | Renter-occupied |
| Less than $5,000 | 221 (1.8%) | 439 (7.1%) |
| $5,000 to $9,999 | 69 (0.6%) | 269 (4.4%) |
| $10,000 to $14,999 | 285 (2.4%) | 431 (7.0%) |
| $15,000 to $19,999 | 314 (2.6%) | 528 (8.6%) |
| $20,000 to $24,999 | 405 (3.3%) | 412 (6.7%) |
| $25,000 to $34,999 | 1,078 (8.9%) | 1,013 (16.5%) |
| $35,000 to $49,999 | 1,067 (8.8%) | 989 (16.1%) |
| $50,000 to $74,999 | 1,885 (15.5%) | 949 (15.4%) |
| $75,000 to $99,999 | 1,857 (15.3%) | 397 (6.5%) |
| $100,000 to $149,999 | 2,916 (24.1%) | 572 (9.3%) |
| $150,000 or more | 2,023 (16.7%) | 148 (2.4%) |
| Total | 12,120 (100.0%) | 6,147 (100.0%) |
Monthly Housing Cost Tiers in Moline
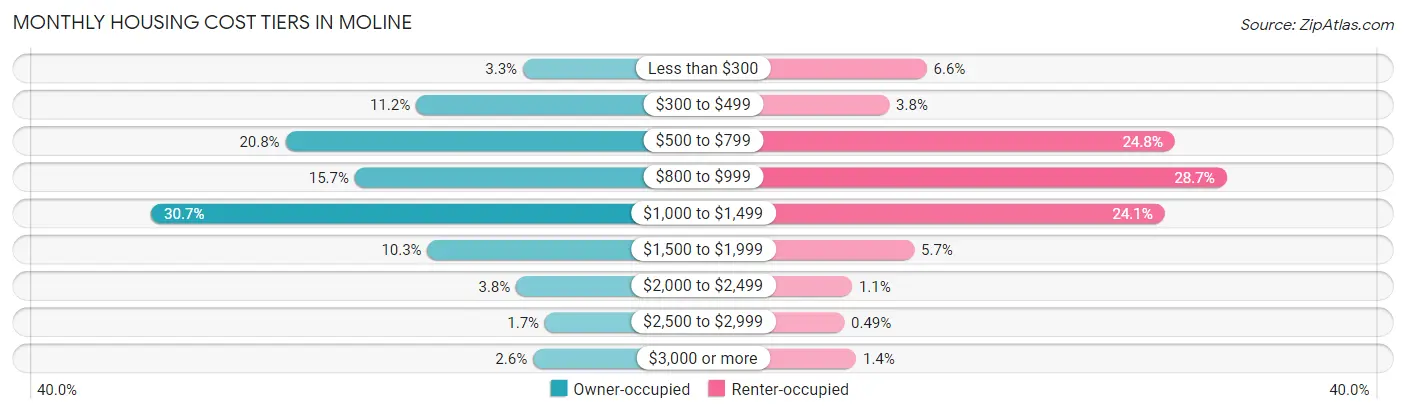
| Monthly Cost | Owner-occupied | Renter-occupied |
| Less than $300 | 400 (3.3%) | 404 (6.6%) |
| $300 to $499 | 1,354 (11.2%) | 234 (3.8%) |
| $500 to $799 | 2,520 (20.8%) | 1,527 (24.8%) |
| $800 to $999 | 1,900 (15.7%) | 1,761 (28.6%) |
| $1,000 to $1,499 | 3,719 (30.7%) | 1,481 (24.1%) |
| $1,500 to $1,999 | 1,252 (10.3%) | 347 (5.7%) |
| $2,000 to $2,499 | 461 (3.8%) | 66 (1.1%) |
| $2,500 to $2,999 | 204 (1.7%) | 30 (0.5%) |
| $3,000 or more | 310 (2.6%) | 84 (1.4%) |
| Total | 12,120 (100.0%) | 6,147 (100.0%) |
Physical Housing Characteristics in Moline
Housing Structures in Moline
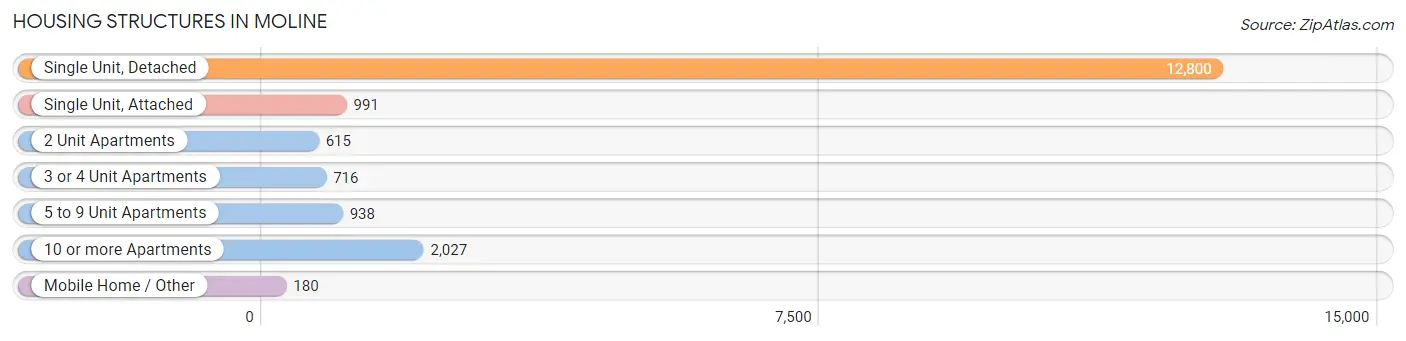
| Structure Type | # Housing Units | % Housing Units |
| Single Unit, Detached | 12,800 | 70.1% |
| Single Unit, Attached | 991 | 5.4% |
| 2 Unit Apartments | 615 | 3.4% |
| 3 or 4 Unit Apartments | 716 | 3.9% |
| 5 to 9 Unit Apartments | 938 | 5.1% |
| 10 or more Apartments | 2,027 | 11.1% |
| Mobile Home / Other | 180 | 1.0% |
| Total | 18,267 | 100.0% |
Housing Structures by Occupancy in Moline
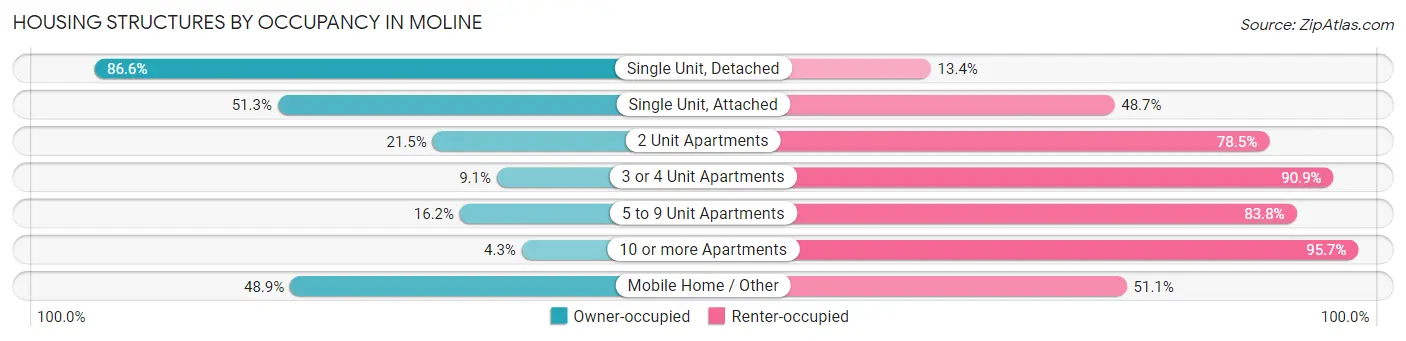
| Structure Type | Owner-occupied | Renter-occupied |
| Single Unit, Detached | 11,088 (86.6%) | 1,712 (13.4%) |
| Single Unit, Attached | 508 (51.3%) | 483 (48.7%) |
| 2 Unit Apartments | 132 (21.5%) | 483 (78.5%) |
| 3 or 4 Unit Apartments | 65 (9.1%) | 651 (90.9%) |
| 5 to 9 Unit Apartments | 152 (16.2%) | 786 (83.8%) |
| 10 or more Apartments | 87 (4.3%) | 1,940 (95.7%) |
| Mobile Home / Other | 88 (48.9%) | 92 (51.1%) |
| Total | 12,120 (66.3%) | 6,147 (33.7%) |
Housing Structures by Number of Rooms in Moline
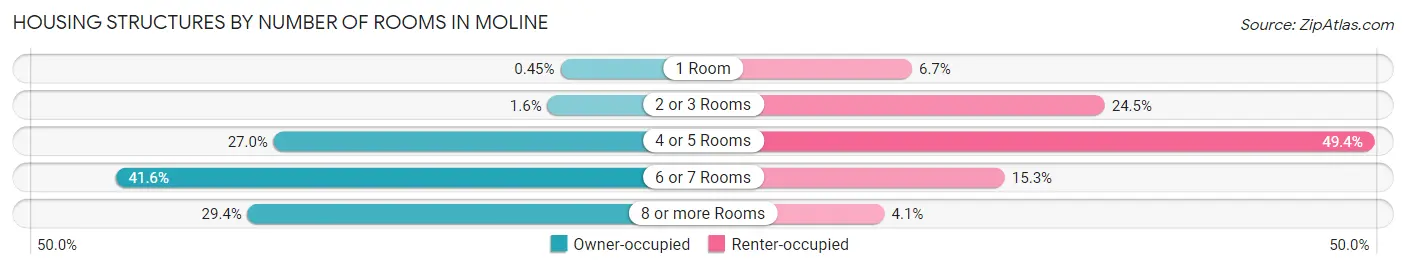
| Number of Rooms | Owner-occupied | Renter-occupied |
| 1 Room | 54 (0.4%) | 410 (6.7%) |
| 2 or 3 Rooms | 199 (1.6%) | 1,506 (24.5%) |
| 4 or 5 Rooms | 3,268 (27.0%) | 3,039 (49.4%) |
| 6 or 7 Rooms | 5,039 (41.6%) | 938 (15.3%) |
| 8 or more Rooms | 3,560 (29.4%) | 254 (4.1%) |
| Total | 12,120 (100.0%) | 6,147 (100.0%) |
Housing Structure by Heating Type in Moline
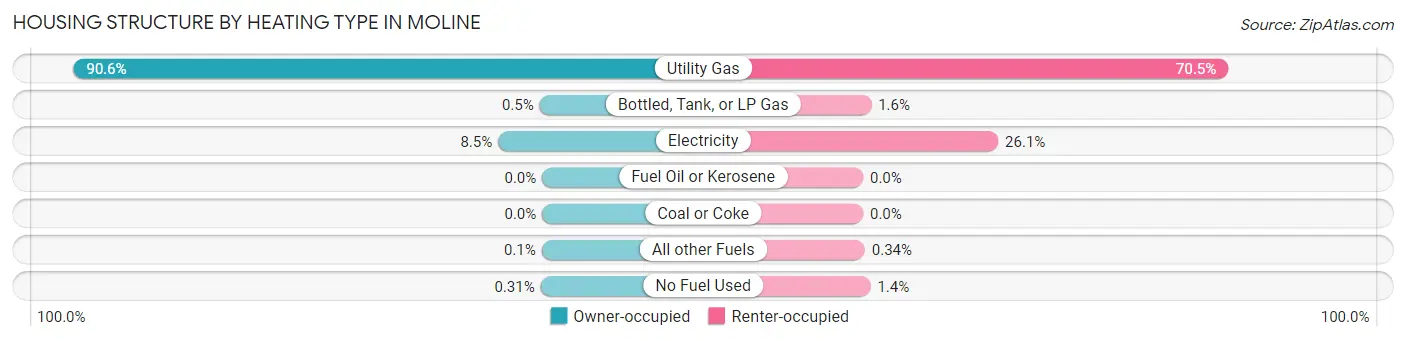
| Heating Type | Owner-occupied | Renter-occupied |
| Utility Gas | 10,978 (90.6%) | 4,336 (70.5%) |
| Bottled, Tank, or LP Gas | 61 (0.5%) | 97 (1.6%) |
| Electricity | 1,032 (8.5%) | 1,605 (26.1%) |
| Fuel Oil or Kerosene | 0 (0.0%) | 0 (0.0%) |
| Coal or Coke | 0 (0.0%) | 0 (0.0%) |
| All other Fuels | 12 (0.1%) | 21 (0.3%) |
| No Fuel Used | 37 (0.3%) | 88 (1.4%) |
| Total | 12,120 (100.0%) | 6,147 (100.0%) |
Household Vehicle Usage in Moline
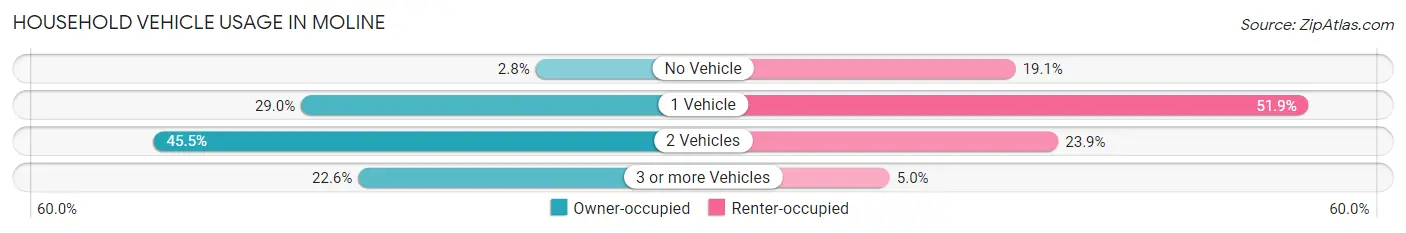
| Vehicles per Household | Owner-occupied | Renter-occupied |
| No Vehicle | 336 (2.8%) | 1,176 (19.1%) |
| 1 Vehicle | 3,520 (29.0%) | 3,192 (51.9%) |
| 2 Vehicles | 5,520 (45.5%) | 1,470 (23.9%) |
| 3 or more Vehicles | 2,744 (22.6%) | 309 (5.0%) |
| Total | 12,120 (100.0%) | 6,147 (100.0%) |
Real Estate & Mortgages in Moline
Real Estate and Mortgage Overview in Moline
| Characteristic | Without Mortgage | With Mortgage |
| Housing Units | 5,021 | 7,099 |
| Median Property Value | $143,300 | $140,000 |
| Median Household Income | $68,281 | $1,237 |
| Monthly Housing Costs | $630 | $290 |
| Real Estate Taxes | $3,161 | $97 |
Property Value by Mortgage Status in Moline
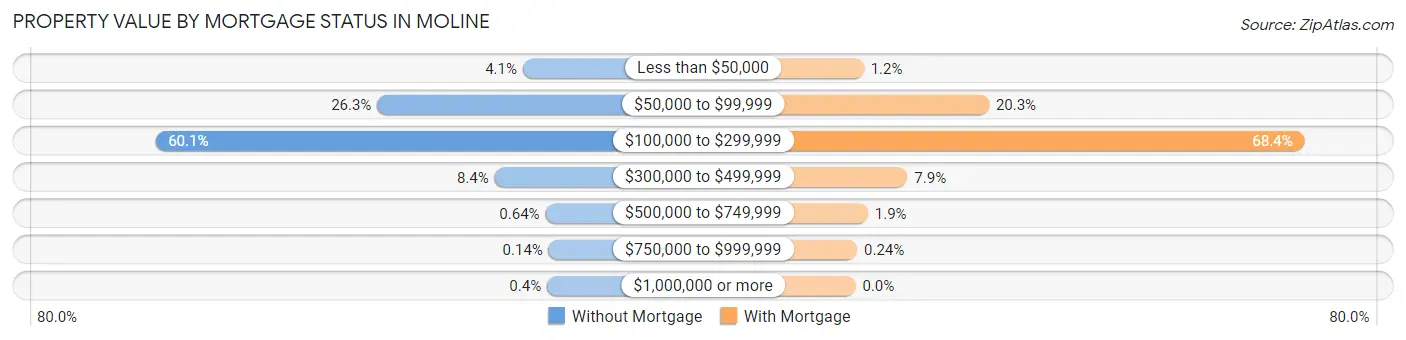
| Property Value | Without Mortgage | With Mortgage |
| Less than $50,000 | 205 (4.1%) | 88 (1.2%) |
| $50,000 to $99,999 | 1,319 (26.3%) | 1,443 (20.3%) |
| $100,000 to $299,999 | 3,017 (60.1%) | 4,857 (68.4%) |
| $300,000 to $499,999 | 421 (8.4%) | 561 (7.9%) |
| $500,000 to $749,999 | 32 (0.6%) | 133 (1.9%) |
| $750,000 to $999,999 | 7 (0.1%) | 17 (0.2%) |
| $1,000,000 or more | 20 (0.4%) | 0 (0.0%) |
| Total | 5,021 (100.0%) | 7,099 (100.0%) |
Household Income by Mortgage Status in Moline
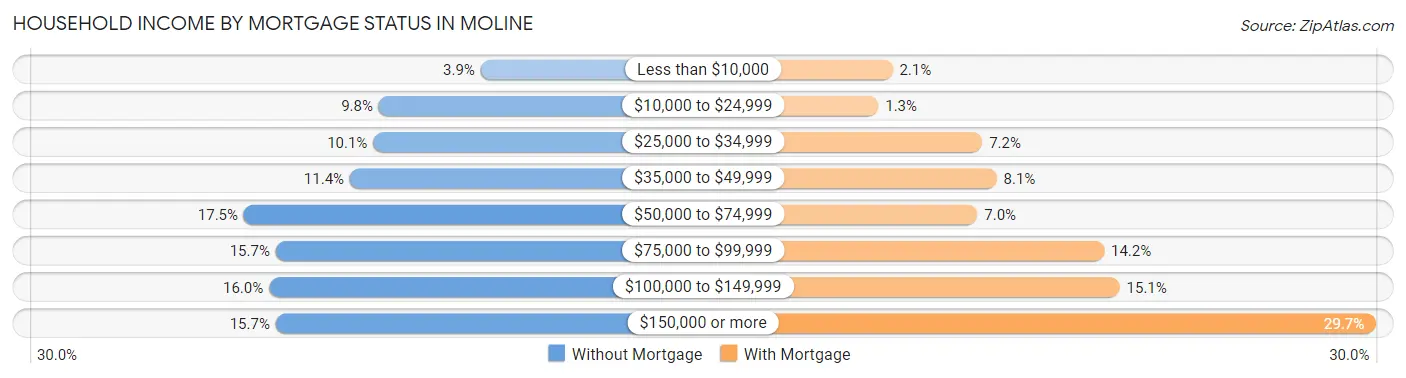
| Household Income | Without Mortgage | With Mortgage |
| Less than $10,000 | 198 (3.9%) | 150 (2.1%) |
| $10,000 to $24,999 | 490 (9.8%) | 92 (1.3%) |
| $25,000 to $34,999 | 506 (10.1%) | 514 (7.2%) |
| $35,000 to $49,999 | 573 (11.4%) | 572 (8.1%) |
| $50,000 to $74,999 | 877 (17.5%) | 494 (7.0%) |
| $75,000 to $99,999 | 786 (15.7%) | 1,008 (14.2%) |
| $100,000 to $149,999 | 805 (16.0%) | 1,071 (15.1%) |
| $150,000 or more | 786 (15.7%) | 2,111 (29.7%) |
| Total | 5,021 (100.0%) | 7,099 (100.0%) |
Property Value to Household Income Ratio in Moline
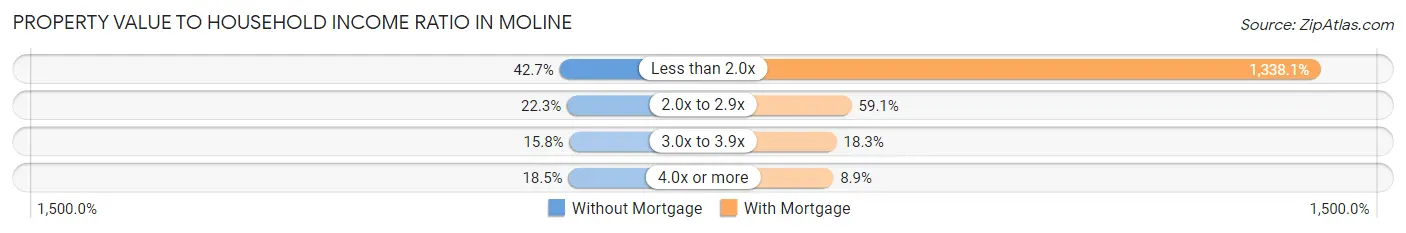
| Value-to-Income Ratio | Without Mortgage | With Mortgage |
| Less than 2.0x | 2,143 (42.7%) | 94,993 (1,338.1%) |
| 2.0x to 2.9x | 1,120 (22.3%) | 4,192 (59.1%) |
| 3.0x to 3.9x | 791 (15.8%) | 1,296 (18.3%) |
| 4.0x or more | 928 (18.5%) | 632 (8.9%) |
| Total | 5,021 (100.0%) | 7,099 (100.0%) |
Real Estate Taxes by Mortgage Status in Moline
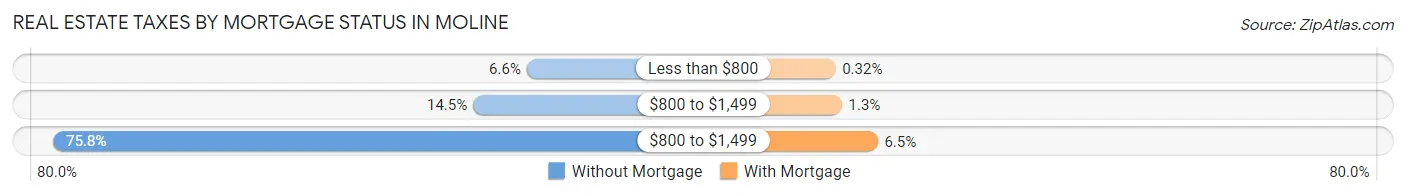
| Property Taxes | Without Mortgage | With Mortgage |
| Less than $800 | 333 (6.6%) | 23 (0.3%) |
| $800 to $1,499 | 727 (14.5%) | 89 (1.3%) |
| $800 to $1,499 | 3,808 (75.8%) | 461 (6.5%) |
| Total | 5,021 (100.0%) | 7,099 (100.0%) |
Health & Disability in Moline
Health Insurance Coverage by Age in Moline
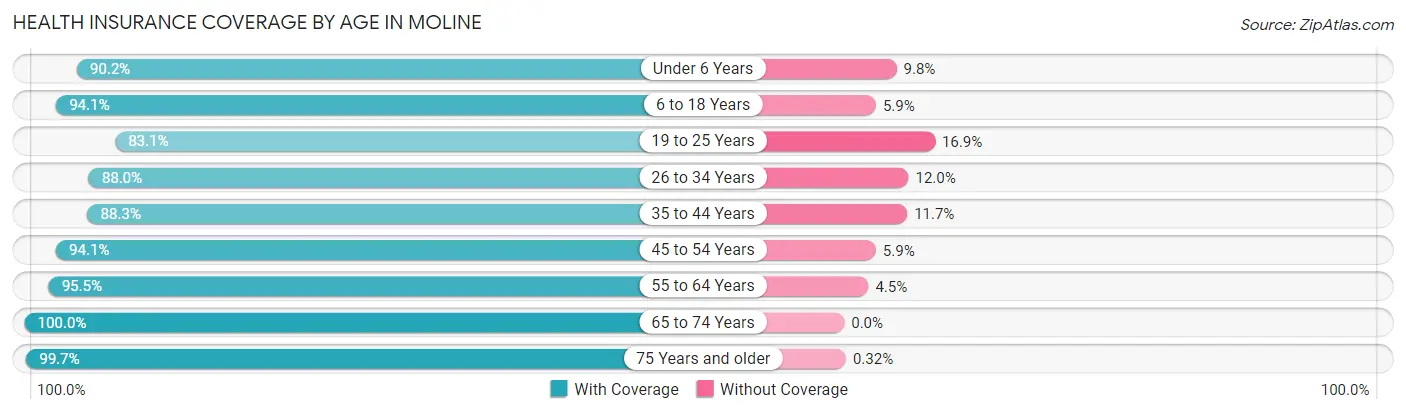
| Age Bracket | With Coverage | Without Coverage |
| Under 6 Years | 2,773 (90.2%) | 300 (9.8%) |
| 6 to 18 Years | 6,748 (94.1%) | 424 (5.9%) |
| 19 to 25 Years | 2,599 (83.1%) | 529 (16.9%) |
| 26 to 34 Years | 4,661 (88.0%) | 635 (12.0%) |
| 35 to 44 Years | 5,018 (88.3%) | 667 (11.7%) |
| 45 to 54 Years | 4,285 (94.1%) | 268 (5.9%) |
| 55 to 64 Years | 4,995 (95.5%) | 236 (4.5%) |
| 65 to 74 Years | 4,530 (100.0%) | 0 (0.0%) |
| 75 Years and older | 3,459 (99.7%) | 11 (0.3%) |
| Total | 39,068 (92.7%) | 3,070 (7.3%) |
Health Insurance Coverage by Citizenship Status in Moline
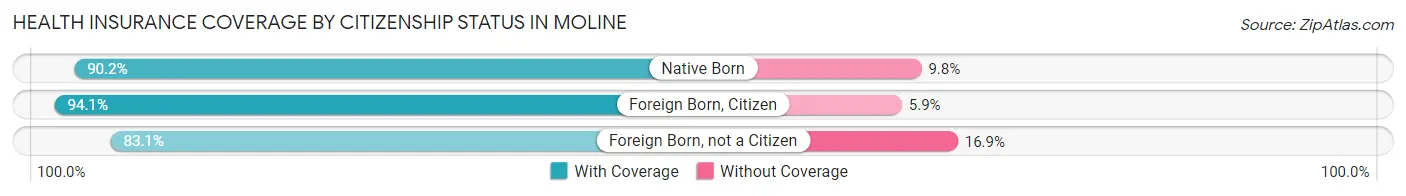
| Citizenship Status | With Coverage | Without Coverage |
| Native Born | 2,773 (90.2%) | 300 (9.8%) |
| Foreign Born, Citizen | 6,748 (94.1%) | 424 (5.9%) |
| Foreign Born, not a Citizen | 2,599 (83.1%) | 529 (16.9%) |
Health Insurance Coverage by Household Income in Moline
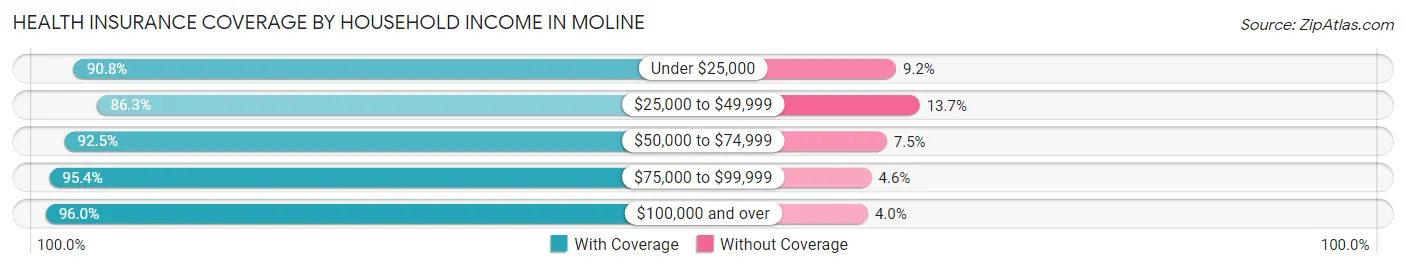
| Household Income | With Coverage | Without Coverage |
| Under $25,000 | 5,140 (90.8%) | 523 (9.2%) |
| $25,000 to $49,999 | 7,448 (86.3%) | 1,179 (13.7%) |
| $50,000 to $74,999 | 6,063 (92.5%) | 492 (7.5%) |
| $75,000 to $99,999 | 4,769 (95.4%) | 232 (4.6%) |
| $100,000 and over | 15,573 (96.0%) | 644 (4.0%) |
Public vs Private Health Insurance Coverage by Age in Moline
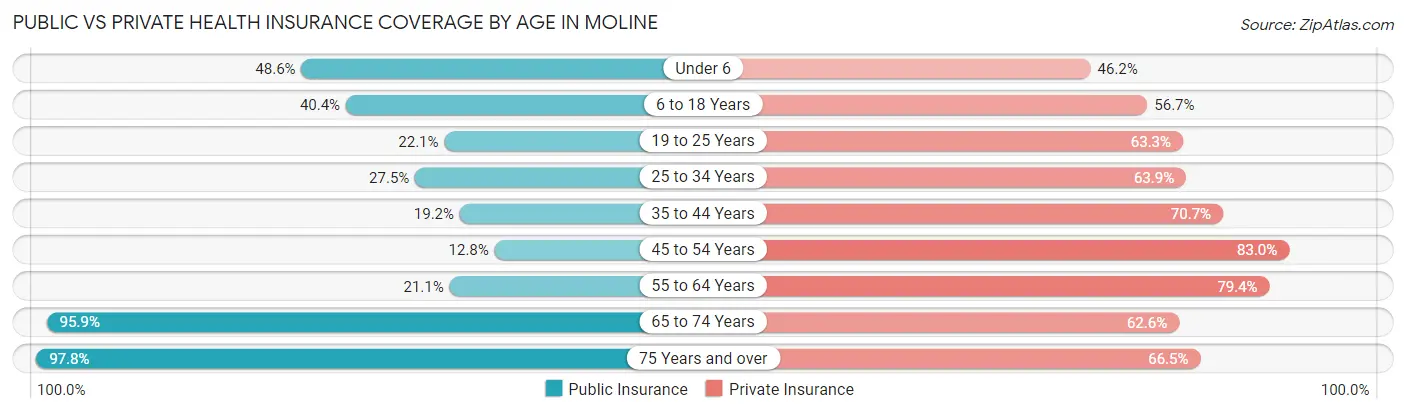
| Age Bracket | Public Insurance | Private Insurance |
| Under 6 | 1,494 (48.6%) | 1,419 (46.2%) |
| 6 to 18 Years | 2,894 (40.4%) | 4,068 (56.7%) |
| 19 to 25 Years | 691 (22.1%) | 1,980 (63.3%) |
| 25 to 34 Years | 1,457 (27.5%) | 3,383 (63.9%) |
| 35 to 44 Years | 1,092 (19.2%) | 4,021 (70.7%) |
| 45 to 54 Years | 581 (12.8%) | 3,780 (83.0%) |
| 55 to 64 Years | 1,105 (21.1%) | 4,152 (79.4%) |
| 65 to 74 Years | 4,345 (95.9%) | 2,835 (62.6%) |
| 75 Years and over | 3,395 (97.8%) | 2,309 (66.5%) |
| Total | 17,054 (40.5%) | 27,947 (66.3%) |
Disability Status by Sex by Age in Moline
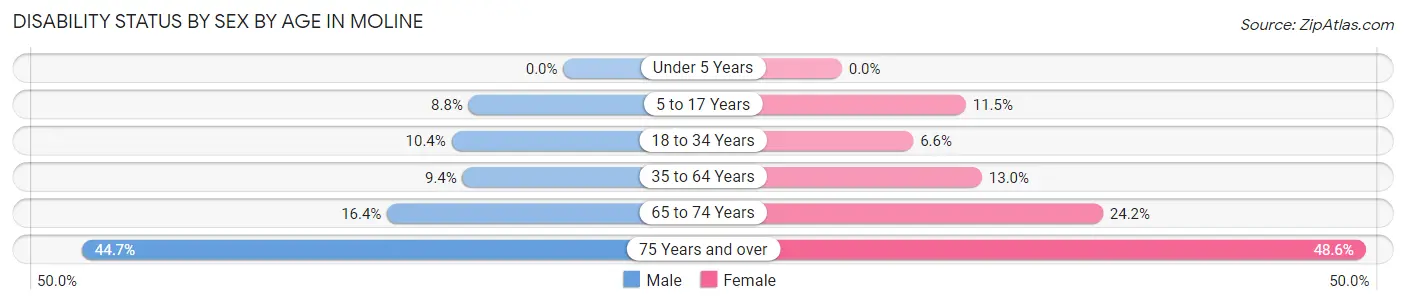
| Age Bracket | Male | Female |
| Under 5 Years | 0 (0.0%) | 0 (0.0%) |
| 5 to 17 Years | 324 (8.8%) | 412 (11.5%) |
| 18 to 34 Years | 439 (10.4%) | 305 (6.6%) |
| 35 to 64 Years | 752 (9.3%) | 965 (13.0%) |
| 65 to 74 Years | 300 (16.4%) | 653 (24.2%) |
| 75 Years and over | 739 (44.7%) | 883 (48.6%) |
Disability Class by Sex by Age in Moline
Disability Class: Hearing Difficulty
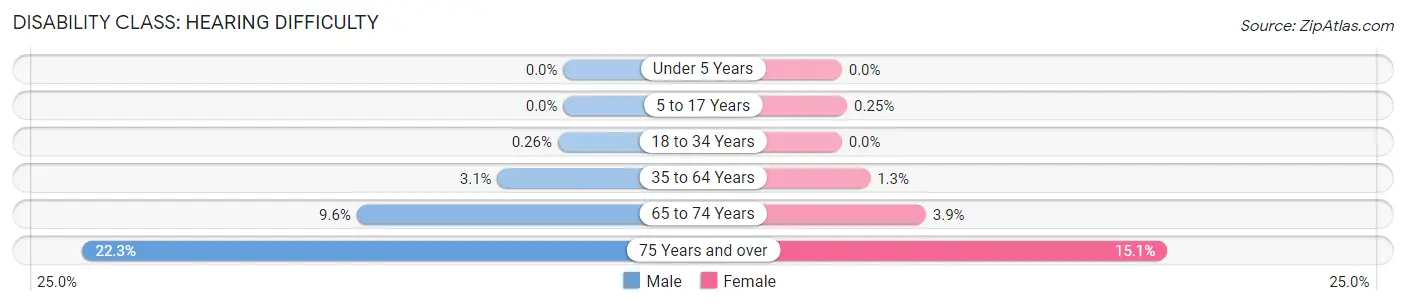
| Age Bracket | Male | Female |
| Under 5 Years | 0 (0.0%) | 0 (0.0%) |
| 5 to 17 Years | 0 (0.0%) | 9 (0.3%) |
| 18 to 34 Years | 11 (0.3%) | 0 (0.0%) |
| 35 to 64 Years | 246 (3.1%) | 98 (1.3%) |
| 65 to 74 Years | 176 (9.6%) | 105 (3.9%) |
| 75 Years and over | 369 (22.3%) | 274 (15.1%) |
Disability Class: Vision Difficulty
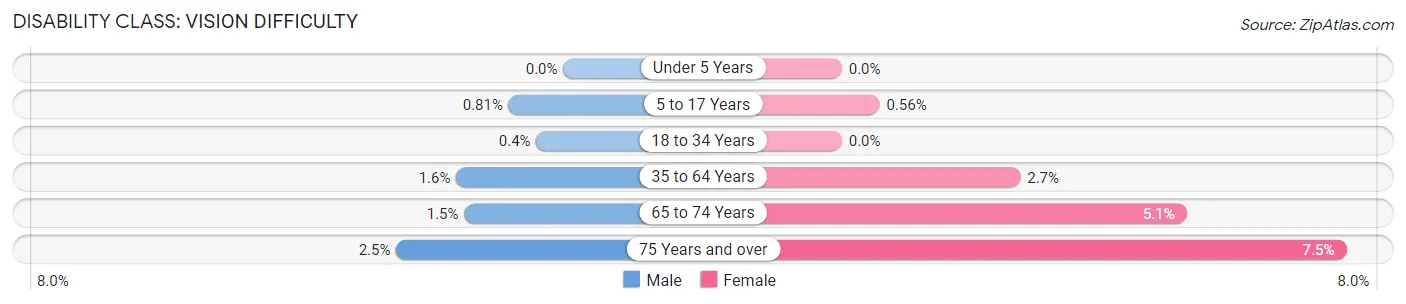
| Age Bracket | Male | Female |
| Under 5 Years | 0 (0.0%) | 0 (0.0%) |
| 5 to 17 Years | 30 (0.8%) | 20 (0.6%) |
| 18 to 34 Years | 17 (0.4%) | 0 (0.0%) |
| 35 to 64 Years | 128 (1.6%) | 197 (2.6%) |
| 65 to 74 Years | 27 (1.5%) | 138 (5.1%) |
| 75 Years and over | 41 (2.5%) | 136 (7.5%) |
Disability Class: Cognitive Difficulty
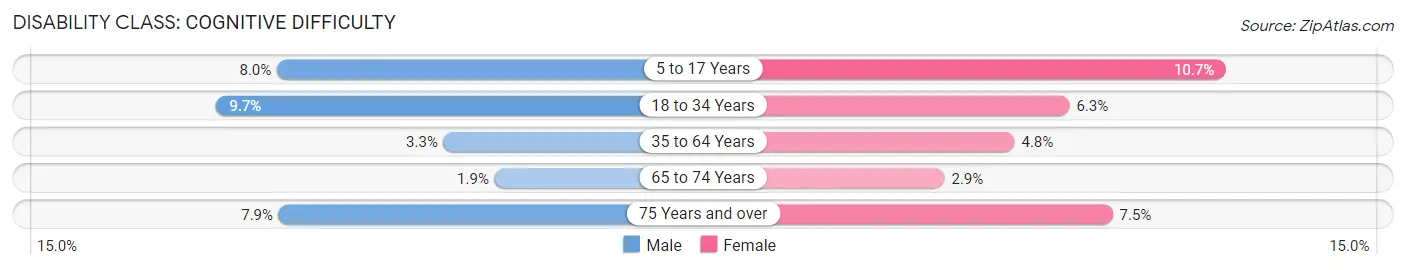
| Age Bracket | Male | Female |
| 5 to 17 Years | 294 (8.0%) | 383 (10.7%) |
| 18 to 34 Years | 409 (9.7%) | 292 (6.3%) |
| 35 to 64 Years | 268 (3.3%) | 357 (4.8%) |
| 65 to 74 Years | 35 (1.9%) | 77 (2.9%) |
| 75 Years and over | 131 (7.9%) | 137 (7.5%) |
Disability Class: Ambulatory Difficulty
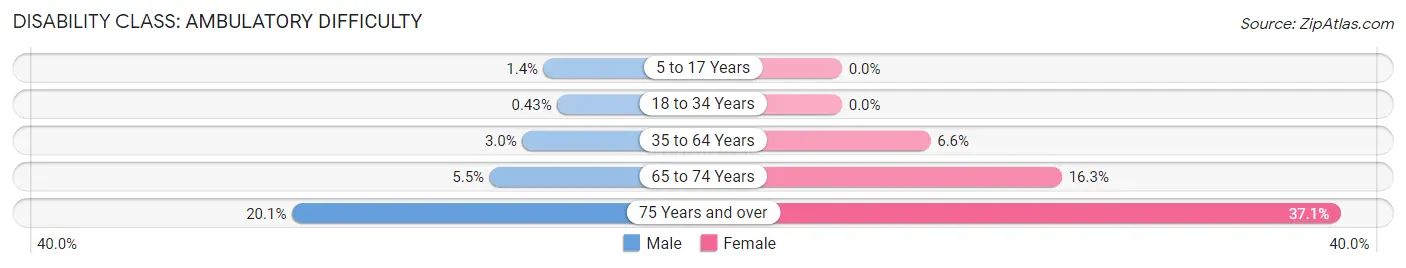
| Age Bracket | Male | Female |
| 5 to 17 Years | 53 (1.4%) | 0 (0.0%) |
| 18 to 34 Years | 18 (0.4%) | 0 (0.0%) |
| 35 to 64 Years | 244 (3.0%) | 488 (6.6%) |
| 65 to 74 Years | 100 (5.4%) | 440 (16.3%) |
| 75 Years and over | 333 (20.1%) | 673 (37.1%) |
Disability Class: Self-Care Difficulty
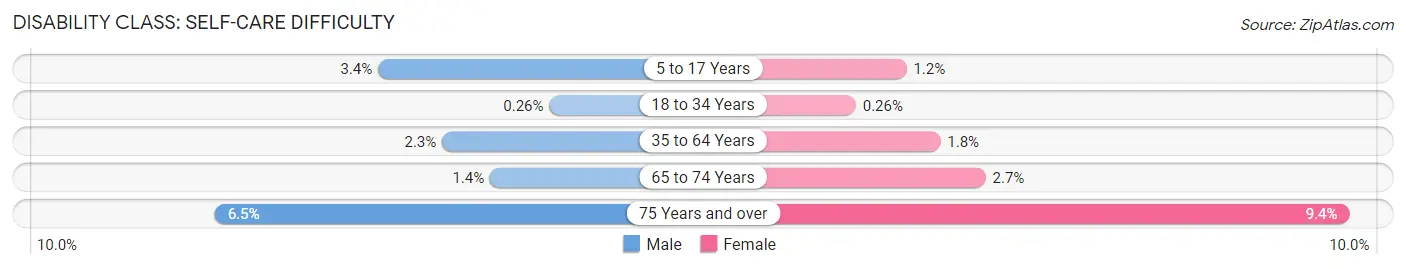
| Age Bracket | Male | Female |
| 5 to 17 Years | 127 (3.4%) | 43 (1.2%) |
| 18 to 34 Years | 11 (0.3%) | 12 (0.3%) |
| 35 to 64 Years | 181 (2.2%) | 136 (1.8%) |
| 65 to 74 Years | 25 (1.4%) | 72 (2.7%) |
| 75 Years and over | 107 (6.5%) | 171 (9.4%) |
Technology Access in Moline
Computing Device Access in Moline
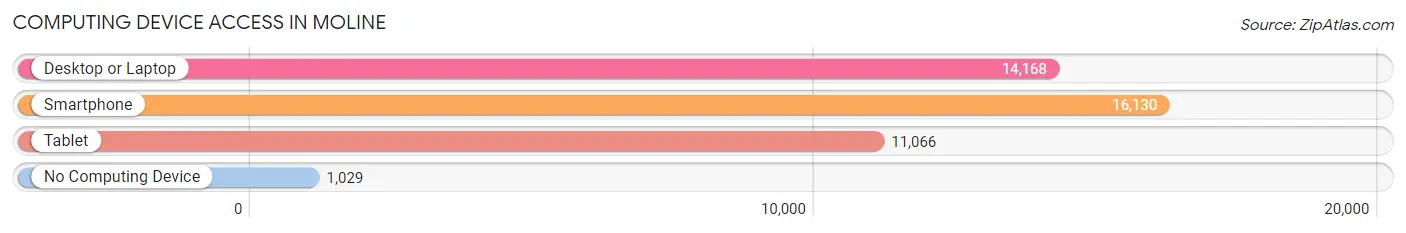
| Device Type | # Households | % Households |
| Desktop or Laptop | 14,168 | 77.6% |
| Smartphone | 16,130 | 88.3% |
| Tablet | 11,066 | 60.6% |
| No Computing Device | 1,029 | 5.6% |
| Total | 18,267 | 100.0% |
Internet Access in Moline
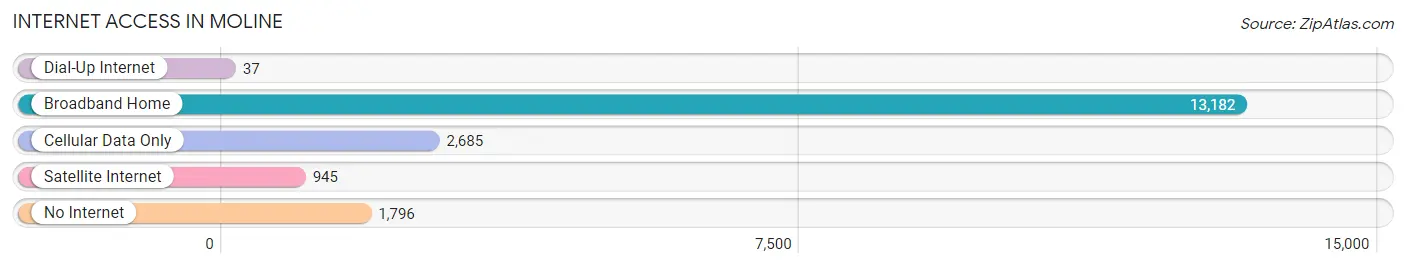
| Internet Type | # Households | % Households |
| Dial-Up Internet | 37 | 0.2% |
| Broadband Home | 13,182 | 72.2% |
| Cellular Data Only | 2,685 | 14.7% |
| Satellite Internet | 945 | 5.2% |
| No Internet | 1,796 | 9.8% |
| Total | 18,267 | 100.0% |
Moline Summary
Moline is a city located in Rock Island County, Illinois, United States. It is situated along the Mississippi River on the Iowa-Illinois border. The city is part of the Quad Cities metropolitan area, which includes the cities of Davenport and Bettendorf in Iowa, and Rock Island and East Moline in Illinois. As of the 2010 census, the city had a population of 43,977.
History
Moline was first settled in 1843 by William and Mary Coleman, who named the area after their hometown of Moline, Sweden. The city was incorporated in 1848 and was named the county seat of Rock Island County in 1851. The city grew rapidly in the late 19th century, becoming a major industrial center for the region. It was home to several large manufacturing companies, including the John Deere Company, which was founded in Moline in 1837.
The city experienced a period of decline in the mid-20th century, as many of its factories closed or moved away. However, in recent years, the city has seen a resurgence in its economy, with new businesses and developments moving into the area.
Geography
Moline is located at 41°30'N 90°25'W (41.50, -90.42). It is situated along the Mississippi River on the Iowa-Illinois border. The city has a total area of 24.2 square miles, of which 23.7 square miles is land and 0.5 square miles is water.
The city is part of the Quad Cities metropolitan area, which includes the cities of Davenport and Bettendorf in Iowa, and Rock Island and East Moline in Illinois. The Quad Cities area is home to more than 400,000 people.
Economy
Moline is a major industrial center for the region. The city is home to several large manufacturing companies, including the John Deere Company, which was founded in Moline in 1837. Other major employers in the city include the Rock Island Arsenal, the Quad City International Airport, and the University of Illinois at Chicago.
The city also has a thriving tourism industry, with several attractions, including the John Deere Pavilion, the Quad City Botanical Center, and the Quad City Arts Center.
Demographics
As of the 2010 census, the city had a population of 43,977. The racial makeup of the city was 79.2% White, 11.3% African American, 0.4% Native American, 2.2% Asian, 0.1% Pacific Islander, 4.2% from other races, and 2.7% from two or more races. Hispanic or Latino of any race were 8.7% of the population.
The median income for a household in the city was $41,945, and the median income for a family was $51,919. The per capita income for the city was $21,945. About 11.2% of families and 14.3% of the population were below the poverty line, including 20.2% of those under age 18 and 8.2% of those age 65 or over.
Common Questions
What is Per Capita Income in Moline?
Per Capita income in Moline is $34,724.
What is the Median Family Income in Moline?
Median Family Income in Moline is $85,788.
What is the Median Household income in Moline?
Median Household Income in Moline is $63,553.
What is Income or Wage Gap in Moline?
Income or Wage Gap in Moline is 29.5%.
Women in Moline earn 70.5 cents for every dollar earned by a man.
What is Family Income Deficit in Moline?
Family Income Deficit in Moline is $12,309.
Families that are below poverty line in Moline earn $12,309 less on average than the poverty threshold level.
What is Inequality or Gini Index in Moline?
Inequality or Gini Index in Moline is 0.44.
What is the Total Population of Moline?
Total Population of Moline is 42,452.
What is the Total Male Population of Moline?
Total Male Population of Moline is 21,026.
What is the Total Female Population of Moline?
Total Female Population of Moline is 21,426.
What is the Ratio of Males per 100 Females in Moline?
There are 98.13 Males per 100 Females in Moline.
What is the Ratio of Females per 100 Males in Moline?
There are 101.90 Females per 100 Males in Moline.
What is the Median Population Age in Moline?
Median Population Age in Moline is 38.8 Years.
What is the Average Family Size in Moline
Average Family Size in Moline is 2.9 People.
What is the Average Household Size in Moline
Average Household Size in Moline is 2.3 People.
How Large is the Labor Force in Moline?
There are 21,719 People in the Labor Forcein in Moline.
What is the Percentage of People in the Labor Force in Moline?
64.4% of People are in the Labor Force in Moline.
What is the Unemployment Rate in Moline?
Unemployment Rate in Moline is 6.7%.