Algonquin, IL Map & Demographics
Algonquin Map
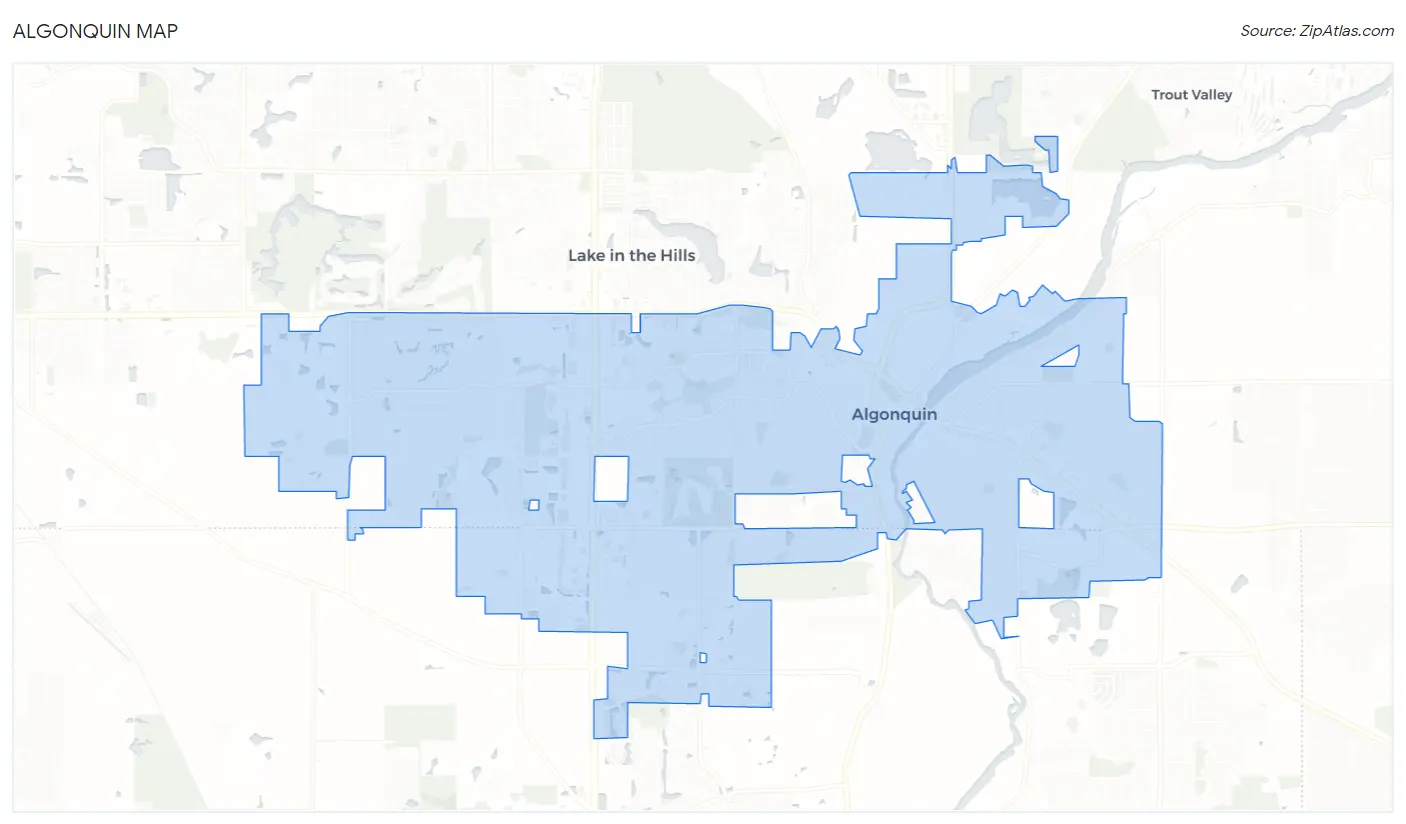
Algonquin Overview
$54,019
PER CAPITA INCOME
$146,964
AVG FAMILY INCOME
$129,658
AVG HOUSEHOLD INCOME
30.2%
WAGE / INCOME GAP [ % ]
69.8¢/ $1
WAGE / INCOME GAP [ $ ]
0.37
INEQUALITY / GINI INDEX
29,888
TOTAL POPULATION
15,027
MALE POPULATION
14,861
FEMALE POPULATION
101.12
MALES / 100 FEMALES
98.90
FEMALES / 100 MALES
41.0
MEDIAN AGE
3.1
AVG FAMILY SIZE
2.7
AVG HOUSEHOLD SIZE
18,313
LABOR FORCE [ PEOPLE ]
74.8%
PERCENT IN LABOR FORCE
4.7%
UNEMPLOYMENT RATE
Algonquin Zip Codes
Income in Algonquin
Income Overview in Algonquin
Per Capita Income in Algonquin is $54,019, while median incomes of families and households are $146,964 and $129,658 respectively.
| Characteristic | Number | Measure |
| Per Capita Income | 29,888 | $54,019 |
| Median Family Income | 8,357 | $146,964 |
| Mean Family Income | 8,357 | $162,759 |
| Median Household Income | 10,964 | $129,658 |
| Mean Household Income | 10,964 | $146,904 |
| Income Deficit | 8,357 | $0 |
| Wage / Income Gap (%) | 29,888 | 30.16% |
| Wage / Income Gap ($) | 29,888 | 69.84¢ per $1 |
| Gini / Inequality Index | 29,888 | 0.37 |
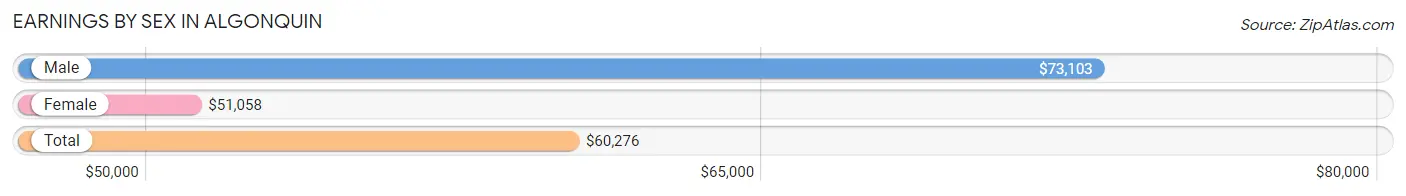
Earnings by Sex in Algonquin
Average Earnings in Algonquin are $60,276, $73,103 for men and $51,058 for women, a difference of 30.2%.
| Sex | Number | Average Earnings |
| Male | 9,996 (53.5%) | $73,103 |
| Female | 8,699 (46.5%) | $51,058 |
| Total | 18,695 (100.0%) | $60,276 |
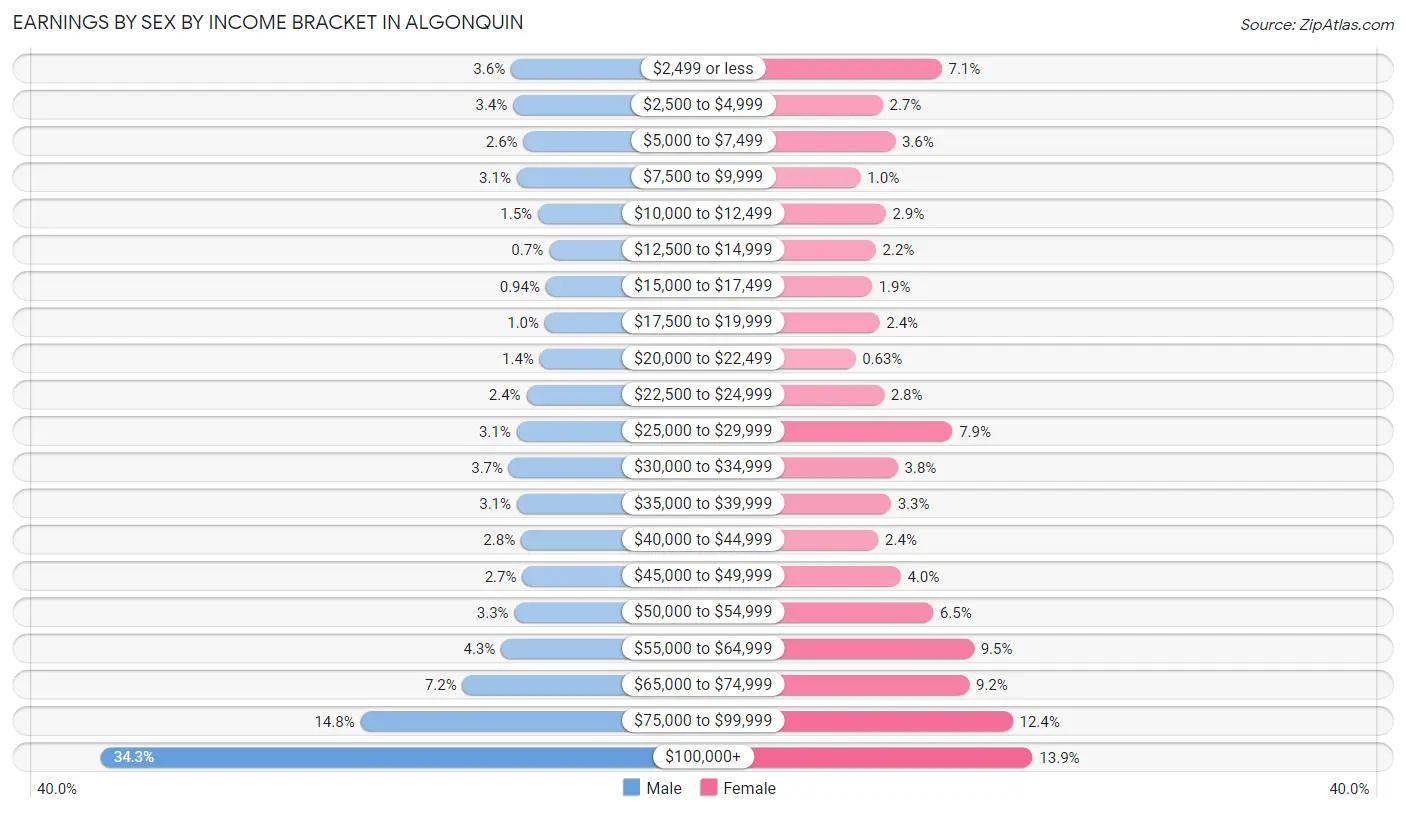
Earnings by Sex by Income Bracket in Algonquin
The most common earnings brackets in Algonquin are $100,000+ for men (3,428 | 34.3%) and $100,000+ for women (1,210 | 13.9%).
| Income | Male | Female |
| $2,499 or less | 355 (3.5%) | 618 (7.1%) |
| $2,500 to $4,999 | 339 (3.4%) | 233 (2.7%) |
| $5,000 to $7,499 | 262 (2.6%) | 314 (3.6%) |
| $7,500 to $9,999 | 312 (3.1%) | 89 (1.0%) |
| $10,000 to $12,499 | 153 (1.5%) | 252 (2.9%) |
| $12,500 to $14,999 | 70 (0.7%) | 188 (2.2%) |
| $15,000 to $17,499 | 94 (0.9%) | 163 (1.9%) |
| $17,500 to $19,999 | 101 (1.0%) | 212 (2.4%) |
| $20,000 to $22,499 | 140 (1.4%) | 55 (0.6%) |
| $22,500 to $24,999 | 239 (2.4%) | 241 (2.8%) |
| $25,000 to $29,999 | 313 (3.1%) | 687 (7.9%) |
| $30,000 to $34,999 | 371 (3.7%) | 331 (3.8%) |
| $35,000 to $39,999 | 311 (3.1%) | 286 (3.3%) |
| $40,000 to $44,999 | 280 (2.8%) | 204 (2.4%) |
| $45,000 to $49,999 | 270 (2.7%) | 350 (4.0%) |
| $50,000 to $54,999 | 329 (3.3%) | 562 (6.5%) |
| $55,000 to $64,999 | 429 (4.3%) | 827 (9.5%) |
| $65,000 to $74,999 | 718 (7.2%) | 797 (9.2%) |
| $75,000 to $99,999 | 1,482 (14.8%) | 1,080 (12.4%) |
| $100,000+ | 3,428 (34.3%) | 1,210 (13.9%) |
| Total | 9,996 (100.0%) | 8,699 (100.0%) |
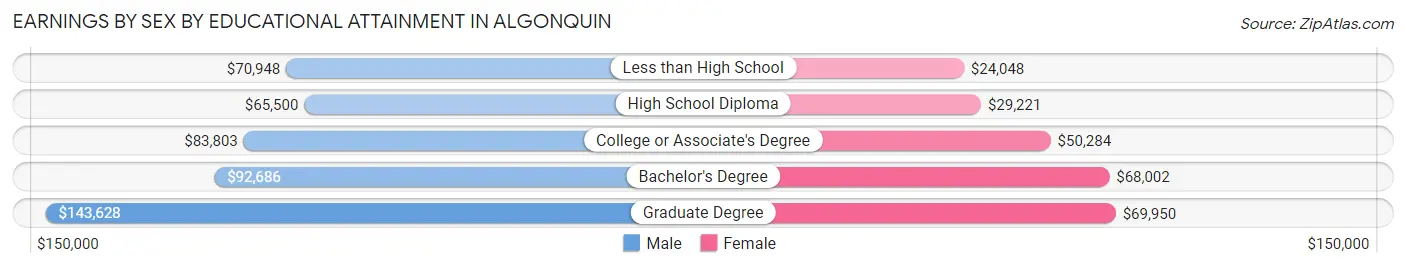
Earnings by Sex by Educational Attainment in Algonquin
Average earnings in Algonquin are $87,787 for men and $56,220 for women, a difference of 36.0%. Men with an educational attainment of graduate degree enjoy the highest average annual earnings of $143,628, while those with high school diploma education earn the least with $65,500. Women with an educational attainment of graduate degree earn the most with the average annual earnings of $69,950, while those with less than high school education have the smallest earnings of $24,048.
| Educational Attainment | Male Income | Female Income |
| Less than High School | $70,948 | $24,048 |
| High School Diploma | $65,500 | $29,221 |
| College or Associate's Degree | $83,803 | $50,284 |
| Bachelor's Degree | $92,686 | $68,002 |
| Graduate Degree | $143,628 | $69,950 |
| Total | $87,787 | $56,220 |
Family Income in Algonquin
Family Income Brackets in Algonquin
According to the Algonquin family income data, there are 2,047 families falling into the $200,000+ income range, which is the most common income bracket and makes up 24.5% of all families. Conversely, the $10,000 to $14,999 income bracket is the least frequent group with only 42 families (0.5%) belonging to this category.
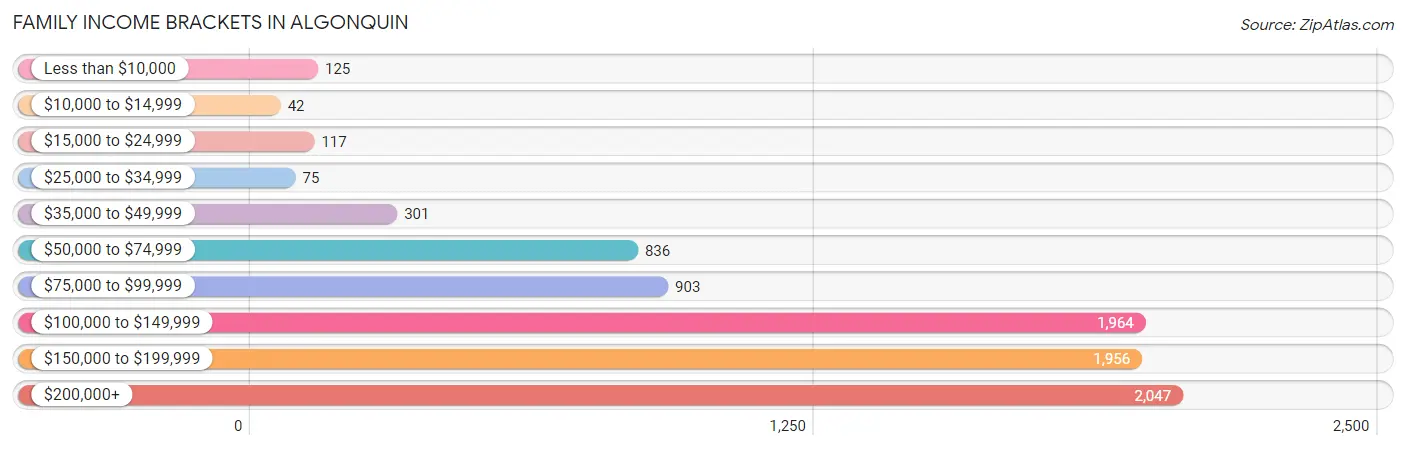
| Income Bracket | # Families | % Families |
| Less than $10,000 | 125 | 1.5% |
| $10,000 to $14,999 | 42 | 0.5% |
| $15,000 to $24,999 | 117 | 1.4% |
| $25,000 to $34,999 | 75 | 0.9% |
| $35,000 to $49,999 | 301 | 3.6% |
| $50,000 to $74,999 | 836 | 10.0% |
| $75,000 to $99,999 | 903 | 10.8% |
| $100,000 to $149,999 | 1,964 | 23.5% |
| $150,000 to $199,999 | 1,956 | 23.4% |
| $200,000+ | 2,047 | 24.5% |
Family Income by Famaliy Size in Algonquin
5-person families (844 | 10.1%) account for the highest median family income in Algonquin with $188,929 per family, while 2-person families (3,461 | 41.4%) have the highest median income of $56,735 per family member.
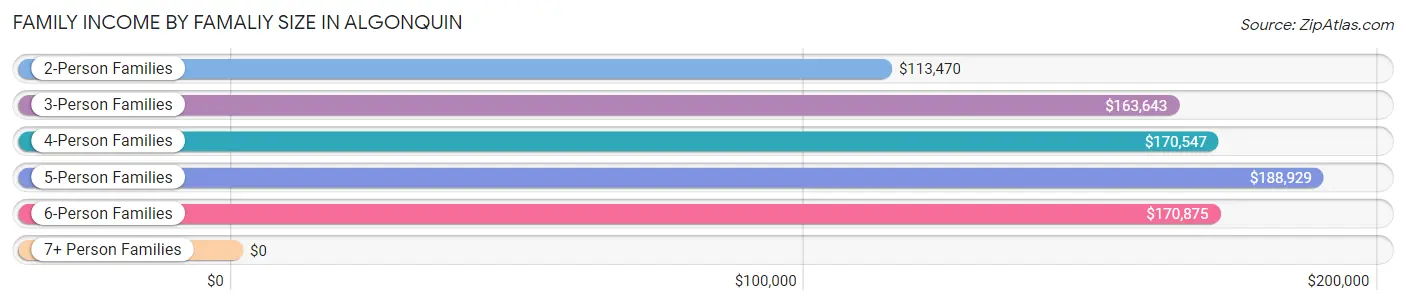
| Income Bracket | # Families | Median Income |
| 2-Person Families | 3,461 (41.4%) | $113,470 |
| 3-Person Families | 2,316 (27.7%) | $163,643 |
| 4-Person Families | 1,523 (18.2%) | $170,547 |
| 5-Person Families | 844 (10.1%) | $188,929 |
| 6-Person Families | 213 (2.5%) | $170,875 |
| 7+ Person Families | 0 (0.0%) | $0 |
| Total | 8,357 (100.0%) | $146,964 |
Family Income by Number of Earners in Algonquin
The median family income in Algonquin is $146,964, with families comprising 3+ earners (1,792) having the highest median family income of $178,417, while families with no earners (866) have the lowest median family income of $76,094, accounting for 21.4% and 10.4% of families, respectively.
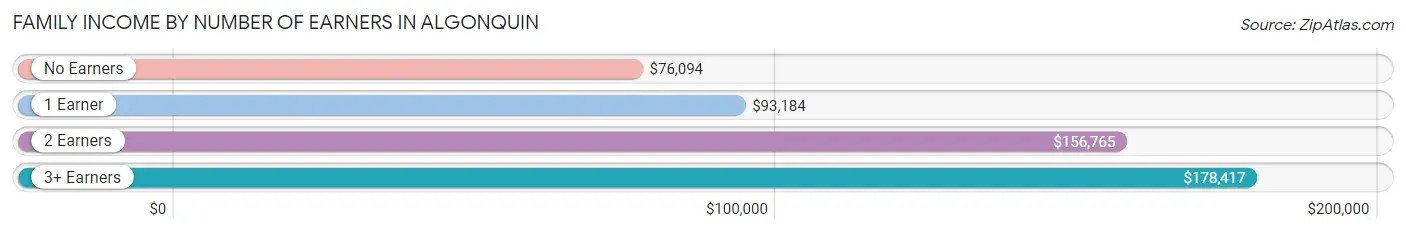
| Number of Earners | # Families | Median Income |
| No Earners | 866 (10.4%) | $76,094 |
| 1 Earner | 1,789 (21.4%) | $93,184 |
| 2 Earners | 3,910 (46.8%) | $156,765 |
| 3+ Earners | 1,792 (21.4%) | $178,417 |
| Total | 8,357 (100.0%) | $146,964 |
Household Income in Algonquin
Household Income Brackets in Algonquin
With 2,522 households falling in the category, the $100,000 to $149,999 income range is the most frequent in Algonquin, accounting for 23.0% of all households. In contrast, only 153 households (1.4%) fall into the less than $10,000 income bracket, making it the least populous group.
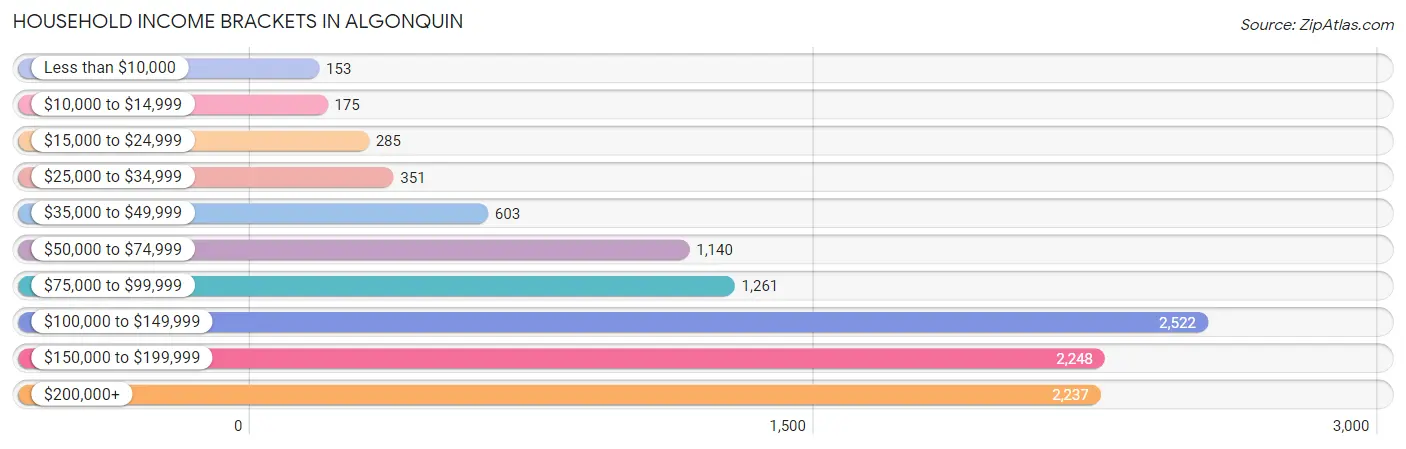
| Income Bracket | # Households | % Households |
| Less than $10,000 | 153 | 1.4% |
| $10,000 to $14,999 | 175 | 1.6% |
| $15,000 to $24,999 | 285 | 2.6% |
| $25,000 to $34,999 | 351 | 3.2% |
| $35,000 to $49,999 | 603 | 5.5% |
| $50,000 to $74,999 | 1,140 | 10.4% |
| $75,000 to $99,999 | 1,261 | 11.5% |
| $100,000 to $149,999 | 2,522 | 23.0% |
| $150,000 to $199,999 | 2,248 | 20.5% |
| $200,000+ | 2,237 | 20.4% |
Household Income by Householder Age in Algonquin
The median household income in Algonquin is $129,658, with the highest median household income of $163,863 found in the 45 to 64 years age bracket for the primary householder. A total of 5,083 households (46.4%) fall into this category. Meanwhile, the 15 to 24 years age bracket for the primary householder has the lowest median household income of $0, with 42 households (0.4%) in this group.
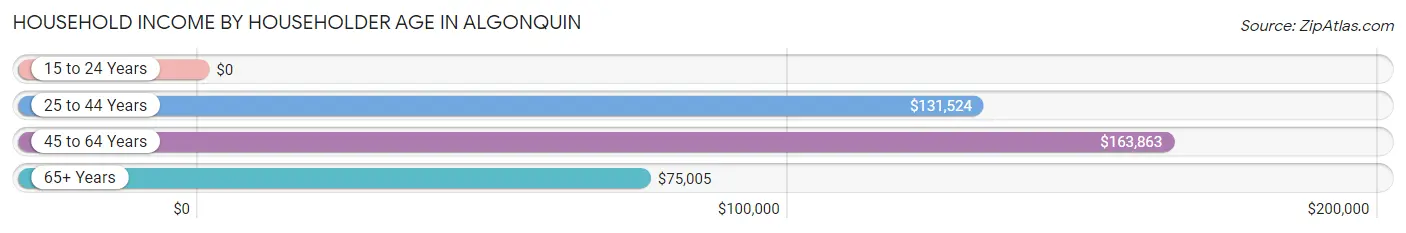
| Income Bracket | # Households | Median Income |
| 15 to 24 Years | 42 (0.4%) | $0 |
| 25 to 44 Years | 3,168 (28.9%) | $131,524 |
| 45 to 64 Years | 5,083 (46.4%) | $163,863 |
| 65+ Years | 2,671 (24.4%) | $75,005 |
| Total | 10,964 (100.0%) | $129,658 |
Poverty in Algonquin
Income Below Poverty by Sex and Age in Algonquin
With 5.2% poverty level for males and 3.5% for females among the residents of Algonquin, 18 to 24 year old males and 75 year old and over females are the most vulnerable to poverty, with 276 males (17.4%) and 77 females (6.8%) in their respective age groups living below the poverty level.
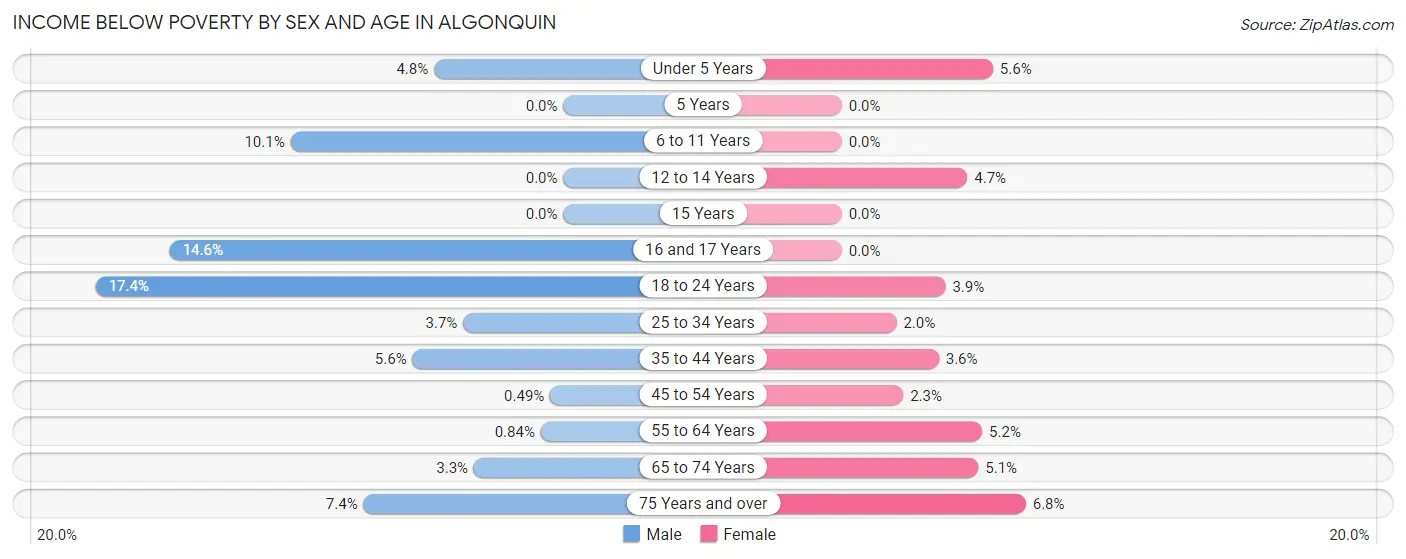
| Age Bracket | Male | Female |
| Under 5 Years | 34 (4.8%) | 40 (5.6%) |
| 5 Years | 0 (0.0%) | 0 (0.0%) |
| 6 to 11 Years | 97 (10.1%) | 0 (0.0%) |
| 12 to 14 Years | 0 (0.0%) | 21 (4.7%) |
| 15 Years | 0 (0.0%) | 0 (0.0%) |
| 16 and 17 Years | 77 (14.6%) | 0 (0.0%) |
| 18 to 24 Years | 276 (17.4%) | 43 (3.8%) |
| 25 to 34 Years | 66 (3.7%) | 42 (2.0%) |
| 35 to 44 Years | 100 (5.6%) | 62 (3.6%) |
| 45 to 54 Years | 11 (0.5%) | 51 (2.3%) |
| 55 to 64 Years | 21 (0.8%) | 130 (5.2%) |
| 65 to 74 Years | 37 (3.3%) | 57 (5.1%) |
| 75 Years and over | 57 (7.4%) | 77 (6.8%) |
| Total | 776 (5.2%) | 523 (3.5%) |
Income Above Poverty by Sex and Age in Algonquin
According to the poverty statistics in Algonquin, males aged 5 years and females aged 5 years are the age groups that are most secure financially, with 100.0% of males and 100.0% of females in these age groups living above the poverty line.
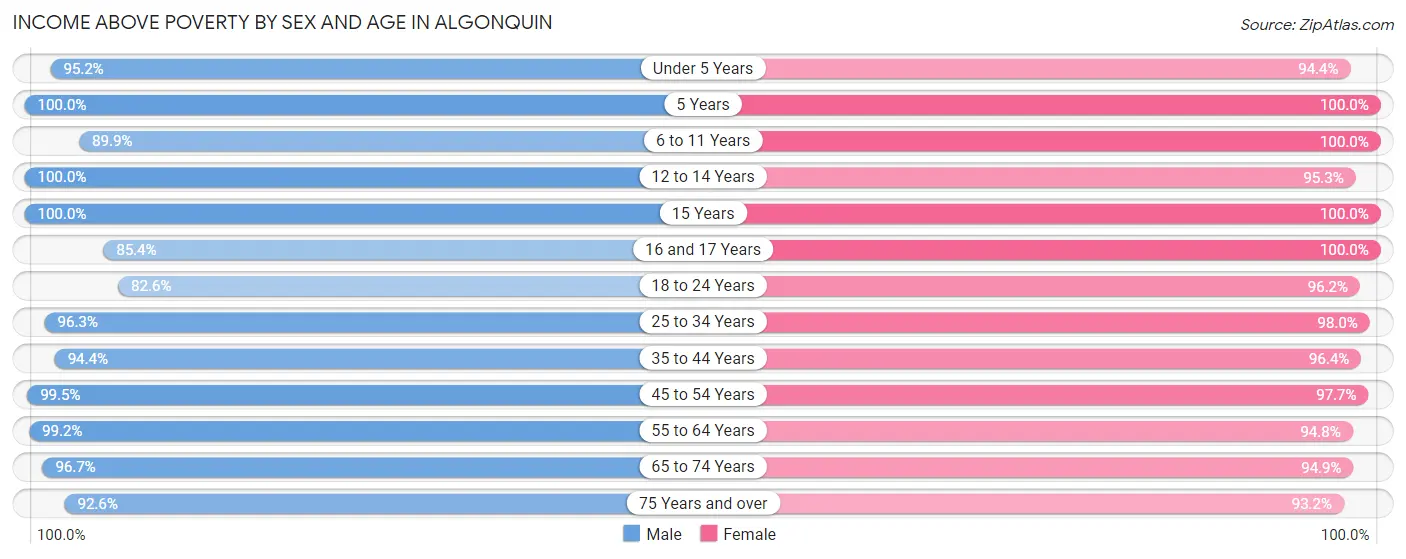
| Age Bracket | Male | Female |
| Under 5 Years | 674 (95.2%) | 673 (94.4%) |
| 5 Years | 200 (100.0%) | 109 (100.0%) |
| 6 to 11 Years | 861 (89.9%) | 1,269 (100.0%) |
| 12 to 14 Years | 505 (100.0%) | 430 (95.3%) |
| 15 Years | 285 (100.0%) | 127 (100.0%) |
| 16 and 17 Years | 450 (85.4%) | 295 (100.0%) |
| 18 to 24 Years | 1,314 (82.6%) | 1,073 (96.2%) |
| 25 to 34 Years | 1,706 (96.3%) | 2,023 (98.0%) |
| 35 to 44 Years | 1,685 (94.4%) | 1,660 (96.4%) |
| 45 to 54 Years | 2,253 (99.5%) | 2,181 (97.7%) |
| 55 to 64 Years | 2,467 (99.2%) | 2,363 (94.8%) |
| 65 to 74 Years | 1,078 (96.7%) | 1,067 (94.9%) |
| 75 Years and over | 711 (92.6%) | 1,050 (93.2%) |
| Total | 14,189 (94.8%) | 14,320 (96.5%) |
Income Below Poverty Among Married-Couple Families in Algonquin
The poverty statistics for married-couple families in Algonquin show that 1.0% or 67 of the total 6,770 families live below the poverty line. Families with 1 or 2 children have the highest poverty rate of 1.1%, comprising of 24 families. On the other hand, families with 3 or 4 children have the lowest poverty rate of 0.0%, which includes 0 families.
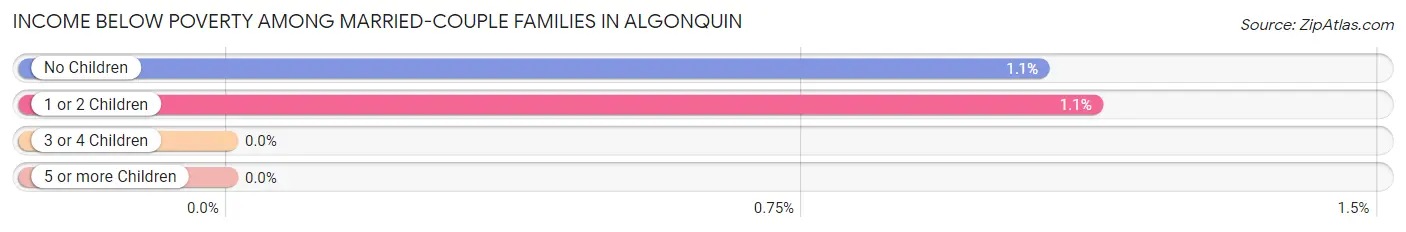
| Children | Above Poverty | Below Poverty |
| No Children | 4,023 (98.9%) | 43 (1.1%) |
| 1 or 2 Children | 2,097 (98.9%) | 24 (1.1%) |
| 3 or 4 Children | 583 (100.0%) | 0 (0.0%) |
| 5 or more Children | 0 (0.0%) | 0 (0.0%) |
| Total | 6,703 (99.0%) | 67 (1.0%) |
Income Below Poverty Among Single-Parent Households in Algonquin
According to the poverty data in Algonquin, 9.4% or 71 single-father households and 10.8% or 90 single-mother households are living below the poverty line. Among single-father households, those with 1 or 2 children have the highest poverty rate, with 61 households (13.7%) experiencing poverty. Likewise, among single-mother households, those with 3 or 4 children have the highest poverty rate, with 26 households (100.0%) falling below the poverty line.
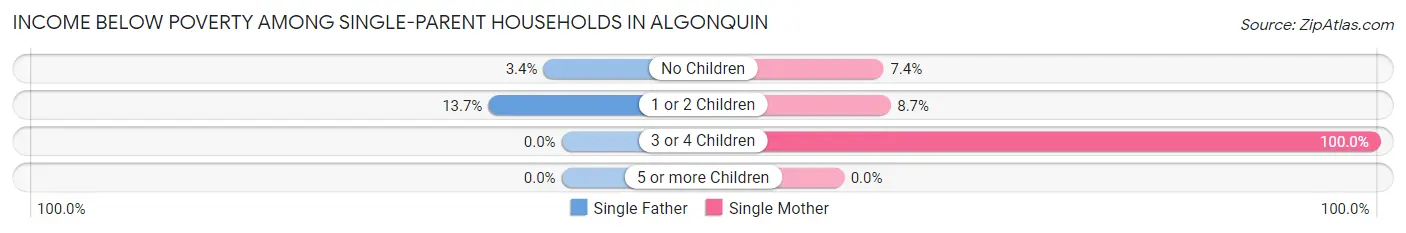
| Children | Single Father | Single Mother |
| No Children | 10 (3.4%) | 35 (7.4%) |
| 1 or 2 Children | 61 (13.7%) | 29 (8.7%) |
| 3 or 4 Children | 0 (0.0%) | 26 (100.0%) |
| 5 or more Children | 0 (0.0%) | 0 (0.0%) |
| Total | 71 (9.4%) | 90 (10.8%) |
Income Below Poverty Among Married-Couple vs Single-Parent Households in Algonquin
The poverty data for Algonquin shows that 67 of the married-couple family households (1.0%) and 161 of the single-parent households (10.1%) are living below the poverty level. Within the married-couple family households, those with 1 or 2 children have the highest poverty rate, with 24 households (1.1%) falling below the poverty line. Among the single-parent households, those with 3 or 4 children have the highest poverty rate, with 26 household (66.7%) living below poverty.
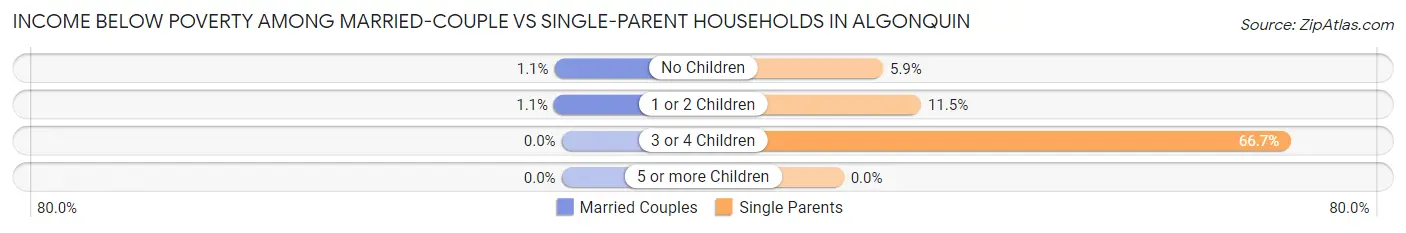
| Children | Married-Couple Families | Single-Parent Households |
| No Children | 43 (1.1%) | 45 (5.9%) |
| 1 or 2 Children | 24 (1.1%) | 90 (11.5%) |
| 3 or 4 Children | 0 (0.0%) | 26 (66.7%) |
| 5 or more Children | 0 (0.0%) | 0 (0.0%) |
| Total | 67 (1.0%) | 161 (10.1%) |
Race in Algonquin
The most populous races in Algonquin are White / Caucasian (24,913 | 83.4%), Hispanic or Latino (3,337 | 11.2%), and Two or more Races (1,665 | 5.6%).
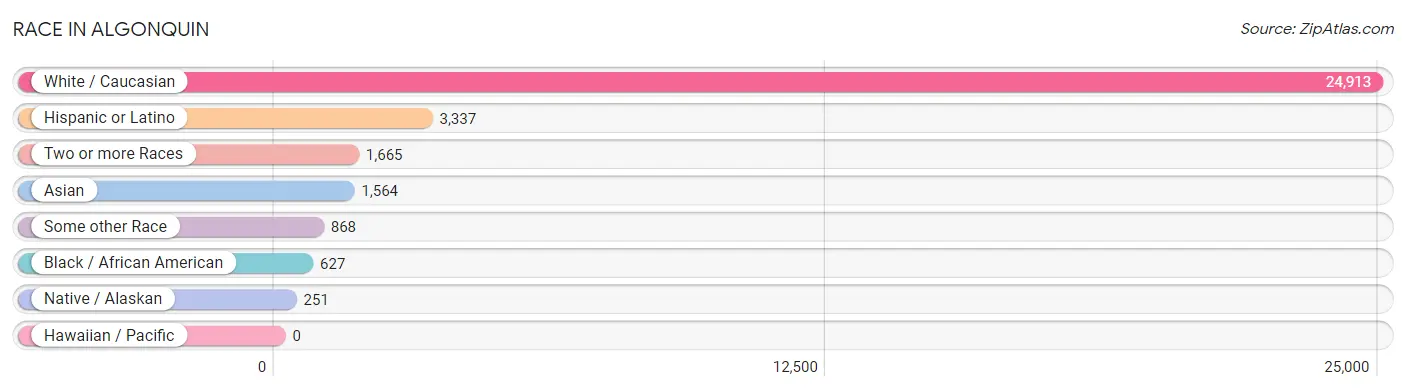
| Race | # Population | % Population |
| Asian | 1,564 | 5.2% |
| Black / African American | 627 | 2.1% |
| Hawaiian / Pacific | 0 | 0.0% |
| Hispanic or Latino | 3,337 | 11.2% |
| Native / Alaskan | 251 | 0.8% |
| White / Caucasian | 24,913 | 83.4% |
| Two or more Races | 1,665 | 5.6% |
| Some other Race | 868 | 2.9% |
| Total | 29,888 | 100.0% |
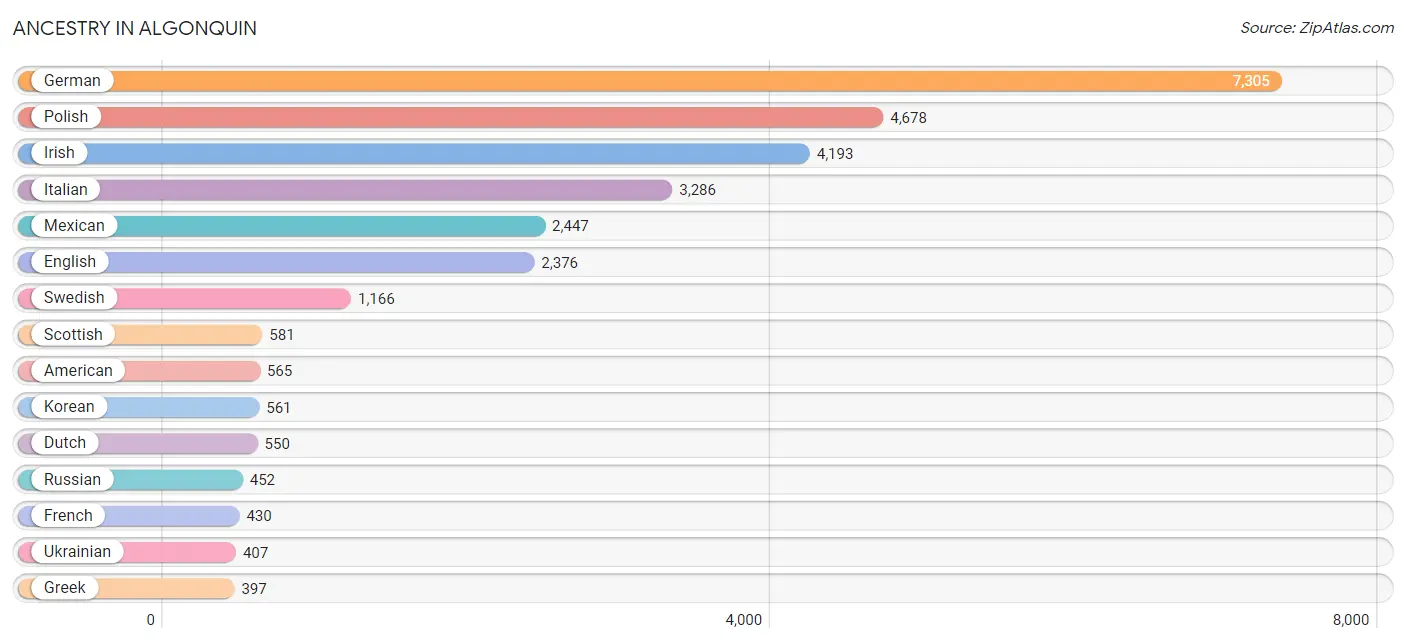
Ancestry in Algonquin
The most populous ancestries reported in Algonquin are German (7,305 | 24.4%), Polish (4,678 | 15.7%), Irish (4,193 | 14.0%), Italian (3,286 | 11.0%), and Mexican (2,447 | 8.2%), together accounting for 73.3% of all Algonquin residents.
| Ancestry | # Population | % Population |
| African | 21 | 0.1% |
| American | 565 | 1.9% |
| Arab | 12 | 0.0% |
| Armenian | 74 | 0.3% |
| Assyrian / Chaldean / Syriac | 9 | 0.0% |
| Austrian | 100 | 0.3% |
| Bangladeshi | 53 | 0.2% |
| Belgian | 85 | 0.3% |
| Bhutanese | 216 | 0.7% |
| British | 38 | 0.1% |
| Burmese | 315 | 1.1% |
| Cajun | 9 | 0.0% |
| Canadian | 18 | 0.1% |
| Central American | 176 | 0.6% |
| Cherokee | 2 | 0.0% |
| Chilean | 20 | 0.1% |
| Chippewa | 5 | 0.0% |
| Choctaw | 62 | 0.2% |
| Colombian | 125 | 0.4% |
| Croatian | 142 | 0.5% |
| Cuban | 146 | 0.5% |
| Czech | 387 | 1.3% |
| Czechoslovakian | 18 | 0.1% |
| Danish | 80 | 0.3% |
| Dominican | 37 | 0.1% |
| Dutch | 550 | 1.8% |
| Eastern European | 102 | 0.3% |
| English | 2,376 | 8.0% |
| Ethiopian | 37 | 0.1% |
| European | 396 | 1.3% |
| Filipino | 17 | 0.1% |
| Finnish | 55 | 0.2% |
| French | 430 | 1.4% |
| French Canadian | 175 | 0.6% |
| German | 7,305 | 24.4% |
| Greek | 397 | 1.3% |
| Guatemalan | 34 | 0.1% |
| Honduran | 26 | 0.1% |
| Hungarian | 163 | 0.5% |
| Indian (Asian) | 288 | 1.0% |
| Iranian | 26 | 0.1% |
| Irish | 4,193 | 14.0% |
| Italian | 3,286 | 11.0% |
| Jamaican | 16 | 0.1% |
| Japanese | 24 | 0.1% |
| Korean | 561 | 1.9% |
| Lithuanian | 204 | 0.7% |
| Malaysian | 39 | 0.1% |
| Menominee | 3 | 0.0% |
| Mexican | 2,447 | 8.2% |
| Mexican American Indian | 186 | 0.6% |
| Nicaraguan | 89 | 0.3% |
| Northern European | 52 | 0.2% |
| Norwegian | 367 | 1.2% |
| Ottawa | 1 | 0.0% |
| Panamanian | 27 | 0.1% |
| Polish | 4,678 | 15.7% |
| Portuguese | 27 | 0.1% |
| Puerto Rican | 301 | 1.0% |
| Romanian | 96 | 0.3% |
| Russian | 452 | 1.5% |
| Scandinavian | 163 | 0.5% |
| Scotch-Irish | 153 | 0.5% |
| Scottish | 581 | 1.9% |
| Serbian | 27 | 0.1% |
| Slovak | 165 | 0.5% |
| Slovene | 19 | 0.1% |
| South American | 153 | 0.5% |
| Spaniard | 27 | 0.1% |
| Spanish | 50 | 0.2% |
| Sri Lankan | 223 | 0.7% |
| Subsaharan African | 58 | 0.2% |
| Swedish | 1,166 | 3.9% |
| Swiss | 49 | 0.2% |
| Syrian | 12 | 0.0% |
| Thai | 292 | 1.0% |
| Turkish | 14 | 0.1% |
| Ukrainian | 407 | 1.4% |
| Venezuelan | 8 | 0.0% |
| Welsh | 157 | 0.5% |
| Yugoslavian | 61 | 0.2% | View All 81 Rows |
Immigrants in Algonquin
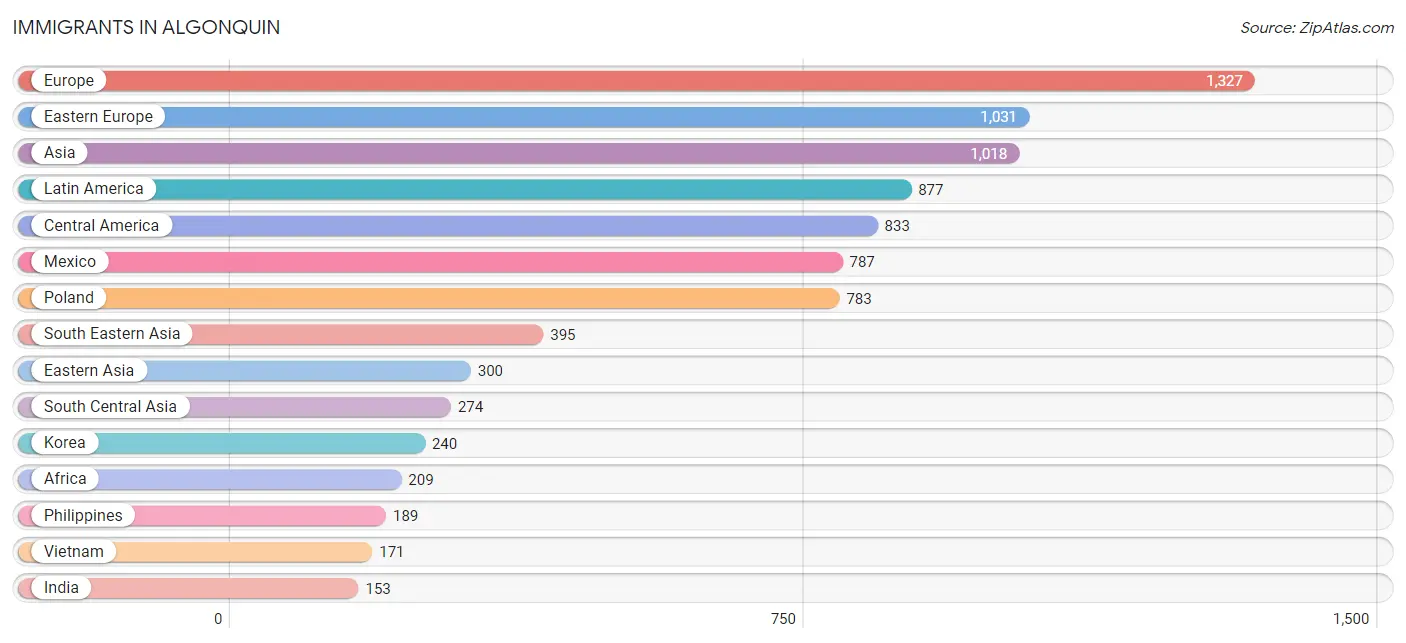
The most numerous immigrant groups reported in Algonquin came from Europe (1,327 | 4.4%), Eastern Europe (1,031 | 3.5%), Asia (1,018 | 3.4%), Latin America (877 | 2.9%), and Central America (833 | 2.8%), together accounting for 17.0% of all Algonquin residents.
| Immigration Origin | # Population | % Population |
| Africa | 209 | 0.7% |
| Asia | 1,018 | 3.4% |
| Belgium | 31 | 0.1% |
| Bosnia and Herzegovina | 14 | 0.1% |
| Cambodia | 24 | 0.1% |
| Canada | 36 | 0.1% |
| Caribbean | 35 | 0.1% |
| Central America | 833 | 2.8% |
| Chile | 9 | 0.0% |
| China | 60 | 0.2% |
| Cuba | 14 | 0.1% |
| Czechoslovakia | 10 | 0.0% |
| Dominican Republic | 21 | 0.1% |
| Eastern Africa | 71 | 0.2% |
| Eastern Asia | 300 | 1.0% |
| Eastern Europe | 1,031 | 3.5% |
| Egypt | 82 | 0.3% |
| El Salvador | 7 | 0.0% |
| England | 4 | 0.0% |
| Ethiopia | 71 | 0.2% |
| Europe | 1,327 | 4.4% |
| Germany | 51 | 0.2% |
| Greece | 65 | 0.2% |
| Guatemala | 39 | 0.1% |
| Hong Kong | 13 | 0.0% |
| India | 153 | 0.5% |
| Ireland | 80 | 0.3% |
| Italy | 54 | 0.2% |
| Korea | 240 | 0.8% |
| Laos | 11 | 0.0% |
| Latin America | 877 | 2.9% |
| Latvia | 5 | 0.0% |
| Mexico | 787 | 2.6% |
| Moldova | 30 | 0.1% |
| Northern Africa | 82 | 0.3% |
| Northern Europe | 95 | 0.3% |
| Pakistan | 121 | 0.4% |
| Philippines | 189 | 0.6% |
| Poland | 783 | 2.6% |
| Romania | 43 | 0.1% |
| Russia | 22 | 0.1% |
| Scotland | 3 | 0.0% |
| South America | 9 | 0.0% |
| South Central Asia | 274 | 0.9% |
| South Eastern Asia | 395 | 1.3% |
| Southern Europe | 119 | 0.4% |
| Sweden | 8 | 0.0% |
| Taiwan | 33 | 0.1% |
| Ukraine | 124 | 0.4% |
| Vietnam | 171 | 0.6% |
| Western Asia | 49 | 0.2% |
| Western Europe | 82 | 0.3% | View All 52 Rows |
Sex and Age in Algonquin
Sex and Age in Algonquin
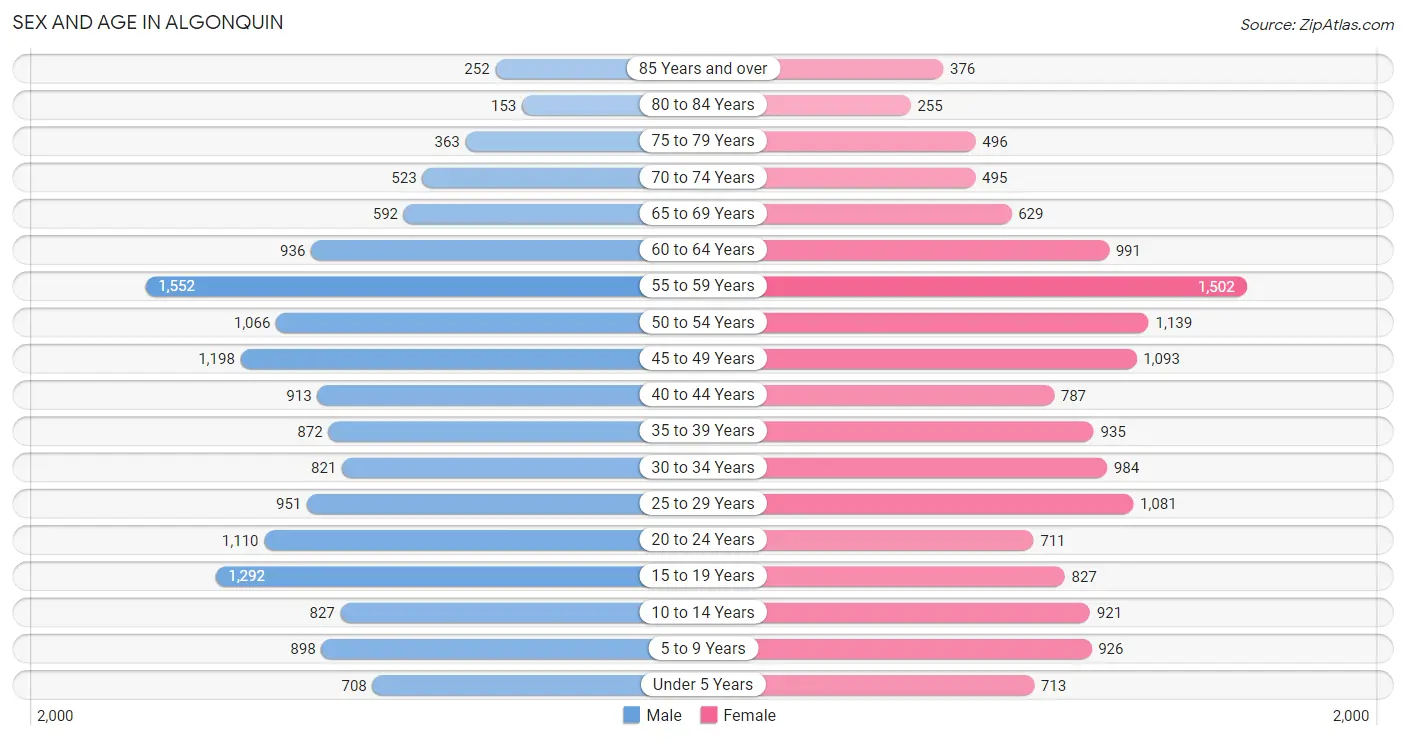
The most populous age groups in Algonquin are 55 to 59 Years (1,552 | 10.3%) for men and 55 to 59 Years (1,502 | 10.1%) for women.
| Age Bracket | Male | Female |
| Under 5 Years | 708 (4.7%) | 713 (4.8%) |
| 5 to 9 Years | 898 (6.0%) | 926 (6.2%) |
| 10 to 14 Years | 827 (5.5%) | 921 (6.2%) |
| 15 to 19 Years | 1,292 (8.6%) | 827 (5.6%) |
| 20 to 24 Years | 1,110 (7.4%) | 711 (4.8%) |
| 25 to 29 Years | 951 (6.3%) | 1,081 (7.3%) |
| 30 to 34 Years | 821 (5.5%) | 984 (6.6%) |
| 35 to 39 Years | 872 (5.8%) | 935 (6.3%) |
| 40 to 44 Years | 913 (6.1%) | 787 (5.3%) |
| 45 to 49 Years | 1,198 (8.0%) | 1,093 (7.3%) |
| 50 to 54 Years | 1,066 (7.1%) | 1,139 (7.7%) |
| 55 to 59 Years | 1,552 (10.3%) | 1,502 (10.1%) |
| 60 to 64 Years | 936 (6.2%) | 991 (6.7%) |
| 65 to 69 Years | 592 (3.9%) | 629 (4.2%) |
| 70 to 74 Years | 523 (3.5%) | 495 (3.3%) |
| 75 to 79 Years | 363 (2.4%) | 496 (3.3%) |
| 80 to 84 Years | 153 (1.0%) | 255 (1.7%) |
| 85 Years and over | 252 (1.7%) | 376 (2.5%) |
| Total | 15,027 (100.0%) | 14,861 (100.0%) |
Families and Households in Algonquin
Median Family Size in Algonquin
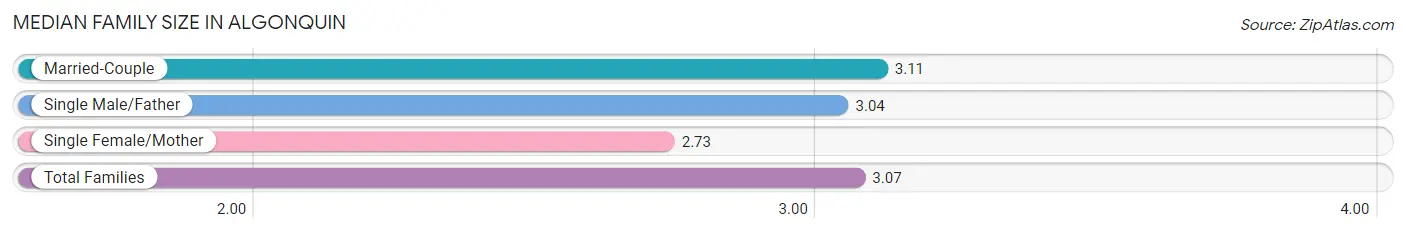
The median family size in Algonquin is 3.07 persons per family, with married-couple families (6,770 | 81.0%) accounting for the largest median family size of 3.11 persons per family. On the other hand, single female/mother families (832 | 10.0%) represent the smallest median family size with 2.73 persons per family.
| Family Type | # Families | Family Size |
| Married-Couple | 6,770 (81.0%) | 3.11 |
| Single Male/Father | 755 (9.0%) | 3.04 |
| Single Female/Mother | 832 (10.0%) | 2.73 |
| Total Families | 8,357 (100.0%) | 3.07 |
Median Household Size in Algonquin
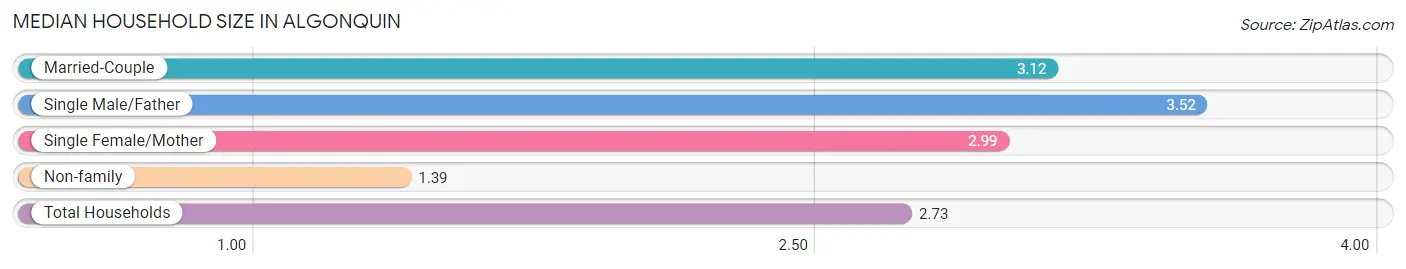
The median household size in Algonquin is 2.73 persons per household, with single male/father households (755 | 6.9%) accounting for the largest median household size of 3.52 persons per household. non-family households (2,607 | 23.8%) represent the smallest median household size with 1.39 persons per household.
| Household Type | # Households | Household Size |
| Married-Couple | 6,770 (61.8%) | 3.12 |
| Single Male/Father | 755 (6.9%) | 3.52 |
| Single Female/Mother | 832 (7.6%) | 2.99 |
| Non-family | 2,607 (23.8%) | 1.39 |
| Total Households | 10,964 (100.0%) | 2.73 |
Household Size by Marriage Status in Algonquin
Out of a total of 10,964 households in Algonquin, 8,357 (76.2%) are family households, while 2,607 (23.8%) are nonfamily households. The most numerous type of family households are 2-person households, comprising 3,271, and the most common type of nonfamily households are 1-person households, comprising 1,950.
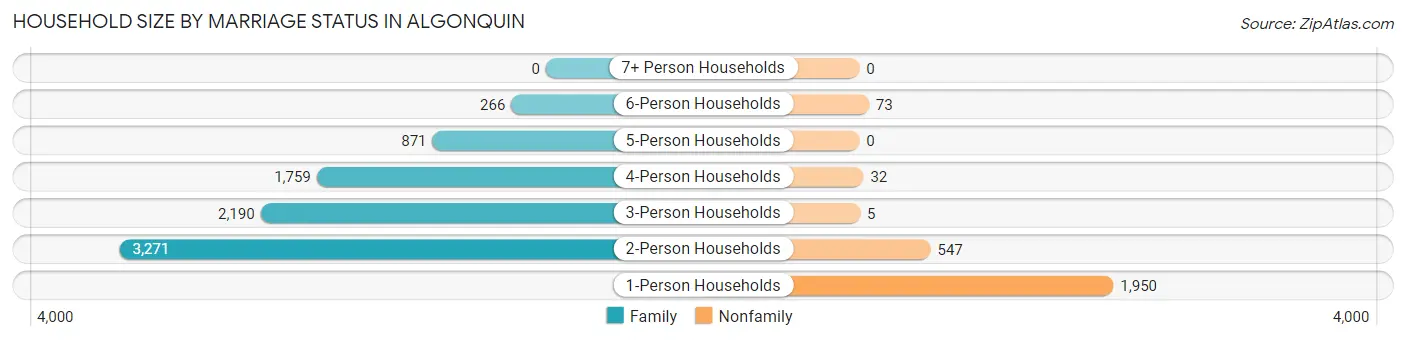
| Household Size | Family Households | Nonfamily Households |
| 1-Person Households | - | 1,950 (17.8%) |
| 2-Person Households | 3,271 (29.8%) | 547 (5.0%) |
| 3-Person Households | 2,190 (20.0%) | 5 (0.1%) |
| 4-Person Households | 1,759 (16.0%) | 32 (0.3%) |
| 5-Person Households | 871 (7.9%) | 0 (0.0%) |
| 6-Person Households | 266 (2.4%) | 73 (0.7%) |
| 7+ Person Households | 0 (0.0%) | 0 (0.0%) |
| Total | 8,357 (76.2%) | 2,607 (23.8%) |
Female Fertility in Algonquin
Fertility by Age in Algonquin
Average fertility rate in Algonquin is 31.0 births per 1,000 women. Women in the age bracket of 20 to 34 years have the highest fertility rate with 66.0 births per 1,000 women. Women in the age bracket of 20 to 34 years acount for 88.4% of all women with births.
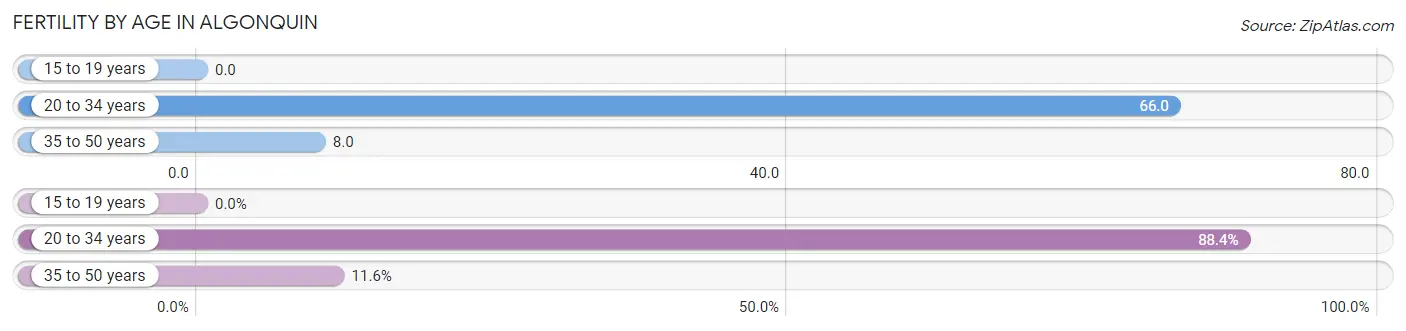
| Age Bracket | Women with Births | Births / 1,000 Women |
| 15 to 19 years | 0 (0.0%) | 0.0 |
| 20 to 34 years | 183 (88.4%) | 66.0 |
| 35 to 50 years | 24 (11.6%) | 8.0 |
| Total | 207 (100.0%) | 31.0 |
Fertility by Age by Marriage Status in Algonquin
94.7% of women with births (207) in Algonquin are married. The highest percentage of unmarried women with births falls into 20 to 34 years age bracket with 6.0% of them unmarried at the time of birth, while the lowest percentage of unmarried women with births belong to 35 to 50 years age bracket with 0.0% of them unmarried.
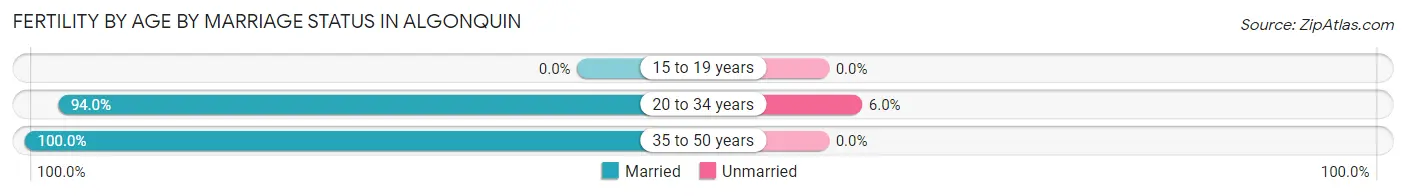
| Age Bracket | Married | Unmarried |
| 15 to 19 years | 0 (0.0%) | 0 (0.0%) |
| 20 to 34 years | 172 (94.0%) | 11 (6.0%) |
| 35 to 50 years | 24 (100.0%) | 0 (0.0%) |
| Total | 196 (94.7%) | 11 (5.3%) |
Fertility by Education in Algonquin
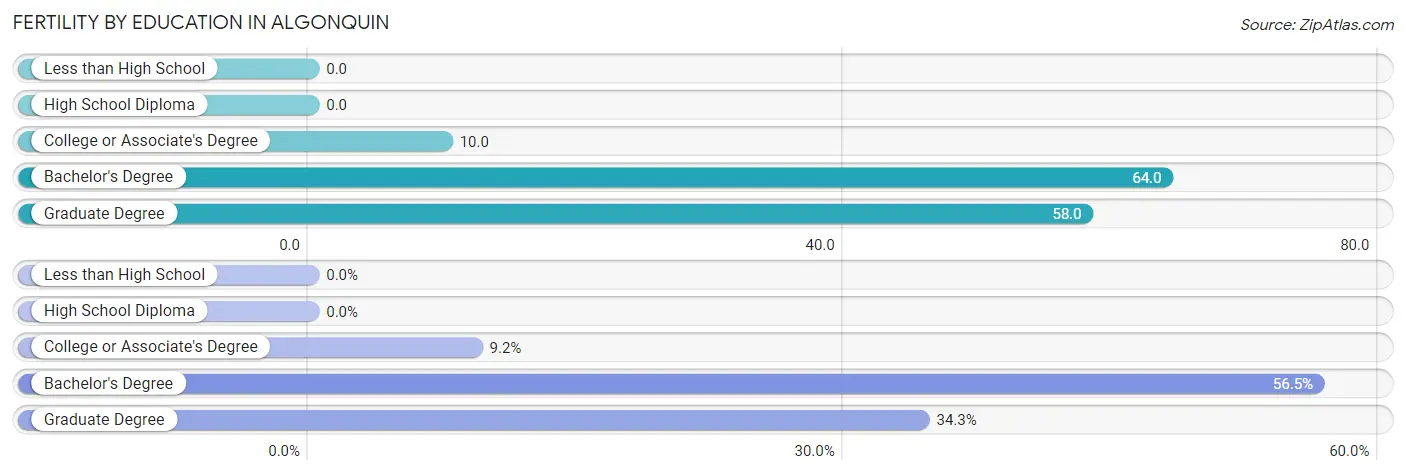
| Educational Attainment | Women with Births | Births / 1,000 Women |
| Less than High School | 0 (0.0%) | 0.0 |
| High School Diploma | 0 (0.0%) | 0.0 |
| College or Associate's Degree | 19 (9.2%) | 10.0 |
| Bachelor's Degree | 117 (56.5%) | 64.0 |
| Graduate Degree | 71 (34.3%) | 58.0 |
| Total | 207 (100.0%) | 31.0 |
Fertility by Education by Marriage Status in Algonquin
5.3% of women with births in Algonquin are unmarried. Women with the educational attainment of bachelor's degree are most likely to be married with 100.0% of them married at childbirth, while women with the educational attainment of college or associate's degree are least likely to be married with 57.9% of them unmarried at childbirth.
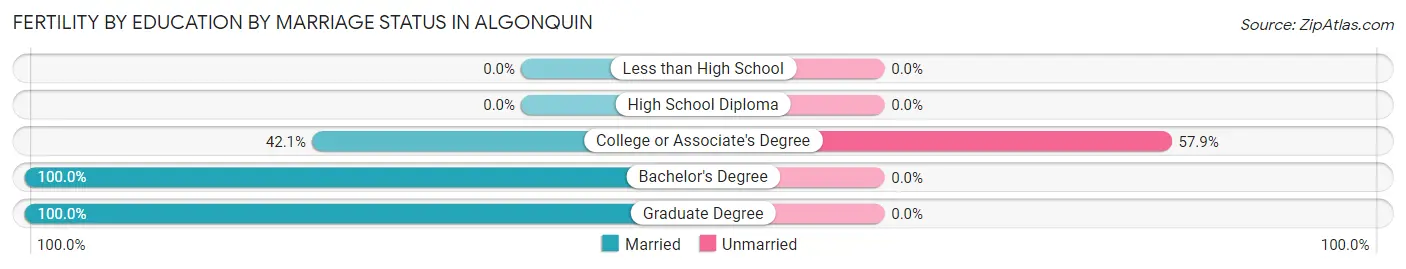
| Educational Attainment | Married | Unmarried |
| Less than High School | 0 (0.0%) | 0 (0.0%) |
| High School Diploma | 0 (0.0%) | 0 (0.0%) |
| College or Associate's Degree | 8 (42.1%) | 11 (57.9%) |
| Bachelor's Degree | 117 (100.0%) | 0 (0.0%) |
| Graduate Degree | 71 (100.0%) | 0 (0.0%) |
| Total | 196 (94.7%) | 11 (5.3%) |
Employment Characteristics in Algonquin
Employment by Class of Employer in Algonquin
Among the 17,197 employed individuals in Algonquin, private company employees (12,583 | 73.2%), local government employees (1,540 | 9.0%), and not-for-profit organizations (1,339 | 7.8%) make up the most common classes of employment.
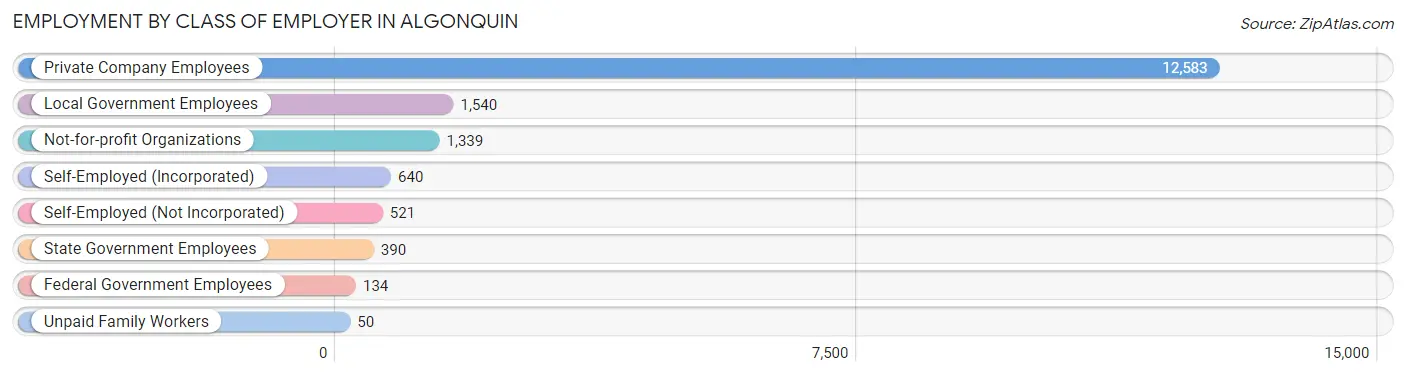
| Employer Class | # Employees | % Employees |
| Private Company Employees | 12,583 | 73.2% |
| Self-Employed (Incorporated) | 640 | 3.7% |
| Self-Employed (Not Incorporated) | 521 | 3.0% |
| Not-for-profit Organizations | 1,339 | 7.8% |
| Local Government Employees | 1,540 | 9.0% |
| State Government Employees | 390 | 2.3% |
| Federal Government Employees | 134 | 0.8% |
| Unpaid Family Workers | 50 | 0.3% |
| Total | 17,197 | 100.0% |
Employment Status by Age in Algonquin
According to the labor force statistics for Algonquin, out of the total population over 16 years of age (24,483), 74.8% or 18,313 individuals are in the labor force, with 4.7% or 861 of them unemployed. The age group with the highest labor force participation rate is 30 to 34 years, with 90.8% or 1,639 individuals in the labor force. Within the labor force, the 20 to 24 years age range has the highest percentage of unemployed individuals, with 14.4% or 215 of them being unemployed.
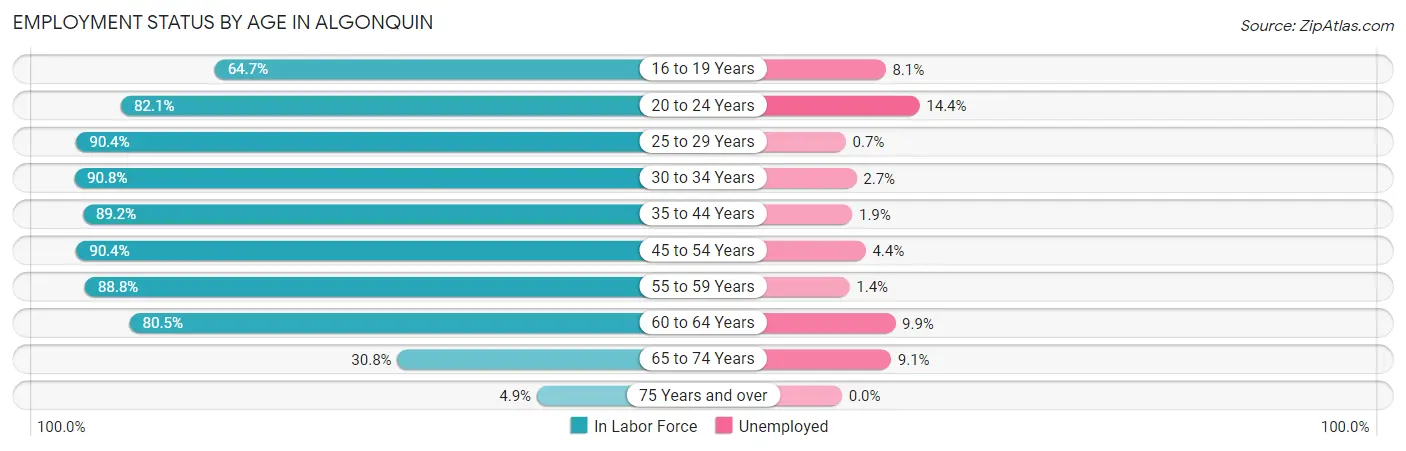
| Age Bracket | In Labor Force | Unemployed |
| 16 to 19 Years | 1,104 (64.7%) | 89 (8.1%) |
| 20 to 24 Years | 1,495 (82.1%) | 215 (14.4%) |
| 25 to 29 Years | 1,837 (90.4%) | 13 (0.7%) |
| 30 to 34 Years | 1,639 (90.8%) | 44 (2.7%) |
| 35 to 44 Years | 3,128 (89.2%) | 59 (1.9%) |
| 45 to 54 Years | 4,064 (90.4%) | 179 (4.4%) |
| 55 to 59 Years | 2,712 (88.8%) | 38 (1.4%) |
| 60 to 64 Years | 1,551 (80.5%) | 154 (9.9%) |
| 65 to 74 Years | 690 (30.8%) | 63 (9.1%) |
| 75 Years and over | 93 (4.9%) | 0 (0.0%) |
| Total | 18,313 (74.8%) | 861 (4.7%) |
Employment Status by Educational Attainment in Algonquin
According to labor force statistics for Algonquin, 88.8% of individuals (14,937) out of the total population between 25 and 64 years of age (16,821) are in the labor force, with 3.2% or 478 of them being unemployed. The group with the highest labor force participation rate are those with the educational attainment of bachelor's degree or higher, with 91.5% or 7,229 individuals in the labor force. Within the labor force, individuals with high school diploma education have the highest percentage of unemployment, with 6.8% or 165 of them being unemployed.
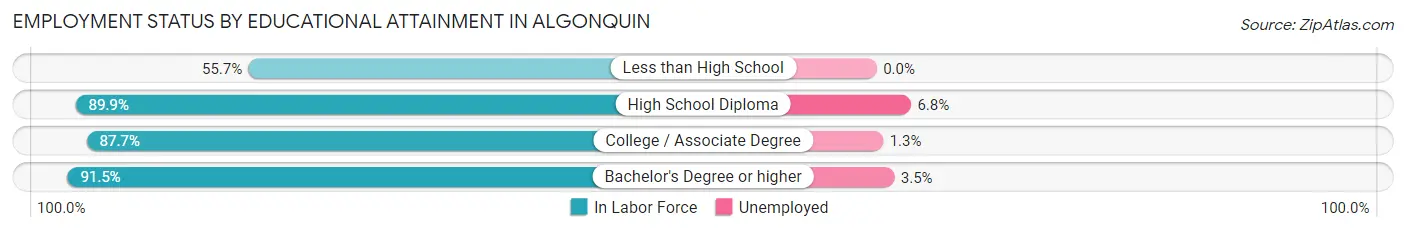
| Educational Attainment | In Labor Force | Unemployed |
| Less than High School | 308 (55.7%) | 0 (0.0%) |
| High School Diploma | 2,429 (89.9%) | 184 (6.8%) |
| College / Associate Degree | 4,968 (87.7%) | 74 (1.3%) |
| Bachelor's Degree or higher | 7,229 (91.5%) | 277 (3.5%) |
| Total | 14,937 (88.8%) | 538 (3.2%) |
Employment Occupations by Sex in Algonquin
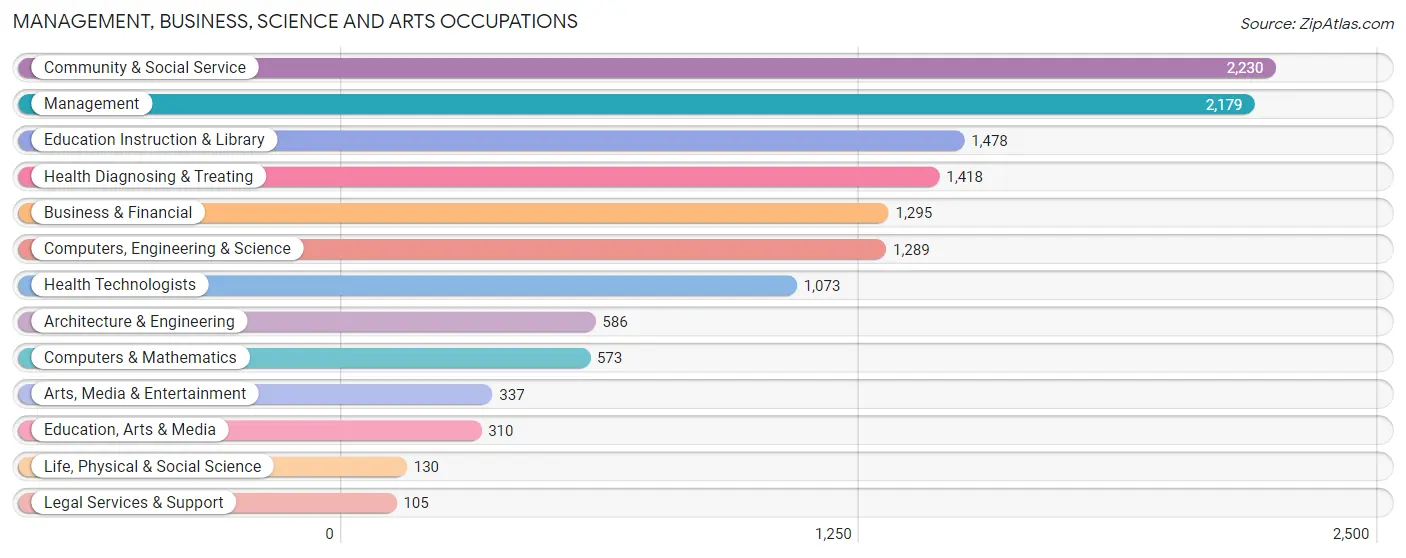
Management, Business, Science and Arts Occupations
The most common Management, Business, Science and Arts occupations in Algonquin are Community & Social Service (2,230 | 12.8%), Management (2,179 | 12.5%), Education Instruction & Library (1,478 | 8.5%), Health Diagnosing & Treating (1,418 | 8.1%), and Business & Financial (1,295 | 7.4%).
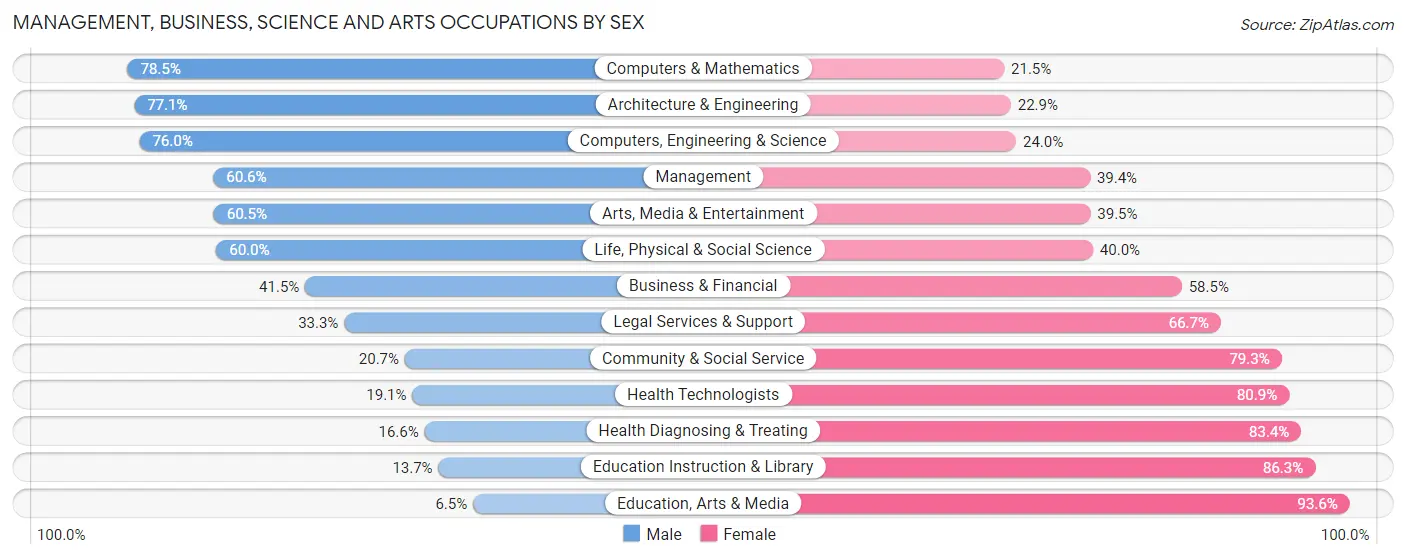
Management, Business, Science and Arts Occupations by Sex
Within the Management, Business, Science and Arts occupations in Algonquin, the most male-oriented occupations are Computers & Mathematics (78.5%), Architecture & Engineering (77.1%), and Computers, Engineering & Science (76.0%), while the most female-oriented occupations are Education, Arts & Media (93.5%), Education Instruction & Library (86.3%), and Health Diagnosing & Treating (83.4%).
| Occupation | Male | Female |
| Management | 1,321 (60.6%) | 858 (39.4%) |
| Business & Financial | 537 (41.5%) | 758 (58.5%) |
| Computers, Engineering & Science | 980 (76.0%) | 309 (24.0%) |
| Computers & Mathematics | 450 (78.5%) | 123 (21.5%) |
| Architecture & Engineering | 452 (77.1%) | 134 (22.9%) |
| Life, Physical & Social Science | 78 (60.0%) | 52 (40.0%) |
| Community & Social Service | 461 (20.7%) | 1,769 (79.3%) |
| Education, Arts & Media | 20 (6.5%) | 290 (93.5%) |
| Legal Services & Support | 35 (33.3%) | 70 (66.7%) |
| Education Instruction & Library | 202 (13.7%) | 1,276 (86.3%) |
| Arts, Media & Entertainment | 204 (60.5%) | 133 (39.5%) |
| Health Diagnosing & Treating | 235 (16.6%) | 1,183 (83.4%) |
| Health Technologists | 205 (19.1%) | 868 (80.9%) |
| Total (Category) | 3,534 (42.0%) | 4,877 (58.0%) |
| Total (Overall) | 9,300 (53.3%) | 8,161 (46.7%) |
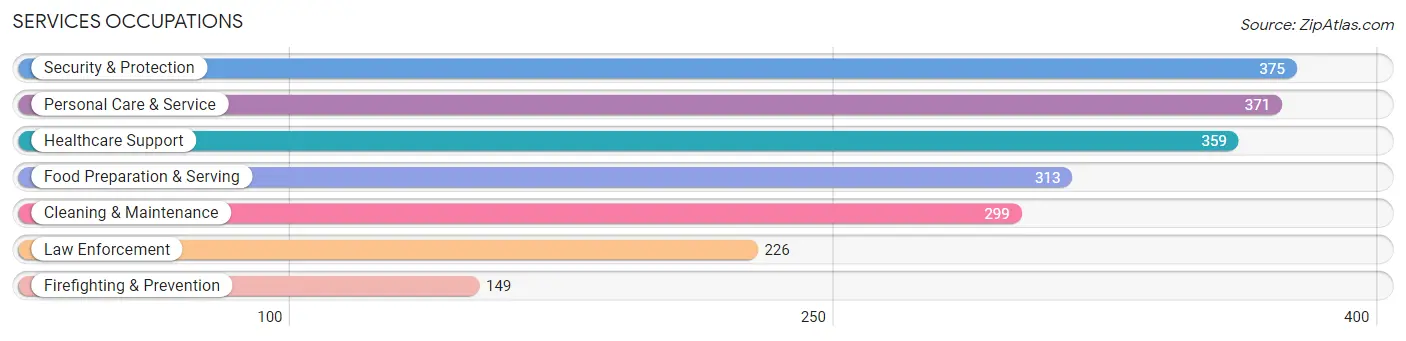
Services Occupations
The most common Services occupations in Algonquin are Security & Protection (375 | 2.1%), Personal Care & Service (371 | 2.1%), Healthcare Support (359 | 2.1%), Food Preparation & Serving (313 | 1.8%), and Cleaning & Maintenance (299 | 1.7%).
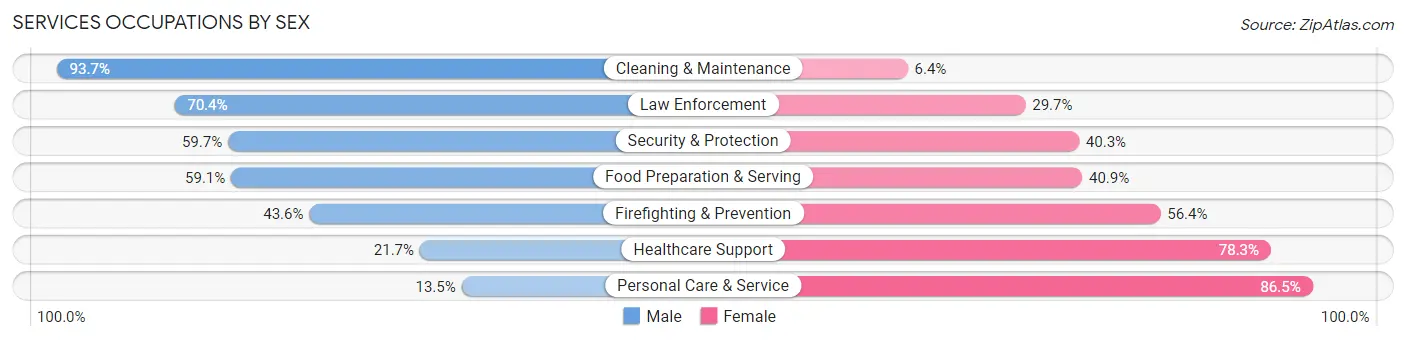
Services Occupations by Sex
Within the Services occupations in Algonquin, the most male-oriented occupations are Cleaning & Maintenance (93.6%), Law Enforcement (70.4%), and Security & Protection (59.7%), while the most female-oriented occupations are Personal Care & Service (86.5%), Healthcare Support (78.3%), and Firefighting & Prevention (56.4%).
| Occupation | Male | Female |
| Healthcare Support | 78 (21.7%) | 281 (78.3%) |
| Security & Protection | 224 (59.7%) | 151 (40.3%) |
| Firefighting & Prevention | 65 (43.6%) | 84 (56.4%) |
| Law Enforcement | 159 (70.4%) | 67 (29.6%) |
| Food Preparation & Serving | 185 (59.1%) | 128 (40.9%) |
| Cleaning & Maintenance | 280 (93.6%) | 19 (6.4%) |
| Personal Care & Service | 50 (13.5%) | 321 (86.5%) |
| Total (Category) | 817 (47.6%) | 900 (52.4%) |
| Total (Overall) | 9,300 (53.3%) | 8,161 (46.7%) |
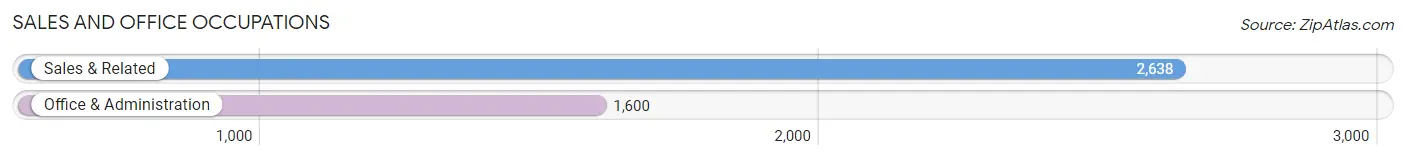
Sales and Office Occupations
The most common Sales and Office occupations in Algonquin are Sales & Related (2,638 | 15.1%), and Office & Administration (1,600 | 9.2%).
Sales and Office Occupations by Sex
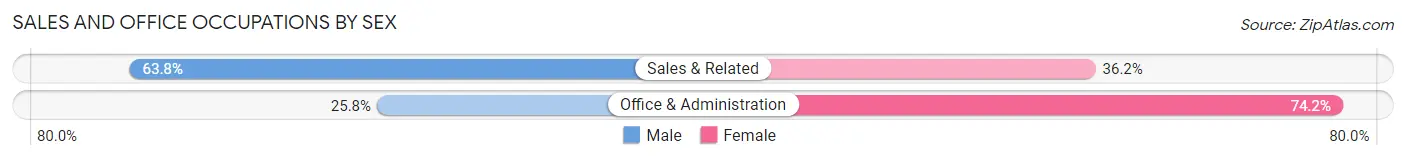
| Occupation | Male | Female |
| Sales & Related | 1,684 (63.8%) | 954 (36.2%) |
| Office & Administration | 413 (25.8%) | 1,187 (74.2%) |
| Total (Category) | 2,097 (49.5%) | 2,141 (50.5%) |
| Total (Overall) | 9,300 (53.3%) | 8,161 (46.7%) |
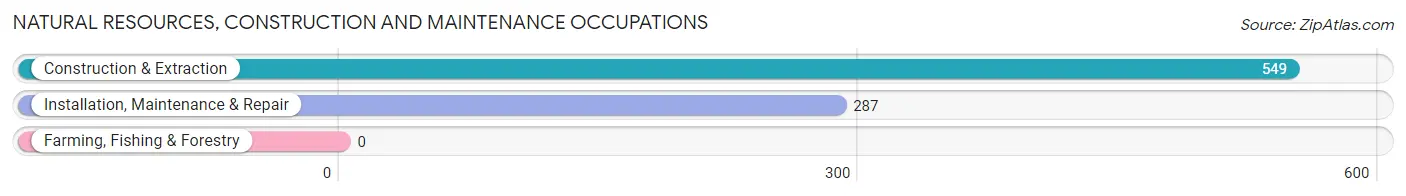
Natural Resources, Construction and Maintenance Occupations
The most common Natural Resources, Construction and Maintenance occupations in Algonquin are Construction & Extraction (549 | 3.1%), and Installation, Maintenance & Repair (287 | 1.6%).
Natural Resources, Construction and Maintenance Occupations by Sex
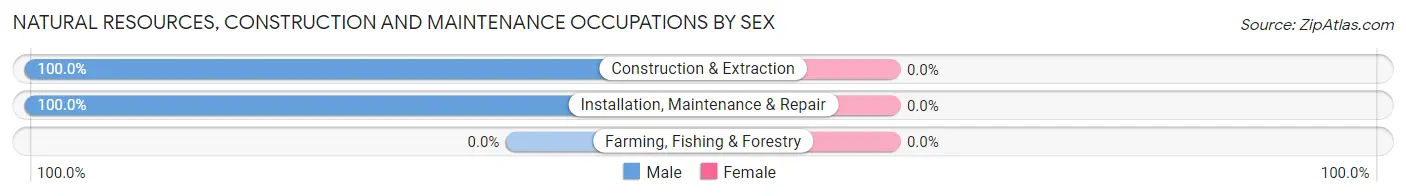
| Occupation | Male | Female |
| Farming, Fishing & Forestry | 0 (0.0%) | 0 (0.0%) |
| Construction & Extraction | 549 (100.0%) | 0 (0.0%) |
| Installation, Maintenance & Repair | 287 (100.0%) | 0 (0.0%) |
| Total (Category) | 836 (100.0%) | 0 (0.0%) |
| Total (Overall) | 9,300 (53.3%) | 8,161 (46.7%) |
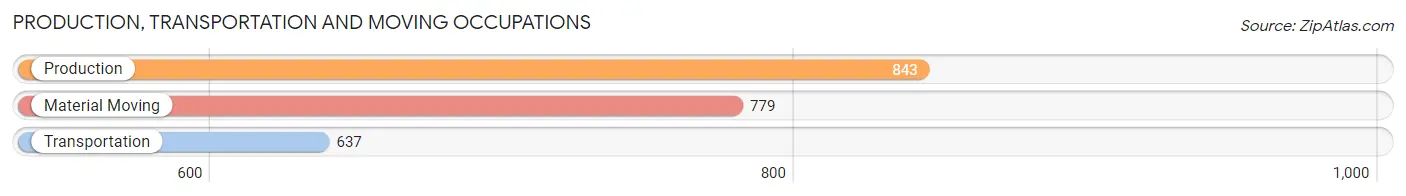
Production, Transportation and Moving Occupations
The most common Production, Transportation and Moving occupations in Algonquin are Production (843 | 4.8%), Material Moving (779 | 4.5%), and Transportation (637 | 3.6%).
Production, Transportation and Moving Occupations by Sex
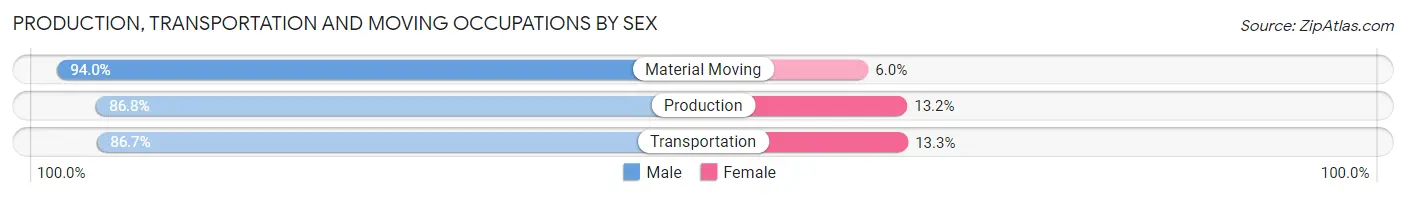
| Occupation | Male | Female |
| Production | 732 (86.8%) | 111 (13.2%) |
| Transportation | 552 (86.7%) | 85 (13.3%) |
| Material Moving | 732 (94.0%) | 47 (6.0%) |
| Total (Category) | 2,016 (89.2%) | 243 (10.8%) |
| Total (Overall) | 9,300 (53.3%) | 8,161 (46.7%) |
Employment Industries by Sex in Algonquin
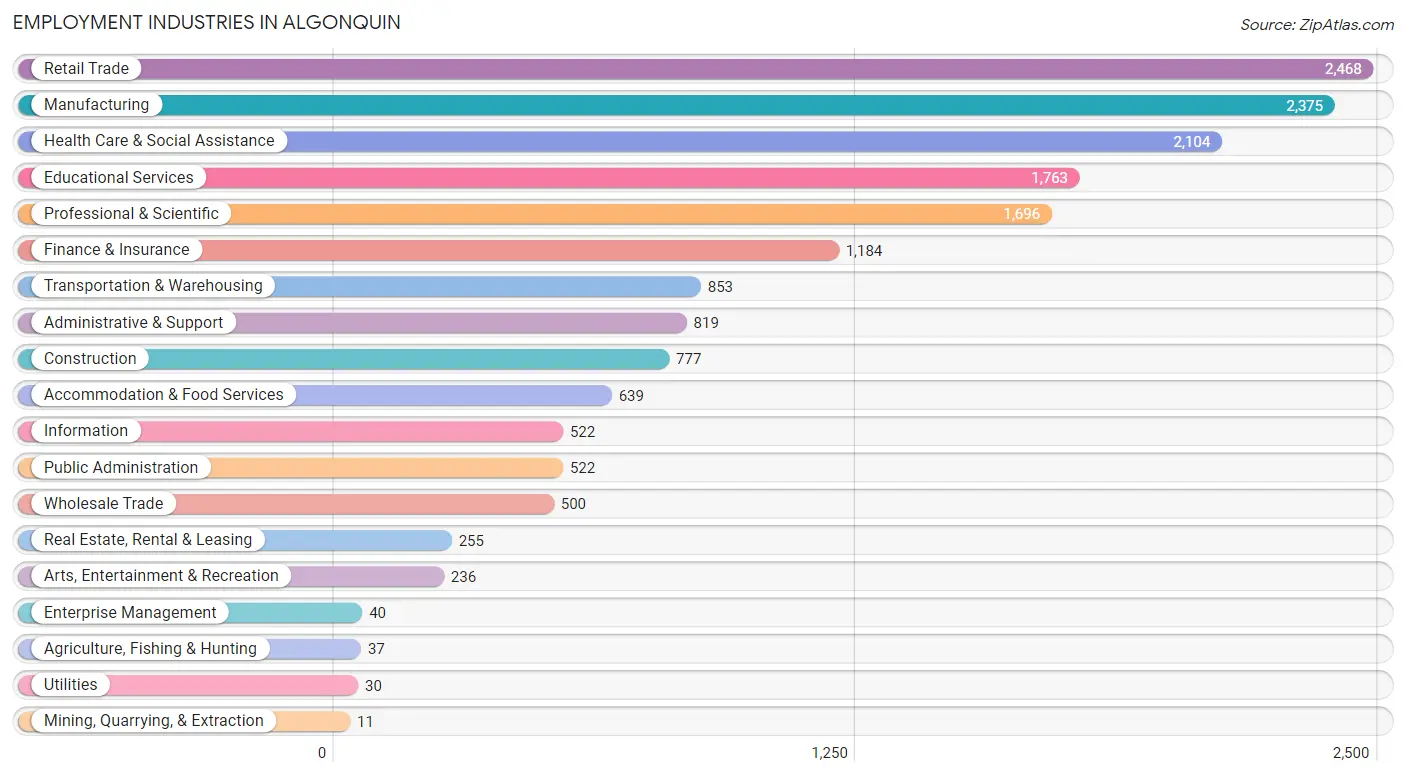
Employment Industries in Algonquin
The major employment industries in Algonquin include Retail Trade (2,468 | 14.1%), Manufacturing (2,375 | 13.6%), Health Care & Social Assistance (2,104 | 12.0%), Educational Services (1,763 | 10.1%), and Professional & Scientific (1,696 | 9.7%).
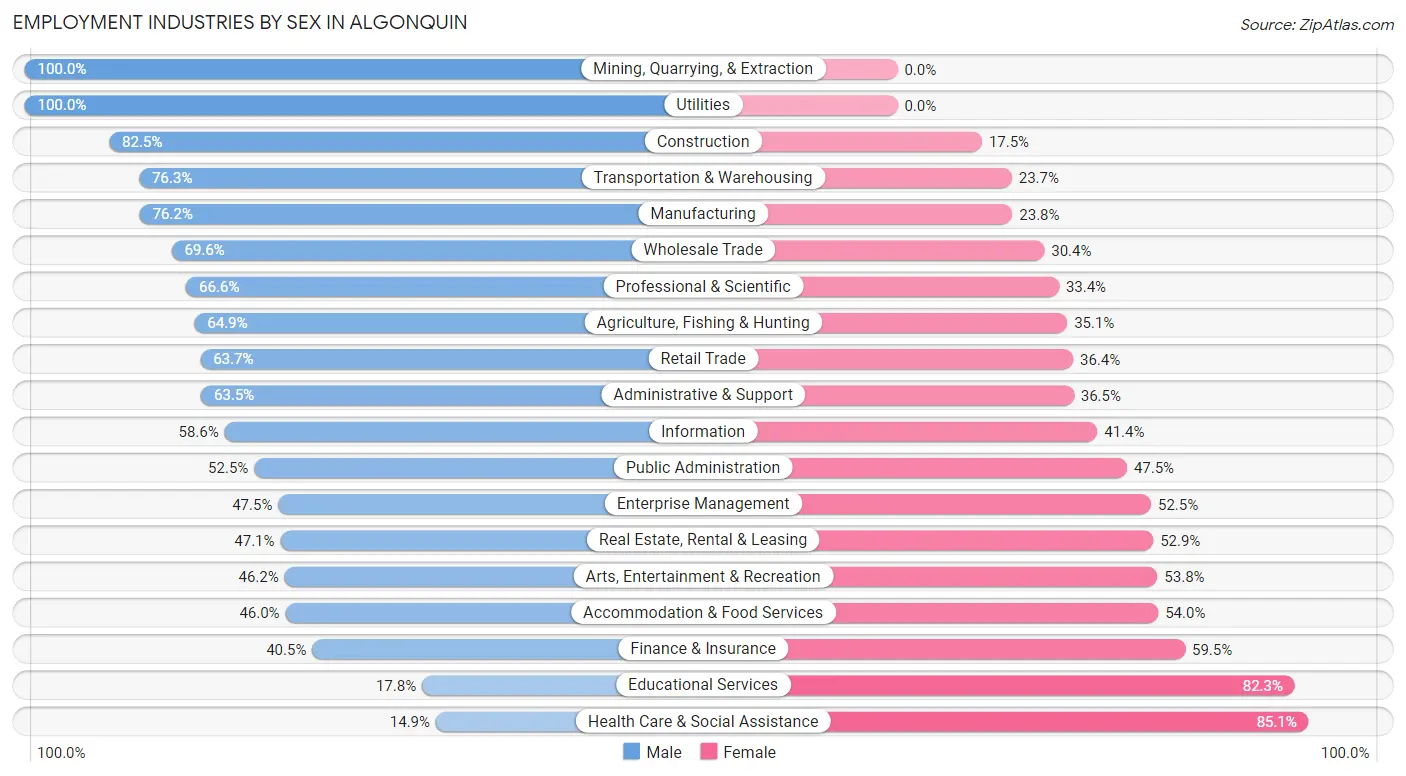
Employment Industries by Sex in Algonquin
The Algonquin industries that see more men than women are Mining, Quarrying, & Extraction (100.0%), Utilities (100.0%), and Construction (82.5%), whereas the industries that tend to have a higher number of women are Health Care & Social Assistance (85.1%), Educational Services (82.3%), and Finance & Insurance (59.5%).
| Industry | Male | Female |
| Agriculture, Fishing & Hunting | 24 (64.9%) | 13 (35.1%) |
| Mining, Quarrying, & Extraction | 11 (100.0%) | 0 (0.0%) |
| Construction | 641 (82.5%) | 136 (17.5%) |
| Manufacturing | 1,810 (76.2%) | 565 (23.8%) |
| Wholesale Trade | 348 (69.6%) | 152 (30.4%) |
| Retail Trade | 1,571 (63.6%) | 897 (36.3%) |
| Transportation & Warehousing | 651 (76.3%) | 202 (23.7%) |
| Utilities | 30 (100.0%) | 0 (0.0%) |
| Information | 306 (58.6%) | 216 (41.4%) |
| Finance & Insurance | 479 (40.5%) | 705 (59.5%) |
| Real Estate, Rental & Leasing | 120 (47.1%) | 135 (52.9%) |
| Professional & Scientific | 1,129 (66.6%) | 567 (33.4%) |
| Enterprise Management | 19 (47.5%) | 21 (52.5%) |
| Administrative & Support | 520 (63.5%) | 299 (36.5%) |
| Educational Services | 313 (17.7%) | 1,450 (82.3%) |
| Health Care & Social Assistance | 313 (14.9%) | 1,791 (85.1%) |
| Arts, Entertainment & Recreation | 109 (46.2%) | 127 (53.8%) |
| Accommodation & Food Services | 294 (46.0%) | 345 (54.0%) |
| Public Administration | 274 (52.5%) | 248 (47.5%) |
| Total | 9,300 (53.3%) | 8,161 (46.7%) |
Education in Algonquin
School Enrollment in Algonquin
The most common levels of schooling among the 7,119 students in Algonquin are elementary school (1,675 | 23.5%), high school (1,579 | 22.2%), and college / undergraduate (1,556 | 21.9%).
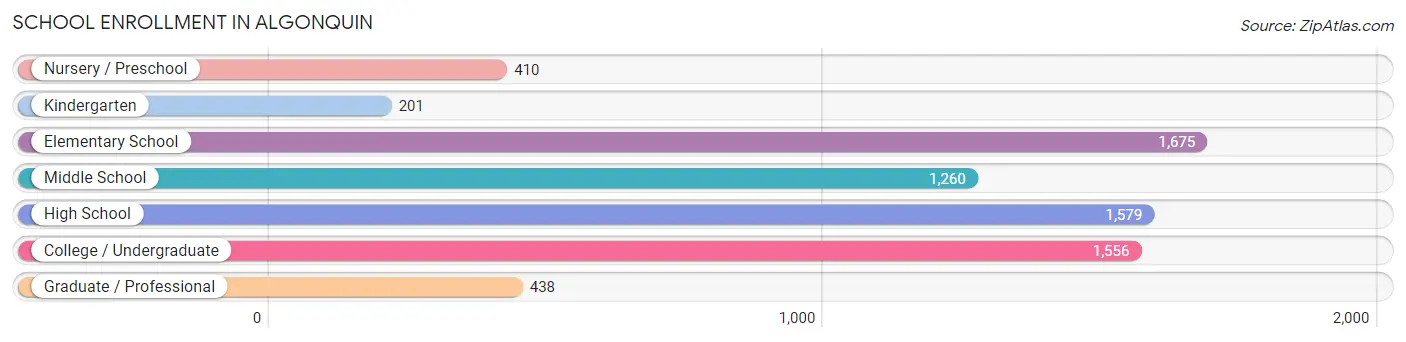
| School Level | # Students | % Students |
| Nursery / Preschool | 410 | 5.8% |
| Kindergarten | 201 | 2.8% |
| Elementary School | 1,675 | 23.5% |
| Middle School | 1,260 | 17.7% |
| High School | 1,579 | 22.2% |
| College / Undergraduate | 1,556 | 21.9% |
| Graduate / Professional | 438 | 6.1% |
| Total | 7,119 | 100.0% |
School Enrollment by Age by Funding Source in Algonquin
Out of a total of 7,119 students who are enrolled in schools in Algonquin, 968 (13.6%) attend a private institution, while the remaining 6,151 (86.4%) are enrolled in public schools. The age group of 25 to 34 year olds has the highest likelihood of being enrolled in private schools, with 201 (51.3% in the age bracket) enrolled. Conversely, the age group of 15 to 17 year olds has the lowest likelihood of being enrolled in a private school, with 1,166 (96.1% in the age bracket) attending a public institution.
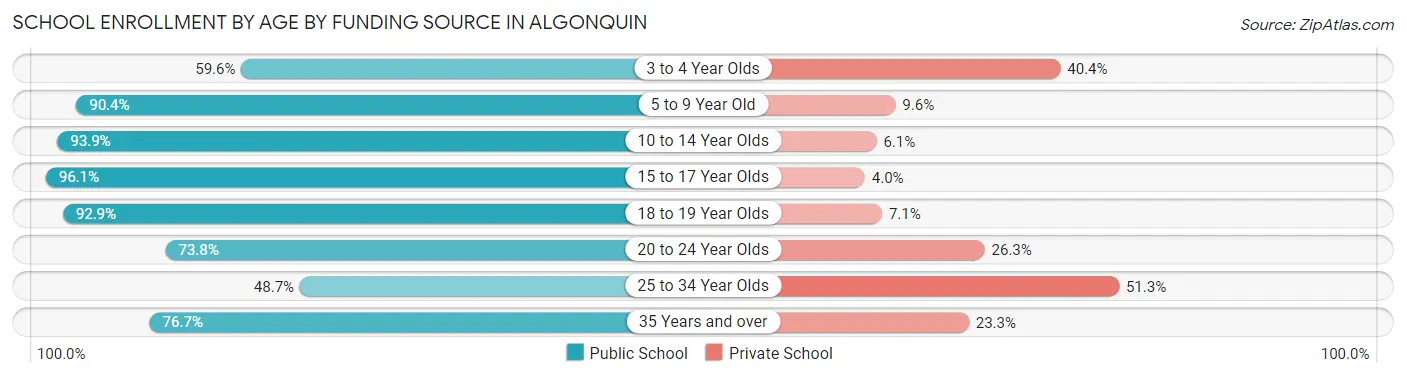
| Age Bracket | Public School | Private School |
| 3 to 4 Year Olds | 198 (59.6%) | 134 (40.4%) |
| 5 to 9 Year Old | 1,527 (90.4%) | 163 (9.6%) |
| 10 to 14 Year Olds | 1,627 (93.9%) | 106 (6.1%) |
| 15 to 17 Year Olds | 1,166 (96.1%) | 48 (4.0%) |
| 18 to 19 Year Olds | 677 (92.9%) | 52 (7.1%) |
| 20 to 24 Year Olds | 531 (73.8%) | 189 (26.3%) |
| 25 to 34 Year Olds | 191 (48.7%) | 201 (51.3%) |
| 35 Years and over | 237 (76.7%) | 72 (23.3%) |
| Total | 6,151 (86.4%) | 968 (13.6%) |
Educational Attainment by Field of Study in Algonquin
Business (2,071 | 21.2%), science & technology (1,386 | 14.2%), education (1,224 | 12.6%), engineering (711 | 7.3%), and arts & humanities (640 | 6.6%) are the most common fields of study among 9,754 individuals in Algonquin who have obtained a bachelor's degree or higher.
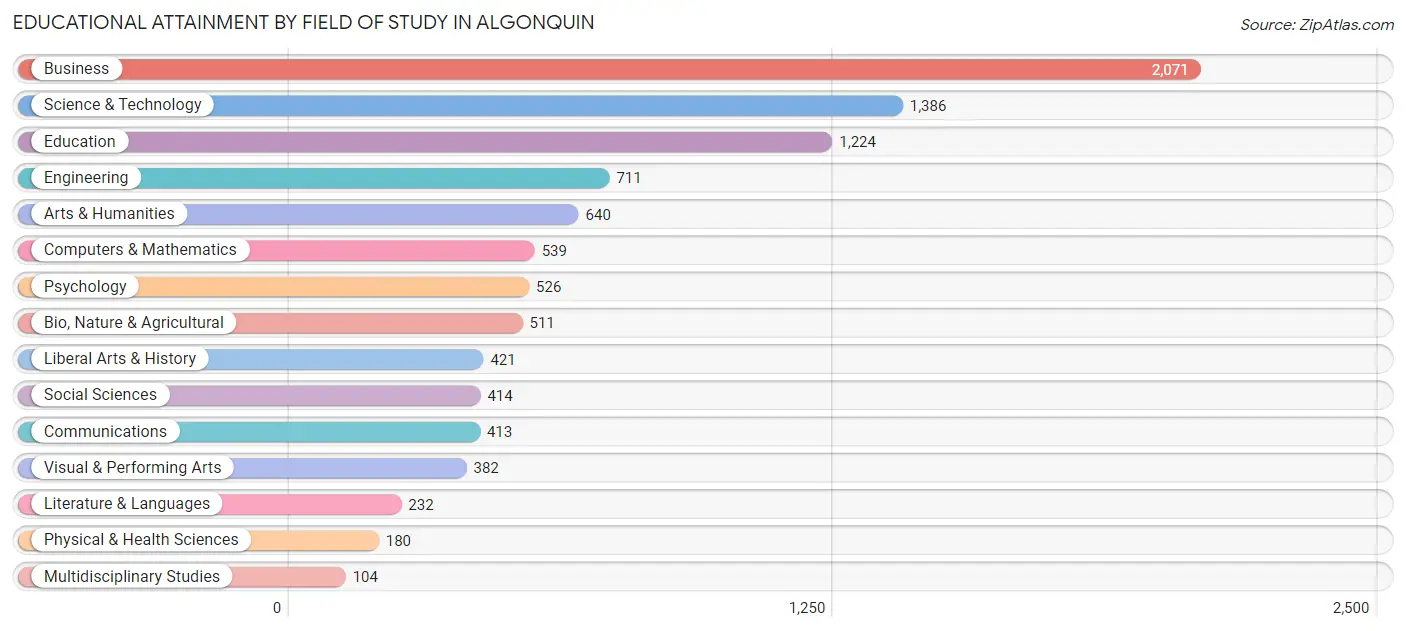
| Field of Study | # Graduates | % Graduates |
| Computers & Mathematics | 539 | 5.5% |
| Bio, Nature & Agricultural | 511 | 5.2% |
| Physical & Health Sciences | 180 | 1.8% |
| Psychology | 526 | 5.4% |
| Social Sciences | 414 | 4.2% |
| Engineering | 711 | 7.3% |
| Multidisciplinary Studies | 104 | 1.1% |
| Science & Technology | 1,386 | 14.2% |
| Business | 2,071 | 21.2% |
| Education | 1,224 | 12.6% |
| Literature & Languages | 232 | 2.4% |
| Liberal Arts & History | 421 | 4.3% |
| Visual & Performing Arts | 382 | 3.9% |
| Communications | 413 | 4.2% |
| Arts & Humanities | 640 | 6.6% |
| Total | 9,754 | 100.0% |
Transportation & Commute in Algonquin
Vehicle Availability by Sex in Algonquin
The most prevalent vehicle ownership categories in Algonquin are males with 2 vehicles (3,801, accounting for 41.4%) and females with 2 vehicles (3,587, making up 47.4%).
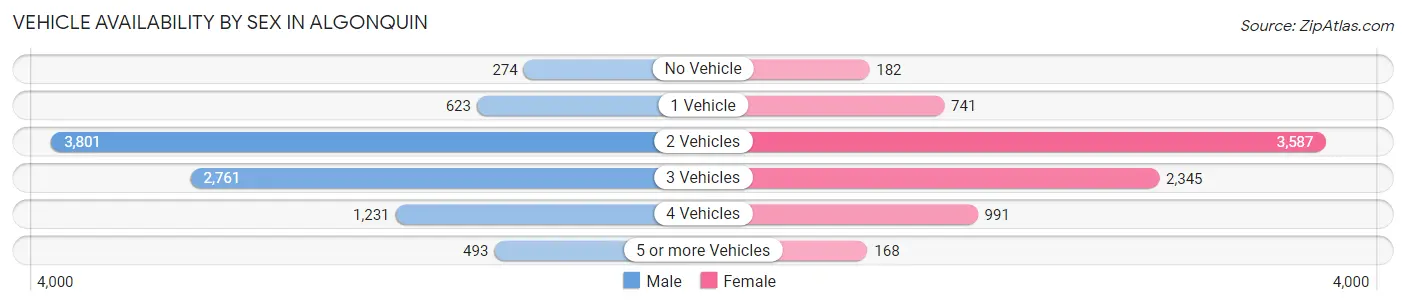
| Vehicles Available | Male | Female |
| No Vehicle | 274 (3.0%) | 182 (2.3%) |
| 1 Vehicle | 623 (6.8%) | 741 (9.2%) |
| 2 Vehicles | 3,801 (41.4%) | 3,587 (44.8%) |
| 3 Vehicles | 2,761 (30.1%) | 2,345 (29.3%) |
| 4 Vehicles | 1,231 (13.4%) | 991 (12.4%) |
| 5 or more Vehicles | 493 (5.4%) | 168 (2.1%) |
| Total | 9,183 (100.0%) | 8,014 (100.0%) |
Commute Time in Algonquin
The most frequently occuring commute durations in Algonquin are 45 to 59 minutes (2,436 commuters, 17.3%), 30 to 34 minutes (1,827 commuters, 13.0%), and 15 to 19 minutes (1,752 commuters, 12.4%).
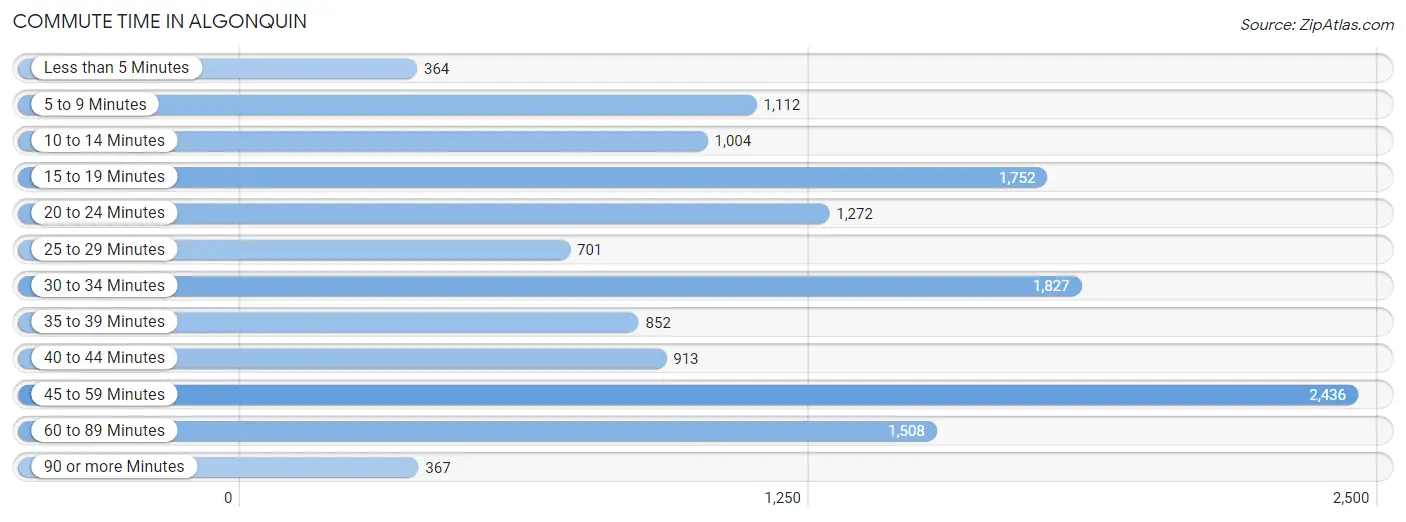
| Commute Time | # Commuters | % Commuters |
| Less than 5 Minutes | 364 | 2.6% |
| 5 to 9 Minutes | 1,112 | 7.9% |
| 10 to 14 Minutes | 1,004 | 7.1% |
| 15 to 19 Minutes | 1,752 | 12.4% |
| 20 to 24 Minutes | 1,272 | 9.0% |
| 25 to 29 Minutes | 701 | 5.0% |
| 30 to 34 Minutes | 1,827 | 13.0% |
| 35 to 39 Minutes | 852 | 6.0% |
| 40 to 44 Minutes | 913 | 6.5% |
| 45 to 59 Minutes | 2,436 | 17.3% |
| 60 to 89 Minutes | 1,508 | 10.7% |
| 90 or more Minutes | 367 | 2.6% |
Commute Time by Sex in Algonquin
The most common commute times in Algonquin are 45 to 59 minutes (1,676 commuters, 21.9%) for males and 30 to 34 minutes (923 commuters, 14.3%) for females.
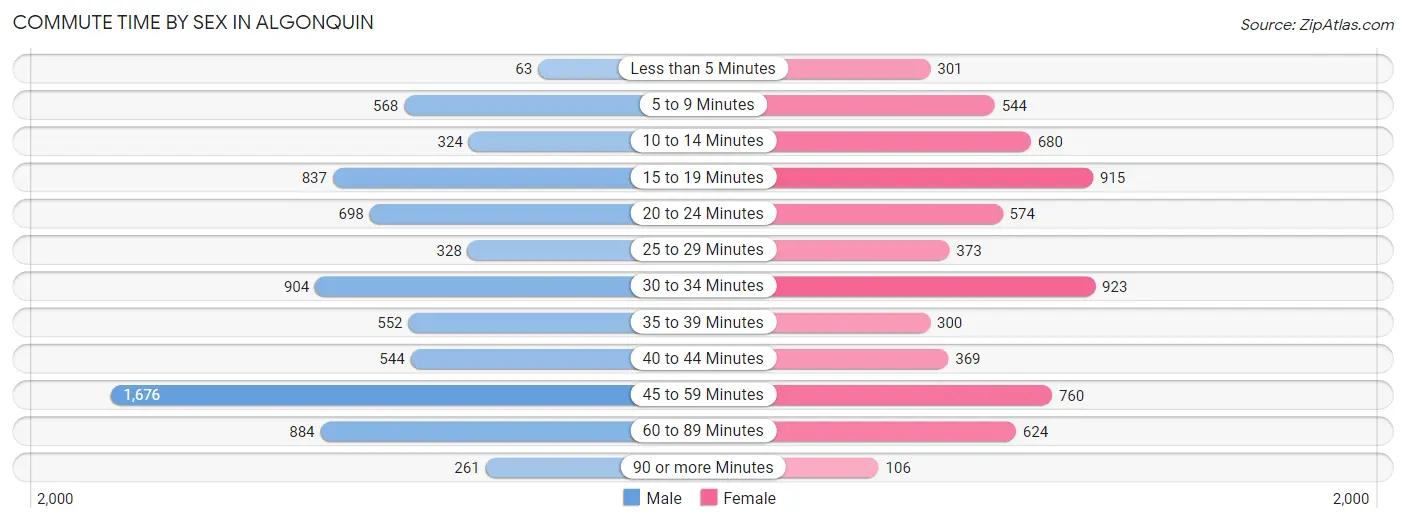
| Commute Time | Male | Female |
| Less than 5 Minutes | 63 (0.8%) | 301 (4.6%) |
| 5 to 9 Minutes | 568 (7.4%) | 544 (8.4%) |
| 10 to 14 Minutes | 324 (4.2%) | 680 (10.5%) |
| 15 to 19 Minutes | 837 (11.0%) | 915 (14.1%) |
| 20 to 24 Minutes | 698 (9.1%) | 574 (8.9%) |
| 25 to 29 Minutes | 328 (4.3%) | 373 (5.8%) |
| 30 to 34 Minutes | 904 (11.8%) | 923 (14.3%) |
| 35 to 39 Minutes | 552 (7.2%) | 300 (4.6%) |
| 40 to 44 Minutes | 544 (7.1%) | 369 (5.7%) |
| 45 to 59 Minutes | 1,676 (21.9%) | 760 (11.7%) |
| 60 to 89 Minutes | 884 (11.6%) | 624 (9.7%) |
| 90 or more Minutes | 261 (3.4%) | 106 (1.6%) |
Time of Departure to Work by Sex in Algonquin
The most frequent times of departure to work in Algonquin are 7:00 AM to 7:29 AM (1,345, 17.6%) for males and 7:00 AM to 7:29 AM (1,309, 20.2%) for females.
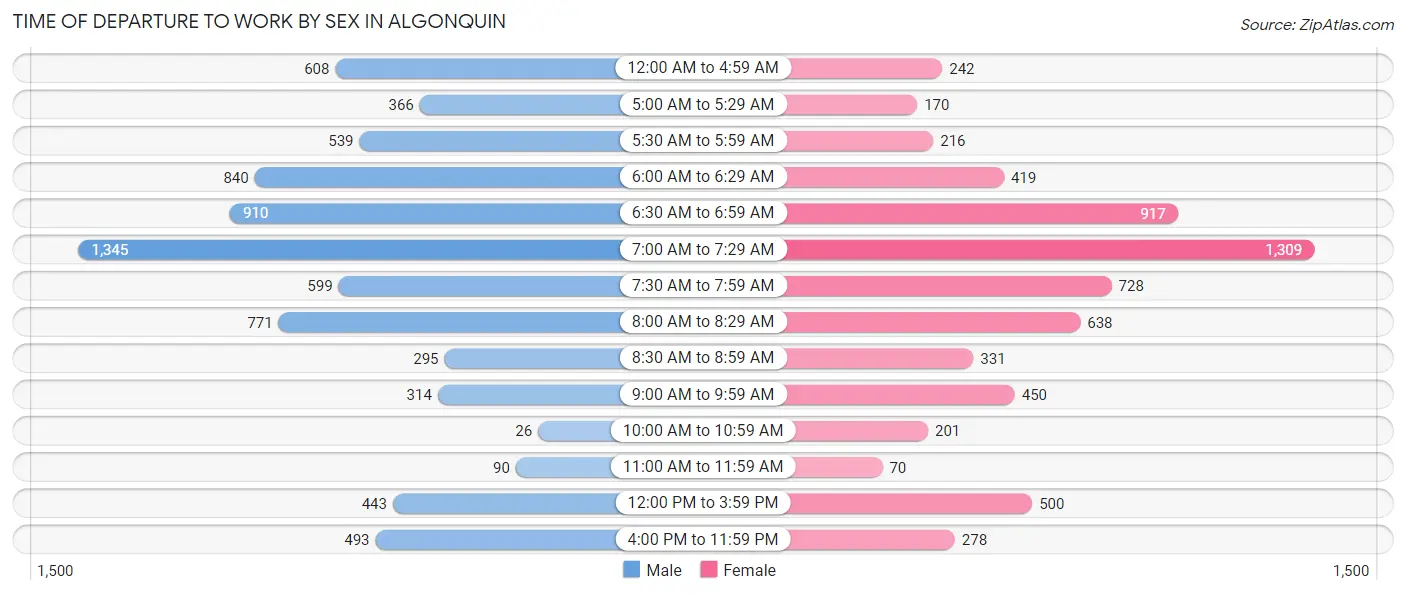
| Time of Departure | Male | Female |
| 12:00 AM to 4:59 AM | 608 (8.0%) | 242 (3.7%) |
| 5:00 AM to 5:29 AM | 366 (4.8%) | 170 (2.6%) |
| 5:30 AM to 5:59 AM | 539 (7.1%) | 216 (3.3%) |
| 6:00 AM to 6:29 AM | 840 (11.0%) | 419 (6.5%) |
| 6:30 AM to 6:59 AM | 910 (11.9%) | 917 (14.2%) |
| 7:00 AM to 7:29 AM | 1,345 (17.6%) | 1,309 (20.2%) |
| 7:30 AM to 7:59 AM | 599 (7.8%) | 728 (11.3%) |
| 8:00 AM to 8:29 AM | 771 (10.1%) | 638 (9.9%) |
| 8:30 AM to 8:59 AM | 295 (3.9%) | 331 (5.1%) |
| 9:00 AM to 9:59 AM | 314 (4.1%) | 450 (7.0%) |
| 10:00 AM to 10:59 AM | 26 (0.3%) | 201 (3.1%) |
| 11:00 AM to 11:59 AM | 90 (1.2%) | 70 (1.1%) |
| 12:00 PM to 3:59 PM | 443 (5.8%) | 500 (7.7%) |
| 4:00 PM to 11:59 PM | 493 (6.5%) | 278 (4.3%) |
| Total | 7,639 (100.0%) | 6,469 (100.0%) |
Housing Occupancy in Algonquin
Occupancy by Ownership in Algonquin
Of the total 10,964 dwellings in Algonquin, owner-occupied units account for 9,422 (85.9%), while renter-occupied units make up 1,542 (14.1%).
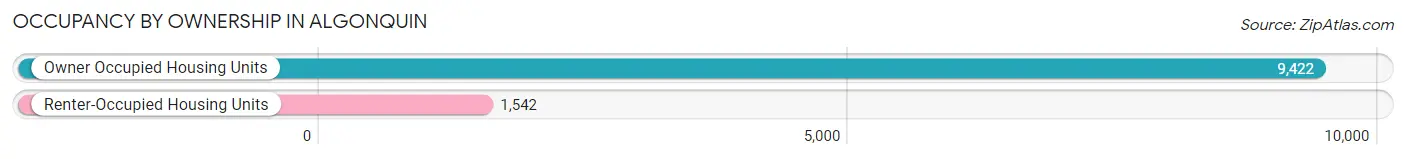
| Occupancy | # Housing Units | % Housing Units |
| Owner Occupied Housing Units | 9,422 | 85.9% |
| Renter-Occupied Housing Units | 1,542 | 14.1% |
| Total Occupied Housing Units | 10,964 | 100.0% |
Occupancy by Household Size in Algonquin
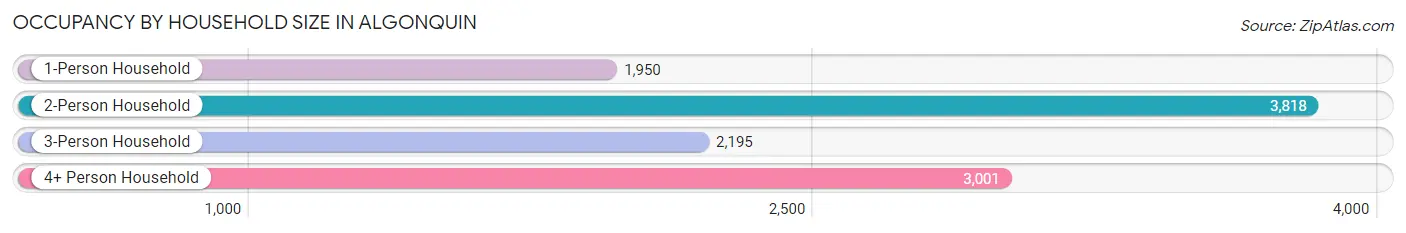
| Household Size | # Housing Units | % Housing Units |
| 1-Person Household | 1,950 | 17.8% |
| 2-Person Household | 3,818 | 34.8% |
| 3-Person Household | 2,195 | 20.0% |
| 4+ Person Household | 3,001 | 27.4% |
| Total Housing Units | 10,964 | 100.0% |
Occupancy by Ownership by Household Size in Algonquin
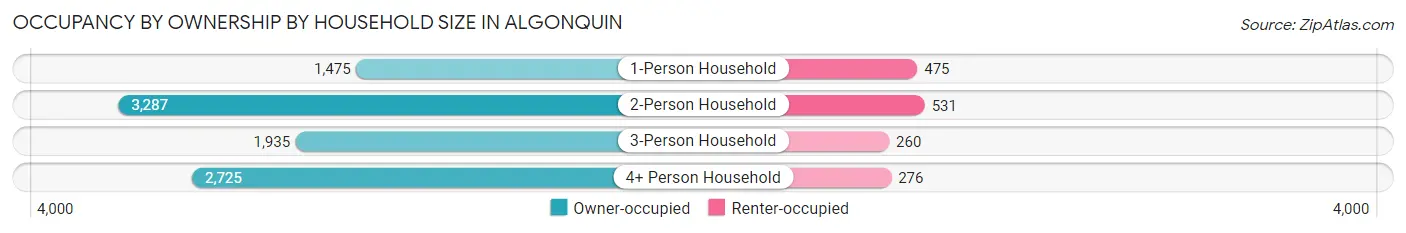
| Household Size | Owner-occupied | Renter-occupied |
| 1-Person Household | 1,475 (75.6%) | 475 (24.4%) |
| 2-Person Household | 3,287 (86.1%) | 531 (13.9%) |
| 3-Person Household | 1,935 (88.1%) | 260 (11.8%) |
| 4+ Person Household | 2,725 (90.8%) | 276 (9.2%) |
| Total Housing Units | 9,422 (85.9%) | 1,542 (14.1%) |
Occupancy by Educational Attainment in Algonquin
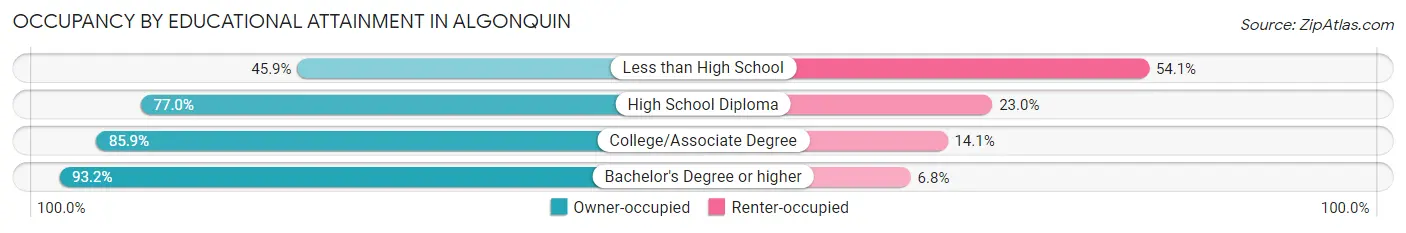
| Household Size | Owner-occupied | Renter-occupied |
| Less than High School | 253 (45.9%) | 298 (54.1%) |
| High School Diploma | 1,275 (77.0%) | 381 (23.0%) |
| College/Associate Degree | 3,102 (85.9%) | 511 (14.1%) |
| Bachelor's Degree or higher | 4,792 (93.2%) | 352 (6.8%) |
Occupancy by Age of Householder in Algonquin
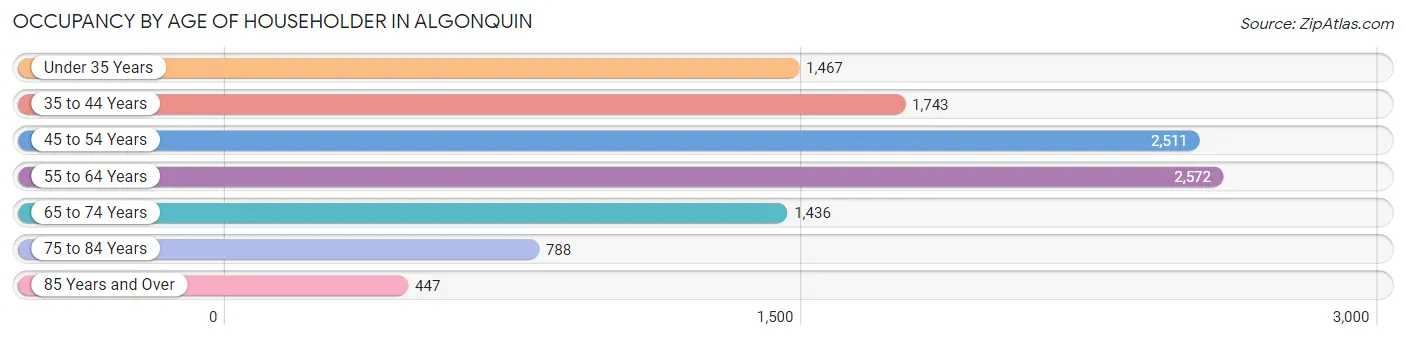
| Age Bracket | # Households | % Households |
| Under 35 Years | 1,467 | 13.4% |
| 35 to 44 Years | 1,743 | 15.9% |
| 45 to 54 Years | 2,511 | 22.9% |
| 55 to 64 Years | 2,572 | 23.5% |
| 65 to 74 Years | 1,436 | 13.1% |
| 75 to 84 Years | 788 | 7.2% |
| 85 Years and Over | 447 | 4.1% |
| Total | 10,964 | 100.0% |
Housing Finances in Algonquin
Median Income by Occupancy in Algonquin
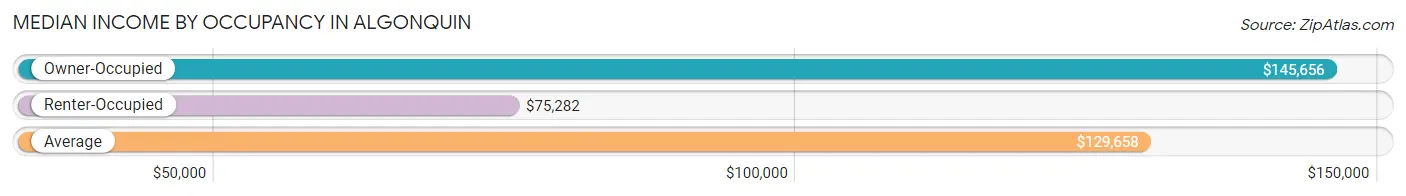
| Occupancy Type | # Households | Median Income |
| Owner-Occupied | 9,422 (85.9%) | $145,656 |
| Renter-Occupied | 1,542 (14.1%) | $75,282 |
| Average | 10,964 (100.0%) | $129,658 |
Occupancy by Householder Income Bracket in Algonquin
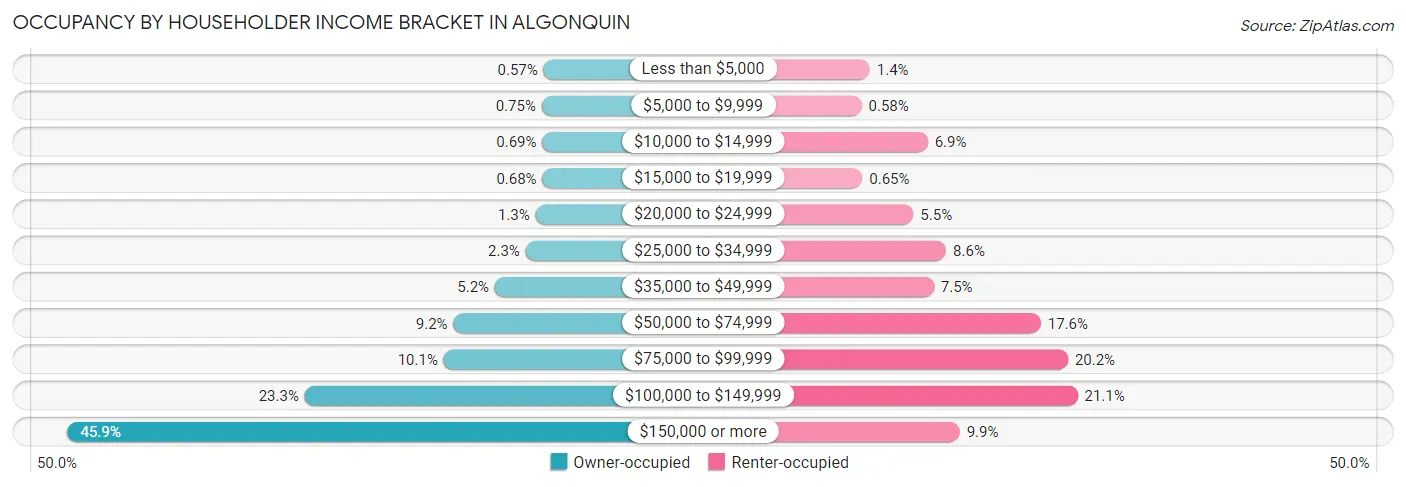
| Income Bracket | Owner-occupied | Renter-occupied |
| Less than $5,000 | 54 (0.6%) | 21 (1.4%) |
| $5,000 to $9,999 | 71 (0.7%) | 9 (0.6%) |
| $10,000 to $14,999 | 65 (0.7%) | 106 (6.9%) |
| $15,000 to $19,999 | 64 (0.7%) | 10 (0.6%) |
| $20,000 to $24,999 | 126 (1.3%) | 85 (5.5%) |
| $25,000 to $34,999 | 215 (2.3%) | 133 (8.6%) |
| $35,000 to $49,999 | 491 (5.2%) | 115 (7.5%) |
| $50,000 to $74,999 | 863 (9.2%) | 272 (17.6%) |
| $75,000 to $99,999 | 950 (10.1%) | 312 (20.2%) |
| $100,000 to $149,999 | 2,197 (23.3%) | 326 (21.1%) |
| $150,000 or more | 4,326 (45.9%) | 153 (9.9%) |
| Total | 9,422 (100.0%) | 1,542 (100.0%) |
Monthly Housing Cost Tiers in Algonquin
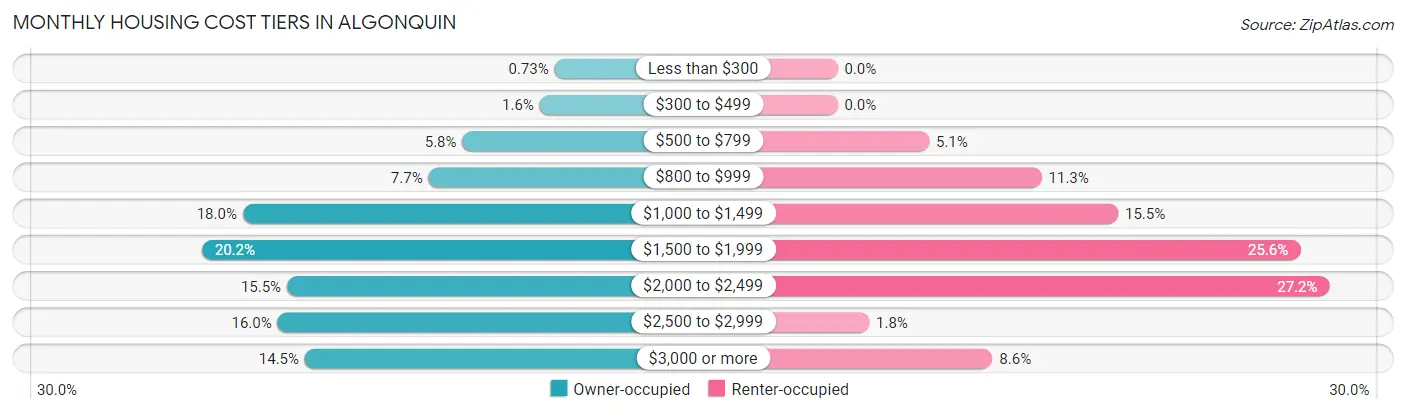
| Monthly Cost | Owner-occupied | Renter-occupied |
| Less than $300 | 69 (0.7%) | 0 (0.0%) |
| $300 to $499 | 146 (1.5%) | 0 (0.0%) |
| $500 to $799 | 548 (5.8%) | 78 (5.1%) |
| $800 to $999 | 725 (7.7%) | 174 (11.3%) |
| $1,000 to $1,499 | 1,691 (17.9%) | 239 (15.5%) |
| $1,500 to $1,999 | 1,904 (20.2%) | 394 (25.6%) |
| $2,000 to $2,499 | 1,461 (15.5%) | 419 (27.2%) |
| $2,500 to $2,999 | 1,510 (16.0%) | 27 (1.8%) |
| $3,000 or more | 1,368 (14.5%) | 132 (8.6%) |
| Total | 9,422 (100.0%) | 1,542 (100.0%) |
Physical Housing Characteristics in Algonquin
Housing Structures in Algonquin
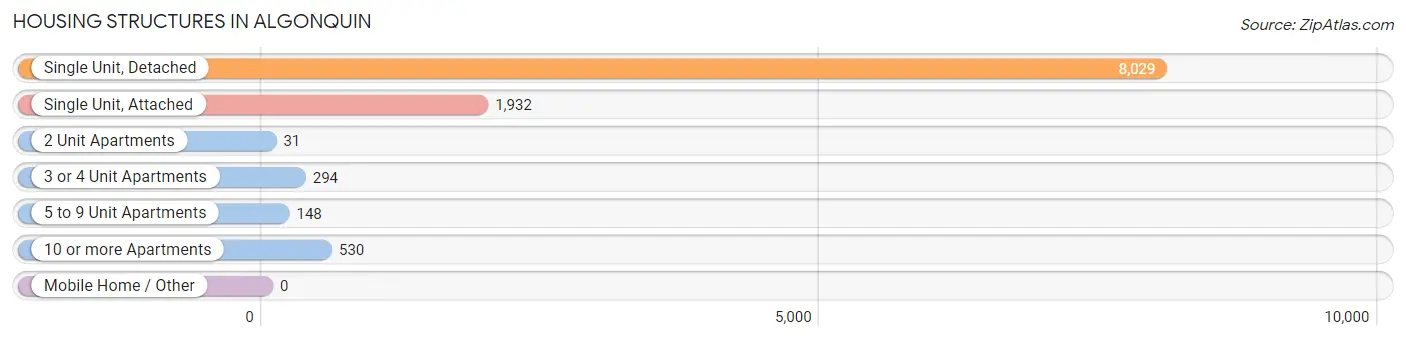
| Structure Type | # Housing Units | % Housing Units |
| Single Unit, Detached | 8,029 | 73.2% |
| Single Unit, Attached | 1,932 | 17.6% |
| 2 Unit Apartments | 31 | 0.3% |
| 3 or 4 Unit Apartments | 294 | 2.7% |
| 5 to 9 Unit Apartments | 148 | 1.3% |
| 10 or more Apartments | 530 | 4.8% |
| Mobile Home / Other | 0 | 0.0% |
| Total | 10,964 | 100.0% |
Housing Structures by Occupancy in Algonquin
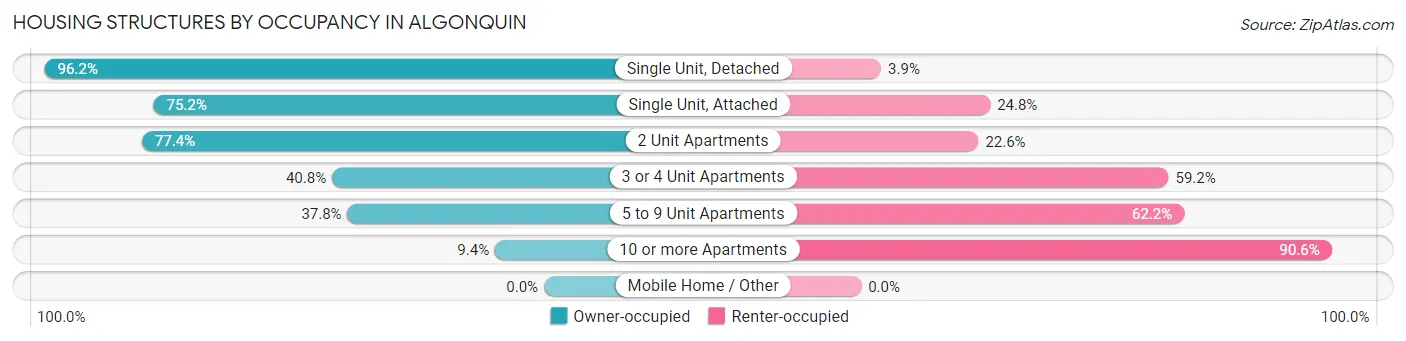
| Structure Type | Owner-occupied | Renter-occupied |
| Single Unit, Detached | 7,720 (96.2%) | 309 (3.8%) |
| Single Unit, Attached | 1,452 (75.2%) | 480 (24.8%) |
| 2 Unit Apartments | 24 (77.4%) | 7 (22.6%) |
| 3 or 4 Unit Apartments | 120 (40.8%) | 174 (59.2%) |
| 5 to 9 Unit Apartments | 56 (37.8%) | 92 (62.2%) |
| 10 or more Apartments | 50 (9.4%) | 480 (90.6%) |
| Mobile Home / Other | 0 (0.0%) | 0 (0.0%) |
| Total | 9,422 (85.9%) | 1,542 (14.1%) |
Housing Structures by Number of Rooms in Algonquin
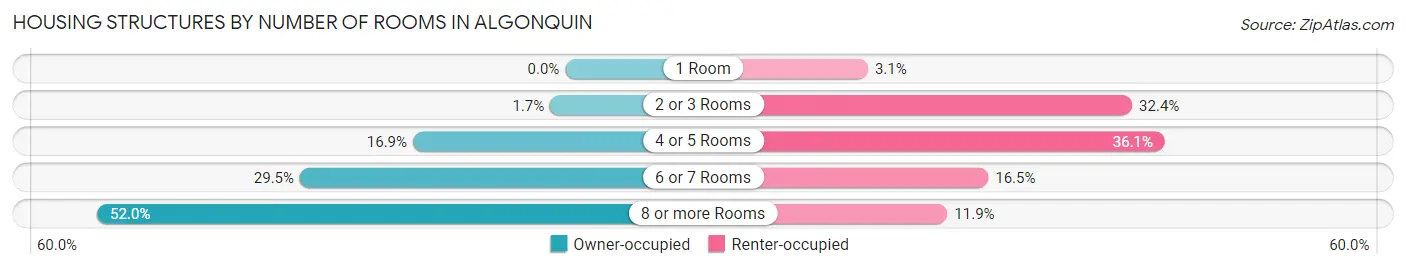
| Number of Rooms | Owner-occupied | Renter-occupied |
| 1 Room | 0 (0.0%) | 48 (3.1%) |
| 2 or 3 Rooms | 158 (1.7%) | 500 (32.4%) |
| 4 or 5 Rooms | 1,593 (16.9%) | 556 (36.1%) |
| 6 or 7 Rooms | 2,775 (29.4%) | 254 (16.5%) |
| 8 or more Rooms | 4,896 (52.0%) | 184 (11.9%) |
| Total | 9,422 (100.0%) | 1,542 (100.0%) |
Housing Structure by Heating Type in Algonquin
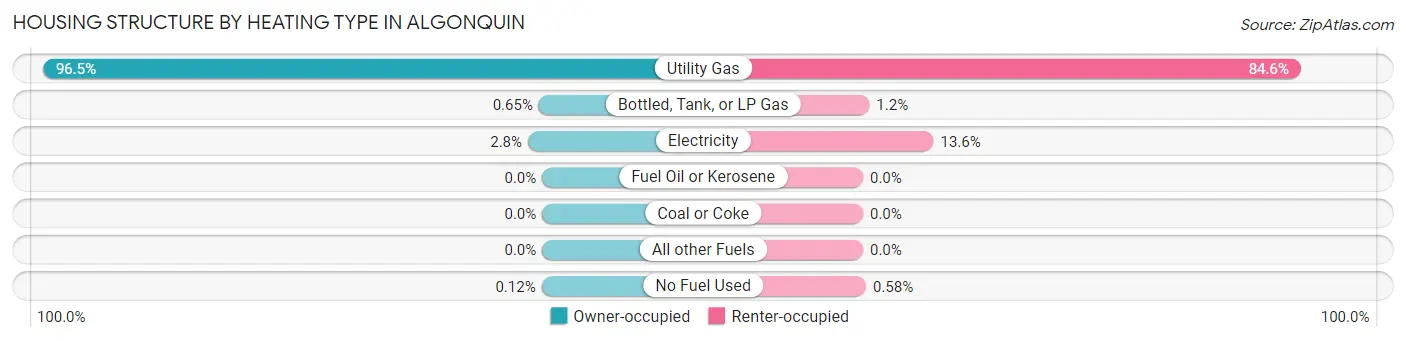
| Heating Type | Owner-occupied | Renter-occupied |
| Utility Gas | 9,091 (96.5%) | 1,304 (84.6%) |
| Bottled, Tank, or LP Gas | 61 (0.6%) | 19 (1.2%) |
| Electricity | 259 (2.8%) | 210 (13.6%) |
| Fuel Oil or Kerosene | 0 (0.0%) | 0 (0.0%) |
| Coal or Coke | 0 (0.0%) | 0 (0.0%) |
| All other Fuels | 0 (0.0%) | 0 (0.0%) |
| No Fuel Used | 11 (0.1%) | 9 (0.6%) |
| Total | 9,422 (100.0%) | 1,542 (100.0%) |
Household Vehicle Usage in Algonquin
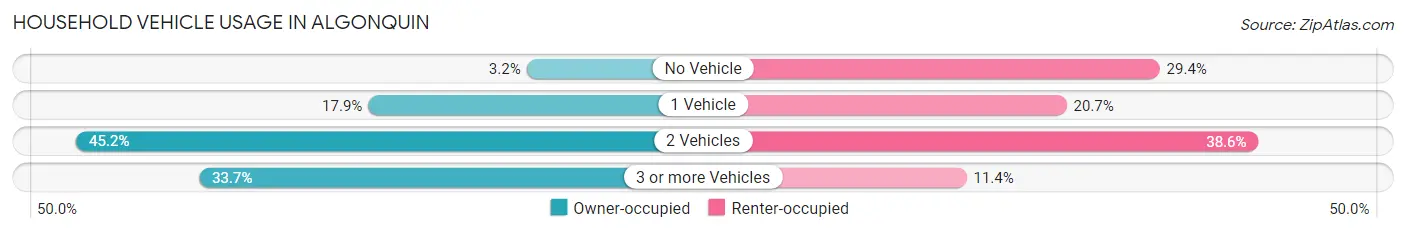
| Vehicles per Household | Owner-occupied | Renter-occupied |
| No Vehicle | 297 (3.2%) | 453 (29.4%) |
| 1 Vehicle | 1,689 (17.9%) | 319 (20.7%) |
| 2 Vehicles | 4,259 (45.2%) | 595 (38.6%) |
| 3 or more Vehicles | 3,177 (33.7%) | 175 (11.4%) |
| Total | 9,422 (100.0%) | 1,542 (100.0%) |
Real Estate & Mortgages in Algonquin
Real Estate and Mortgage Overview in Algonquin
| Characteristic | Without Mortgage | With Mortgage |
| Housing Units | 2,437 | 6,985 |
| Median Property Value | $294,600 | $310,300 |
| Median Household Income | $102,241 | $3,538 |
| Monthly Housing Costs | $976 | $1,355 |
| Real Estate Taxes | $7,564 | $8 |
Property Value by Mortgage Status in Algonquin
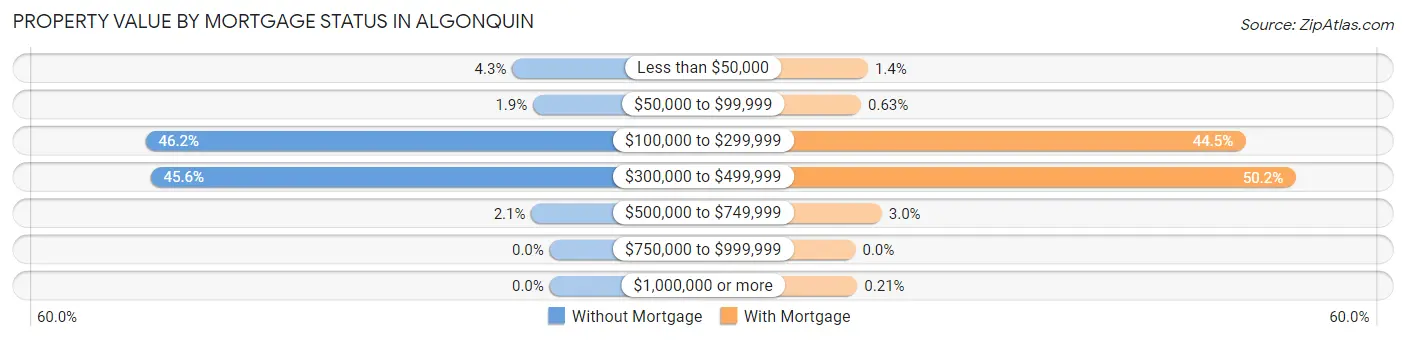
| Property Value | Without Mortgage | With Mortgage |
| Less than $50,000 | 104 (4.3%) | 99 (1.4%) |
| $50,000 to $99,999 | 46 (1.9%) | 44 (0.6%) |
| $100,000 to $299,999 | 1,125 (46.2%) | 3,109 (44.5%) |
| $300,000 to $499,999 | 1,111 (45.6%) | 3,508 (50.2%) |
| $500,000 to $749,999 | 51 (2.1%) | 210 (3.0%) |
| $750,000 to $999,999 | 0 (0.0%) | 0 (0.0%) |
| $1,000,000 or more | 0 (0.0%) | 15 (0.2%) |
| Total | 2,437 (100.0%) | 6,985 (100.0%) |
Household Income by Mortgage Status in Algonquin
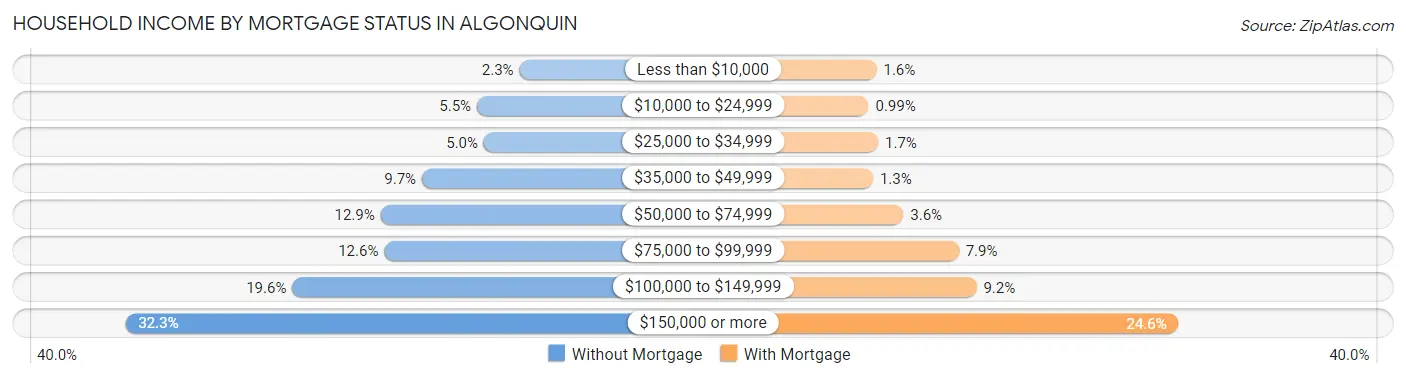
| Household Income | Without Mortgage | With Mortgage |
| Less than $10,000 | 56 (2.3%) | 112 (1.6%) |
| $10,000 to $24,999 | 135 (5.5%) | 69 (1.0%) |
| $25,000 to $34,999 | 122 (5.0%) | 120 (1.7%) |
| $35,000 to $49,999 | 237 (9.7%) | 93 (1.3%) |
| $50,000 to $74,999 | 314 (12.9%) | 254 (3.6%) |
| $75,000 to $99,999 | 307 (12.6%) | 549 (7.9%) |
| $100,000 to $149,999 | 478 (19.6%) | 643 (9.2%) |
| $150,000 or more | 788 (32.3%) | 1,719 (24.6%) |
| Total | 2,437 (100.0%) | 6,985 (100.0%) |
Property Value to Household Income Ratio in Algonquin
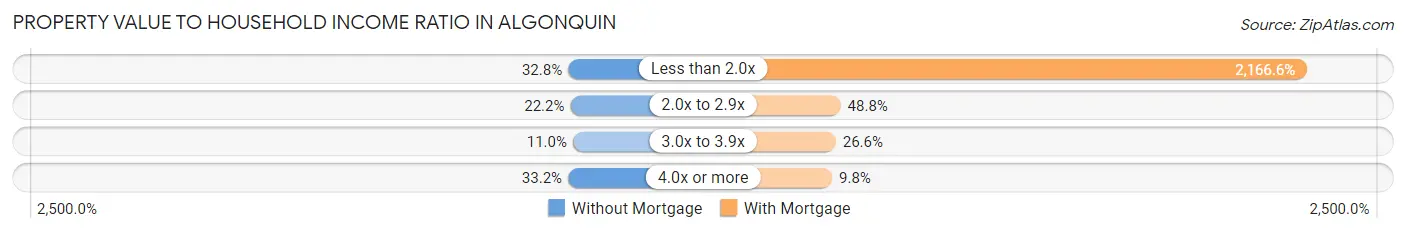
| Value-to-Income Ratio | Without Mortgage | With Mortgage |
| Less than 2.0x | 800 (32.8%) | 151,338 (2,166.6%) |
| 2.0x to 2.9x | 541 (22.2%) | 3,407 (48.8%) |
| 3.0x to 3.9x | 267 (11.0%) | 1,859 (26.6%) |
| 4.0x or more | 809 (33.2%) | 687 (9.8%) |
| Total | 2,437 (100.0%) | 6,985 (100.0%) |
Real Estate Taxes by Mortgage Status in Algonquin
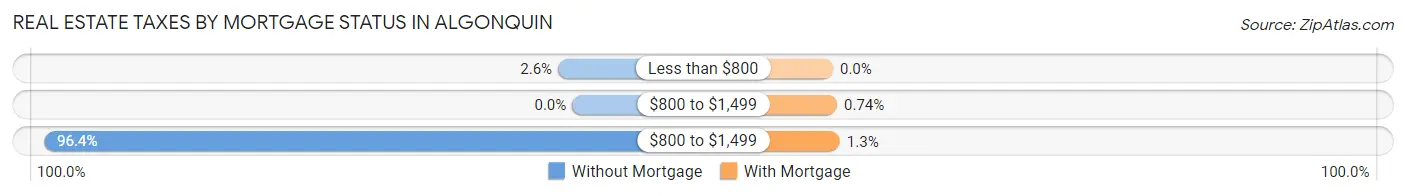
| Property Taxes | Without Mortgage | With Mortgage |
| Less than $800 | 63 (2.6%) | 0 (0.0%) |
| $800 to $1,499 | 0 (0.0%) | 52 (0.7%) |
| $800 to $1,499 | 2,350 (96.4%) | 87 (1.3%) |
| Total | 2,437 (100.0%) | 6,985 (100.0%) |
Health & Disability in Algonquin
Health Insurance Coverage by Age in Algonquin
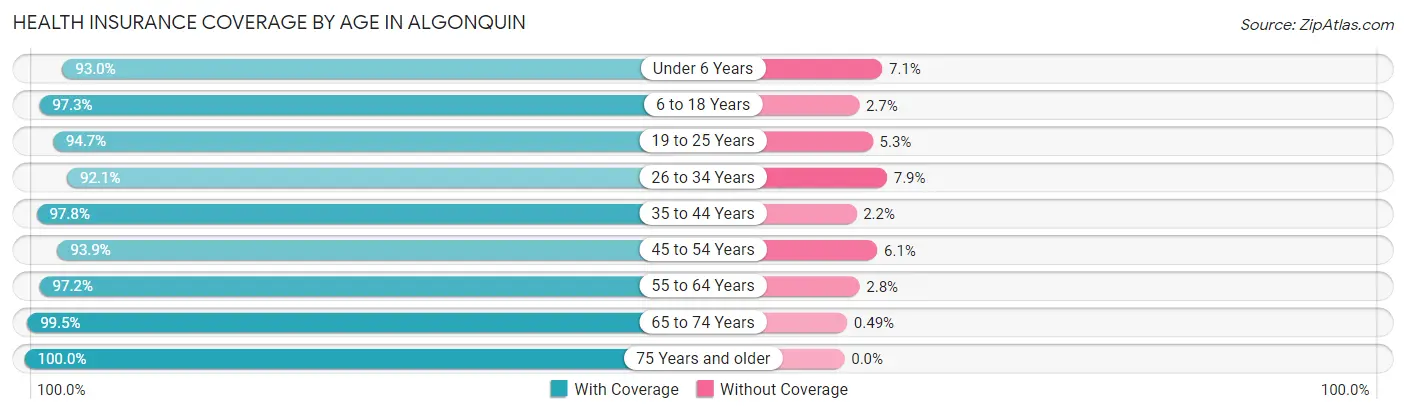
| Age Bracket | With Coverage | Without Coverage |
| Under 6 Years | 1,608 (92.9%) | 122 (7.0%) |
| 6 to 18 Years | 4,805 (97.3%) | 135 (2.7%) |
| 19 to 25 Years | 2,512 (94.7%) | 140 (5.3%) |
| 26 to 34 Years | 3,175 (92.1%) | 273 (7.9%) |
| 35 to 44 Years | 3,429 (97.8%) | 78 (2.2%) |
| 45 to 54 Years | 4,221 (93.9%) | 275 (6.1%) |
| 55 to 64 Years | 4,841 (97.2%) | 140 (2.8%) |
| 65 to 74 Years | 2,228 (99.5%) | 11 (0.5%) |
| 75 Years and older | 1,895 (100.0%) | 0 (0.0%) |
| Total | 28,714 (96.1%) | 1,174 (3.9%) |
Health Insurance Coverage by Citizenship Status in Algonquin
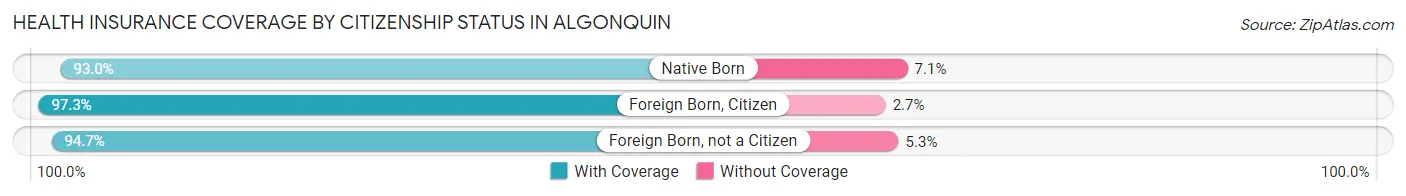
| Citizenship Status | With Coverage | Without Coverage |
| Native Born | 1,608 (92.9%) | 122 (7.0%) |
| Foreign Born, Citizen | 4,805 (97.3%) | 135 (2.7%) |
| Foreign Born, not a Citizen | 2,512 (94.7%) | 140 (5.3%) |
Health Insurance Coverage by Household Income in Algonquin
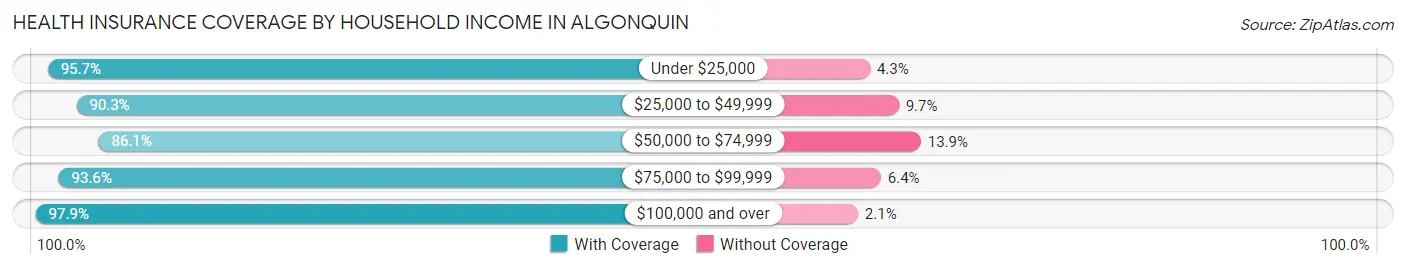
| Household Income | With Coverage | Without Coverage |
| Under $25,000 | 1,081 (95.7%) | 49 (4.3%) |
| $25,000 to $49,999 | 1,375 (90.3%) | 148 (9.7%) |
| $50,000 to $74,999 | 2,086 (86.1%) | 336 (13.9%) |
| $75,000 to $99,999 | 2,700 (93.6%) | 184 (6.4%) |
| $100,000 and over | 21,472 (97.9%) | 456 (2.1%) |
Public vs Private Health Insurance Coverage by Age in Algonquin
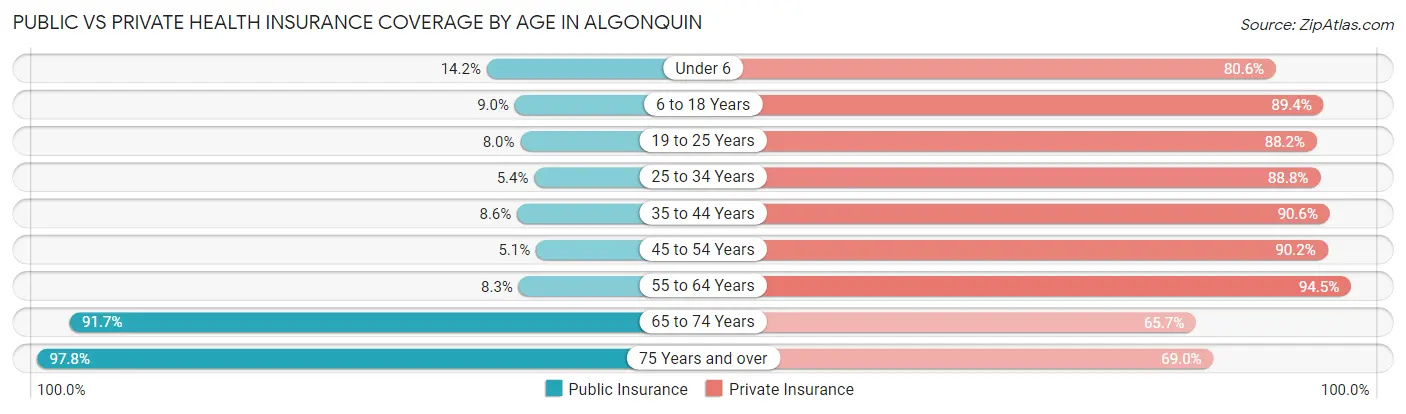
| Age Bracket | Public Insurance | Private Insurance |
| Under 6 | 246 (14.2%) | 1,394 (80.6%) |
| 6 to 18 Years | 445 (9.0%) | 4,418 (89.4%) |
| 19 to 25 Years | 212 (8.0%) | 2,338 (88.2%) |
| 25 to 34 Years | 186 (5.4%) | 3,061 (88.8%) |
| 35 to 44 Years | 301 (8.6%) | 3,176 (90.6%) |
| 45 to 54 Years | 228 (5.1%) | 4,053 (90.1%) |
| 55 to 64 Years | 413 (8.3%) | 4,708 (94.5%) |
| 65 to 74 Years | 2,054 (91.7%) | 1,472 (65.7%) |
| 75 Years and over | 1,853 (97.8%) | 1,307 (69.0%) |
| Total | 5,938 (19.9%) | 25,927 (86.8%) |
Disability Status by Sex by Age in Algonquin
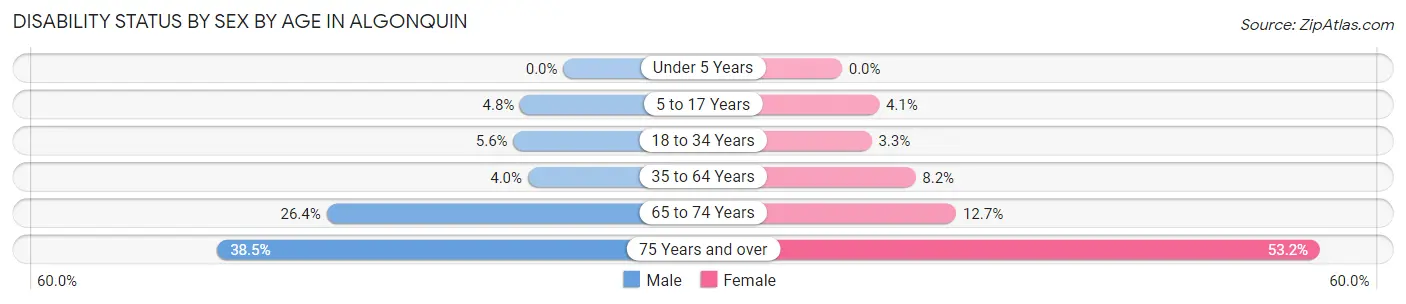
| Age Bracket | Male | Female |
| Under 5 Years | 0 (0.0%) | 0 (0.0%) |
| 5 to 17 Years | 122 (4.8%) | 94 (4.1%) |
| 18 to 34 Years | 187 (5.6%) | 105 (3.3%) |
| 35 to 64 Years | 258 (4.0%) | 528 (8.2%) |
| 65 to 74 Years | 294 (26.4%) | 143 (12.7%) |
| 75 Years and over | 296 (38.5%) | 600 (53.2%) |
Disability Class by Sex by Age in Algonquin
Disability Class: Hearing Difficulty
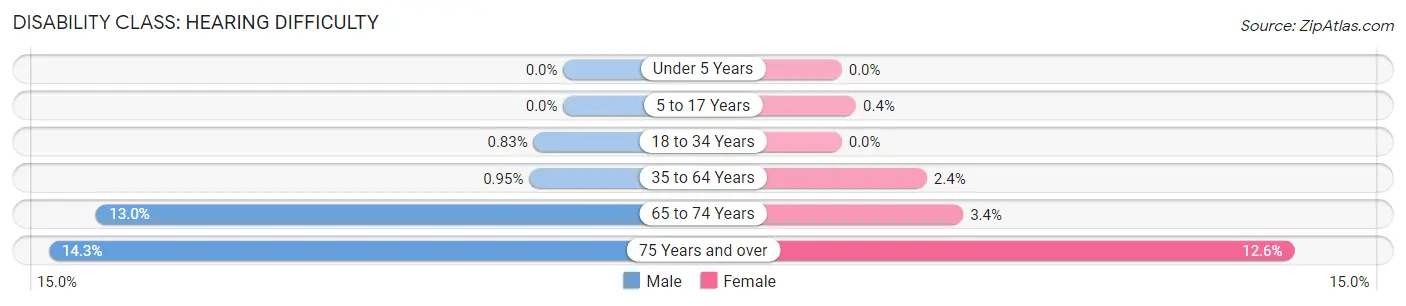
| Age Bracket | Male | Female |
| Under 5 Years | 0 (0.0%) | 0 (0.0%) |
| 5 to 17 Years | 0 (0.0%) | 9 (0.4%) |
| 18 to 34 Years | 28 (0.8%) | 0 (0.0%) |
| 35 to 64 Years | 62 (0.9%) | 153 (2.4%) |
| 65 to 74 Years | 145 (13.0%) | 38 (3.4%) |
| 75 Years and over | 110 (14.3%) | 142 (12.6%) |
Disability Class: Vision Difficulty
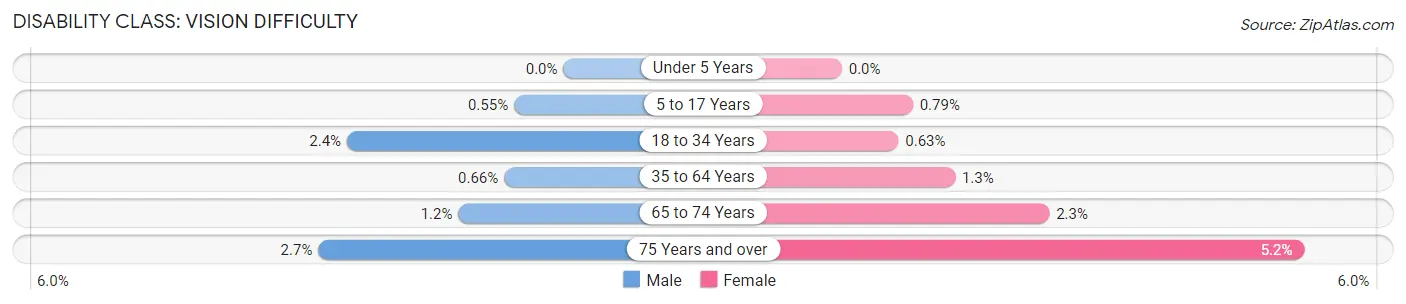
| Age Bracket | Male | Female |
| Under 5 Years | 0 (0.0%) | 0 (0.0%) |
| 5 to 17 Years | 14 (0.5%) | 18 (0.8%) |
| 18 to 34 Years | 81 (2.4%) | 20 (0.6%) |
| 35 to 64 Years | 43 (0.7%) | 81 (1.3%) |
| 65 to 74 Years | 13 (1.2%) | 26 (2.3%) |
| 75 Years and over | 21 (2.7%) | 58 (5.1%) |
Disability Class: Cognitive Difficulty
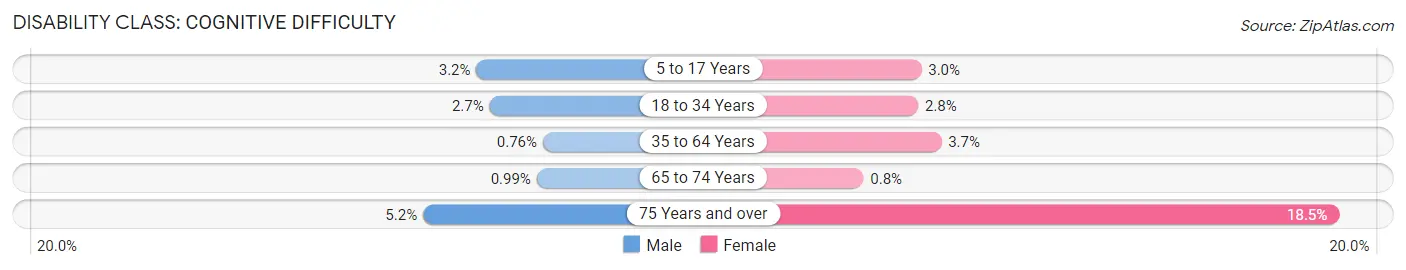
| Age Bracket | Male | Female |
| 5 to 17 Years | 82 (3.2%) | 67 (2.9%) |
| 18 to 34 Years | 92 (2.7%) | 90 (2.8%) |
| 35 to 64 Years | 50 (0.8%) | 238 (3.7%) |
| 65 to 74 Years | 11 (1.0%) | 9 (0.8%) |
| 75 Years and over | 40 (5.2%) | 208 (18.5%) |
Disability Class: Ambulatory Difficulty
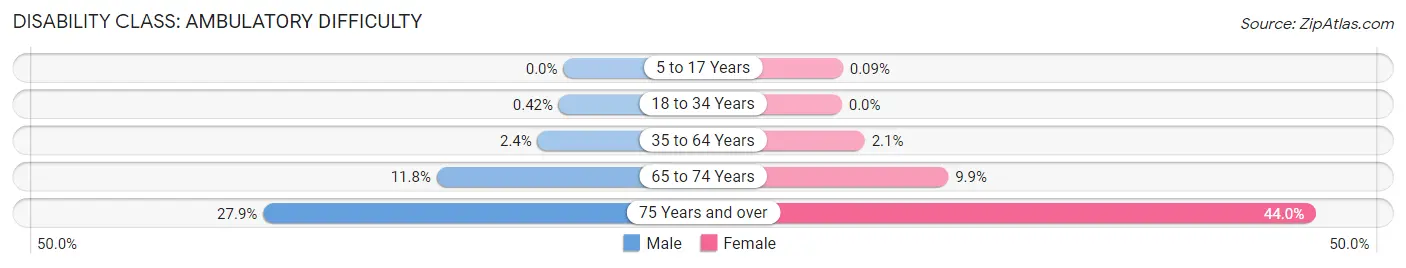
| Age Bracket | Male | Female |
| 5 to 17 Years | 0 (0.0%) | 2 (0.1%) |
| 18 to 34 Years | 14 (0.4%) | 0 (0.0%) |
| 35 to 64 Years | 156 (2.4%) | 137 (2.1%) |
| 65 to 74 Years | 131 (11.7%) | 111 (9.9%) |
| 75 Years and over | 214 (27.9%) | 496 (44.0%) |
Disability Class: Self-Care Difficulty
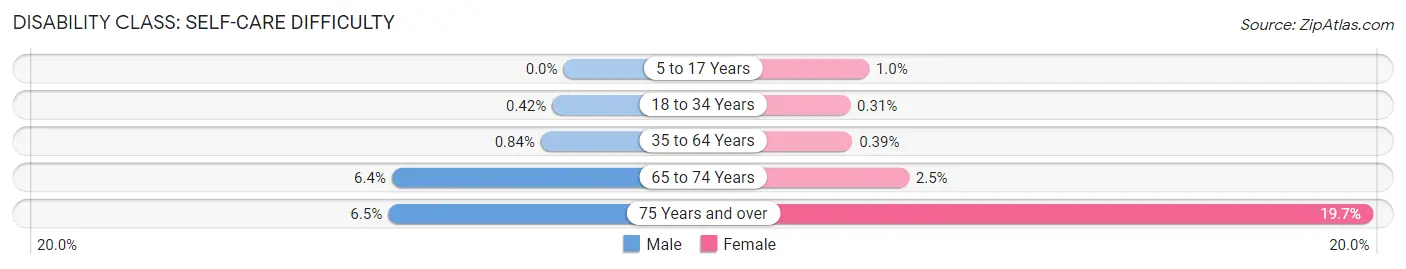
| Age Bracket | Male | Female |
| 5 to 17 Years | 0 (0.0%) | 23 (1.0%) |
| 18 to 34 Years | 14 (0.4%) | 10 (0.3%) |
| 35 to 64 Years | 55 (0.8%) | 25 (0.4%) |
| 65 to 74 Years | 71 (6.4%) | 28 (2.5%) |
| 75 Years and over | 50 (6.5%) | 222 (19.7%) |
Technology Access in Algonquin
Computing Device Access in Algonquin
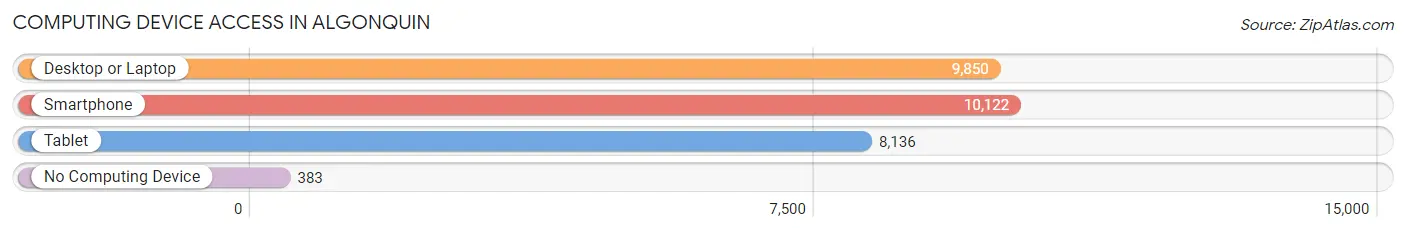
| Device Type | # Households | % Households |
| Desktop or Laptop | 9,850 | 89.8% |
| Smartphone | 10,122 | 92.3% |
| Tablet | 8,136 | 74.2% |
| No Computing Device | 383 | 3.5% |
| Total | 10,964 | 100.0% |
Internet Access in Algonquin
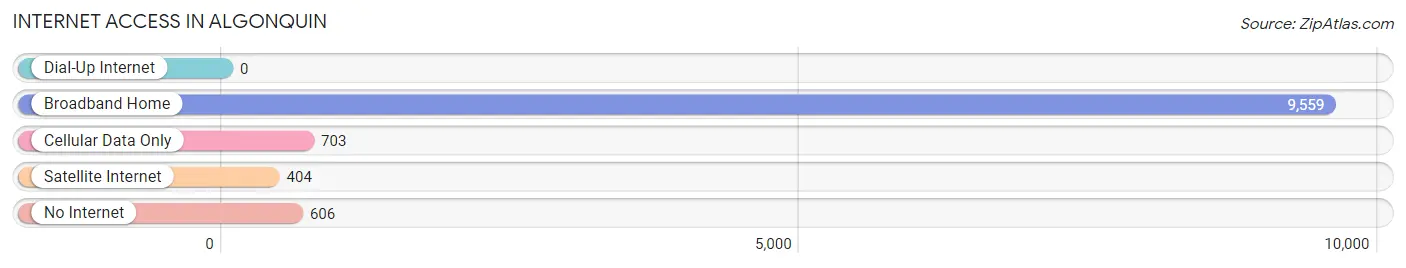
| Internet Type | # Households | % Households |
| Dial-Up Internet | 0 | 0.0% |
| Broadband Home | 9,559 | 87.2% |
| Cellular Data Only | 703 | 6.4% |
| Satellite Internet | 404 | 3.7% |
| No Internet | 606 | 5.5% |
| Total | 10,964 | 100.0% |
Algonquin Summary
Algonquin, Illinois is a village located in McHenry and Kane counties in the U.S. state of Illinois. It is a part of the Chicago metropolitan area and is located approximately 40 miles northwest of downtown Chicago. As of the 2010 census, the village had a population of 30,046.
History
The area that is now Algonquin was first settled in 1834 by settlers from New England. The village was originally known as “Coral” and was later renamed “Algonquin” in 1856 after the Algonquin tribe of Native Americans who had once lived in the area. The village was officially incorporated in 1890.
In the late 19th century, Algonquin was a popular summer resort destination for wealthy Chicagoans. The village was home to several large resorts, including the Algonquin Hotel, which was built in 1891 and was one of the largest hotels in the Midwest at the time.
Geography
Algonquin is located at 42°11′N 88°18′W (42.1833, -88.3056). According to the 2010 census, the village has a total area of 8.8 square miles, of which 8.7 square miles is land and 0.1 square miles is water.
The village is located on the Fox River, which is a tributary of the Illinois River. The Fox River is a popular recreational destination for fishing, boating, and other activities.
Economy
Algonquin’s economy is largely based on retail and services. The village is home to several large shopping centers, including the Algonquin Commons, which is the largest shopping center in the area. The village is also home to several corporate headquarters, including the headquarters of the American Eagle Outfitters clothing chain.
The village is also home to several manufacturing companies, including the Algonquin Manufacturing Company, which produces automotive parts.
Demographics
As of the 2010 census, there were 30,046 people, 11,845 households, and 8,072 families residing in the village. The population density was 3,444.3 people per square mile. The racial makeup of the village was 87.2% White, 4.2% African American, 0.3% Native American, 4.3% Asian, 0.1% Pacific Islander, 1.7% from other races, and 2.3% from two or more races. Hispanic or Latino of any race were 5.3% of the population.
The median income for a household in the village was $76,837, and the median income for a family was $90,945. The per capita income for the village was $35,945. About 2.7% of families and 3.9% of the population were below the poverty line, including 4.3% of those under age 18 and 4.2% of those age 65 or over.
Algonquin is served by several school districts, including Community Unit School District 300, which serves most of the village. The village is also home to several private schools, including St. Margaret Mary Catholic School and Algonquin Academy.
Common Questions
What is Per Capita Income in Algonquin?
Per Capita income in Algonquin is $54,019.
What is the Median Family Income in Algonquin?
Median Family Income in Algonquin is $146,964.
What is the Median Household income in Algonquin?
Median Household Income in Algonquin is $129,658.
What is Income or Wage Gap in Algonquin?
Income or Wage Gap in Algonquin is 30.2%.
Women in Algonquin earn 69.8 cents for every dollar earned by a man.
What is Inequality or Gini Index in Algonquin?
Inequality or Gini Index in Algonquin is 0.37.
What is the Total Population of Algonquin?
Total Population of Algonquin is 29,888.
What is the Total Male Population of Algonquin?
Total Male Population of Algonquin is 15,027.
What is the Total Female Population of Algonquin?
Total Female Population of Algonquin is 14,861.
What is the Ratio of Males per 100 Females in Algonquin?
There are 101.12 Males per 100 Females in Algonquin.
What is the Ratio of Females per 100 Males in Algonquin?
There are 98.90 Females per 100 Males in Algonquin.
What is the Median Population Age in Algonquin?
Median Population Age in Algonquin is 41.0 Years.
What is the Average Family Size in Algonquin
Average Family Size in Algonquin is 3.1 People.
What is the Average Household Size in Algonquin
Average Household Size in Algonquin is 2.7 People.
How Large is the Labor Force in Algonquin?
There are 18,313 People in the Labor Forcein in Algonquin.
What is the Percentage of People in the Labor Force in Algonquin?
74.8% of People are in the Labor Force in Algonquin.
What is the Unemployment Rate in Algonquin?
Unemployment Rate in Algonquin is 4.7%.