Loves Park, IL Map & Demographics
Loves Park Map
Loves Park Overview
$33,874
PER CAPITA INCOME
$74,500
AVG FAMILY INCOME
$56,370
AVG HOUSEHOLD INCOME
33.7%
WAGE / INCOME GAP [ % ]
66.3¢/ $1
WAGE / INCOME GAP [ $ ]
0.44
INEQUALITY / GINI INDEX
22,935
TOTAL POPULATION
10,857
MALE POPULATION
12,078
FEMALE POPULATION
89.89
MALES / 100 FEMALES
111.25
FEMALES / 100 MALES
36.6
MEDIAN AGE
2.9
AVG FAMILY SIZE
2.4
AVG HOUSEHOLD SIZE
12,179
LABOR FORCE [ PEOPLE ]
65.7%
PERCENT IN LABOR FORCE
7.8%
UNEMPLOYMENT RATE
Loves Park Zip Codes
Loves Park Area Codes
Income in Loves Park
Income Overview in Loves Park
Per Capita Income in Loves Park is $33,874, while median incomes of families and households are $74,500 and $56,370 respectively.
| Characteristic | Number | Measure |
| Per Capita Income | 22,935 | $33,874 |
| Median Family Income | 5,842 | $74,500 |
| Mean Family Income | 5,842 | $92,457 |
| Median Household Income | 9,705 | $56,370 |
| Mean Household Income | 9,705 | $77,897 |
| Income Deficit | 5,842 | $0 |
| Wage / Income Gap (%) | 22,935 | 33.68% |
| Wage / Income Gap ($) | 22,935 | 66.32¢ per $1 |
| Gini / Inequality Index | 22,935 | 0.44 |
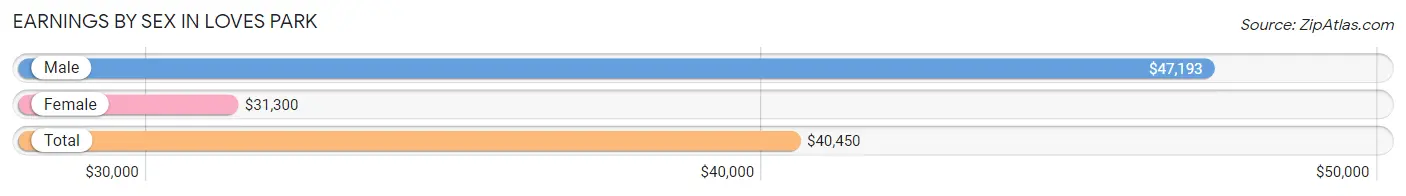
Earnings by Sex in Loves Park
Average Earnings in Loves Park are $40,450, $47,193 for men and $31,300 for women, a difference of 33.7%.
| Sex | Number | Average Earnings |
| Male | 6,352 (51.5%) | $47,193 |
| Female | 5,980 (48.5%) | $31,300 |
| Total | 12,332 (100.0%) | $40,450 |
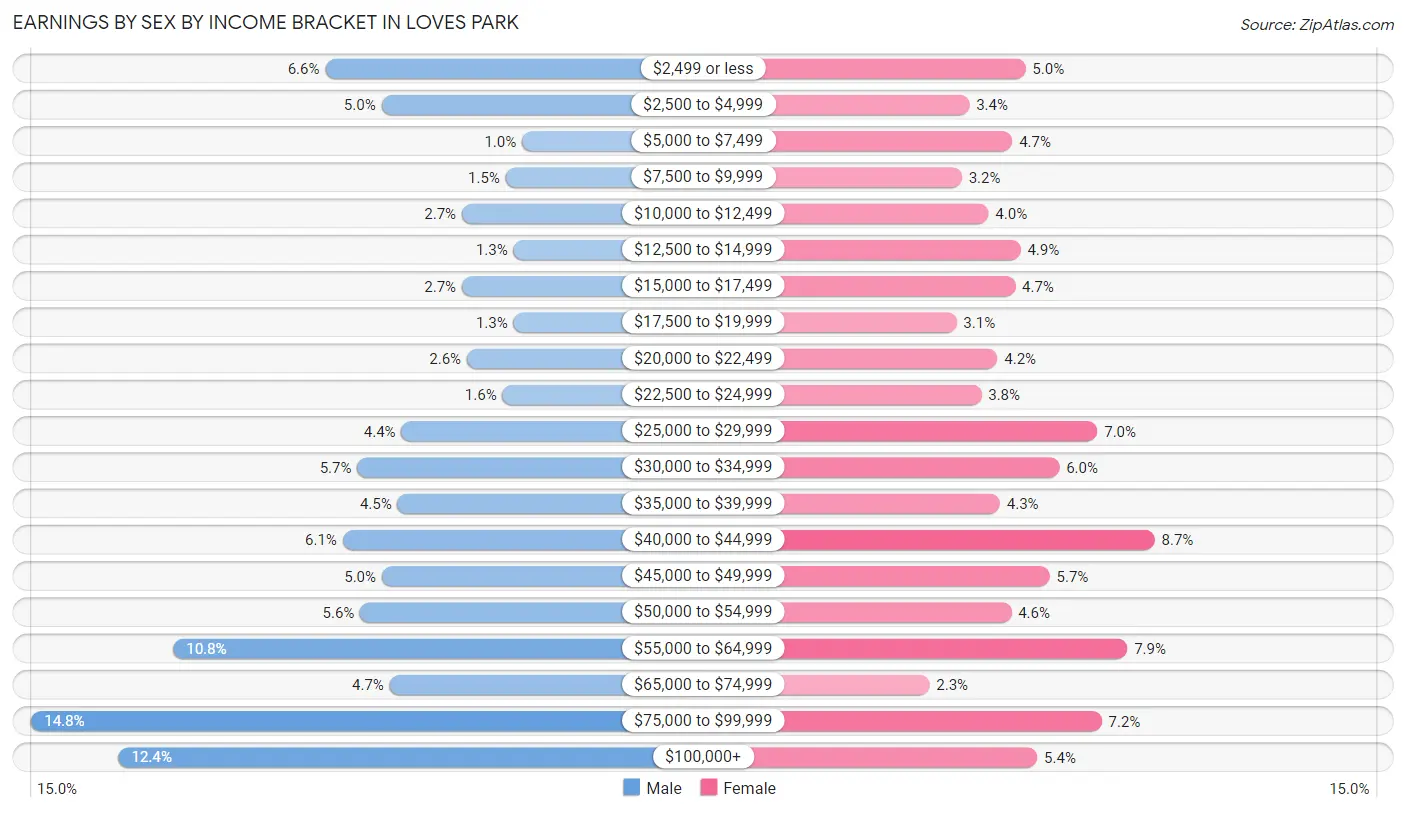
Earnings by Sex by Income Bracket in Loves Park
The most common earnings brackets in Loves Park are $75,000 to $99,999 for men (941 | 14.8%) and $40,000 to $44,999 for women (517 | 8.6%).
| Income | Male | Female |
| $2,499 or less | 416 (6.6%) | 300 (5.0%) |
| $2,500 to $4,999 | 316 (5.0%) | 206 (3.4%) |
| $5,000 to $7,499 | 65 (1.0%) | 278 (4.6%) |
| $7,500 to $9,999 | 94 (1.5%) | 193 (3.2%) |
| $10,000 to $12,499 | 172 (2.7%) | 238 (4.0%) |
| $12,500 to $14,999 | 80 (1.3%) | 292 (4.9%) |
| $15,000 to $17,499 | 172 (2.7%) | 283 (4.7%) |
| $17,500 to $19,999 | 80 (1.3%) | 184 (3.1%) |
| $20,000 to $22,499 | 163 (2.6%) | 253 (4.2%) |
| $22,500 to $24,999 | 100 (1.6%) | 226 (3.8%) |
| $25,000 to $29,999 | 280 (4.4%) | 421 (7.0%) |
| $30,000 to $34,999 | 359 (5.7%) | 357 (6.0%) |
| $35,000 to $39,999 | 287 (4.5%) | 257 (4.3%) |
| $40,000 to $44,999 | 385 (6.1%) | 517 (8.6%) |
| $45,000 to $49,999 | 315 (5.0%) | 341 (5.7%) |
| $50,000 to $54,999 | 354 (5.6%) | 276 (4.6%) |
| $55,000 to $64,999 | 687 (10.8%) | 471 (7.9%) |
| $65,000 to $74,999 | 301 (4.7%) | 139 (2.3%) |
| $75,000 to $99,999 | 941 (14.8%) | 428 (7.2%) |
| $100,000+ | 785 (12.4%) | 320 (5.3%) |
| Total | 6,352 (100.0%) | 5,980 (100.0%) |
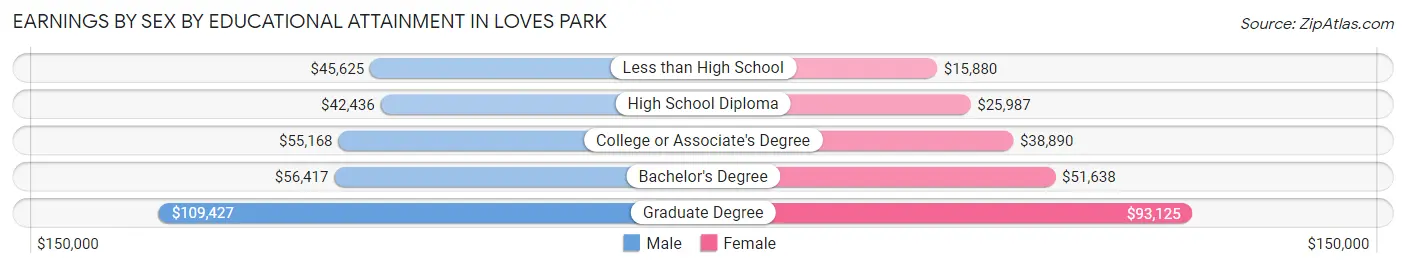
Earnings by Sex by Educational Attainment in Loves Park
Average earnings in Loves Park are $54,803 for men and $39,469 for women, a difference of 28.0%. Men with an educational attainment of graduate degree enjoy the highest average annual earnings of $109,427, while those with high school diploma education earn the least with $42,436. Women with an educational attainment of graduate degree earn the most with the average annual earnings of $93,125, while those with less than high school education have the smallest earnings of $15,880.
| Educational Attainment | Male Income | Female Income |
| Less than High School | $45,625 | $15,880 |
| High School Diploma | $42,436 | $25,987 |
| College or Associate's Degree | $55,168 | $38,890 |
| Bachelor's Degree | $56,417 | $51,638 |
| Graduate Degree | $109,427 | $93,125 |
| Total | $54,803 | $39,469 |
Family Income in Loves Park
Family Income Brackets in Loves Park
According to the Loves Park family income data, there are 1,139 families falling into the $50,000 to $74,999 income range, which is the most common income bracket and makes up 19.5% of all families. Conversely, the $10,000 to $14,999 income bracket is the least frequent group with only 105 families (1.8%) belonging to this category.
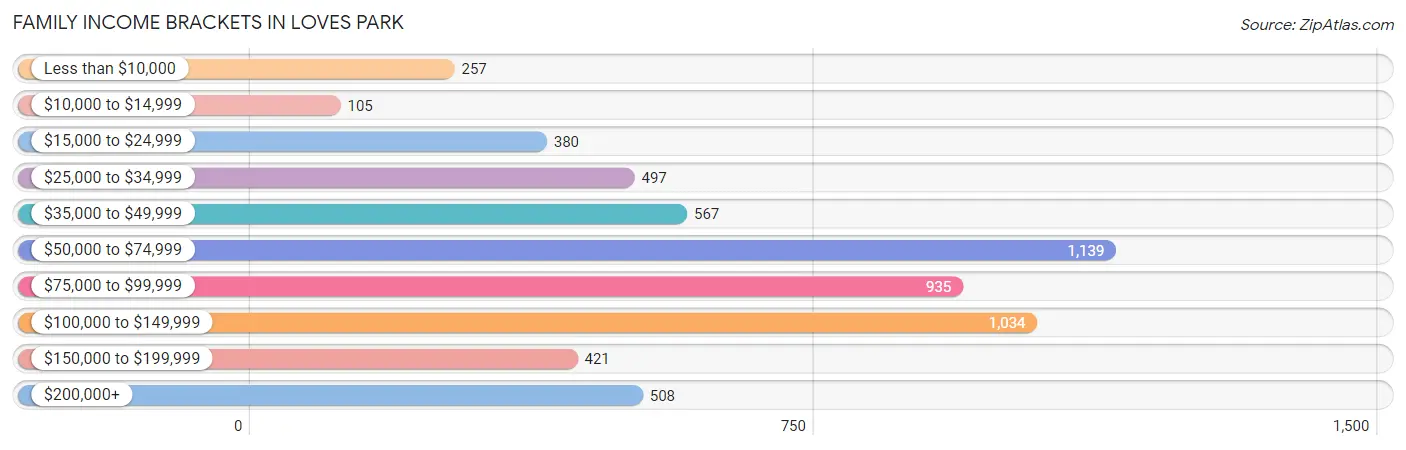
| Income Bracket | # Families | % Families |
| Less than $10,000 | 257 | 4.4% |
| $10,000 to $14,999 | 105 | 1.8% |
| $15,000 to $24,999 | 380 | 6.5% |
| $25,000 to $34,999 | 497 | 8.5% |
| $35,000 to $49,999 | 567 | 9.7% |
| $50,000 to $74,999 | 1,139 | 19.5% |
| $75,000 to $99,999 | 935 | 16.0% |
| $100,000 to $149,999 | 1,034 | 17.7% |
| $150,000 to $199,999 | 421 | 7.2% |
| $200,000+ | 508 | 8.7% |
Family Income by Famaliy Size in Loves Park
5-person families (282 | 4.8%) account for the highest median family income in Loves Park with $114,286 per family, while 2-person families (3,237 | 55.4%) have the highest median income of $34,080 per family member.
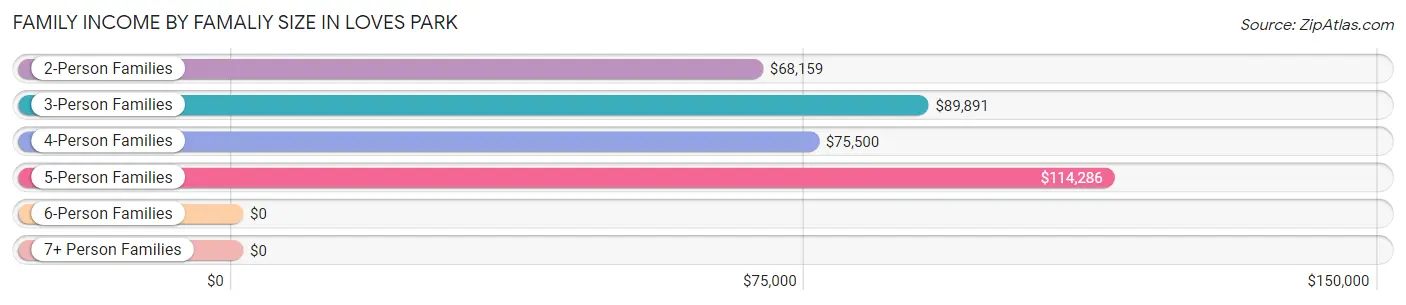
| Income Bracket | # Families | Median Income |
| 2-Person Families | 3,237 (55.4%) | $68,159 |
| 3-Person Families | 1,254 (21.5%) | $89,891 |
| 4-Person Families | 928 (15.9%) | $75,500 |
| 5-Person Families | 282 (4.8%) | $114,286 |
| 6-Person Families | 73 (1.3%) | $0 |
| 7+ Person Families | 68 (1.2%) | $0 |
| Total | 5,842 (100.0%) | $74,500 |
Family Income by Number of Earners in Loves Park
The median family income in Loves Park is $74,500, with families comprising 3+ earners (634) having the highest median family income of $133,750, while families with no earners (846) have the lowest median family income of $46,957, accounting for 10.8% and 14.5% of families, respectively.
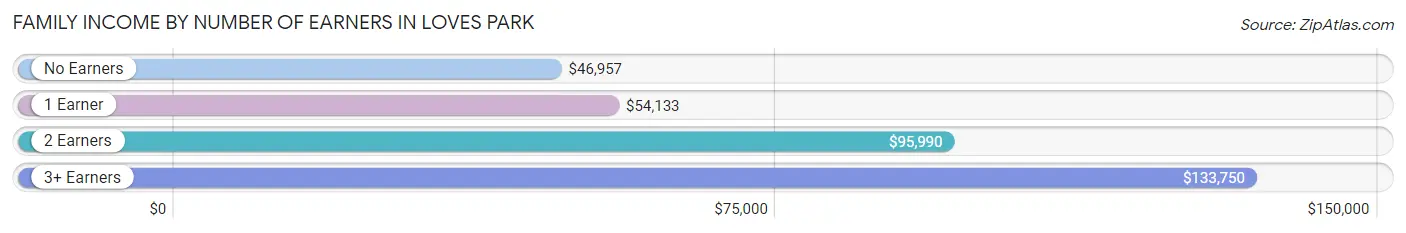
| Number of Earners | # Families | Median Income |
| No Earners | 846 (14.5%) | $46,957 |
| 1 Earner | 2,175 (37.2%) | $54,133 |
| 2 Earners | 2,187 (37.4%) | $95,990 |
| 3+ Earners | 634 (10.8%) | $133,750 |
| Total | 5,842 (100.0%) | $74,500 |
Household Income in Loves Park
Household Income Brackets in Loves Park
With 1,737 households falling in the category, the $50,000 to $74,999 income range is the most frequent in Loves Park, accounting for 17.9% of all households. In contrast, only 398 households (4.1%) fall into the $10,000 to $14,999 income bracket, making it the least populous group.
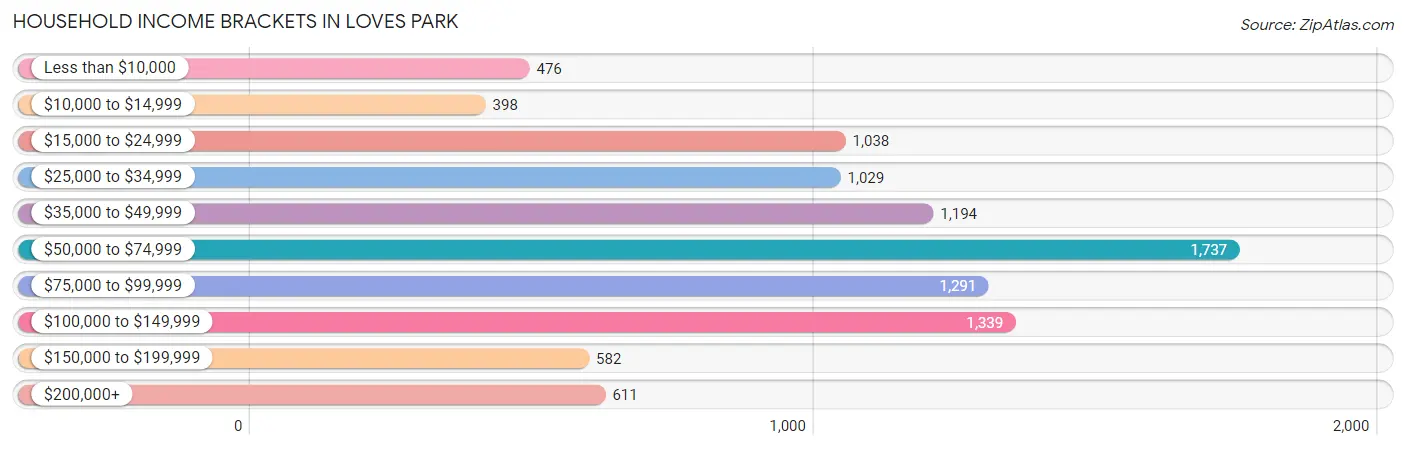
| Income Bracket | # Households | % Households |
| Less than $10,000 | 476 | 4.9% |
| $10,000 to $14,999 | 398 | 4.1% |
| $15,000 to $24,999 | 1,038 | 10.7% |
| $25,000 to $34,999 | 1,029 | 10.6% |
| $35,000 to $49,999 | 1,194 | 12.3% |
| $50,000 to $74,999 | 1,737 | 17.9% |
| $75,000 to $99,999 | 1,291 | 13.3% |
| $100,000 to $149,999 | 1,339 | 13.8% |
| $150,000 to $199,999 | 582 | 6.0% |
| $200,000+ | 611 | 6.3% |
Household Income by Householder Age in Loves Park
The median household income in Loves Park is $56,370, with the highest median household income of $80,566 found in the 45 to 64 years age bracket for the primary householder. A total of 3,084 households (31.8%) fall into this category. Meanwhile, the 65+ years age bracket for the primary householder has the lowest median household income of $37,069, with 2,862 households (29.5%) in this group.
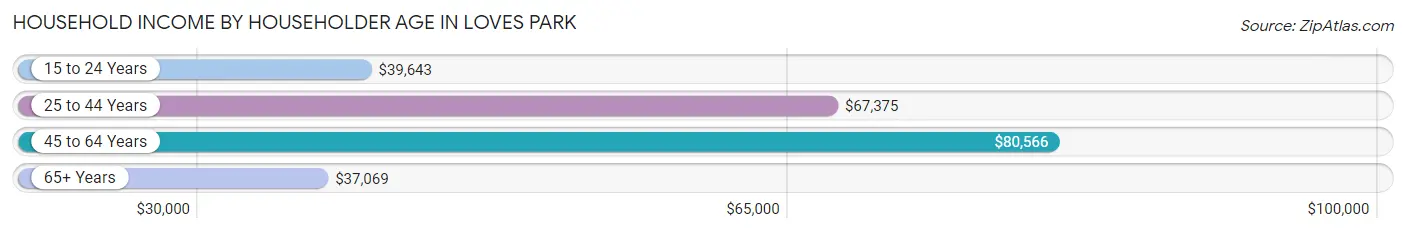
| Income Bracket | # Households | Median Income |
| 15 to 24 Years | 416 (4.3%) | $39,643 |
| 25 to 44 Years | 3,343 (34.4%) | $67,375 |
| 45 to 64 Years | 3,084 (31.8%) | $80,566 |
| 65+ Years | 2,862 (29.5%) | $37,069 |
| Total | 9,705 (100.0%) | $56,370 |
Poverty in Loves Park
Income Below Poverty by Sex and Age in Loves Park
With 16.6% poverty level for males and 14.1% for females among the residents of Loves Park, 16 and 17 year old males and 5 year old females are the most vulnerable to poverty, with 67 males (49.6%) and 32 females (34.4%) in their respective age groups living below the poverty level.
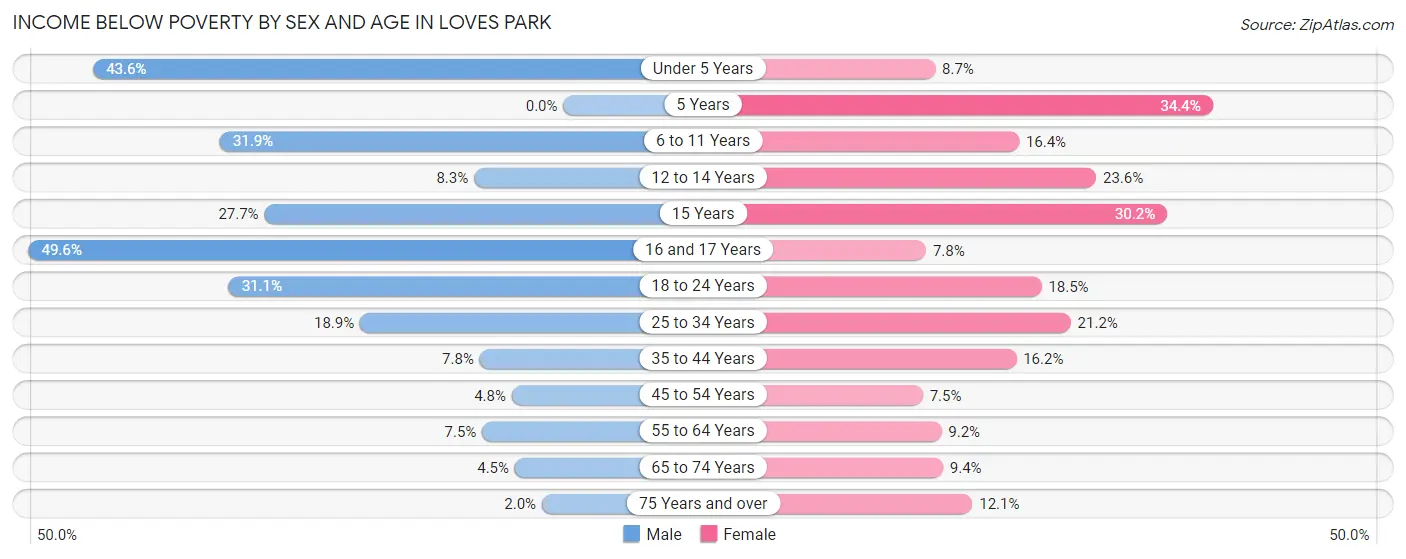
| Age Bracket | Male | Female |
| Under 5 Years | 397 (43.6%) | 68 (8.7%) |
| 5 Years | 0 (0.0%) | 32 (34.4%) |
| 6 to 11 Years | 218 (31.9%) | 121 (16.4%) |
| 12 to 14 Years | 30 (8.3%) | 101 (23.6%) |
| 15 Years | 38 (27.7%) | 32 (30.2%) |
| 16 and 17 Years | 67 (49.6%) | 20 (7.8%) |
| 18 to 24 Years | 344 (31.0%) | 237 (18.5%) |
| 25 to 34 Years | 366 (18.9%) | 354 (21.2%) |
| 35 to 44 Years | 95 (7.8%) | 222 (16.2%) |
| 45 to 54 Years | 43 (4.8%) | 80 (7.5%) |
| 55 to 64 Years | 127 (7.5%) | 157 (9.2%) |
| 65 to 74 Years | 55 (4.5%) | 128 (9.4%) |
| 75 Years and over | 9 (2.0%) | 124 (12.1%) |
| Total | 1,789 (16.6%) | 1,676 (14.1%) |
Income Above Poverty by Sex and Age in Loves Park
According to the poverty statistics in Loves Park, males aged 5 years and females aged 45 to 54 years are the age groups that are most secure financially, with 100.0% of males and 92.5% of females in these age groups living above the poverty line.
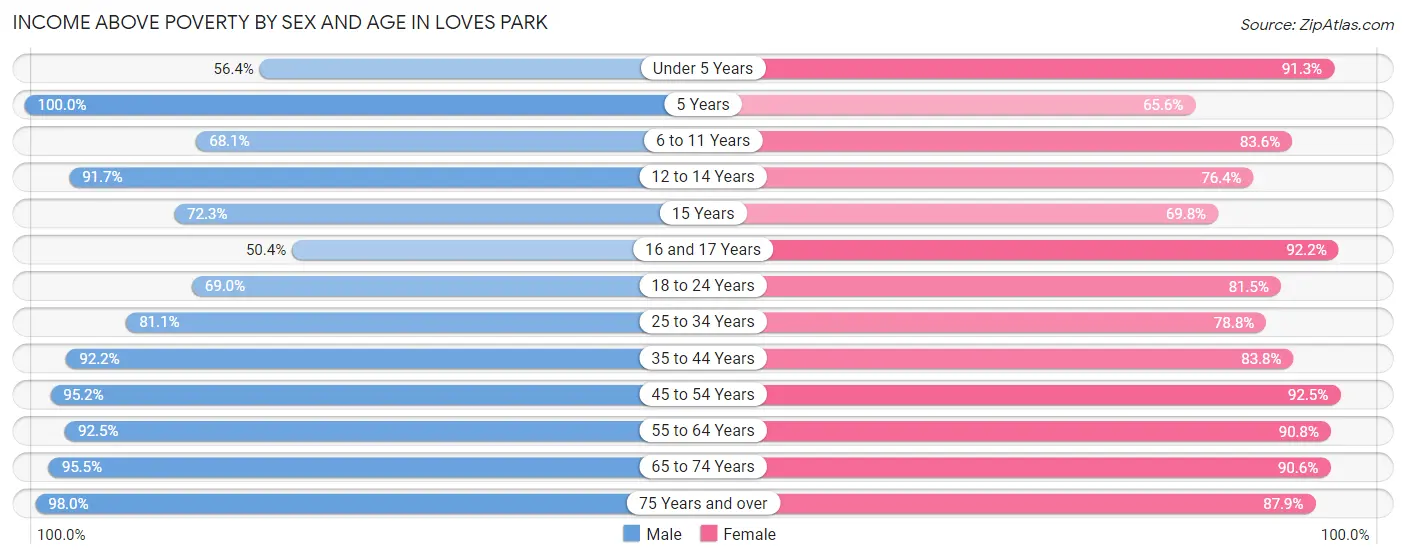
| Age Bracket | Male | Female |
| Under 5 Years | 513 (56.4%) | 717 (91.3%) |
| 5 Years | 34 (100.0%) | 61 (65.6%) |
| 6 to 11 Years | 466 (68.1%) | 615 (83.6%) |
| 12 to 14 Years | 332 (91.7%) | 327 (76.4%) |
| 15 Years | 99 (72.3%) | 74 (69.8%) |
| 16 and 17 Years | 68 (50.4%) | 236 (92.2%) |
| 18 to 24 Years | 764 (69.0%) | 1,042 (81.5%) |
| 25 to 34 Years | 1,574 (81.1%) | 1,313 (78.8%) |
| 35 to 44 Years | 1,129 (92.2%) | 1,149 (83.8%) |
| 45 to 54 Years | 856 (95.2%) | 985 (92.5%) |
| 55 to 64 Years | 1,559 (92.5%) | 1,543 (90.8%) |
| 65 to 74 Years | 1,168 (95.5%) | 1,237 (90.6%) |
| 75 Years and over | 444 (98.0%) | 900 (87.9%) |
| Total | 9,006 (83.4%) | 10,199 (85.9%) |
Income Below Poverty Among Married-Couple Families in Loves Park
The poverty statistics for married-couple families in Loves Park show that 2.7% or 105 of the total 3,936 families live below the poverty line. Families with 3 or 4 children have the highest poverty rate of 30.1%, comprising of 56 families. On the other hand, families with 1 or 2 children have the lowest poverty rate of 0.0%, which includes 0 families.
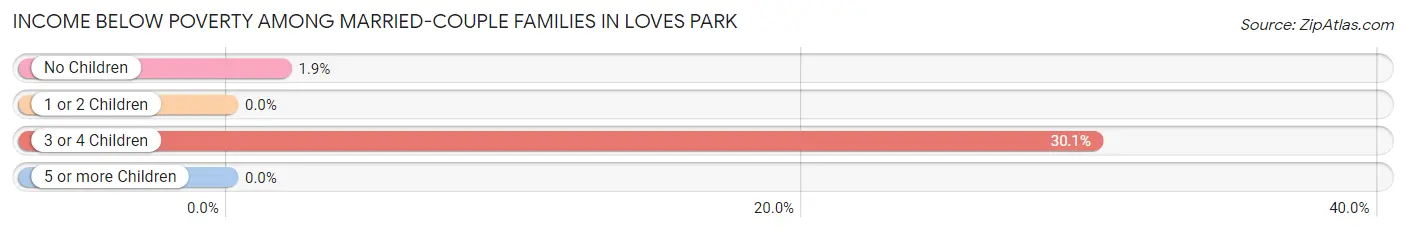
| Children | Above Poverty | Below Poverty |
| No Children | 2,592 (98.1%) | 49 (1.9%) |
| 1 or 2 Children | 1,096 (100.0%) | 0 (0.0%) |
| 3 or 4 Children | 130 (69.9%) | 56 (30.1%) |
| 5 or more Children | 13 (100.0%) | 0 (0.0%) |
| Total | 3,831 (97.3%) | 105 (2.7%) |
Income Below Poverty Among Single-Parent Households in Loves Park
According to the poverty data in Loves Park, 6.7% or 36 single-father households and 32.4% or 445 single-mother households are living below the poverty line. Among single-father households, those with 1 or 2 children have the highest poverty rate, with 31 households (14.7%) experiencing poverty. Likewise, among single-mother households, those with 3 or 4 children have the highest poverty rate, with 103 households (57.5%) falling below the poverty line.
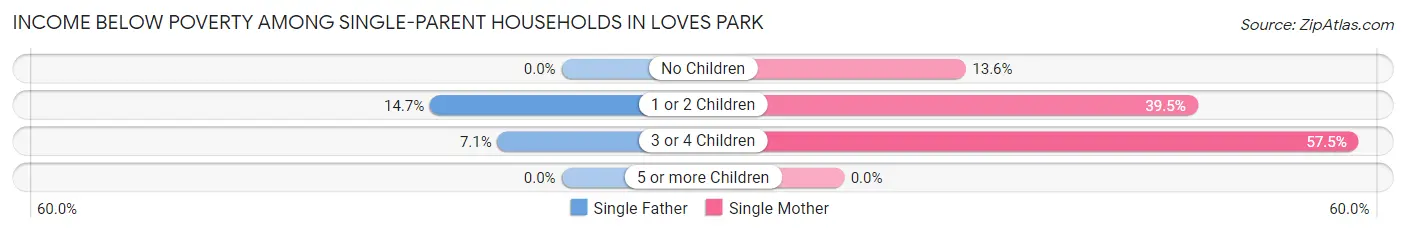
| Children | Single Father | Single Mother |
| No Children | 0 (0.0%) | 68 (13.6%) |
| 1 or 2 Children | 31 (14.7%) | 274 (39.5%) |
| 3 or 4 Children | 5 (7.1%) | 103 (57.5%) |
| 5 or more Children | 0 (0.0%) | 0 (0.0%) |
| Total | 36 (6.7%) | 445 (32.4%) |
Income Below Poverty Among Married-Couple vs Single-Parent Households in Loves Park
The poverty data for Loves Park shows that 105 of the married-couple family households (2.7%) and 481 of the single-parent households (25.2%) are living below the poverty level. Within the married-couple family households, those with 3 or 4 children have the highest poverty rate, with 56 households (30.1%) falling below the poverty line. Among the single-parent households, those with 3 or 4 children have the highest poverty rate, with 108 household (43.4%) living below poverty.
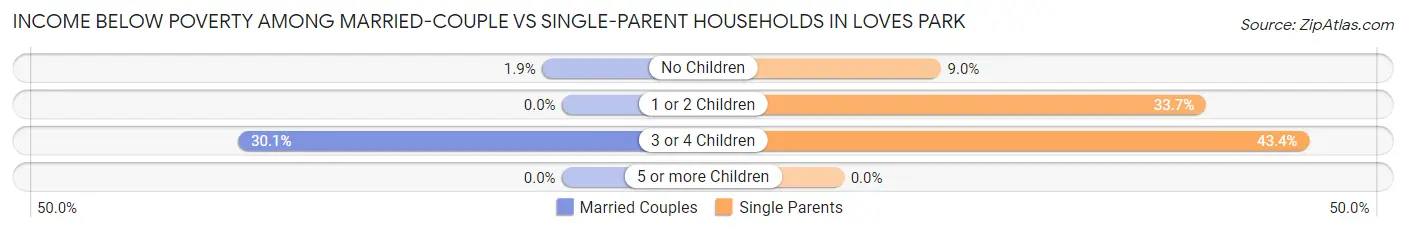
| Children | Married-Couple Families | Single-Parent Households |
| No Children | 49 (1.9%) | 68 (9.0%) |
| 1 or 2 Children | 0 (0.0%) | 305 (33.7%) |
| 3 or 4 Children | 56 (30.1%) | 108 (43.4%) |
| 5 or more Children | 0 (0.0%) | 0 (0.0%) |
| Total | 105 (2.7%) | 481 (25.2%) |
Race in Loves Park
The most populous races in Loves Park are White / Caucasian (17,974 | 78.4%), Hispanic or Latino (2,228 | 9.7%), and Two or more Races (2,129 | 9.3%).
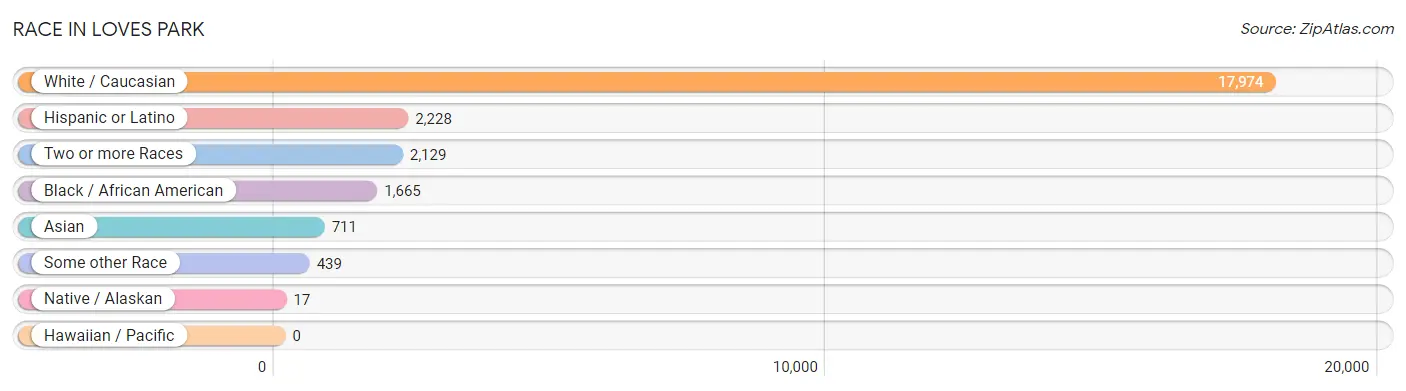
| Race | # Population | % Population |
| Asian | 711 | 3.1% |
| Black / African American | 1,665 | 7.3% |
| Hawaiian / Pacific | 0 | 0.0% |
| Hispanic or Latino | 2,228 | 9.7% |
| Native / Alaskan | 17 | 0.1% |
| White / Caucasian | 17,974 | 78.4% |
| Two or more Races | 2,129 | 9.3% |
| Some other Race | 439 | 1.9% |
| Total | 22,935 | 100.0% |
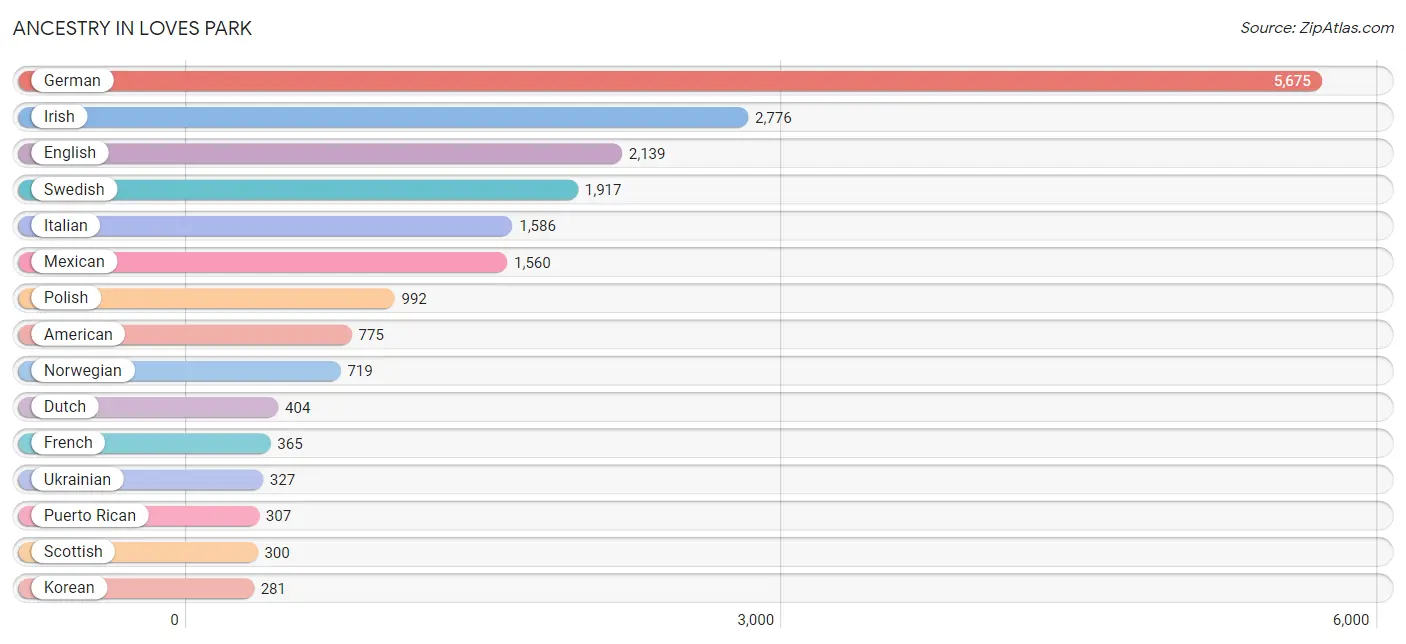
Ancestry in Loves Park
The most populous ancestries reported in Loves Park are German (5,675 | 24.7%), Irish (2,776 | 12.1%), English (2,139 | 9.3%), Swedish (1,917 | 8.4%), and Italian (1,586 | 6.9%), together accounting for 61.5% of all Loves Park residents.
| Ancestry | # Population | % Population |
| African | 47 | 0.2% |
| Alsatian | 18 | 0.1% |
| American | 775 | 3.4% |
| Arab | 62 | 0.3% |
| Austrian | 8 | 0.0% |
| Belgian | 9 | 0.0% |
| Belizean | 16 | 0.1% |
| Blackfeet | 85 | 0.4% |
| British | 88 | 0.4% |
| Bulgarian | 10 | 0.0% |
| Burmese | 28 | 0.1% |
| Central American | 109 | 0.5% |
| Cherokee | 150 | 0.6% |
| Chippewa | 6 | 0.0% |
| Colombian | 20 | 0.1% |
| Croatian | 25 | 0.1% |
| Cuban | 64 | 0.3% |
| Czech | 100 | 0.4% |
| Czechoslovakian | 16 | 0.1% |
| Danish | 53 | 0.2% |
| Dutch | 404 | 1.8% |
| Eastern European | 23 | 0.1% |
| Ecuadorian | 9 | 0.0% |
| Egyptian | 62 | 0.3% |
| English | 2,139 | 9.3% |
| European | 253 | 1.1% |
| Finnish | 29 | 0.1% |
| French | 365 | 1.6% |
| French Canadian | 73 | 0.3% |
| German | 5,675 | 24.7% |
| Greek | 67 | 0.3% |
| Guatemalan | 91 | 0.4% |
| Hungarian | 32 | 0.1% |
| Indian (Asian) | 244 | 1.1% |
| Irish | 2,776 | 12.1% |
| Italian | 1,586 | 6.9% |
| Kenyan | 1 | 0.0% |
| Korean | 281 | 1.2% |
| Laotian | 24 | 0.1% |
| Lithuanian | 72 | 0.3% |
| Luxembourger | 12 | 0.1% |
| Malaysian | 3 | 0.0% |
| Mexican | 1,560 | 6.8% |
| Mexican American Indian | 17 | 0.1% |
| Northern European | 31 | 0.1% |
| Norwegian | 719 | 3.1% |
| Okinawan | 28 | 0.1% |
| Polish | 992 | 4.3% |
| Puerto Rican | 307 | 1.3% |
| Russian | 51 | 0.2% |
| Salvadoran | 18 | 0.1% |
| Scandinavian | 71 | 0.3% |
| Scotch-Irish | 104 | 0.4% |
| Scottish | 300 | 1.3% |
| Serbian | 250 | 1.1% |
| Sioux | 85 | 0.4% |
| Slovak | 29 | 0.1% |
| Slovene | 94 | 0.4% |
| South American | 175 | 0.8% |
| Sri Lankan | 16 | 0.1% |
| Subsaharan African | 48 | 0.2% |
| Swedish | 1,917 | 8.4% |
| Swiss | 81 | 0.4% |
| Thai | 235 | 1.0% |
| Turkish | 11 | 0.1% |
| Ukrainian | 327 | 1.4% |
| Venezuelan | 146 | 0.6% |
| Welsh | 111 | 0.5% |
| Yugoslavian | 56 | 0.2% | View All 69 Rows |
Immigrants in Loves Park
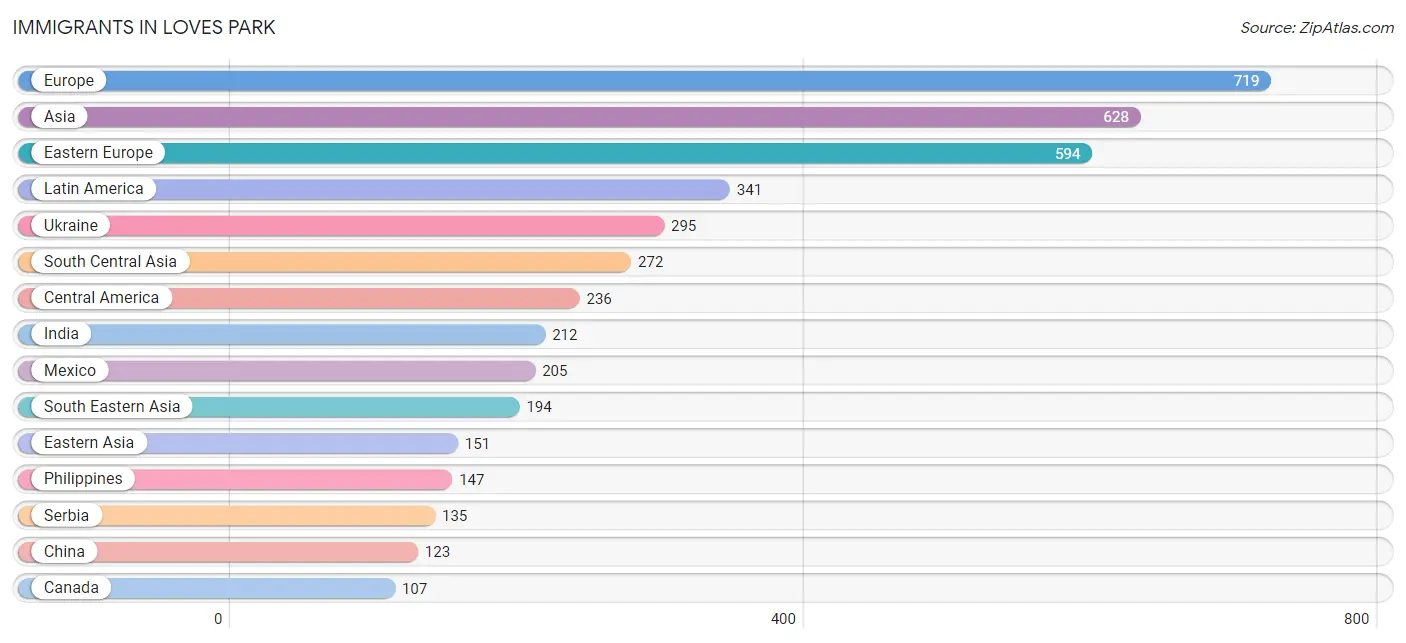
The most numerous immigrant groups reported in Loves Park came from Europe (719 | 3.1%), Asia (628 | 2.7%), Eastern Europe (594 | 2.6%), Latin America (341 | 1.5%), and Ukraine (295 | 1.3%), together accounting for 11.2% of all Loves Park residents.
| Immigration Origin | # Population | % Population |
| Africa | 39 | 0.2% |
| Asia | 628 | 2.7% |
| Bosnia and Herzegovina | 105 | 0.5% |
| Canada | 107 | 0.5% |
| Caribbean | 9 | 0.0% |
| Central America | 236 | 1.0% |
| China | 123 | 0.5% |
| Colombia | 20 | 0.1% |
| Croatia | 1 | 0.0% |
| Cuba | 9 | 0.0% |
| Eastern Africa | 1 | 0.0% |
| Eastern Asia | 151 | 0.7% |
| Eastern Europe | 594 | 2.6% |
| Ecuador | 5 | 0.0% |
| Egypt | 38 | 0.2% |
| England | 14 | 0.1% |
| Europe | 719 | 3.1% |
| Germany | 72 | 0.3% |
| Guatemala | 31 | 0.1% |
| India | 212 | 0.9% |
| Italy | 15 | 0.1% |
| Kenya | 1 | 0.0% |
| Korea | 28 | 0.1% |
| Latin America | 341 | 1.5% |
| Malaysia | 16 | 0.1% |
| Mexico | 205 | 0.9% |
| Netherlands | 24 | 0.1% |
| Northern Africa | 38 | 0.2% |
| Northern Europe | 14 | 0.1% |
| Philippines | 147 | 0.6% |
| Poland | 58 | 0.3% |
| Serbia | 135 | 0.6% |
| Singapore | 15 | 0.1% |
| South America | 96 | 0.4% |
| South Central Asia | 272 | 1.2% |
| South Eastern Asia | 194 | 0.9% |
| Southern Europe | 15 | 0.1% |
| Ukraine | 295 | 1.3% |
| Uzbekistan | 60 | 0.3% |
| Venezuela | 71 | 0.3% |
| Vietnam | 16 | 0.1% |
| Western Asia | 11 | 0.1% |
| Western Europe | 96 | 0.4% | View All 43 Rows |
Sex and Age in Loves Park
Sex and Age in Loves Park
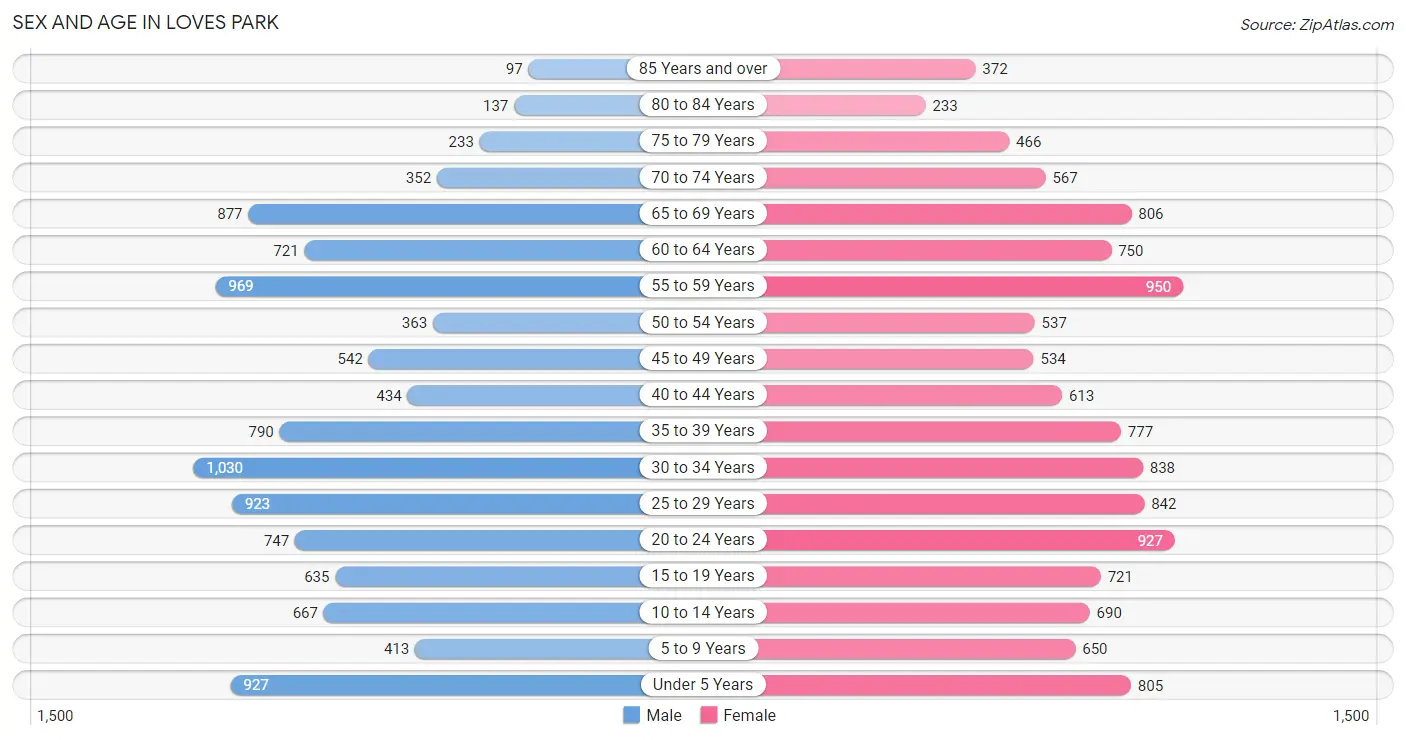
The most populous age groups in Loves Park are 30 to 34 Years (1,030 | 9.5%) for men and 55 to 59 Years (950 | 7.9%) for women.
| Age Bracket | Male | Female |
| Under 5 Years | 927 (8.5%) | 805 (6.7%) |
| 5 to 9 Years | 413 (3.8%) | 650 (5.4%) |
| 10 to 14 Years | 667 (6.1%) | 690 (5.7%) |
| 15 to 19 Years | 635 (5.9%) | 721 (6.0%) |
| 20 to 24 Years | 747 (6.9%) | 927 (7.7%) |
| 25 to 29 Years | 923 (8.5%) | 842 (7.0%) |
| 30 to 34 Years | 1,030 (9.5%) | 838 (6.9%) |
| 35 to 39 Years | 790 (7.3%) | 777 (6.4%) |
| 40 to 44 Years | 434 (4.0%) | 613 (5.1%) |
| 45 to 49 Years | 542 (5.0%) | 534 (4.4%) |
| 50 to 54 Years | 363 (3.3%) | 537 (4.4%) |
| 55 to 59 Years | 969 (8.9%) | 950 (7.9%) |
| 60 to 64 Years | 721 (6.6%) | 750 (6.2%) |
| 65 to 69 Years | 877 (8.1%) | 806 (6.7%) |
| 70 to 74 Years | 352 (3.2%) | 567 (4.7%) |
| 75 to 79 Years | 233 (2.1%) | 466 (3.9%) |
| 80 to 84 Years | 137 (1.3%) | 233 (1.9%) |
| 85 Years and over | 97 (0.9%) | 372 (3.1%) |
| Total | 10,857 (100.0%) | 12,078 (100.0%) |
Families and Households in Loves Park
Median Family Size in Loves Park
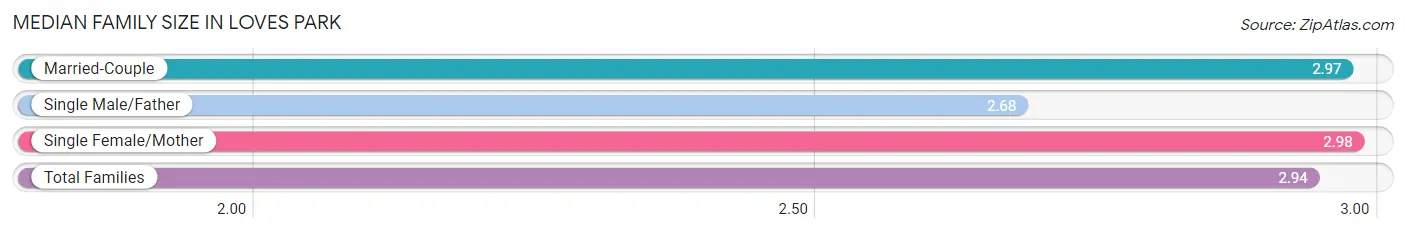
The median family size in Loves Park is 2.94 persons per family, with single female/mother families (1,372 | 23.5%) accounting for the largest median family size of 2.98 persons per family. On the other hand, single male/father families (534 | 9.1%) represent the smallest median family size with 2.68 persons per family.
| Family Type | # Families | Family Size |
| Married-Couple | 3,936 (67.4%) | 2.97 |
| Single Male/Father | 534 (9.1%) | 2.68 |
| Single Female/Mother | 1,372 (23.5%) | 2.98 |
| Total Families | 5,842 (100.0%) | 2.94 |
Median Household Size in Loves Park
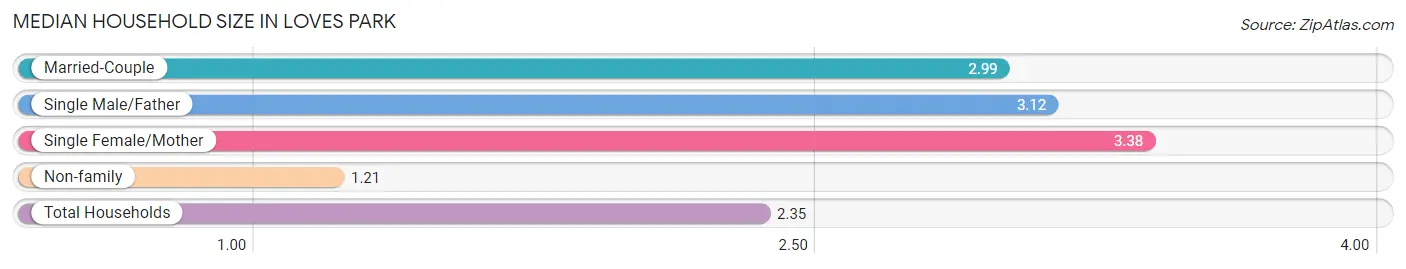
The median household size in Loves Park is 2.35 persons per household, with single female/mother households (1,372 | 14.1%) accounting for the largest median household size of 3.38 persons per household. non-family households (3,863 | 39.8%) represent the smallest median household size with 1.21 persons per household.
| Household Type | # Households | Household Size |
| Married-Couple | 3,936 (40.6%) | 2.99 |
| Single Male/Father | 534 (5.5%) | 3.12 |
| Single Female/Mother | 1,372 (14.1%) | 3.38 |
| Non-family | 3,863 (39.8%) | 1.21 |
| Total Households | 9,705 (100.0%) | 2.35 |
Household Size by Marriage Status in Loves Park
Out of a total of 9,705 households in Loves Park, 5,842 (60.2%) are family households, while 3,863 (39.8%) are nonfamily households. The most numerous type of family households are 2-person households, comprising 2,800, and the most common type of nonfamily households are 1-person households, comprising 3,158.
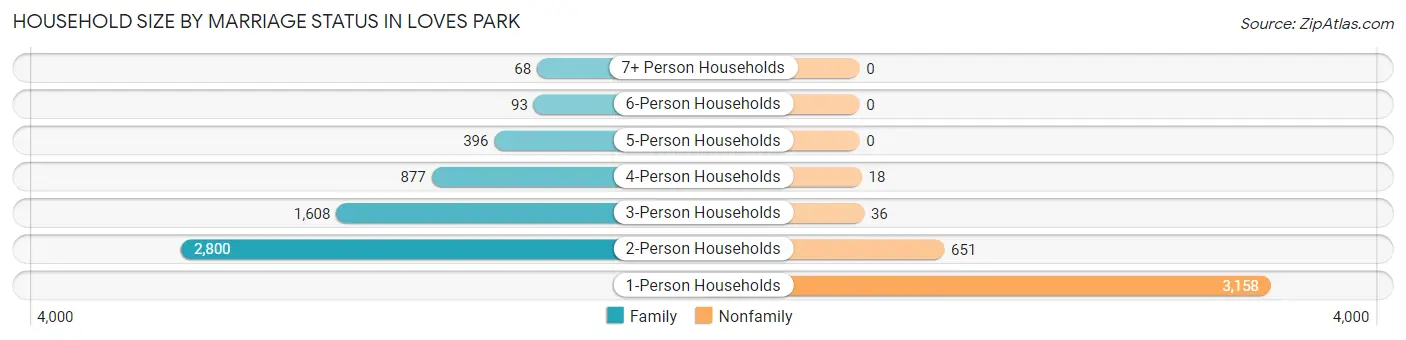
| Household Size | Family Households | Nonfamily Households |
| 1-Person Households | - | 3,158 (32.5%) |
| 2-Person Households | 2,800 (28.8%) | 651 (6.7%) |
| 3-Person Households | 1,608 (16.6%) | 36 (0.4%) |
| 4-Person Households | 877 (9.0%) | 18 (0.2%) |
| 5-Person Households | 396 (4.1%) | 0 (0.0%) |
| 6-Person Households | 93 (1.0%) | 0 (0.0%) |
| 7+ Person Households | 68 (0.7%) | 0 (0.0%) |
| Total | 5,842 (60.2%) | 3,863 (39.8%) |
Female Fertility in Loves Park
Fertility by Age in Loves Park
Average fertility rate in Loves Park is 84.0 births per 1,000 women. Women in the age bracket of 20 to 34 years have the highest fertility rate with 152.0 births per 1,000 women. Women in the age bracket of 20 to 34 years acount for 88.4% of all women with births.
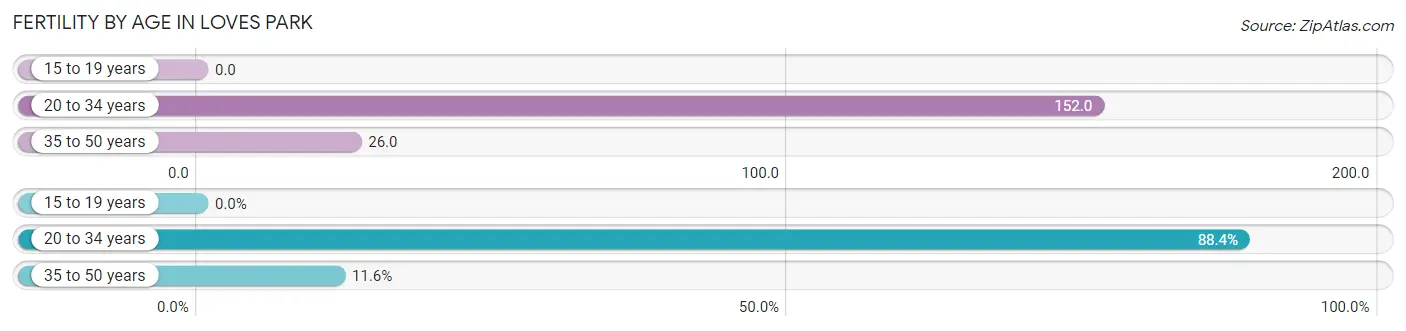
| Age Bracket | Women with Births | Births / 1,000 Women |
| 15 to 19 years | 0 (0.0%) | 0.0 |
| 20 to 34 years | 395 (88.4%) | 152.0 |
| 35 to 50 years | 52 (11.6%) | 26.0 |
| Total | 447 (100.0%) | 84.0 |
Fertility by Age by Marriage Status in Loves Park
52.3% of women with births (447) in Loves Park are married. The highest percentage of unmarried women with births falls into 35 to 50 years age bracket with 48.1% of them unmarried at the time of birth, while the lowest percentage of unmarried women with births belong to 20 to 34 years age bracket with 47.6% of them unmarried.
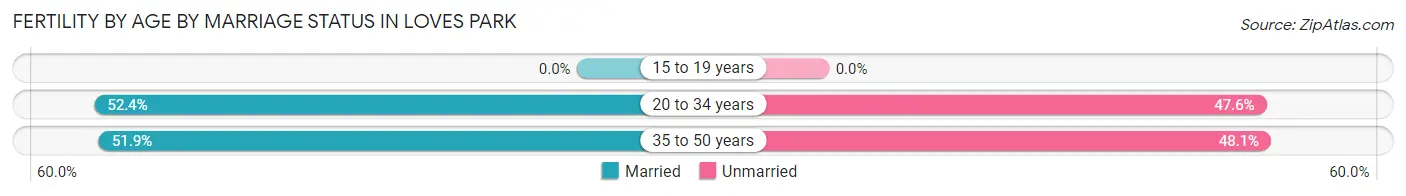
| Age Bracket | Married | Unmarried |
| 15 to 19 years | 0 (0.0%) | 0 (0.0%) |
| 20 to 34 years | 207 (52.4%) | 188 (47.6%) |
| 35 to 50 years | 27 (51.9%) | 25 (48.1%) |
| Total | 234 (52.3%) | 213 (47.6%) |
Fertility by Education in Loves Park
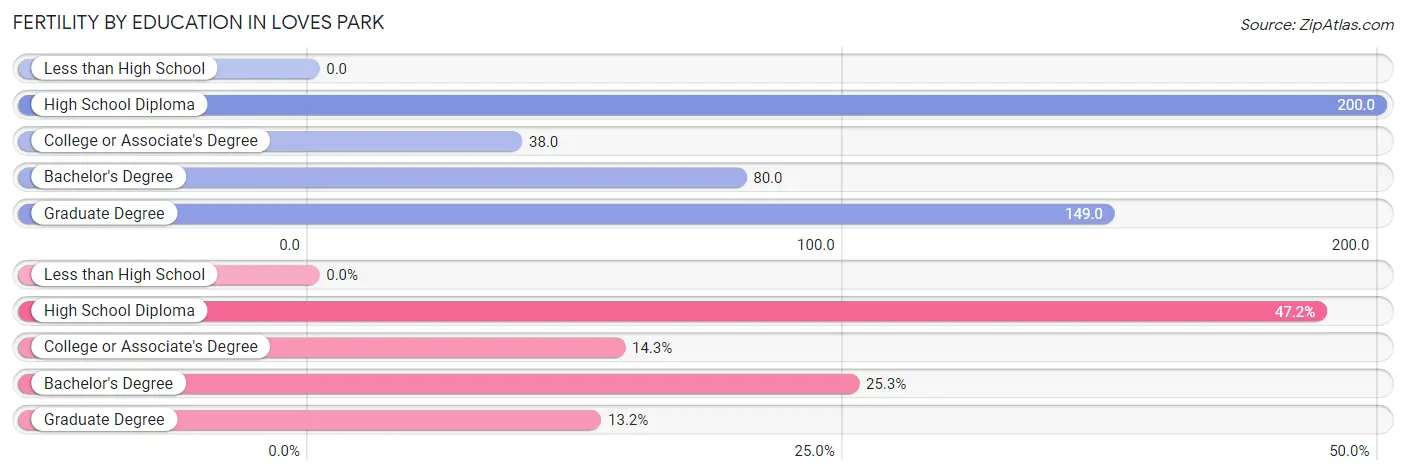
| Educational Attainment | Women with Births | Births / 1,000 Women |
| Less than High School | 0 (0.0%) | 0.0 |
| High School Diploma | 211 (47.2%) | 200.0 |
| College or Associate's Degree | 64 (14.3%) | 38.0 |
| Bachelor's Degree | 113 (25.3%) | 80.0 |
| Graduate Degree | 59 (13.2%) | 149.0 |
| Total | 447 (100.0%) | 84.0 |
Fertility by Education by Marriage Status in Loves Park
47.6% of women with births in Loves Park are unmarried. Women with the educational attainment of college or associate's degree are most likely to be married with 100.0% of them married at childbirth, while women with the educational attainment of high school diploma are least likely to be married with 81.5% of them unmarried at childbirth.
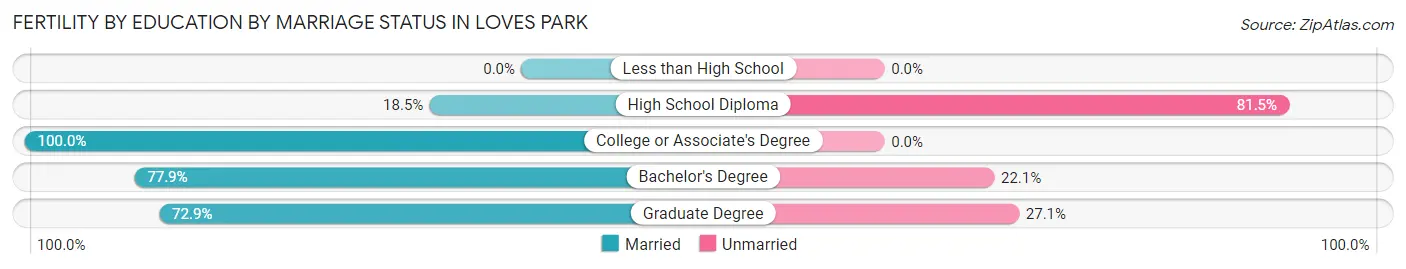
| Educational Attainment | Married | Unmarried |
| Less than High School | 0 (0.0%) | 0 (0.0%) |
| High School Diploma | 39 (18.5%) | 172 (81.5%) |
| College or Associate's Degree | 64 (100.0%) | 0 (0.0%) |
| Bachelor's Degree | 88 (77.9%) | 25 (22.1%) |
| Graduate Degree | 43 (72.9%) | 16 (27.1%) |
| Total | 234 (52.3%) | 213 (47.6%) |
Employment Characteristics in Loves Park
Employment by Class of Employer in Loves Park
Among the 10,921 employed individuals in Loves Park, private company employees (7,652 | 70.1%), not-for-profit organizations (1,493 | 13.7%), and local government employees (595 | 5.4%) make up the most common classes of employment.
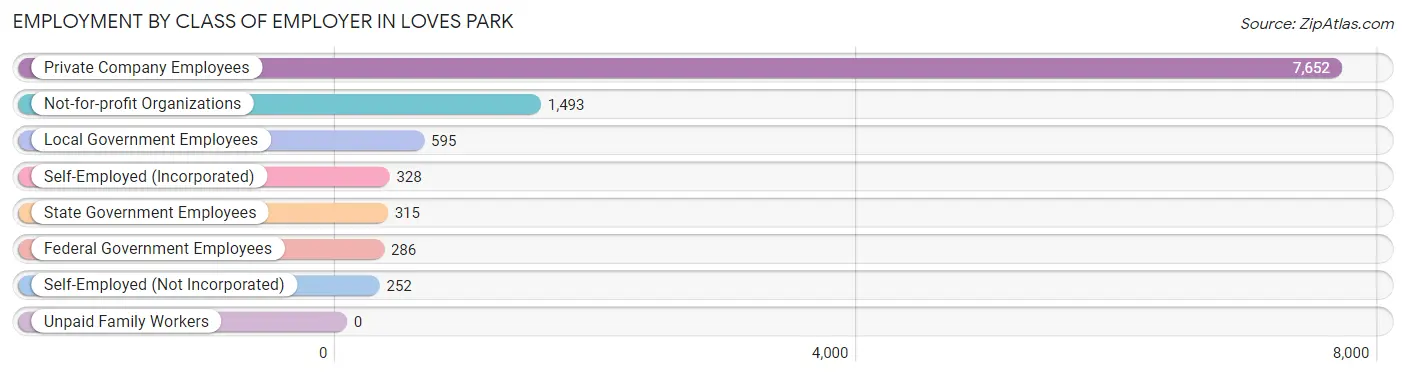
| Employer Class | # Employees | % Employees |
| Private Company Employees | 7,652 | 70.1% |
| Self-Employed (Incorporated) | 328 | 3.0% |
| Self-Employed (Not Incorporated) | 252 | 2.3% |
| Not-for-profit Organizations | 1,493 | 13.7% |
| Local Government Employees | 595 | 5.4% |
| State Government Employees | 315 | 2.9% |
| Federal Government Employees | 286 | 2.6% |
| Unpaid Family Workers | 0 | 0.0% |
| Total | 10,921 | 100.0% |
Employment Status by Age in Loves Park
According to the labor force statistics for Loves Park, out of the total population over 16 years of age (18,538), 65.7% or 12,179 individuals are in the labor force, with 7.8% or 950 of them unemployed. The age group with the highest labor force participation rate is 30 to 34 years, with 91.4% or 1,707 individuals in the labor force. Within the labor force, the 30 to 34 years age range has the highest percentage of unemployed individuals, with 19.3% or 329 of them being unemployed.
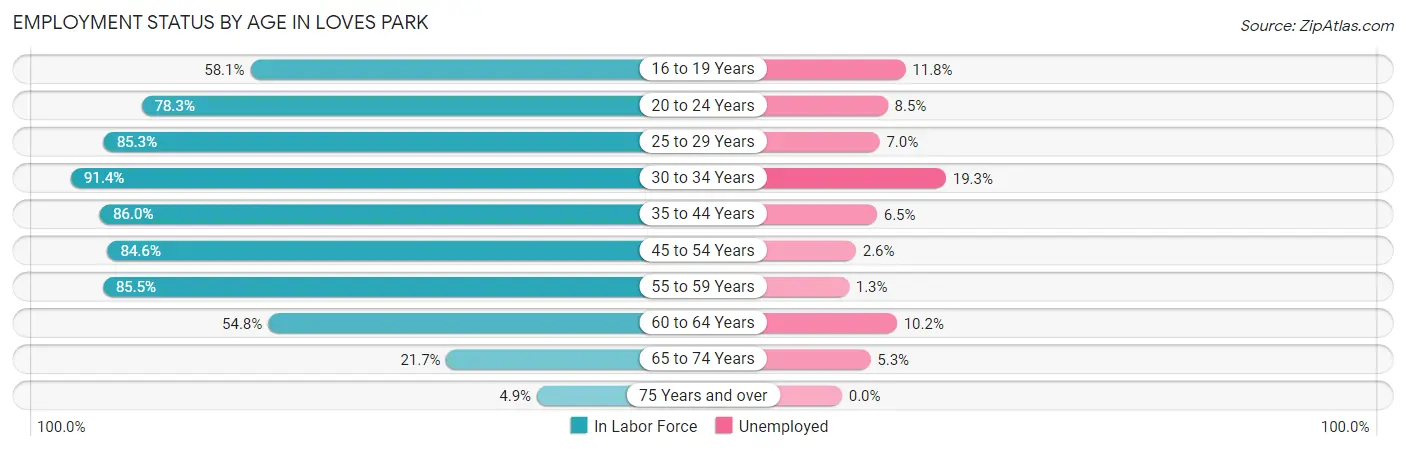
| Age Bracket | In Labor Force | Unemployed |
| 16 to 19 Years | 645 (58.1%) | 76 (11.8%) |
| 20 to 24 Years | 1,311 (78.3%) | 111 (8.5%) |
| 25 to 29 Years | 1,506 (85.3%) | 105 (7.0%) |
| 30 to 34 Years | 1,707 (91.4%) | 329 (19.3%) |
| 35 to 44 Years | 2,248 (86.0%) | 146 (6.5%) |
| 45 to 54 Years | 1,672 (84.6%) | 43 (2.6%) |
| 55 to 59 Years | 1,641 (85.5%) | 21 (1.3%) |
| 60 to 64 Years | 806 (54.8%) | 82 (10.2%) |
| 65 to 74 Years | 565 (21.7%) | 30 (5.3%) |
| 75 Years and over | 75 (4.9%) | 0 (0.0%) |
| Total | 12,179 (65.7%) | 950 (7.8%) |
Employment Status by Educational Attainment in Loves Park
According to labor force statistics for Loves Park, 82.5% of individuals (9,581) out of the total population between 25 and 64 years of age (11,613) are in the labor force, with 7.6% or 728 of them being unemployed. The group with the highest labor force participation rate are those with the educational attainment of bachelor's degree or higher, with 91.3% or 2,974 individuals in the labor force. Within the labor force, individuals with college / associate degree education have the highest percentage of unemployment, with 10.1% or 367 of them being unemployed.
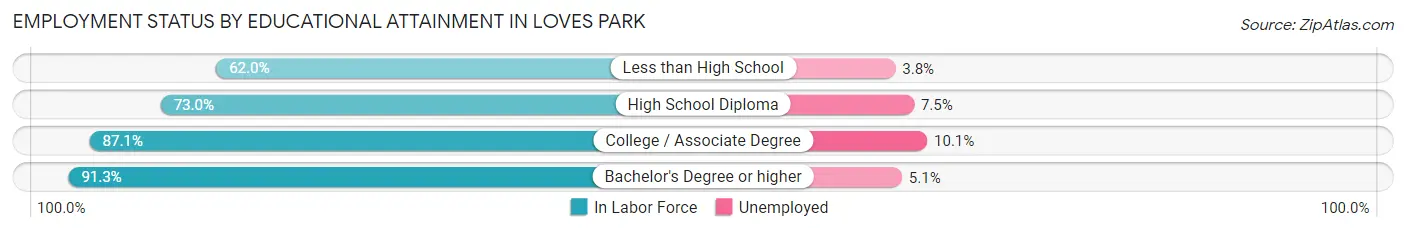
| Educational Attainment | In Labor Force | Unemployed |
| Less than High School | 446 (62.0%) | 27 (3.8%) |
| High School Diploma | 2,532 (73.0%) | 260 (7.5%) |
| College / Associate Degree | 3,630 (87.1%) | 421 (10.1%) |
| Bachelor's Degree or higher | 2,974 (91.3%) | 166 (5.1%) |
| Total | 9,581 (82.5%) | 883 (7.6%) |
Employment Occupations by Sex in Loves Park
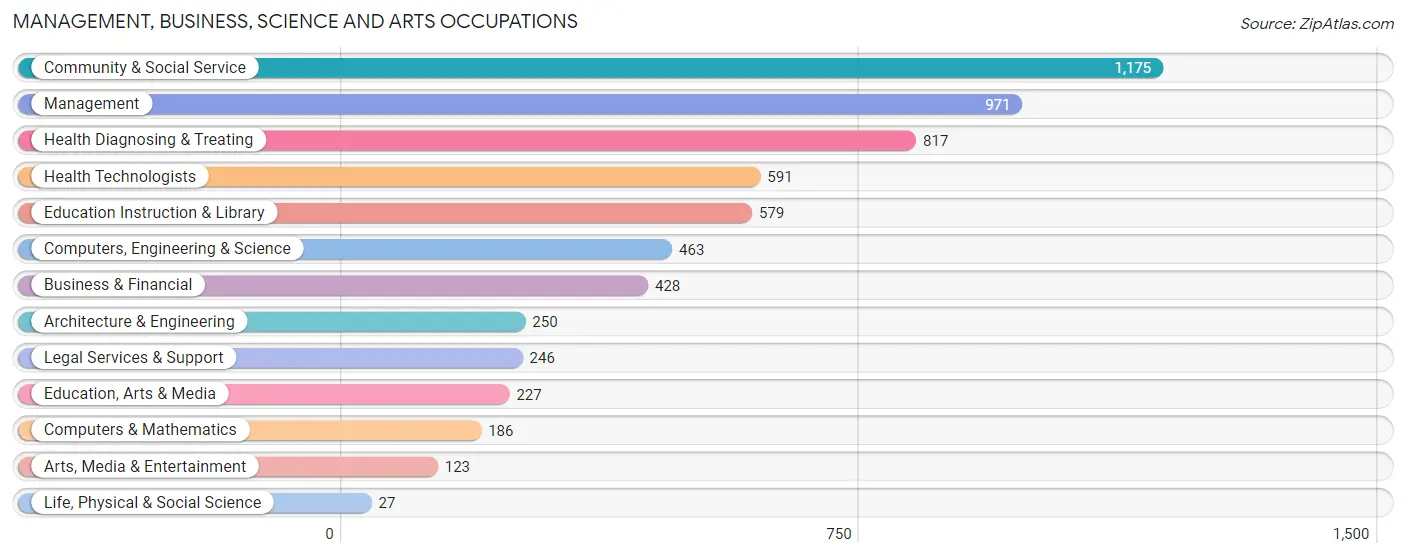
Management, Business, Science and Arts Occupations
The most common Management, Business, Science and Arts occupations in Loves Park are Community & Social Service (1,175 | 10.5%), Management (971 | 8.6%), Health Diagnosing & Treating (817 | 7.3%), Health Technologists (591 | 5.3%), and Education Instruction & Library (579 | 5.2%).
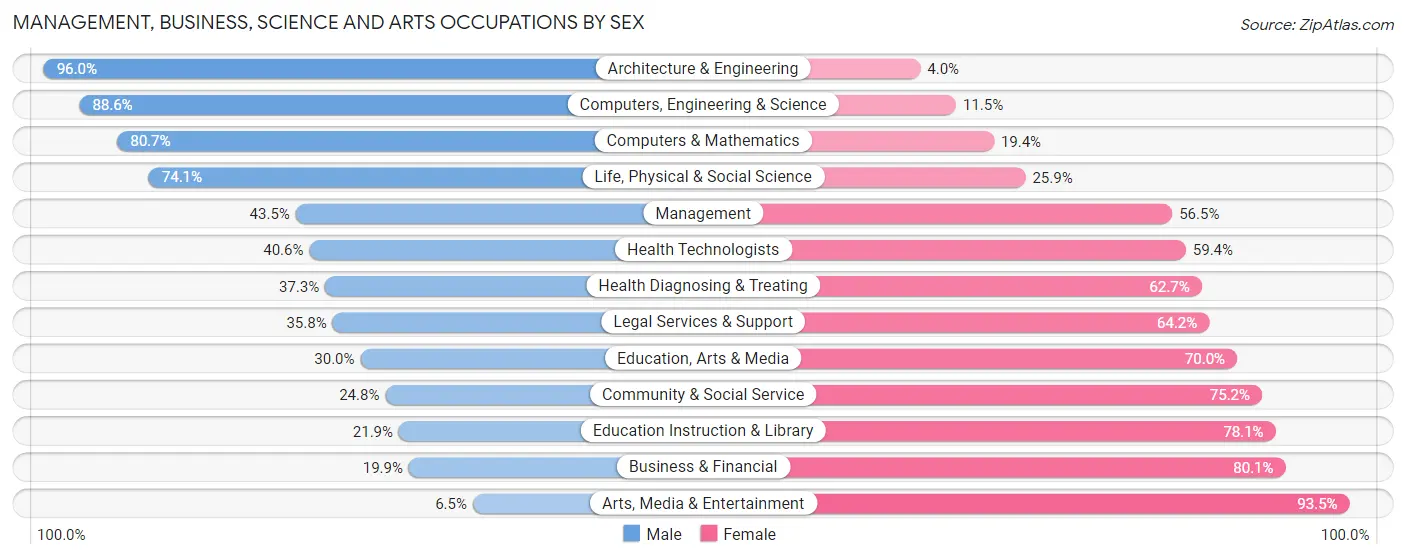
Management, Business, Science and Arts Occupations by Sex
Within the Management, Business, Science and Arts occupations in Loves Park, the most male-oriented occupations are Architecture & Engineering (96.0%), Computers, Engineering & Science (88.5%), and Computers & Mathematics (80.6%), while the most female-oriented occupations are Arts, Media & Entertainment (93.5%), Business & Financial (80.1%), and Education Instruction & Library (78.1%).
| Occupation | Male | Female |
| Management | 422 (43.5%) | 549 (56.5%) |
| Business & Financial | 85 (19.9%) | 343 (80.1%) |
| Computers, Engineering & Science | 410 (88.5%) | 53 (11.5%) |
| Computers & Mathematics | 150 (80.6%) | 36 (19.4%) |
| Architecture & Engineering | 240 (96.0%) | 10 (4.0%) |
| Life, Physical & Social Science | 20 (74.1%) | 7 (25.9%) |
| Community & Social Service | 291 (24.8%) | 884 (75.2%) |
| Education, Arts & Media | 68 (30.0%) | 159 (70.0%) |
| Legal Services & Support | 88 (35.8%) | 158 (64.2%) |
| Education Instruction & Library | 127 (21.9%) | 452 (78.1%) |
| Arts, Media & Entertainment | 8 (6.5%) | 115 (93.5%) |
| Health Diagnosing & Treating | 305 (37.3%) | 512 (62.7%) |
| Health Technologists | 240 (40.6%) | 351 (59.4%) |
| Total (Category) | 1,513 (39.3%) | 2,341 (60.7%) |
| Total (Overall) | 5,681 (50.6%) | 5,550 (49.4%) |
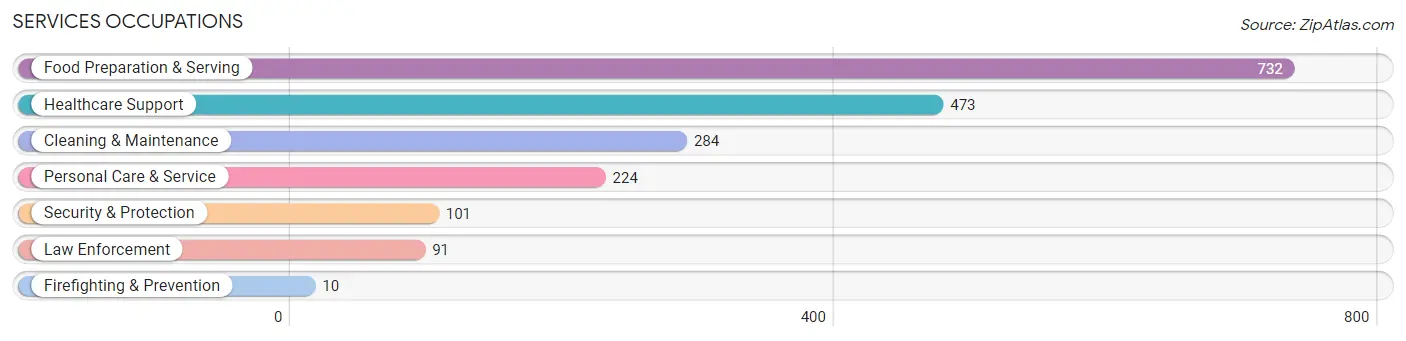
Services Occupations
The most common Services occupations in Loves Park are Food Preparation & Serving (732 | 6.5%), Healthcare Support (473 | 4.2%), Cleaning & Maintenance (284 | 2.5%), Personal Care & Service (224 | 2.0%), and Security & Protection (101 | 0.9%).
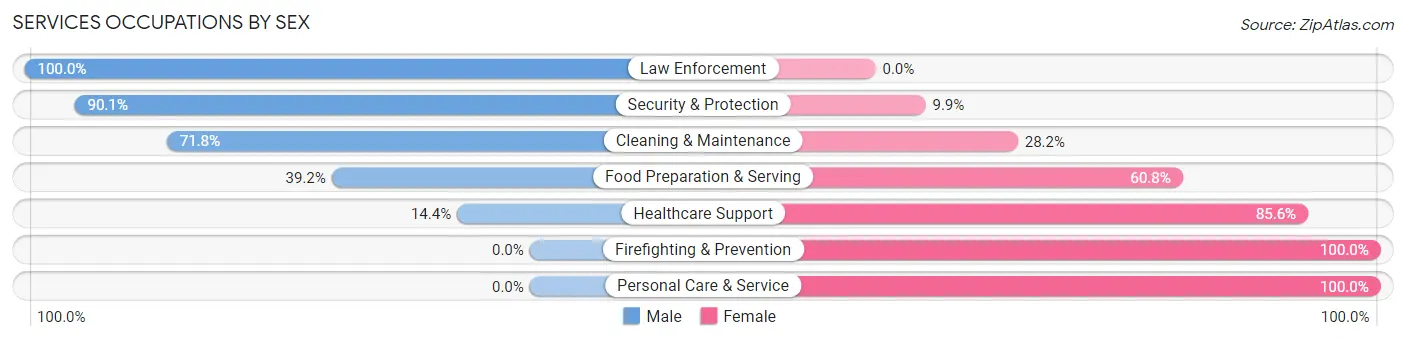
Services Occupations by Sex
Within the Services occupations in Loves Park, the most male-oriented occupations are Law Enforcement (100.0%), Security & Protection (90.1%), and Cleaning & Maintenance (71.8%), while the most female-oriented occupations are Firefighting & Prevention (100.0%), Personal Care & Service (100.0%), and Healthcare Support (85.6%).
| Occupation | Male | Female |
| Healthcare Support | 68 (14.4%) | 405 (85.6%) |
| Security & Protection | 91 (90.1%) | 10 (9.9%) |
| Firefighting & Prevention | 0 (0.0%) | 10 (100.0%) |
| Law Enforcement | 91 (100.0%) | 0 (0.0%) |
| Food Preparation & Serving | 287 (39.2%) | 445 (60.8%) |
| Cleaning & Maintenance | 204 (71.8%) | 80 (28.2%) |
| Personal Care & Service | 0 (0.0%) | 224 (100.0%) |
| Total (Category) | 650 (35.8%) | 1,164 (64.2%) |
| Total (Overall) | 5,681 (50.6%) | 5,550 (49.4%) |
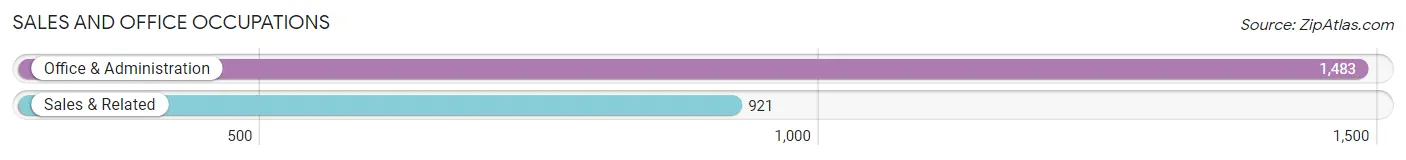
Sales and Office Occupations
The most common Sales and Office occupations in Loves Park are Office & Administration (1,483 | 13.2%), and Sales & Related (921 | 8.2%).
Sales and Office Occupations by Sex
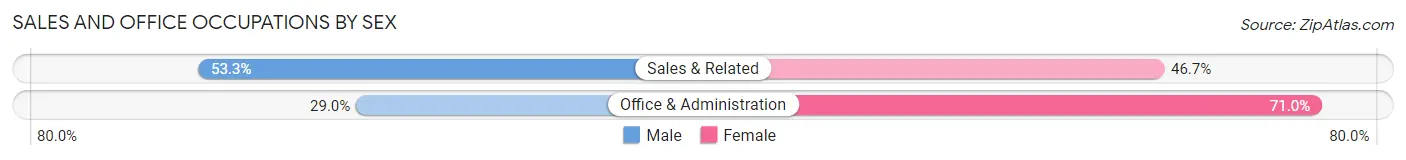
| Occupation | Male | Female |
| Sales & Related | 491 (53.3%) | 430 (46.7%) |
| Office & Administration | 430 (29.0%) | 1,053 (71.0%) |
| Total (Category) | 921 (38.3%) | 1,483 (61.7%) |
| Total (Overall) | 5,681 (50.6%) | 5,550 (49.4%) |
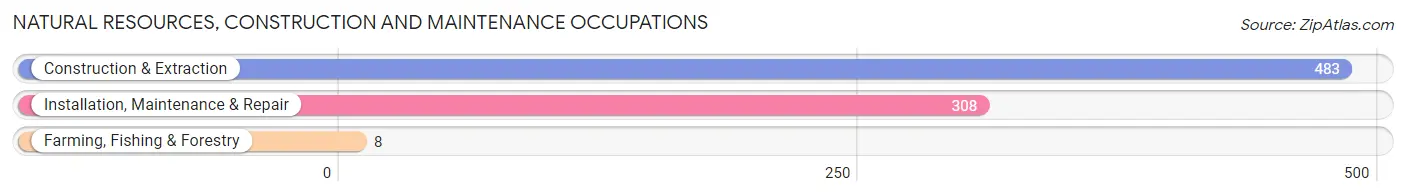
Natural Resources, Construction and Maintenance Occupations
The most common Natural Resources, Construction and Maintenance occupations in Loves Park are Construction & Extraction (483 | 4.3%), Installation, Maintenance & Repair (308 | 2.7%), and Farming, Fishing & Forestry (8 | 0.1%).
Natural Resources, Construction and Maintenance Occupations by Sex
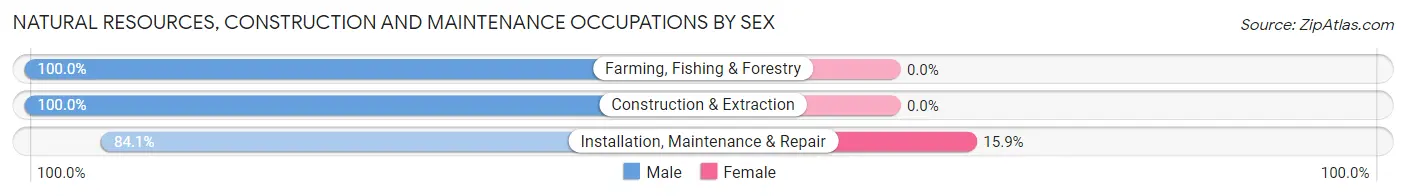
| Occupation | Male | Female |
| Farming, Fishing & Forestry | 8 (100.0%) | 0 (0.0%) |
| Construction & Extraction | 483 (100.0%) | 0 (0.0%) |
| Installation, Maintenance & Repair | 259 (84.1%) | 49 (15.9%) |
| Total (Category) | 750 (93.9%) | 49 (6.1%) |
| Total (Overall) | 5,681 (50.6%) | 5,550 (49.4%) |
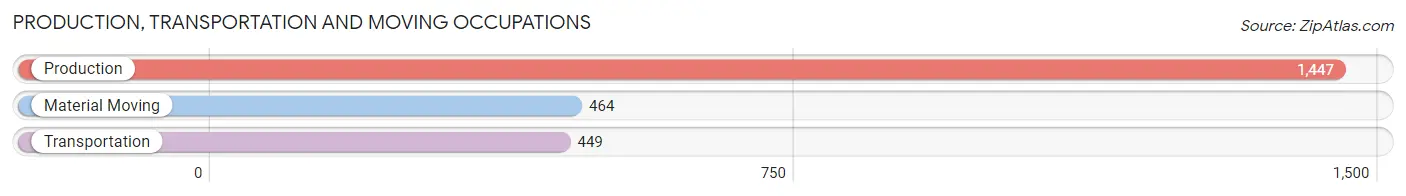
Production, Transportation and Moving Occupations
The most common Production, Transportation and Moving occupations in Loves Park are Production (1,447 | 12.9%), Material Moving (464 | 4.1%), and Transportation (449 | 4.0%).
Production, Transportation and Moving Occupations by Sex
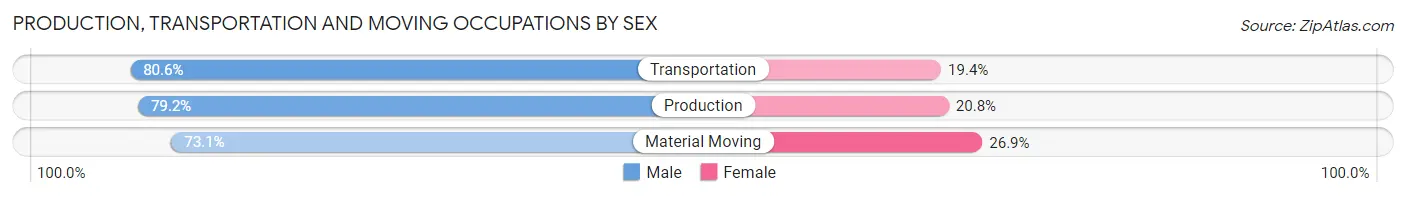
| Occupation | Male | Female |
| Production | 1,146 (79.2%) | 301 (20.8%) |
| Transportation | 362 (80.6%) | 87 (19.4%) |
| Material Moving | 339 (73.1%) | 125 (26.9%) |
| Total (Category) | 1,847 (78.3%) | 513 (21.7%) |
| Total (Overall) | 5,681 (50.6%) | 5,550 (49.4%) |
Employment Industries by Sex in Loves Park
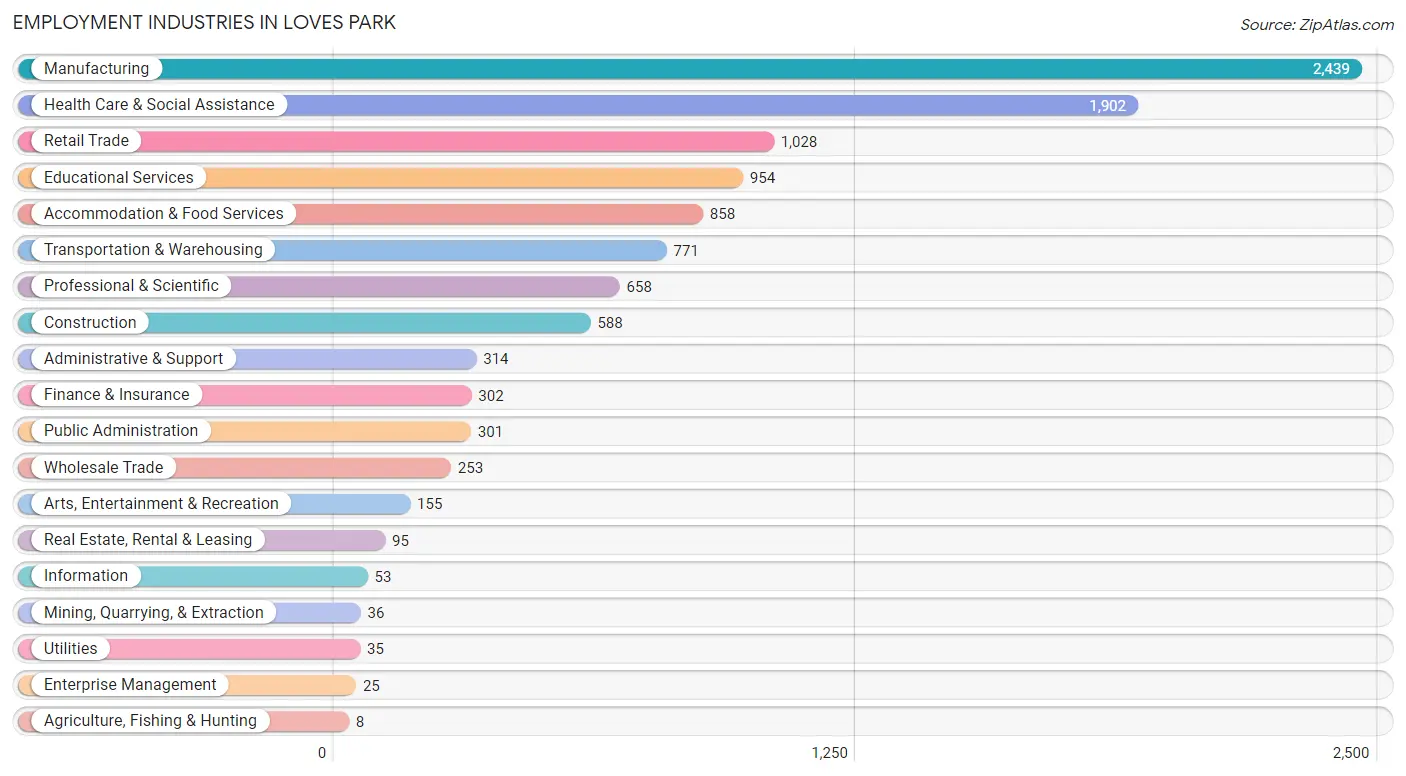
Employment Industries in Loves Park
The major employment industries in Loves Park include Manufacturing (2,439 | 21.7%), Health Care & Social Assistance (1,902 | 16.9%), Retail Trade (1,028 | 9.1%), Educational Services (954 | 8.5%), and Accommodation & Food Services (858 | 7.6%).
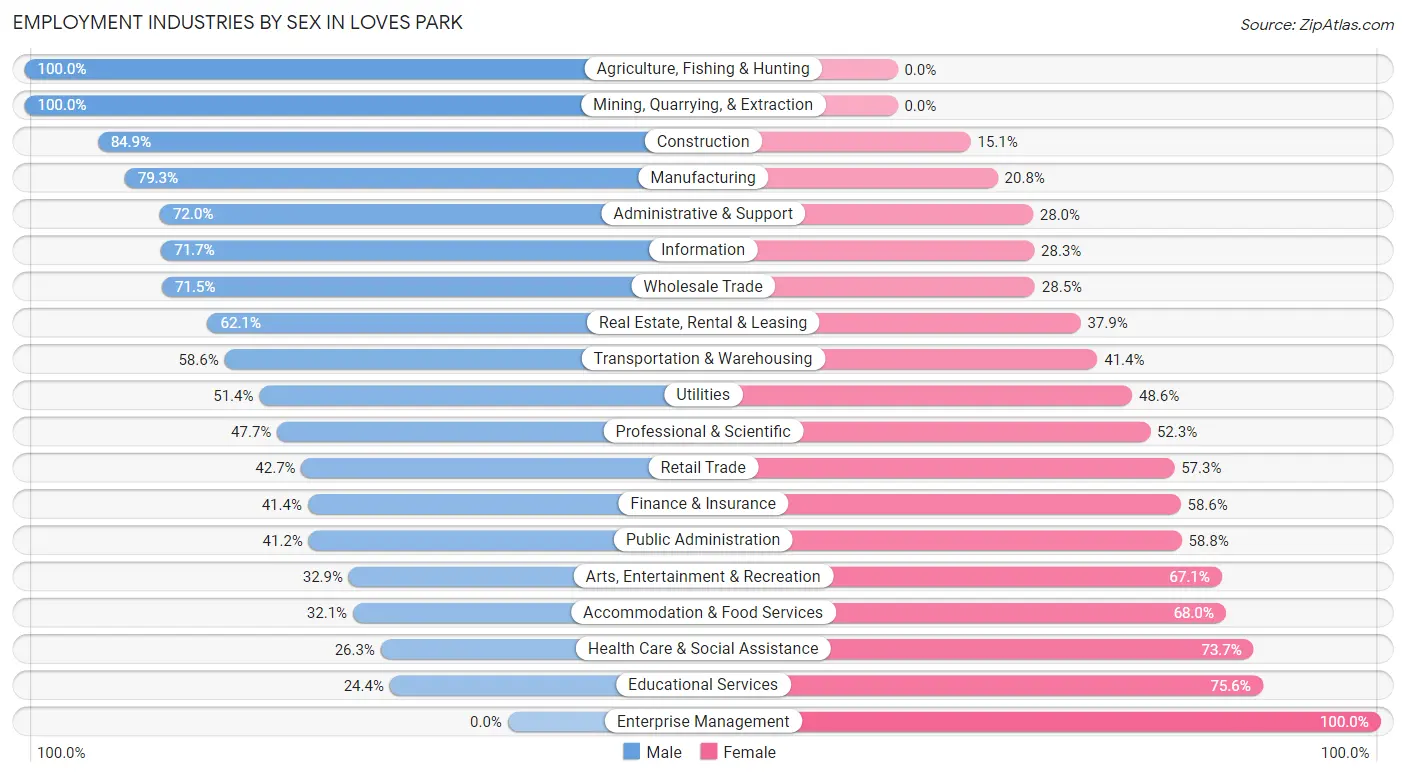
Employment Industries by Sex in Loves Park
The Loves Park industries that see more men than women are Agriculture, Fishing & Hunting (100.0%), Mining, Quarrying, & Extraction (100.0%), and Construction (84.9%), whereas the industries that tend to have a higher number of women are Enterprise Management (100.0%), Educational Services (75.6%), and Health Care & Social Assistance (73.7%).
| Industry | Male | Female |
| Agriculture, Fishing & Hunting | 8 (100.0%) | 0 (0.0%) |
| Mining, Quarrying, & Extraction | 36 (100.0%) | 0 (0.0%) |
| Construction | 499 (84.9%) | 89 (15.1%) |
| Manufacturing | 1,933 (79.2%) | 506 (20.7%) |
| Wholesale Trade | 181 (71.5%) | 72 (28.5%) |
| Retail Trade | 439 (42.7%) | 589 (57.3%) |
| Transportation & Warehousing | 452 (58.6%) | 319 (41.4%) |
| Utilities | 18 (51.4%) | 17 (48.6%) |
| Information | 38 (71.7%) | 15 (28.3%) |
| Finance & Insurance | 125 (41.4%) | 177 (58.6%) |
| Real Estate, Rental & Leasing | 59 (62.1%) | 36 (37.9%) |
| Professional & Scientific | 314 (47.7%) | 344 (52.3%) |
| Enterprise Management | 0 (0.0%) | 25 (100.0%) |
| Administrative & Support | 226 (72.0%) | 88 (28.0%) |
| Educational Services | 233 (24.4%) | 721 (75.6%) |
| Health Care & Social Assistance | 500 (26.3%) | 1,402 (73.7%) |
| Arts, Entertainment & Recreation | 51 (32.9%) | 104 (67.1%) |
| Accommodation & Food Services | 275 (32.1%) | 583 (67.9%) |
| Public Administration | 124 (41.2%) | 177 (58.8%) |
| Total | 5,681 (50.6%) | 5,550 (49.4%) |
Education in Loves Park
School Enrollment in Loves Park
The most common levels of schooling among the 4,503 students in Loves Park are middle school (1,114 | 24.7%), high school (959 | 21.3%), and college / undergraduate (863 | 19.2%).
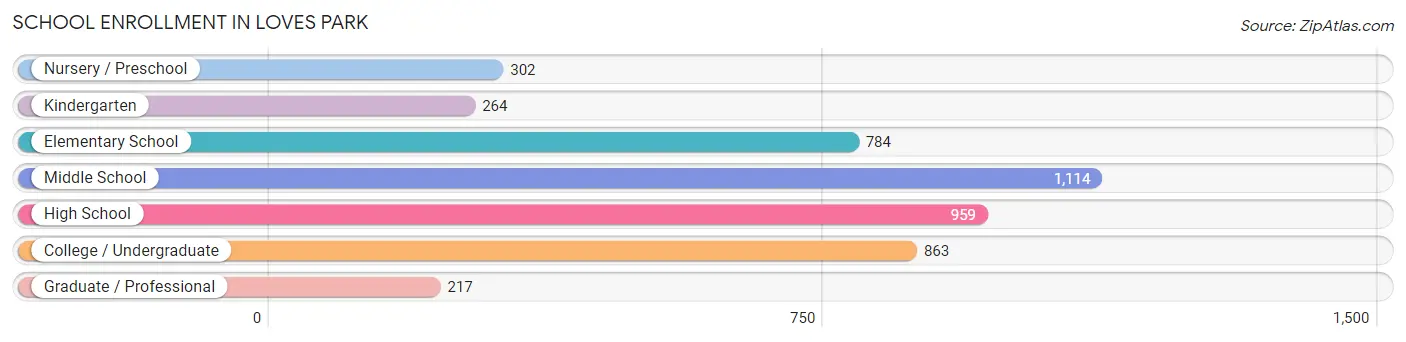
| School Level | # Students | % Students |
| Nursery / Preschool | 302 | 6.7% |
| Kindergarten | 264 | 5.9% |
| Elementary School | 784 | 17.4% |
| Middle School | 1,114 | 24.7% |
| High School | 959 | 21.3% |
| College / Undergraduate | 863 | 19.2% |
| Graduate / Professional | 217 | 4.8% |
| Total | 4,503 | 100.0% |
School Enrollment by Age by Funding Source in Loves Park
Out of a total of 4,503 students who are enrolled in schools in Loves Park, 1,040 (23.1%) attend a private institution, while the remaining 3,463 (76.9%) are enrolled in public schools. The age group of 35 years and over has the highest likelihood of being enrolled in private schools, with 197 (66.8% in the age bracket) enrolled. Conversely, the age group of 3 to 4 year olds has the lowest likelihood of being enrolled in a private school, with 214 (95.1% in the age bracket) attending a public institution.
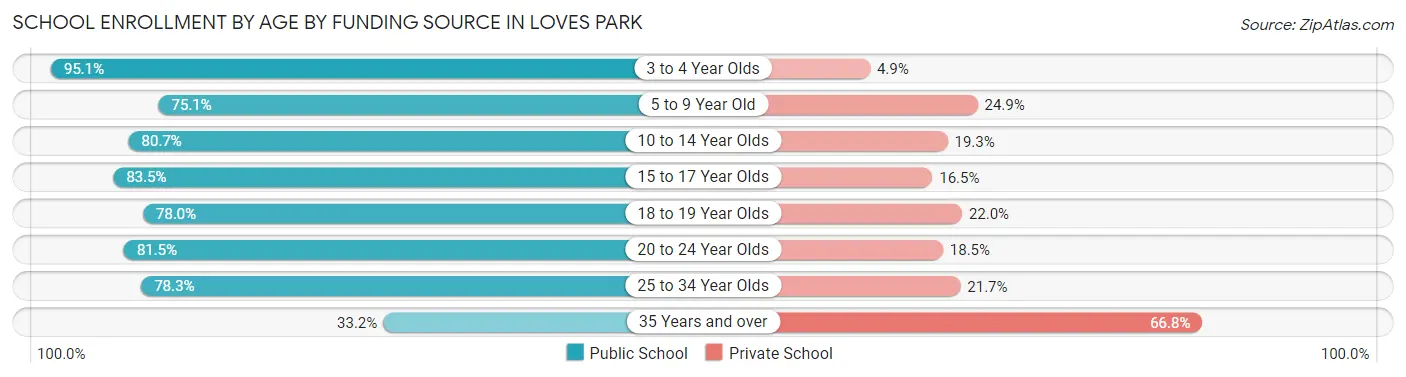
| Age Bracket | Public School | Private School |
| 3 to 4 Year Olds | 214 (95.1%) | 11 (4.9%) |
| 5 to 9 Year Old | 798 (75.1%) | 265 (24.9%) |
| 10 to 14 Year Olds | 1,047 (80.7%) | 251 (19.3%) |
| 15 to 17 Year Olds | 455 (83.5%) | 90 (16.5%) |
| 18 to 19 Year Olds | 276 (78.0%) | 78 (22.0%) |
| 20 to 24 Year Olds | 278 (81.5%) | 63 (18.5%) |
| 25 to 34 Year Olds | 299 (78.3%) | 83 (21.7%) |
| 35 Years and over | 98 (33.2%) | 197 (66.8%) |
| Total | 3,463 (76.9%) | 1,040 (23.1%) |
Educational Attainment by Field of Study in Loves Park
Business (747 | 17.7%), education (734 | 17.4%), science & technology (546 | 13.0%), psychology (386 | 9.2%), and arts & humanities (330 | 7.8%) are the most common fields of study among 4,210 individuals in Loves Park who have obtained a bachelor's degree or higher.
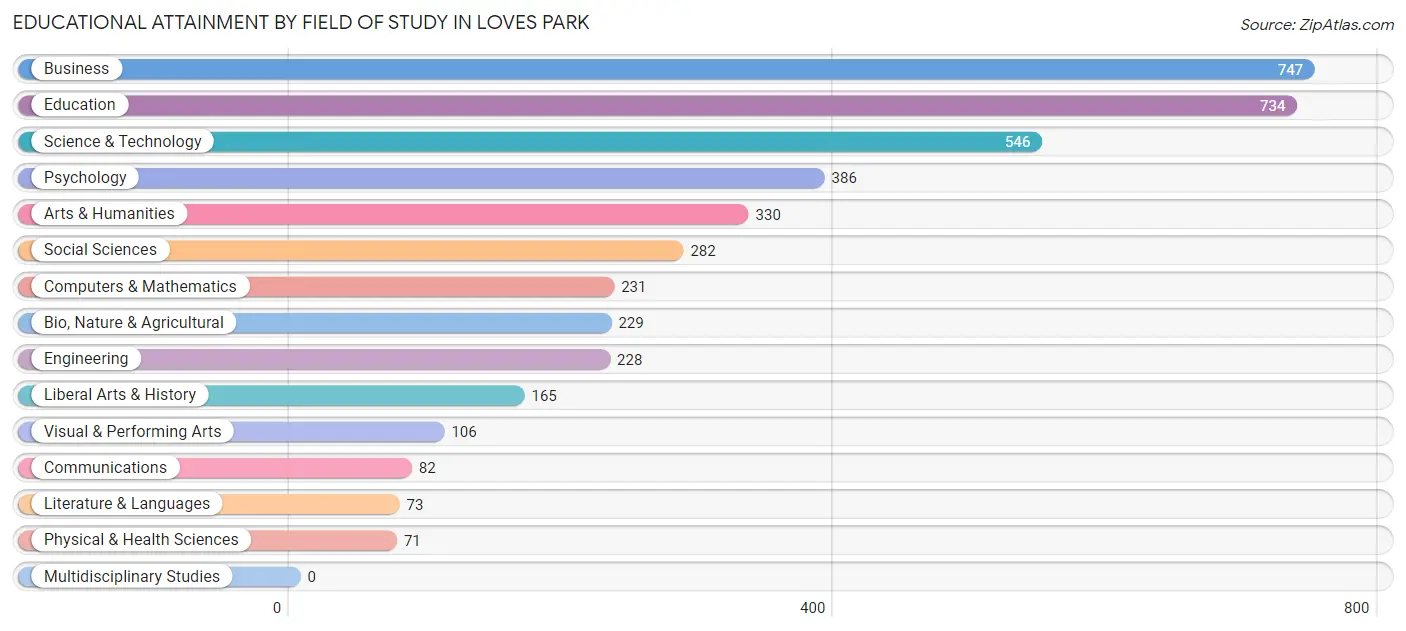
| Field of Study | # Graduates | % Graduates |
| Computers & Mathematics | 231 | 5.5% |
| Bio, Nature & Agricultural | 229 | 5.4% |
| Physical & Health Sciences | 71 | 1.7% |
| Psychology | 386 | 9.2% |
| Social Sciences | 282 | 6.7% |
| Engineering | 228 | 5.4% |
| Multidisciplinary Studies | 0 | 0.0% |
| Science & Technology | 546 | 13.0% |
| Business | 747 | 17.7% |
| Education | 734 | 17.4% |
| Literature & Languages | 73 | 1.7% |
| Liberal Arts & History | 165 | 3.9% |
| Visual & Performing Arts | 106 | 2.5% |
| Communications | 82 | 1.9% |
| Arts & Humanities | 330 | 7.8% |
| Total | 4,210 | 100.0% |
Transportation & Commute in Loves Park
Vehicle Availability by Sex in Loves Park
The most prevalent vehicle ownership categories in Loves Park are males with 2 vehicles (2,700, accounting for 48.4%) and females with 2 vehicles (2,719, making up 50.5%).
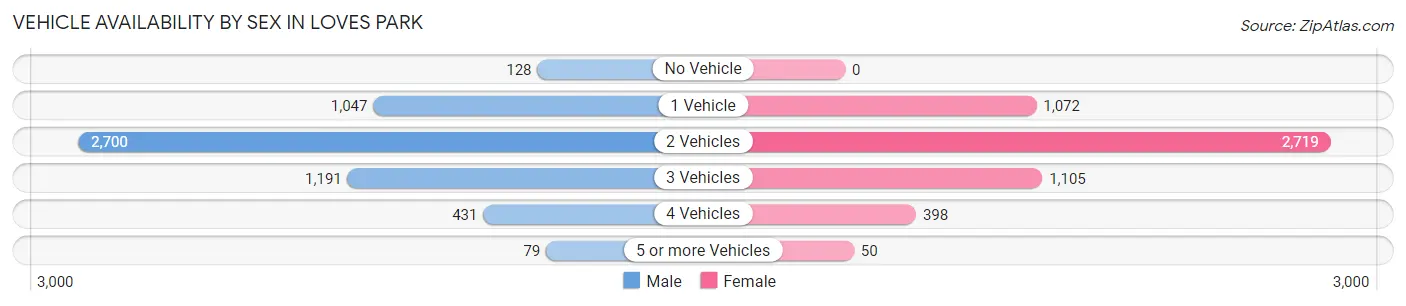
| Vehicles Available | Male | Female |
| No Vehicle | 128 (2.3%) | 0 (0.0%) |
| 1 Vehicle | 1,047 (18.8%) | 1,072 (20.1%) |
| 2 Vehicles | 2,700 (48.4%) | 2,719 (50.9%) |
| 3 Vehicles | 1,191 (21.4%) | 1,105 (20.7%) |
| 4 Vehicles | 431 (7.7%) | 398 (7.4%) |
| 5 or more Vehicles | 79 (1.4%) | 50 (0.9%) |
| Total | 5,576 (100.0%) | 5,344 (100.0%) |
Commute Time in Loves Park
The most frequently occuring commute durations in Loves Park are 20 to 24 minutes (1,999 commuters, 19.6%), 15 to 19 minutes (1,991 commuters, 19.5%), and 10 to 14 minutes (1,913 commuters, 18.7%).
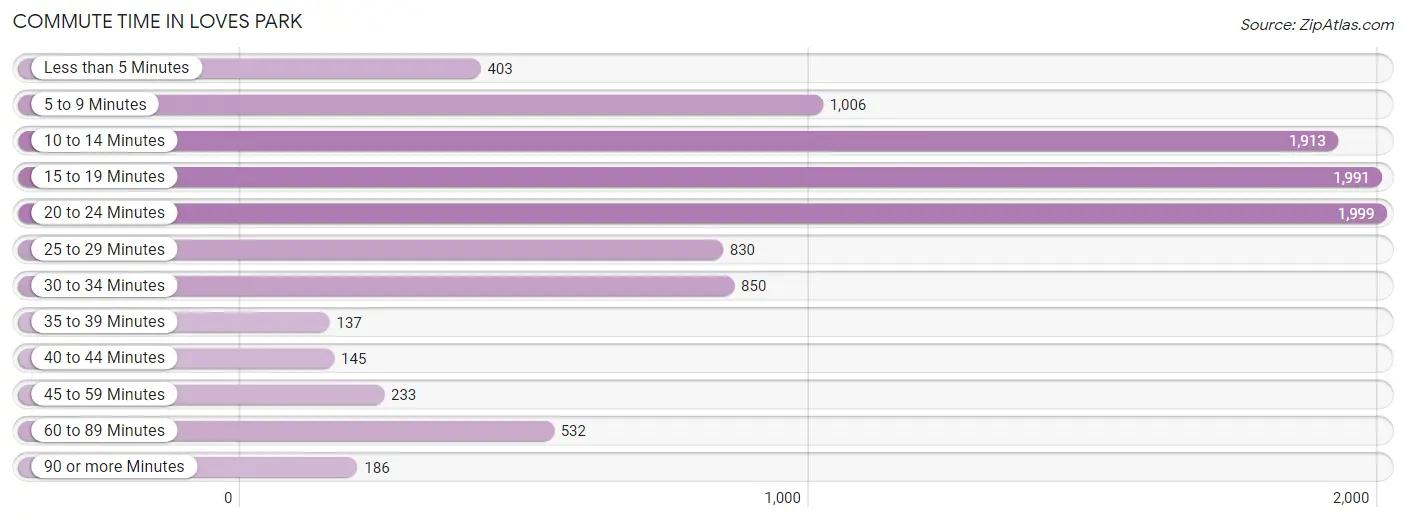
| Commute Time | # Commuters | % Commuters |
| Less than 5 Minutes | 403 | 3.9% |
| 5 to 9 Minutes | 1,006 | 9.8% |
| 10 to 14 Minutes | 1,913 | 18.7% |
| 15 to 19 Minutes | 1,991 | 19.5% |
| 20 to 24 Minutes | 1,999 | 19.6% |
| 25 to 29 Minutes | 830 | 8.1% |
| 30 to 34 Minutes | 850 | 8.3% |
| 35 to 39 Minutes | 137 | 1.3% |
| 40 to 44 Minutes | 145 | 1.4% |
| 45 to 59 Minutes | 233 | 2.3% |
| 60 to 89 Minutes | 532 | 5.2% |
| 90 or more Minutes | 186 | 1.8% |
Commute Time by Sex in Loves Park
The most common commute times in Loves Park are 20 to 24 minutes (930 commuters, 17.3%) for males and 10 to 14 minutes (1,193 commuters, 24.6%) for females.
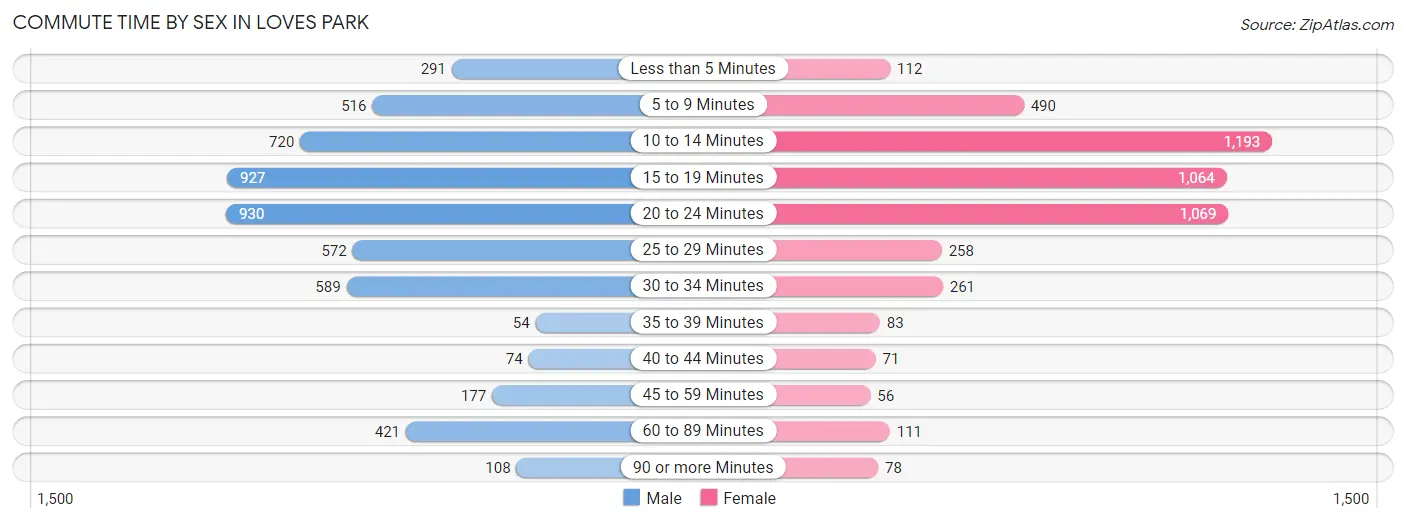
| Commute Time | Male | Female |
| Less than 5 Minutes | 291 (5.4%) | 112 (2.3%) |
| 5 to 9 Minutes | 516 (9.6%) | 490 (10.1%) |
| 10 to 14 Minutes | 720 (13.4%) | 1,193 (24.6%) |
| 15 to 19 Minutes | 927 (17.2%) | 1,064 (22.0%) |
| 20 to 24 Minutes | 930 (17.3%) | 1,069 (22.1%) |
| 25 to 29 Minutes | 572 (10.6%) | 258 (5.3%) |
| 30 to 34 Minutes | 589 (11.0%) | 261 (5.4%) |
| 35 to 39 Minutes | 54 (1.0%) | 83 (1.7%) |
| 40 to 44 Minutes | 74 (1.4%) | 71 (1.5%) |
| 45 to 59 Minutes | 177 (3.3%) | 56 (1.2%) |
| 60 to 89 Minutes | 421 (7.8%) | 111 (2.3%) |
| 90 or more Minutes | 108 (2.0%) | 78 (1.6%) |
Time of Departure to Work by Sex in Loves Park
The most frequent times of departure to work in Loves Park are 7:00 AM to 7:29 AM (705, 13.1%) for males and 7:00 AM to 7:29 AM (578, 11.9%) for females.
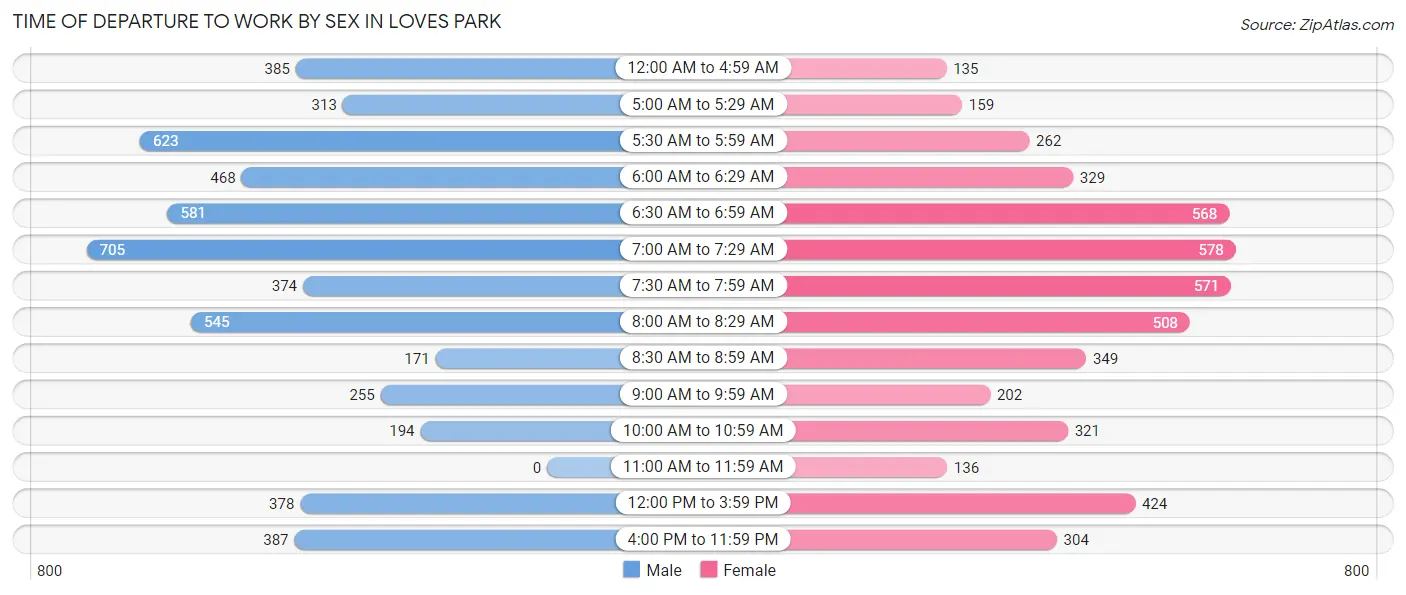
| Time of Departure | Male | Female |
| 12:00 AM to 4:59 AM | 385 (7.2%) | 135 (2.8%) |
| 5:00 AM to 5:29 AM | 313 (5.8%) | 159 (3.3%) |
| 5:30 AM to 5:59 AM | 623 (11.6%) | 262 (5.4%) |
| 6:00 AM to 6:29 AM | 468 (8.7%) | 329 (6.8%) |
| 6:30 AM to 6:59 AM | 581 (10.8%) | 568 (11.7%) |
| 7:00 AM to 7:29 AM | 705 (13.1%) | 578 (11.9%) |
| 7:30 AM to 7:59 AM | 374 (7.0%) | 571 (11.8%) |
| 8:00 AM to 8:29 AM | 545 (10.1%) | 508 (10.5%) |
| 8:30 AM to 8:59 AM | 171 (3.2%) | 349 (7.2%) |
| 9:00 AM to 9:59 AM | 255 (4.7%) | 202 (4.2%) |
| 10:00 AM to 10:59 AM | 194 (3.6%) | 321 (6.6%) |
| 11:00 AM to 11:59 AM | 0 (0.0%) | 136 (2.8%) |
| 12:00 PM to 3:59 PM | 378 (7.0%) | 424 (8.7%) |
| 4:00 PM to 11:59 PM | 387 (7.2%) | 304 (6.3%) |
| Total | 5,379 (100.0%) | 4,846 (100.0%) |
Housing Occupancy in Loves Park
Occupancy by Ownership in Loves Park
Of the total 9,705 dwellings in Loves Park, owner-occupied units account for 6,129 (63.1%), while renter-occupied units make up 3,576 (36.8%).
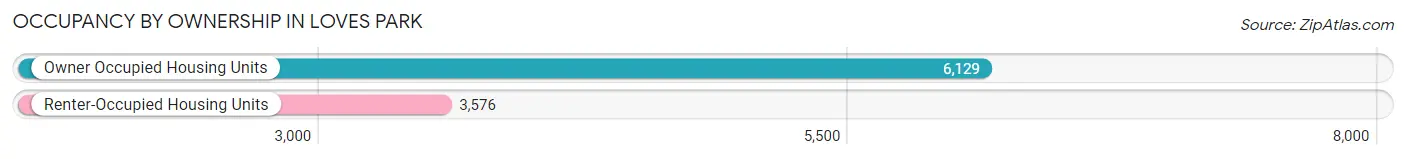
| Occupancy | # Housing Units | % Housing Units |
| Owner Occupied Housing Units | 6,129 | 63.1% |
| Renter-Occupied Housing Units | 3,576 | 36.8% |
| Total Occupied Housing Units | 9,705 | 100.0% |
Occupancy by Household Size in Loves Park
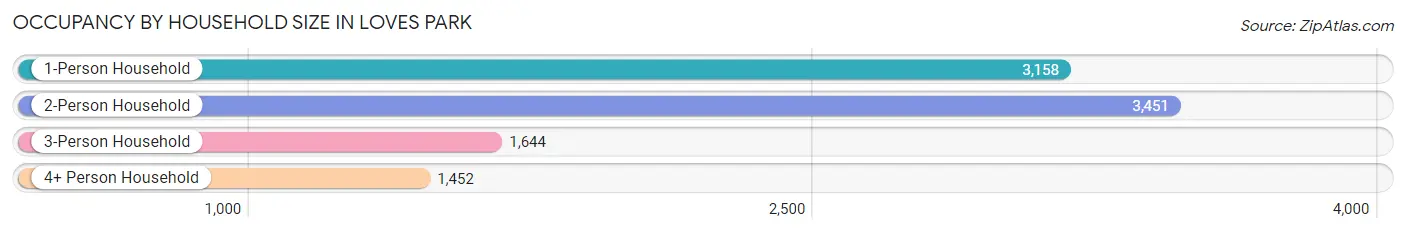
| Household Size | # Housing Units | % Housing Units |
| 1-Person Household | 3,158 | 32.5% |
| 2-Person Household | 3,451 | 35.6% |
| 3-Person Household | 1,644 | 16.9% |
| 4+ Person Household | 1,452 | 15.0% |
| Total Housing Units | 9,705 | 100.0% |
Occupancy by Ownership by Household Size in Loves Park
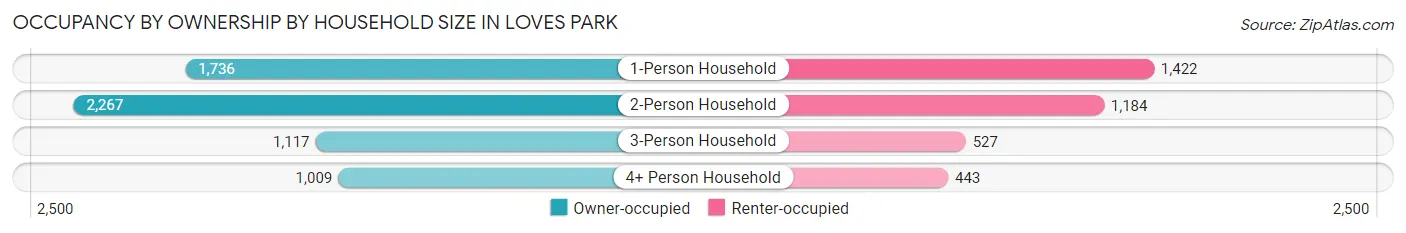
| Household Size | Owner-occupied | Renter-occupied |
| 1-Person Household | 1,736 (55.0%) | 1,422 (45.0%) |
| 2-Person Household | 2,267 (65.7%) | 1,184 (34.3%) |
| 3-Person Household | 1,117 (67.9%) | 527 (32.1%) |
| 4+ Person Household | 1,009 (69.5%) | 443 (30.5%) |
| Total Housing Units | 6,129 (63.1%) | 3,576 (36.8%) |
Occupancy by Educational Attainment in Loves Park
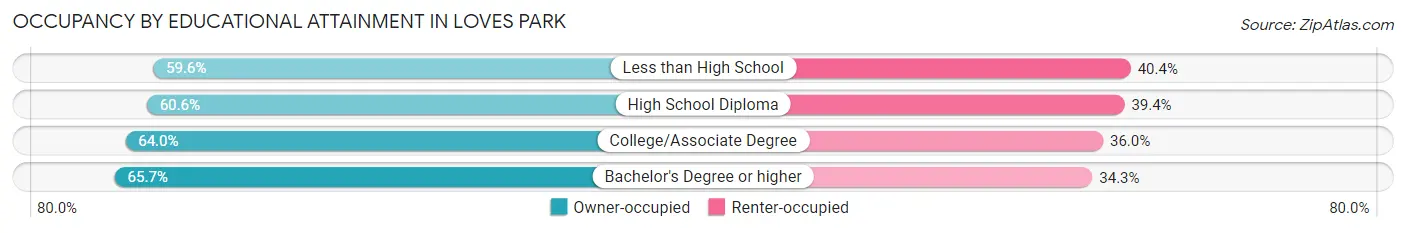
| Household Size | Owner-occupied | Renter-occupied |
| Less than High School | 434 (59.6%) | 294 (40.4%) |
| High School Diploma | 1,750 (60.6%) | 1,137 (39.4%) |
| College/Associate Degree | 2,155 (64.0%) | 1,211 (36.0%) |
| Bachelor's Degree or higher | 1,790 (65.7%) | 934 (34.3%) |
Occupancy by Age of Householder in Loves Park
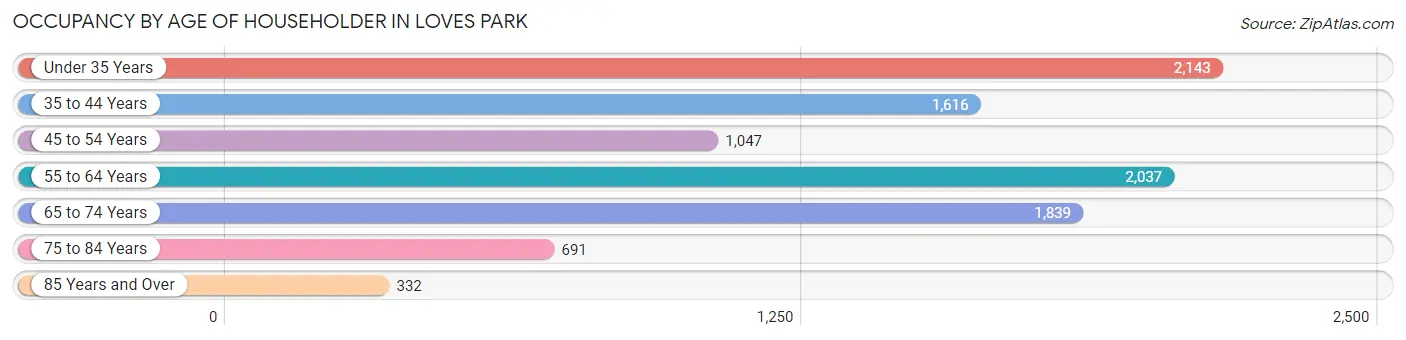
| Age Bracket | # Households | % Households |
| Under 35 Years | 2,143 | 22.1% |
| 35 to 44 Years | 1,616 | 16.7% |
| 45 to 54 Years | 1,047 | 10.8% |
| 55 to 64 Years | 2,037 | 21.0% |
| 65 to 74 Years | 1,839 | 19.0% |
| 75 to 84 Years | 691 | 7.1% |
| 85 Years and Over | 332 | 3.4% |
| Total | 9,705 | 100.0% |
Housing Finances in Loves Park
Median Income by Occupancy in Loves Park
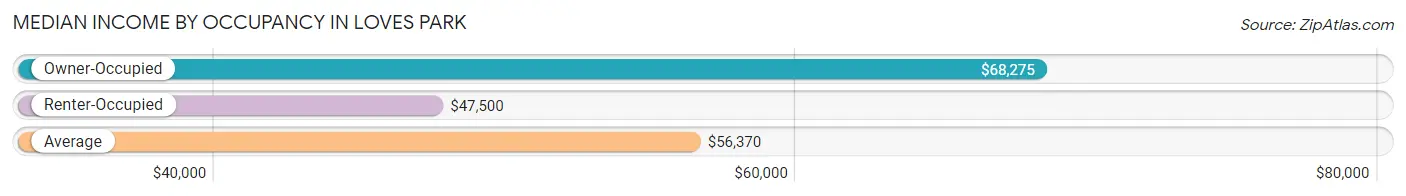
| Occupancy Type | # Households | Median Income |
| Owner-Occupied | 6,129 (63.1%) | $68,275 |
| Renter-Occupied | 3,576 (36.8%) | $47,500 |
| Average | 9,705 (100.0%) | $56,370 |
Occupancy by Householder Income Bracket in Loves Park
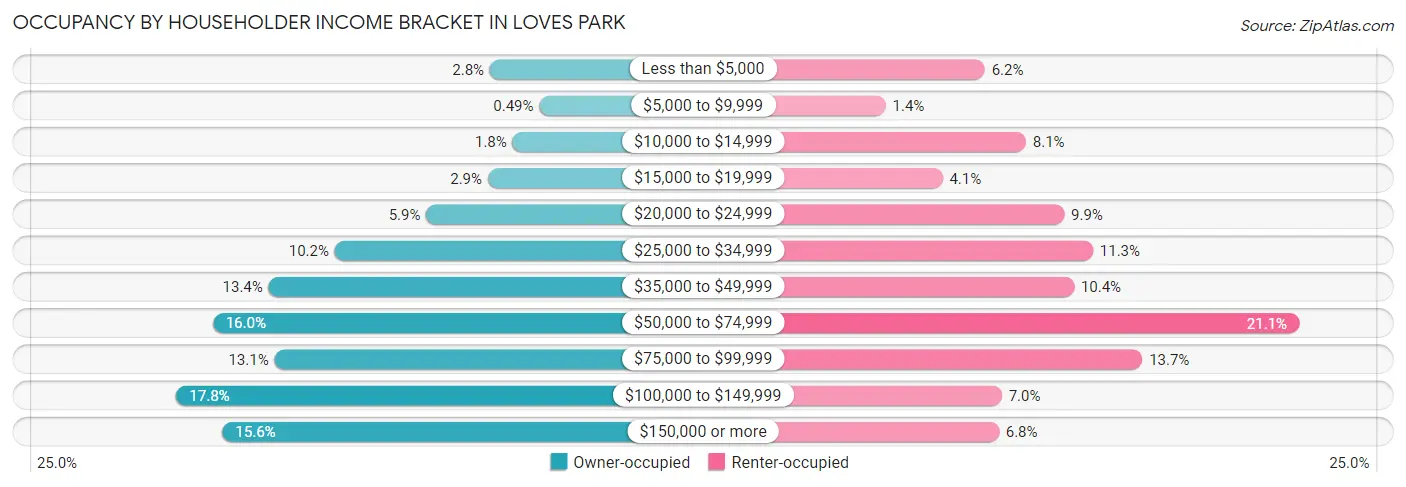
| Income Bracket | Owner-occupied | Renter-occupied |
| Less than $5,000 | 174 (2.8%) | 220 (6.1%) |
| $5,000 to $9,999 | 30 (0.5%) | 51 (1.4%) |
| $10,000 to $14,999 | 108 (1.8%) | 290 (8.1%) |
| $15,000 to $19,999 | 180 (2.9%) | 148 (4.1%) |
| $20,000 to $24,999 | 360 (5.9%) | 355 (9.9%) |
| $25,000 to $34,999 | 627 (10.2%) | 404 (11.3%) |
| $35,000 to $49,999 | 820 (13.4%) | 372 (10.4%) |
| $50,000 to $74,999 | 983 (16.0%) | 755 (21.1%) |
| $75,000 to $99,999 | 803 (13.1%) | 488 (13.7%) |
| $100,000 to $149,999 | 1,089 (17.8%) | 249 (7.0%) |
| $150,000 or more | 955 (15.6%) | 244 (6.8%) |
| Total | 6,129 (100.0%) | 3,576 (100.0%) |
Monthly Housing Cost Tiers in Loves Park
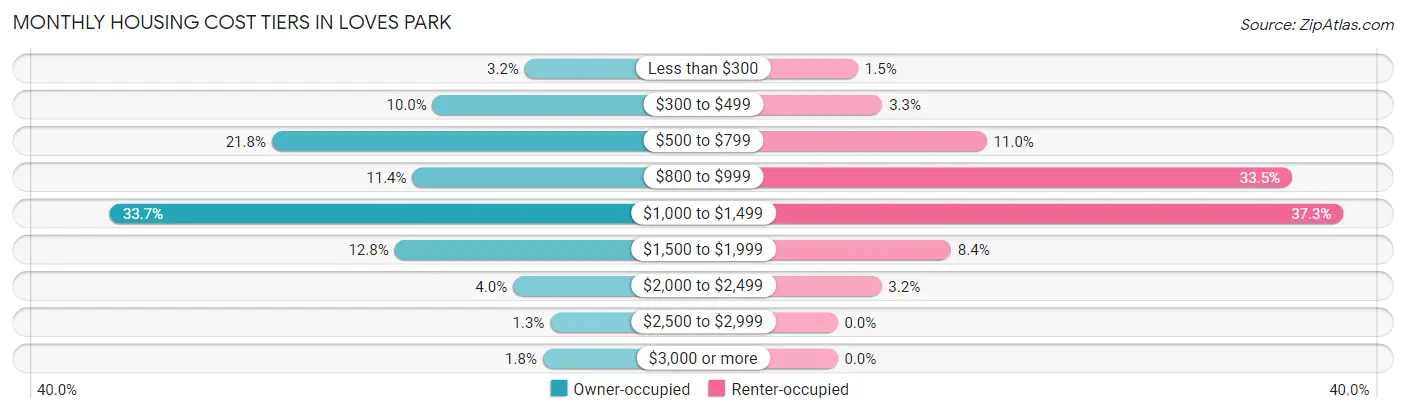
| Monthly Cost | Owner-occupied | Renter-occupied |
| Less than $300 | 194 (3.2%) | 54 (1.5%) |
| $300 to $499 | 610 (10.0%) | 118 (3.3%) |
| $500 to $799 | 1,336 (21.8%) | 393 (11.0%) |
| $800 to $999 | 701 (11.4%) | 1,197 (33.5%) |
| $1,000 to $1,499 | 2,067 (33.7%) | 1,332 (37.2%) |
| $1,500 to $1,999 | 782 (12.8%) | 299 (8.4%) |
| $2,000 to $2,499 | 247 (4.0%) | 116 (3.2%) |
| $2,500 to $2,999 | 79 (1.3%) | 0 (0.0%) |
| $3,000 or more | 113 (1.8%) | 0 (0.0%) |
| Total | 6,129 (100.0%) | 3,576 (100.0%) |
Physical Housing Characteristics in Loves Park
Housing Structures in Loves Park
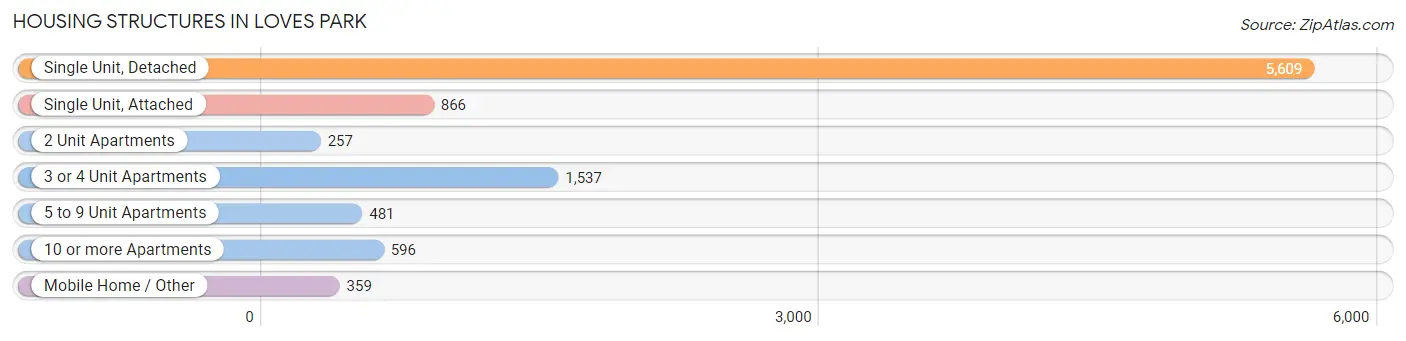
| Structure Type | # Housing Units | % Housing Units |
| Single Unit, Detached | 5,609 | 57.8% |
| Single Unit, Attached | 866 | 8.9% |
| 2 Unit Apartments | 257 | 2.6% |
| 3 or 4 Unit Apartments | 1,537 | 15.8% |
| 5 to 9 Unit Apartments | 481 | 5.0% |
| 10 or more Apartments | 596 | 6.1% |
| Mobile Home / Other | 359 | 3.7% |
| Total | 9,705 | 100.0% |
Housing Structures by Occupancy in Loves Park
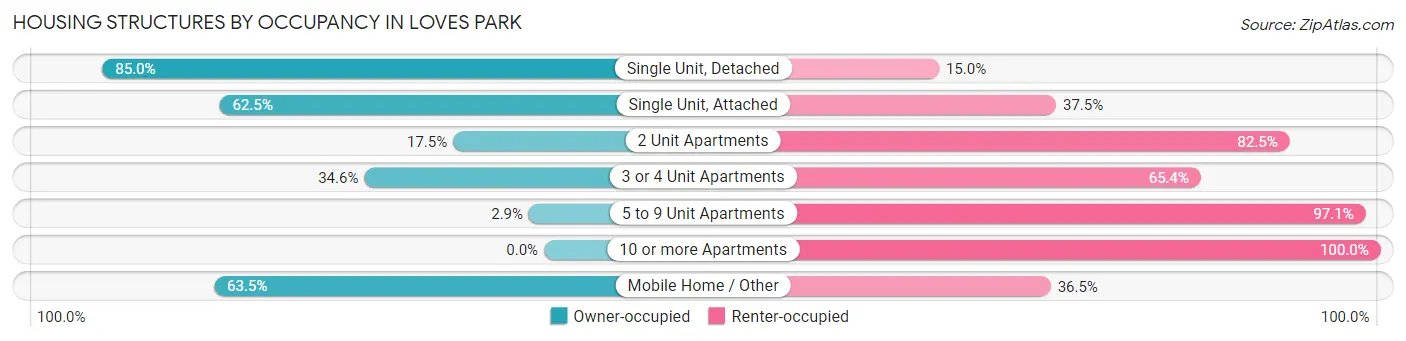
| Structure Type | Owner-occupied | Renter-occupied |
| Single Unit, Detached | 4,769 (85.0%) | 840 (15.0%) |
| Single Unit, Attached | 541 (62.5%) | 325 (37.5%) |
| 2 Unit Apartments | 45 (17.5%) | 212 (82.5%) |
| 3 or 4 Unit Apartments | 532 (34.6%) | 1,005 (65.4%) |
| 5 to 9 Unit Apartments | 14 (2.9%) | 467 (97.1%) |
| 10 or more Apartments | 0 (0.0%) | 596 (100.0%) |
| Mobile Home / Other | 228 (63.5%) | 131 (36.5%) |
| Total | 6,129 (63.1%) | 3,576 (36.8%) |
Housing Structures by Number of Rooms in Loves Park
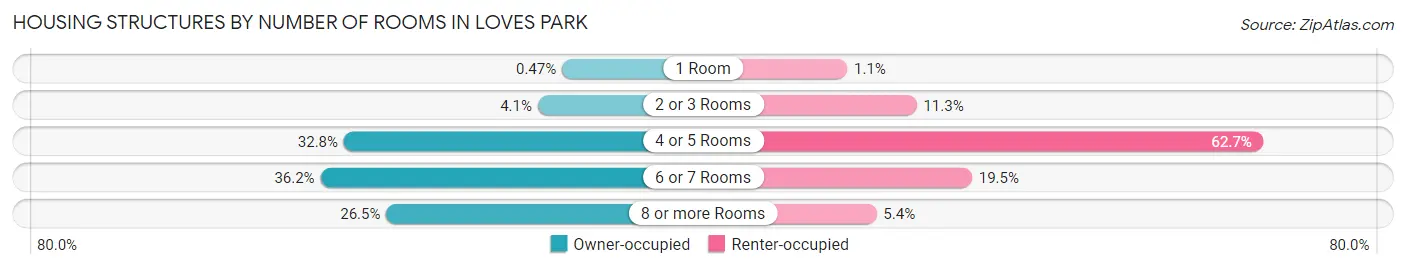
| Number of Rooms | Owner-occupied | Renter-occupied |
| 1 Room | 29 (0.5%) | 38 (1.1%) |
| 2 or 3 Rooms | 249 (4.1%) | 405 (11.3%) |
| 4 or 5 Rooms | 2,008 (32.8%) | 2,242 (62.7%) |
| 6 or 7 Rooms | 2,220 (36.2%) | 698 (19.5%) |
| 8 or more Rooms | 1,623 (26.5%) | 193 (5.4%) |
| Total | 6,129 (100.0%) | 3,576 (100.0%) |
Housing Structure by Heating Type in Loves Park
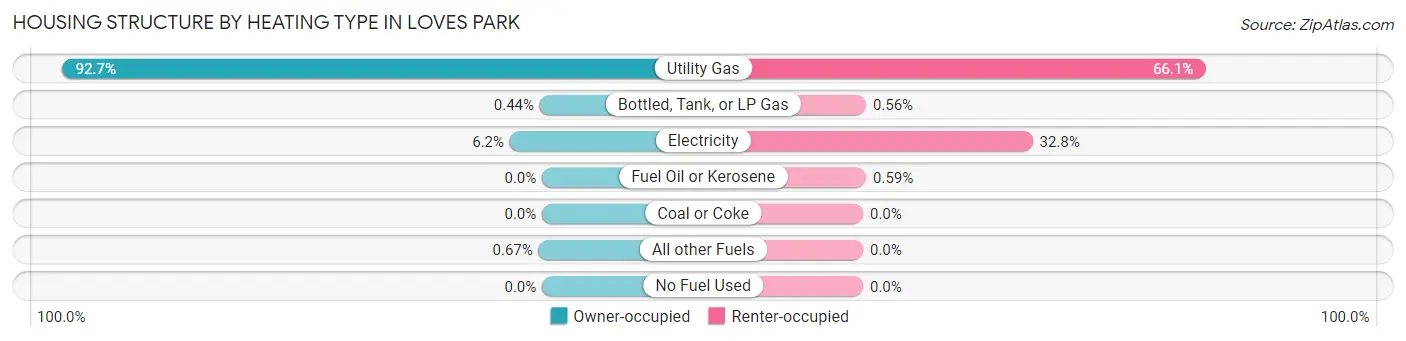
| Heating Type | Owner-occupied | Renter-occupied |
| Utility Gas | 5,679 (92.7%) | 2,364 (66.1%) |
| Bottled, Tank, or LP Gas | 27 (0.4%) | 20 (0.6%) |
| Electricity | 382 (6.2%) | 1,171 (32.8%) |
| Fuel Oil or Kerosene | 0 (0.0%) | 21 (0.6%) |
| Coal or Coke | 0 (0.0%) | 0 (0.0%) |
| All other Fuels | 41 (0.7%) | 0 (0.0%) |
| No Fuel Used | 0 (0.0%) | 0 (0.0%) |
| Total | 6,129 (100.0%) | 3,576 (100.0%) |
Household Vehicle Usage in Loves Park
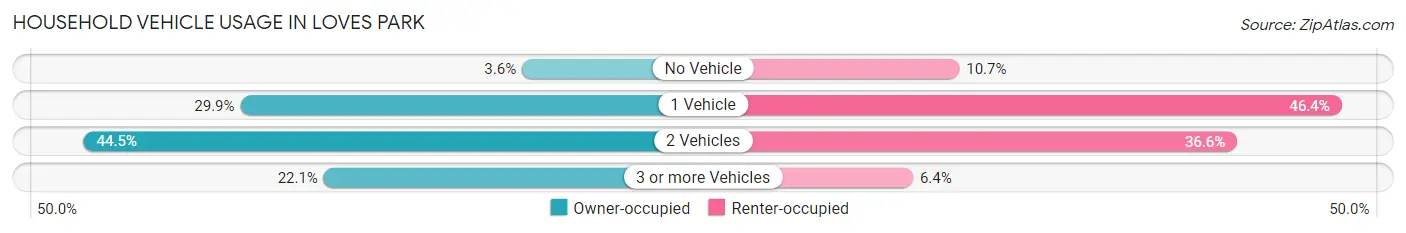
| Vehicles per Household | Owner-occupied | Renter-occupied |
| No Vehicle | 219 (3.6%) | 382 (10.7%) |
| 1 Vehicle | 1,830 (29.9%) | 1,658 (46.4%) |
| 2 Vehicles | 2,727 (44.5%) | 1,309 (36.6%) |
| 3 or more Vehicles | 1,353 (22.1%) | 227 (6.4%) |
| Total | 6,129 (100.0%) | 3,576 (100.0%) |
Real Estate & Mortgages in Loves Park
Real Estate and Mortgage Overview in Loves Park
| Characteristic | Without Mortgage | With Mortgage |
| Housing Units | 2,242 | 3,887 |
| Median Property Value | $121,900 | $148,600 |
| Median Household Income | $46,557 | $794 |
| Monthly Housing Costs | $578 | $88 |
| Real Estate Taxes | $2,822 | $45 |
Property Value by Mortgage Status in Loves Park
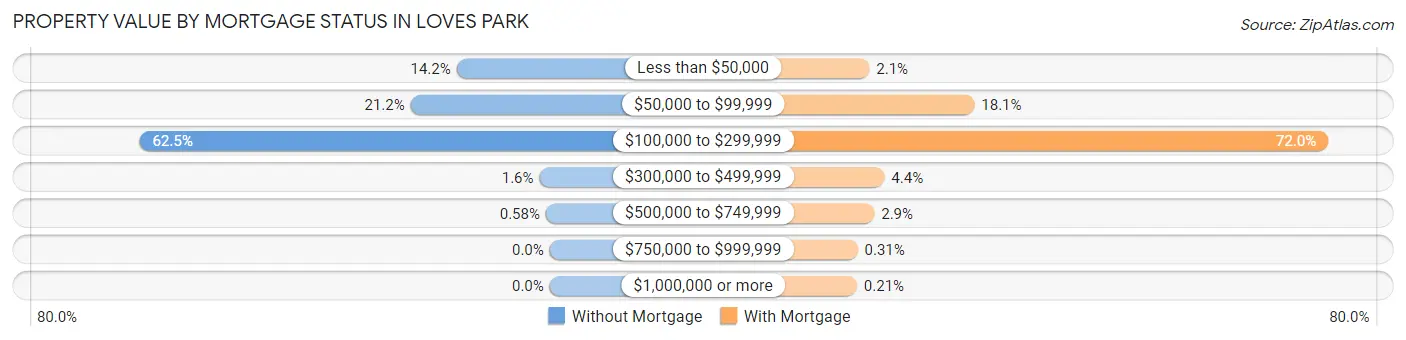
| Property Value | Without Mortgage | With Mortgage |
| Less than $50,000 | 318 (14.2%) | 82 (2.1%) |
| $50,000 to $99,999 | 475 (21.2%) | 704 (18.1%) |
| $100,000 to $299,999 | 1,401 (62.5%) | 2,799 (72.0%) |
| $300,000 to $499,999 | 35 (1.6%) | 171 (4.4%) |
| $500,000 to $749,999 | 13 (0.6%) | 111 (2.9%) |
| $750,000 to $999,999 | 0 (0.0%) | 12 (0.3%) |
| $1,000,000 or more | 0 (0.0%) | 8 (0.2%) |
| Total | 2,242 (100.0%) | 3,887 (100.0%) |
Household Income by Mortgage Status in Loves Park
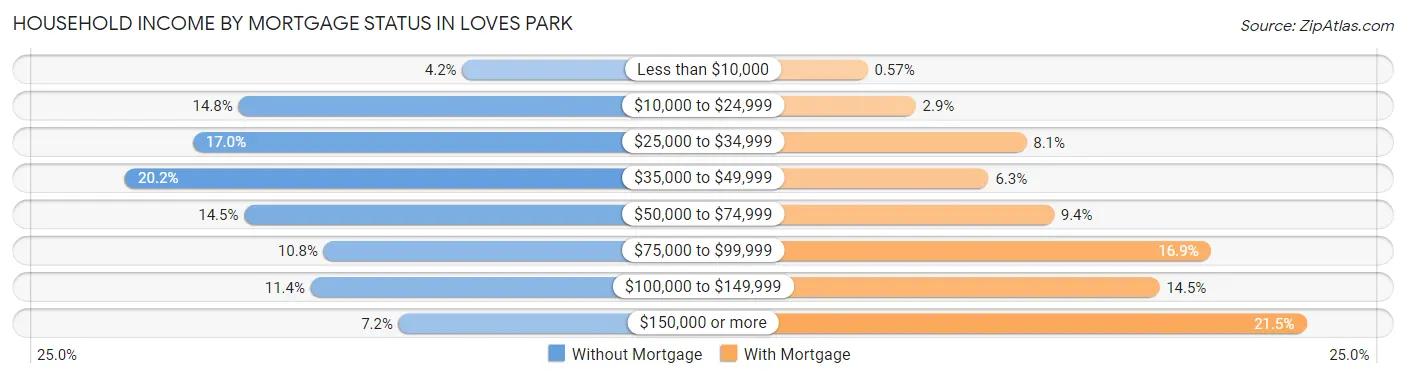
| Household Income | Without Mortgage | With Mortgage |
| Less than $10,000 | 93 (4.2%) | 22 (0.6%) |
| $10,000 to $24,999 | 332 (14.8%) | 111 (2.9%) |
| $25,000 to $34,999 | 381 (17.0%) | 316 (8.1%) |
| $35,000 to $49,999 | 453 (20.2%) | 246 (6.3%) |
| $50,000 to $74,999 | 326 (14.5%) | 367 (9.4%) |
| $75,000 to $99,999 | 241 (10.7%) | 657 (16.9%) |
| $100,000 to $149,999 | 255 (11.4%) | 562 (14.5%) |
| $150,000 or more | 161 (7.2%) | 834 (21.5%) |
| Total | 2,242 (100.0%) | 3,887 (100.0%) |
Property Value to Household Income Ratio in Loves Park
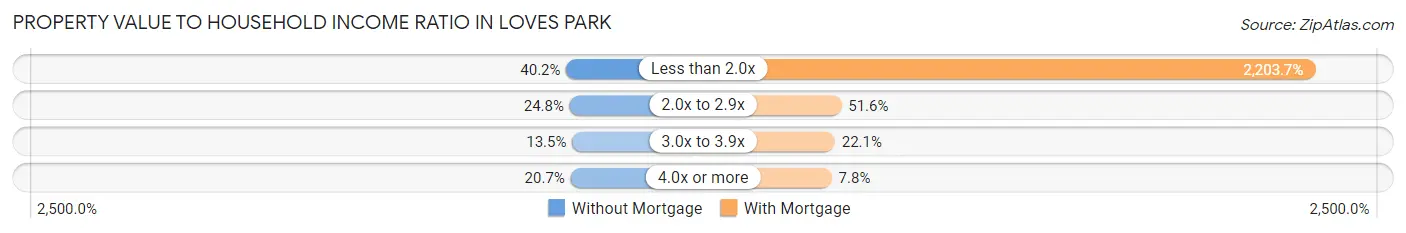
| Value-to-Income Ratio | Without Mortgage | With Mortgage |
| Less than 2.0x | 902 (40.2%) | 85,657 (2,203.7%) |
| 2.0x to 2.9x | 556 (24.8%) | 2,005 (51.6%) |
| 3.0x to 3.9x | 302 (13.5%) | 860 (22.1%) |
| 4.0x or more | 465 (20.7%) | 304 (7.8%) |
| Total | 2,242 (100.0%) | 3,887 (100.0%) |
Real Estate Taxes by Mortgage Status in Loves Park
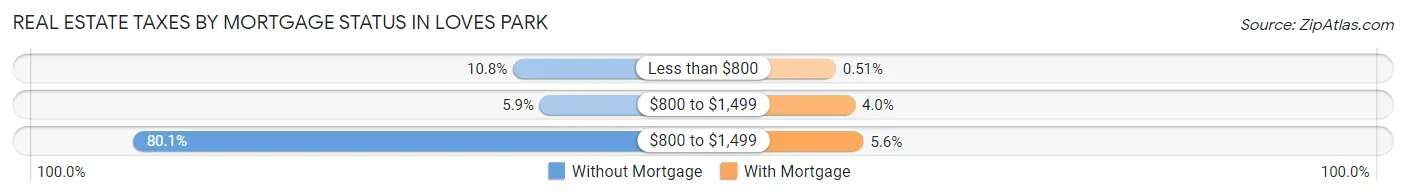
| Property Taxes | Without Mortgage | With Mortgage |
| Less than $800 | 242 (10.8%) | 20 (0.5%) |
| $800 to $1,499 | 132 (5.9%) | 156 (4.0%) |
| $800 to $1,499 | 1,795 (80.1%) | 216 (5.6%) |
| Total | 2,242 (100.0%) | 3,887 (100.0%) |
Health & Disability in Loves Park
Health Insurance Coverage by Age in Loves Park
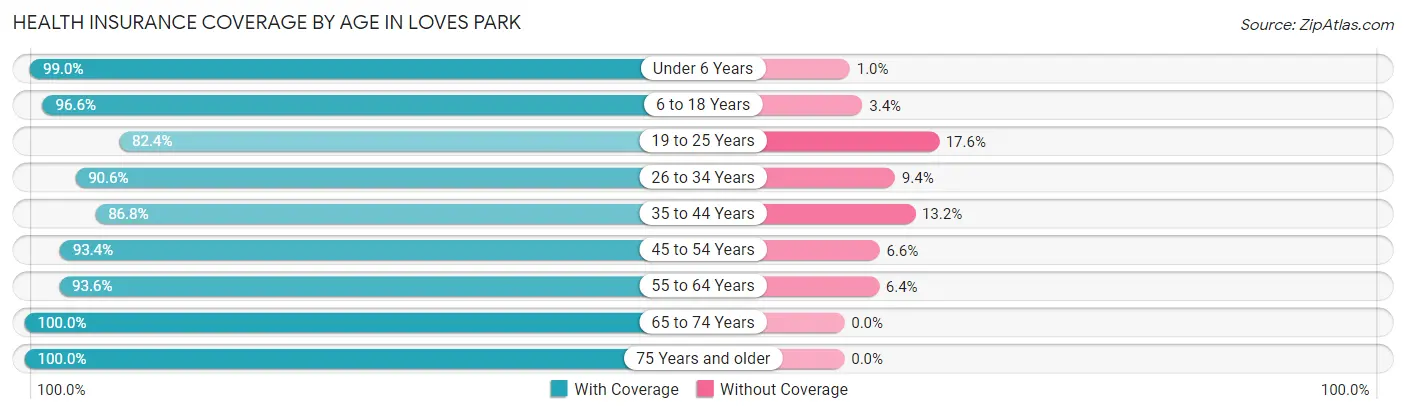
| Age Bracket | With Coverage | Without Coverage |
| Under 6 Years | 1,840 (99.0%) | 19 (1.0%) |
| 6 to 18 Years | 3,127 (96.6%) | 109 (3.4%) |
| 19 to 25 Years | 2,100 (82.4%) | 449 (17.6%) |
| 26 to 34 Years | 2,840 (90.6%) | 296 (9.4%) |
| 35 to 44 Years | 2,253 (86.8%) | 342 (13.2%) |
| 45 to 54 Years | 1,835 (93.4%) | 129 (6.6%) |
| 55 to 64 Years | 3,168 (93.6%) | 218 (6.4%) |
| 65 to 74 Years | 2,588 (100.0%) | 0 (0.0%) |
| 75 Years and older | 1,477 (100.0%) | 0 (0.0%) |
| Total | 21,228 (93.1%) | 1,562 (6.9%) |
Health Insurance Coverage by Citizenship Status in Loves Park
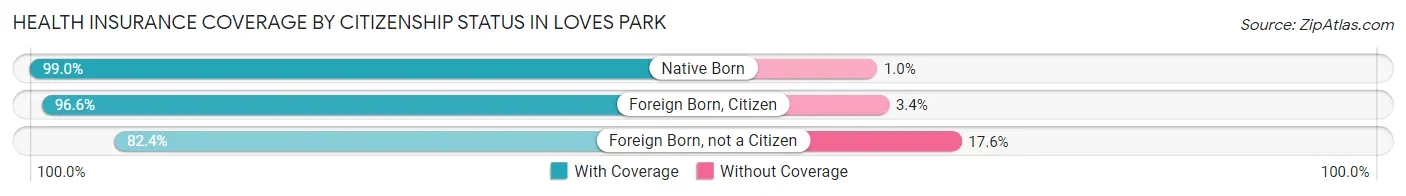
| Citizenship Status | With Coverage | Without Coverage |
| Native Born | 1,840 (99.0%) | 19 (1.0%) |
| Foreign Born, Citizen | 3,127 (96.6%) | 109 (3.4%) |
| Foreign Born, not a Citizen | 2,100 (82.4%) | 449 (17.6%) |
Health Insurance Coverage by Household Income in Loves Park
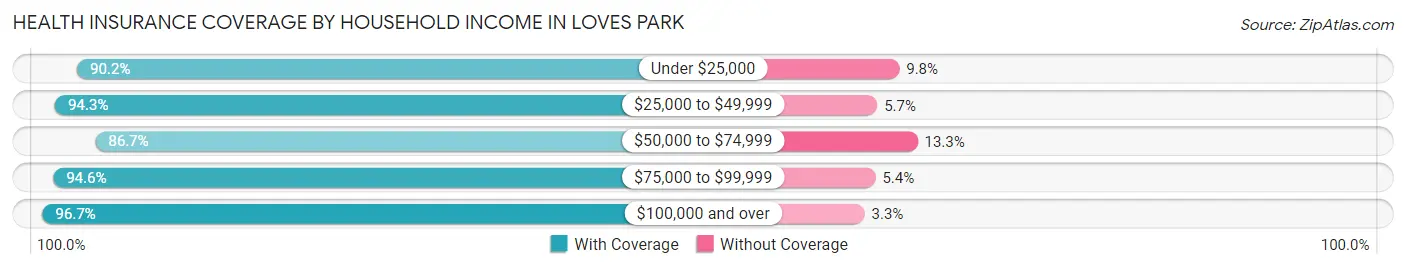
| Household Income | With Coverage | Without Coverage |
| Under $25,000 | 3,220 (90.2%) | 351 (9.8%) |
| $25,000 to $49,999 | 4,331 (94.3%) | 262 (5.7%) |
| $50,000 to $74,999 | 3,460 (86.7%) | 529 (13.3%) |
| $75,000 to $99,999 | 3,031 (94.6%) | 172 (5.4%) |
| $100,000 and over | 7,169 (96.7%) | 248 (3.3%) |
Public vs Private Health Insurance Coverage by Age in Loves Park
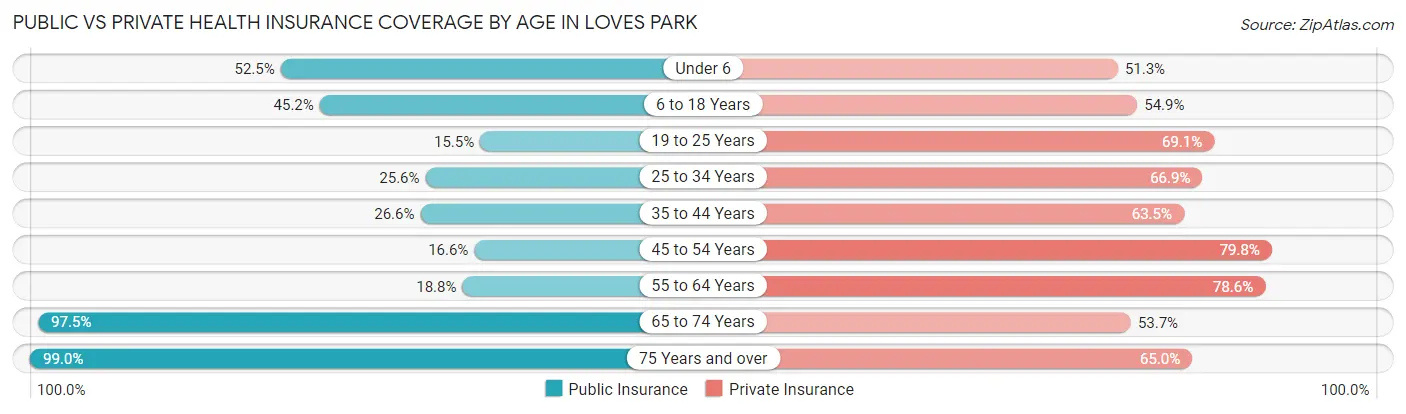
| Age Bracket | Public Insurance | Private Insurance |
| Under 6 | 976 (52.5%) | 953 (51.3%) |
| 6 to 18 Years | 1,464 (45.2%) | 1,775 (54.8%) |
| 19 to 25 Years | 394 (15.5%) | 1,761 (69.1%) |
| 25 to 34 Years | 803 (25.6%) | 2,098 (66.9%) |
| 35 to 44 Years | 689 (26.6%) | 1,647 (63.5%) |
| 45 to 54 Years | 325 (16.6%) | 1,567 (79.8%) |
| 55 to 64 Years | 635 (18.8%) | 2,660 (78.6%) |
| 65 to 74 Years | 2,523 (97.5%) | 1,389 (53.7%) |
| 75 Years and over | 1,462 (99.0%) | 960 (65.0%) |
| Total | 9,271 (40.7%) | 14,810 (65.0%) |
Disability Status by Sex by Age in Loves Park
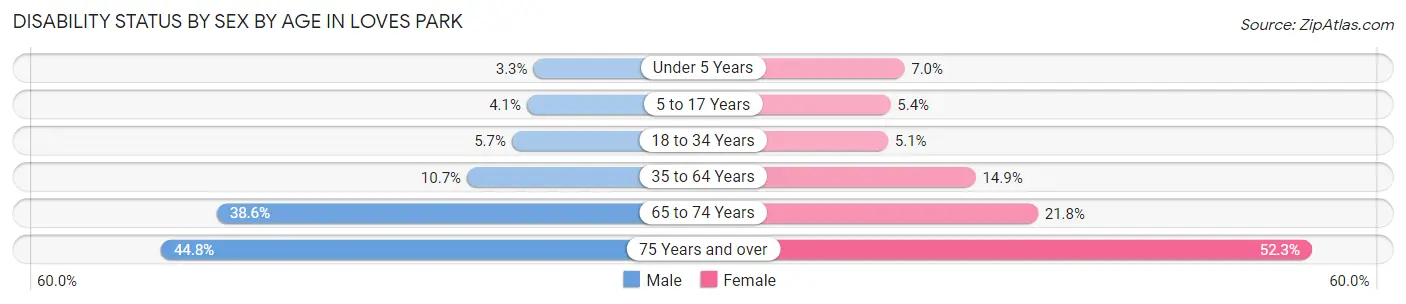
| Age Bracket | Male | Female |
| Under 5 Years | 31 (3.3%) | 56 (7.0%) |
| 5 to 17 Years | 55 (4.1%) | 92 (5.4%) |
| 18 to 34 Years | 175 (5.7%) | 151 (5.1%) |
| 35 to 64 Years | 409 (10.7%) | 616 (14.9%) |
| 65 to 74 Years | 472 (38.6%) | 298 (21.8%) |
| 75 Years and over | 203 (44.8%) | 536 (52.3%) |
Disability Class by Sex by Age in Loves Park
Disability Class: Hearing Difficulty
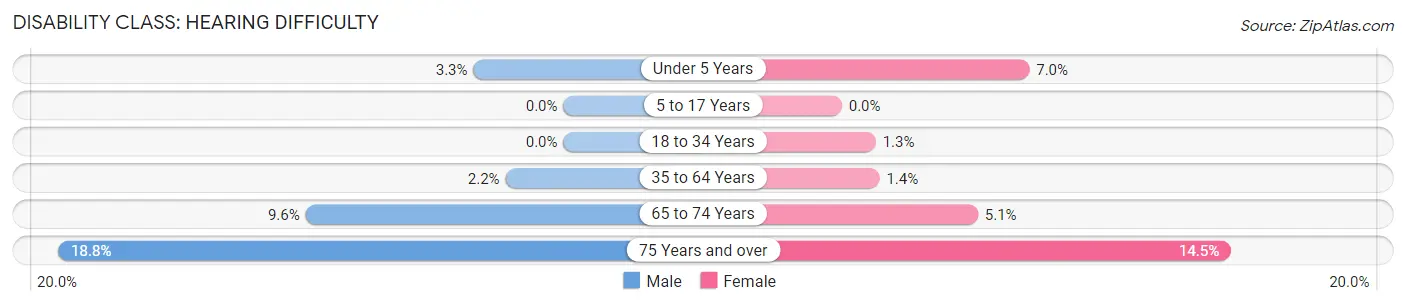
| Age Bracket | Male | Female |
| Under 5 Years | 31 (3.3%) | 56 (7.0%) |
| 5 to 17 Years | 0 (0.0%) | 0 (0.0%) |
| 18 to 34 Years | 0 (0.0%) | 37 (1.3%) |
| 35 to 64 Years | 82 (2.1%) | 58 (1.4%) |
| 65 to 74 Years | 117 (9.6%) | 69 (5.1%) |
| 75 Years and over | 85 (18.8%) | 148 (14.4%) |
Disability Class: Vision Difficulty
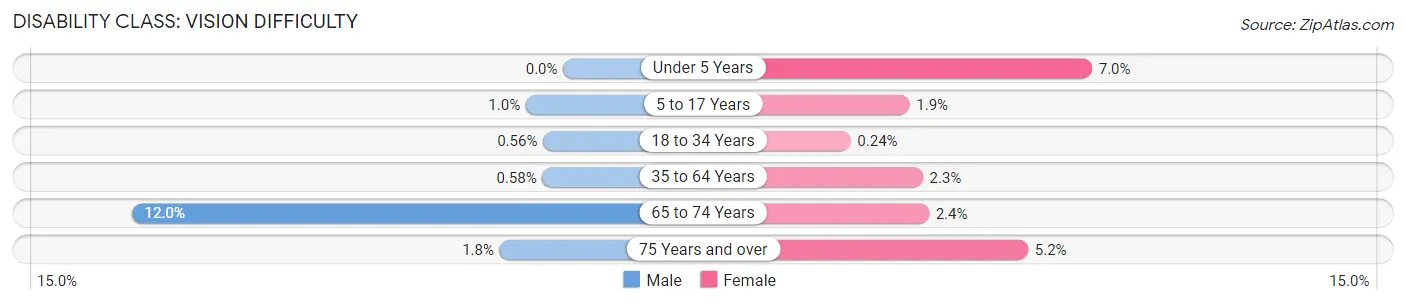
| Age Bracket | Male | Female |
| Under 5 Years | 0 (0.0%) | 56 (7.0%) |
| 5 to 17 Years | 14 (1.0%) | 32 (1.9%) |
| 18 to 34 Years | 17 (0.6%) | 7 (0.2%) |
| 35 to 64 Years | 22 (0.6%) | 93 (2.2%) |
| 65 to 74 Years | 147 (12.0%) | 33 (2.4%) |
| 75 Years and over | 8 (1.8%) | 53 (5.2%) |
Disability Class: Cognitive Difficulty
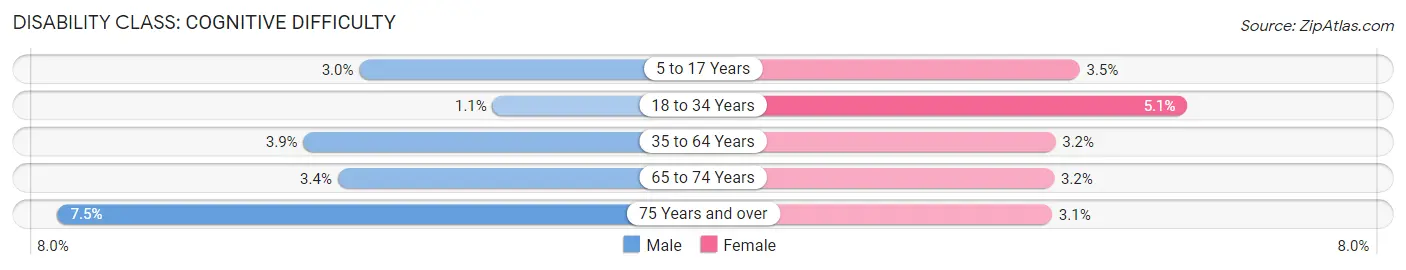
| Age Bracket | Male | Female |
| 5 to 17 Years | 41 (3.0%) | 60 (3.5%) |
| 18 to 34 Years | 32 (1.1%) | 151 (5.1%) |
| 35 to 64 Years | 147 (3.9%) | 131 (3.2%) |
| 65 to 74 Years | 41 (3.4%) | 43 (3.2%) |
| 75 Years and over | 34 (7.5%) | 32 (3.1%) |
Disability Class: Ambulatory Difficulty
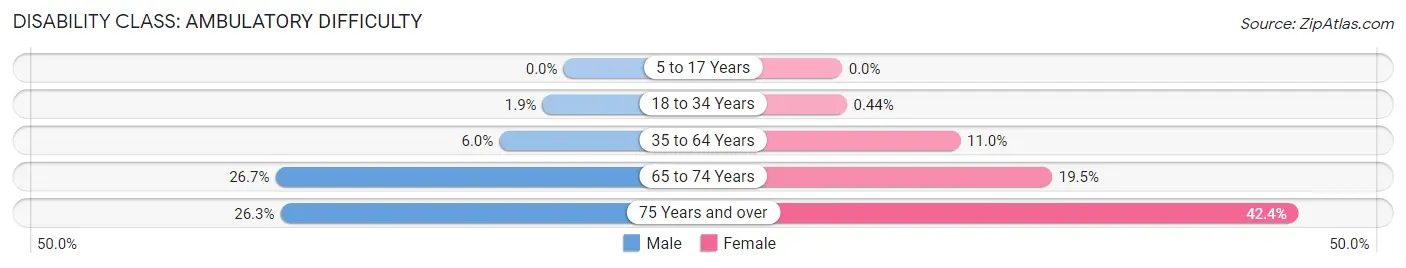
| Age Bracket | Male | Female |
| 5 to 17 Years | 0 (0.0%) | 0 (0.0%) |
| 18 to 34 Years | 59 (1.9%) | 13 (0.4%) |
| 35 to 64 Years | 227 (6.0%) | 454 (11.0%) |
| 65 to 74 Years | 327 (26.7%) | 266 (19.5%) |
| 75 Years and over | 119 (26.3%) | 434 (42.4%) |
Disability Class: Self-Care Difficulty
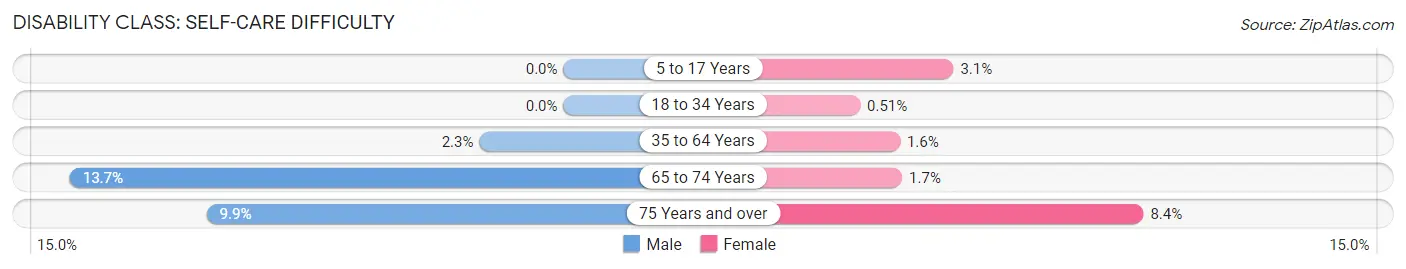
| Age Bracket | Male | Female |
| 5 to 17 Years | 0 (0.0%) | 53 (3.1%) |
| 18 to 34 Years | 0 (0.0%) | 15 (0.5%) |
| 35 to 64 Years | 89 (2.3%) | 67 (1.6%) |
| 65 to 74 Years | 168 (13.7%) | 23 (1.7%) |
| 75 Years and over | 45 (9.9%) | 86 (8.4%) |
Technology Access in Loves Park
Computing Device Access in Loves Park
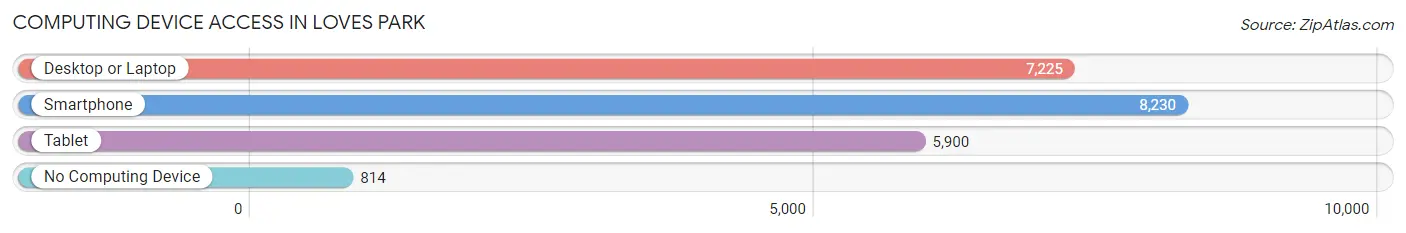
| Device Type | # Households | % Households |
| Desktop or Laptop | 7,225 | 74.5% |
| Smartphone | 8,230 | 84.8% |
| Tablet | 5,900 | 60.8% |
| No Computing Device | 814 | 8.4% |
| Total | 9,705 | 100.0% |
Internet Access in Loves Park
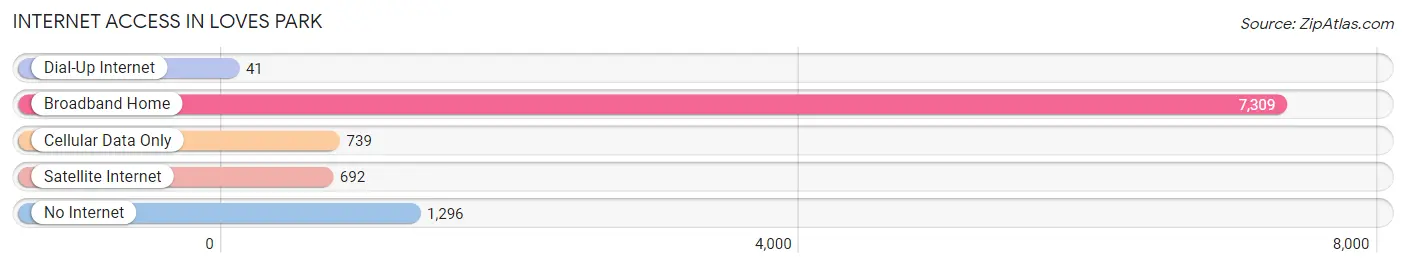
| Internet Type | # Households | % Households |
| Dial-Up Internet | 41 | 0.4% |
| Broadband Home | 7,309 | 75.3% |
| Cellular Data Only | 739 | 7.6% |
| Satellite Internet | 692 | 7.1% |
| No Internet | 1,296 | 13.4% |
| Total | 9,705 | 100.0% |
Loves Park Summary
Loves Park is a city located in Winnebago County, Illinois, United States. The population was 23,996 at the 2010 census, making it the second largest city in Winnebago County after Rockford. The city is part of the Rockford, Illinois Metropolitan Statistical Area.
Geography
Loves Park is located at 42°19′45″N 89°2′45″W (42.329092, -89.045862). According to the 2010 census, Loves Park has a total area of 8.945 square miles (23.11 km2), of which 8.9 square miles (23.04 km2) (or 99.44%) is land and 0.045 square miles (0.17 km2) (or 0.56%) is water.
History
Loves Park was founded in 1835 by John Love, a settler from New York. The city was originally known as Harlem, but the name was changed to Loves Park in 1887. The city was incorporated in 1947.
Economy
Loves Park is home to a variety of businesses, including manufacturing, retail, and service industries. The city is home to several large employers, including Woodward, Inc., a global aerospace and industrial company; and the Rockford Register Star, a daily newspaper.
Demographics
As of the census of 2010, there were 23,996 people, 9,845 households, and 6,541 families residing in the city. The population density was 2,711.3 people per square mile (1,049.2/km2). There were 10,541 housing units at an average density of 1,179.3 per square mile (455.7/km2). The racial makeup of the city was 87.2% White, 5.2% African American, 0.3% Native American, 2.2% Asian, 0.1% Pacific Islander, 3.2% from other races, and 1.9% from two or more races. Hispanic or Latino of any race were 8.2% of the population.
There were 9,845 households, out of which 30.2% had children under the age of 18 living with them, 48.2% were married couples living together, 12.7% had a female householder with no husband present, and 34.2% were non-families. 28.2% of all households were made up of individuals, and 10.2% had someone living alone who was 65 years of age or older. The average household size was 2.44 and the average family size was 2.99.
In the city, the population was spread out, with 24.2% under the age of 18, 8.7% from 18 to 24, 29.2% from 25 to 44, 24.2% from 45 to 64, and 13.7% who were 65 years of age or older. The median age was 37 years. For every 100 females, there were 93.2 males. For every 100 females age 18 and over, there were 90.2 males.
The median income for a household in the city was $45,945, and the median income for a family was $54,945. Males had a median income of $41,945 versus $30,945 for females. The per capita income for the city was $22,945. About 5.2% of families and 7.2% of the population were below the poverty line, including 9.2% of those under age 18 and 6.2% of those age 65 or over.
Common Questions
What is Per Capita Income in Loves Park?
Per Capita income in Loves Park is $33,874.
What is the Median Family Income in Loves Park?
Median Family Income in Loves Park is $74,500.
What is the Median Household income in Loves Park?
Median Household Income in Loves Park is $56,370.
What is Income or Wage Gap in Loves Park?
Income or Wage Gap in Loves Park is 33.7%.
Women in Loves Park earn 66.3 cents for every dollar earned by a man.
What is Inequality or Gini Index in Loves Park?
Inequality or Gini Index in Loves Park is 0.44.
What is the Total Population of Loves Park?
Total Population of Loves Park is 22,935.
What is the Total Male Population of Loves Park?
Total Male Population of Loves Park is 10,857.
What is the Total Female Population of Loves Park?
Total Female Population of Loves Park is 12,078.
What is the Ratio of Males per 100 Females in Loves Park?
There are 89.89 Males per 100 Females in Loves Park.
What is the Ratio of Females per 100 Males in Loves Park?
There are 111.25 Females per 100 Males in Loves Park.
What is the Median Population Age in Loves Park?
Median Population Age in Loves Park is 36.6 Years.
What is the Average Family Size in Loves Park
Average Family Size in Loves Park is 2.9 People.
What is the Average Household Size in Loves Park
Average Household Size in Loves Park is 2.4 People.
How Large is the Labor Force in Loves Park?
There are 12,179 People in the Labor Forcein in Loves Park.
What is the Percentage of People in the Labor Force in Loves Park?
65.7% of People are in the Labor Force in Loves Park.
What is the Unemployment Rate in Loves Park?
Unemployment Rate in Loves Park is 7.8%.