Warrenville, IL Map & Demographics
Warrenville Map
Warrenville Overview
$45,050
PER CAPITA INCOME
$106,801
AVG FAMILY INCOME
$95,919
AVG HOUSEHOLD INCOME
20.6%
WAGE / INCOME GAP [ % ]
79.4¢/ $1
WAGE / INCOME GAP [ $ ]
0.39
INEQUALITY / GINI INDEX
13,945
TOTAL POPULATION
6,880
MALE POPULATION
7,065
FEMALE POPULATION
97.38
MALES / 100 FEMALES
102.69
FEMALES / 100 MALES
38.5
MEDIAN AGE
3.2
AVG FAMILY SIZE
2.5
AVG HOUSEHOLD SIZE
8,491
LABOR FORCE [ PEOPLE ]
74.4%
PERCENT IN LABOR FORCE
3.5%
UNEMPLOYMENT RATE
Warrenville Zip Codes
Income in Warrenville
Income Overview in Warrenville
Per Capita Income in Warrenville is $45,050, while median incomes of families and households are $106,801 and $95,919 respectively.
| Characteristic | Number | Measure |
| Per Capita Income | 13,945 | $45,050 |
| Median Family Income | 3,401 | $106,801 |
| Mean Family Income | 3,401 | $127,570 |
| Median Household Income | 5,475 | $95,919 |
| Mean Household Income | 5,475 | $112,092 |
| Income Deficit | 3,401 | $0 |
| Wage / Income Gap (%) | 13,945 | 20.56% |
| Wage / Income Gap ($) | 13,945 | 79.44¢ per $1 |
| Gini / Inequality Index | 13,945 | 0.39 |
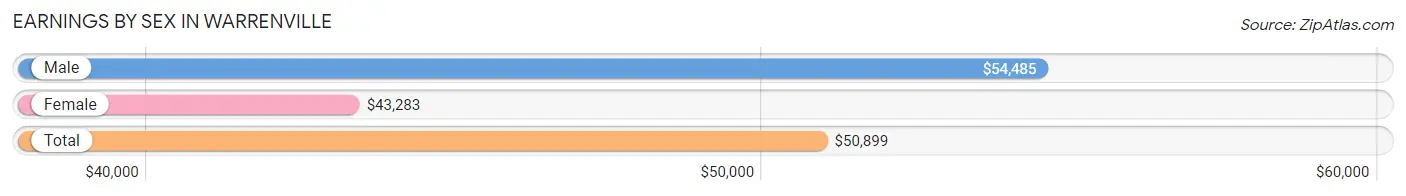
Earnings by Sex in Warrenville
Average Earnings in Warrenville are $50,899, $54,485 for men and $43,283 for women, a difference of 20.6%.
| Sex | Number | Average Earnings |
| Male | 4,434 (52.0%) | $54,485 |
| Female | 4,091 (48.0%) | $43,283 |
| Total | 8,525 (100.0%) | $50,899 |
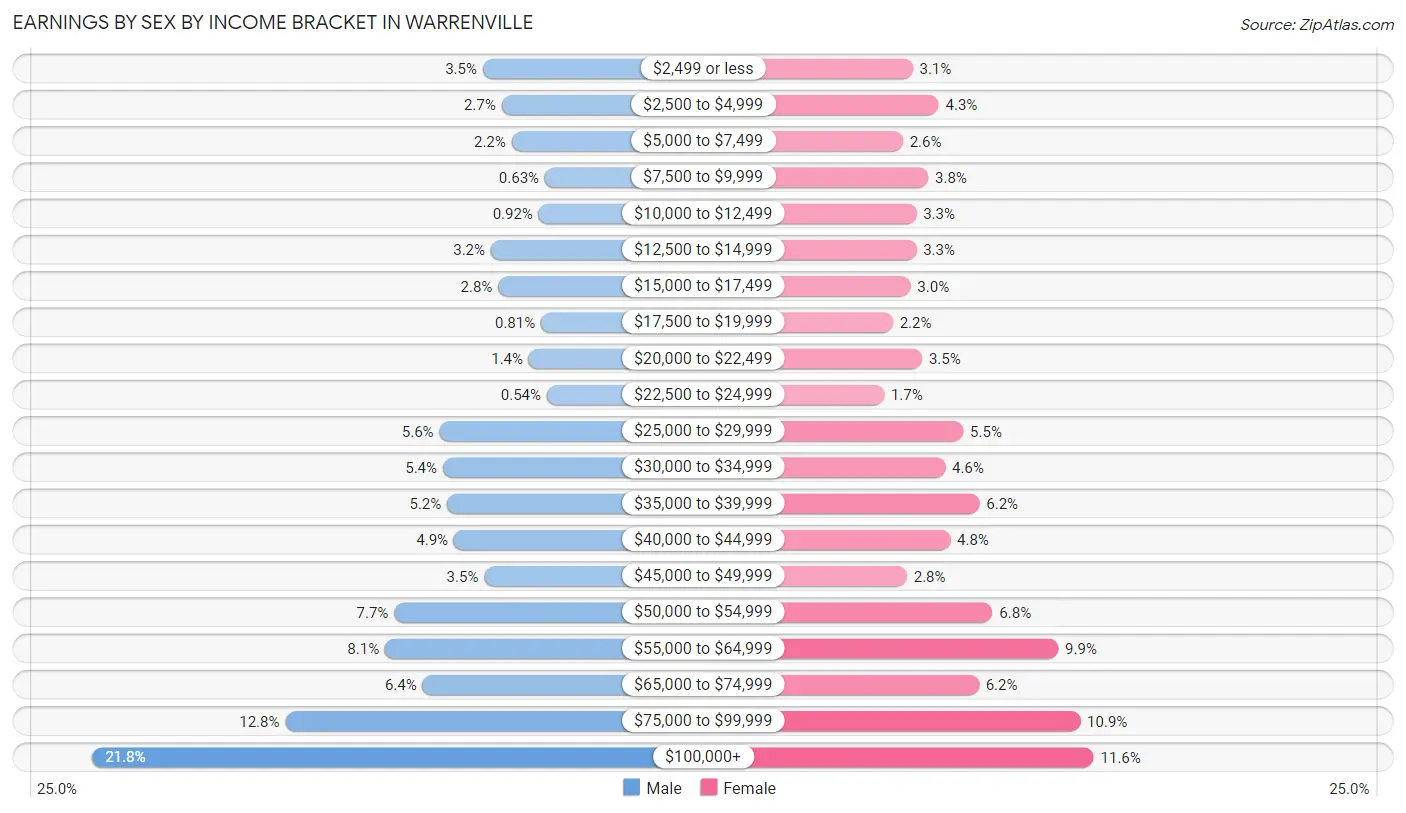
Earnings by Sex by Income Bracket in Warrenville
The most common earnings brackets in Warrenville are $100,000+ for men (968 | 21.8%) and $100,000+ for women (473 | 11.6%).
| Income | Male | Female |
| $2,499 or less | 157 (3.5%) | 126 (3.1%) |
| $2,500 to $4,999 | 118 (2.7%) | 176 (4.3%) |
| $5,000 to $7,499 | 97 (2.2%) | 107 (2.6%) |
| $7,500 to $9,999 | 28 (0.6%) | 156 (3.8%) |
| $10,000 to $12,499 | 41 (0.9%) | 133 (3.3%) |
| $12,500 to $14,999 | 140 (3.2%) | 133 (3.3%) |
| $15,000 to $17,499 | 125 (2.8%) | 122 (3.0%) |
| $17,500 to $19,999 | 36 (0.8%) | 88 (2.1%) |
| $20,000 to $22,499 | 61 (1.4%) | 144 (3.5%) |
| $22,500 to $24,999 | 24 (0.5%) | 71 (1.7%) |
| $25,000 to $29,999 | 247 (5.6%) | 223 (5.4%) |
| $30,000 to $34,999 | 240 (5.4%) | 188 (4.6%) |
| $35,000 to $39,999 | 231 (5.2%) | 254 (6.2%) |
| $40,000 to $44,999 | 217 (4.9%) | 198 (4.8%) |
| $45,000 to $49,999 | 154 (3.5%) | 115 (2.8%) |
| $50,000 to $54,999 | 341 (7.7%) | 279 (6.8%) |
| $55,000 to $64,999 | 360 (8.1%) | 405 (9.9%) |
| $65,000 to $74,999 | 282 (6.4%) | 253 (6.2%) |
| $75,000 to $99,999 | 567 (12.8%) | 447 (10.9%) |
| $100,000+ | 968 (21.8%) | 473 (11.6%) |
| Total | 4,434 (100.0%) | 4,091 (100.0%) |
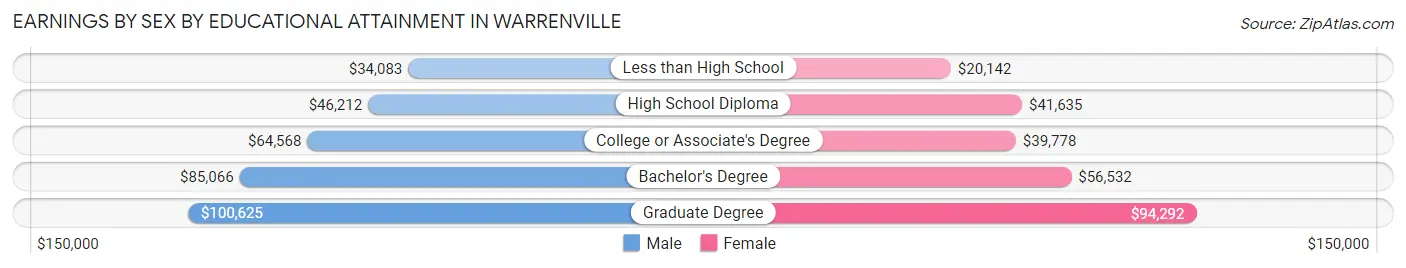
Earnings by Sex by Educational Attainment in Warrenville
Average earnings in Warrenville are $59,003 for men and $51,739 for women, a difference of 12.3%. Men with an educational attainment of graduate degree enjoy the highest average annual earnings of $100,625, while those with less than high school education earn the least with $34,083. Women with an educational attainment of graduate degree earn the most with the average annual earnings of $94,292, while those with less than high school education have the smallest earnings of $20,142.
| Educational Attainment | Male Income | Female Income |
| Less than High School | $34,083 | $20,142 |
| High School Diploma | $46,212 | $41,635 |
| College or Associate's Degree | $64,568 | $39,778 |
| Bachelor's Degree | $85,066 | $56,532 |
| Graduate Degree | $100,625 | $94,292 |
| Total | $59,003 | $51,739 |
Family Income in Warrenville
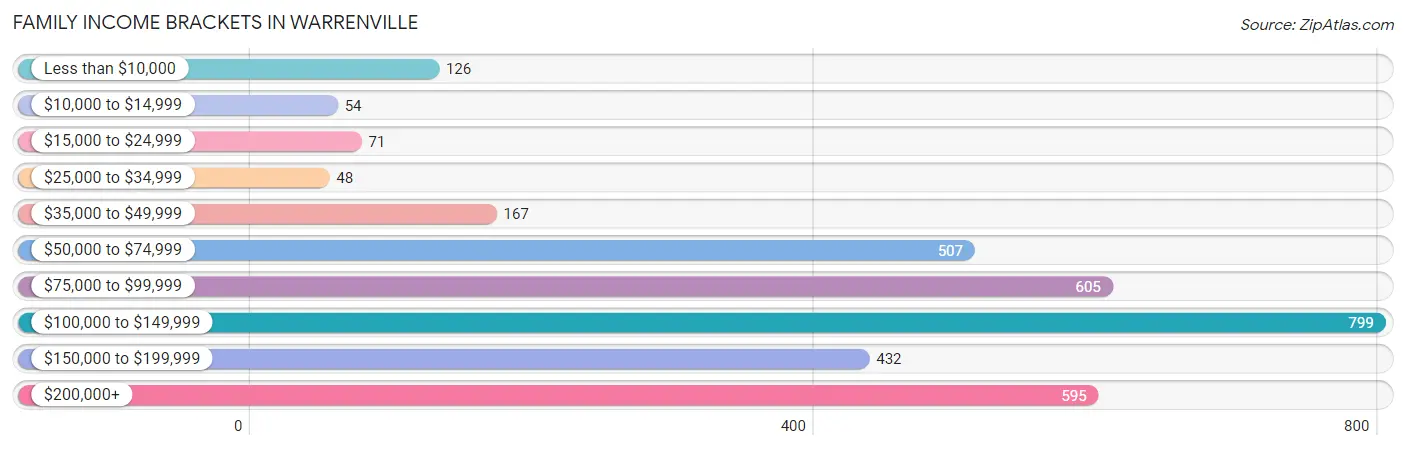
Family Income Brackets in Warrenville
According to the Warrenville family income data, there are 799 families falling into the $100,000 to $149,999 income range, which is the most common income bracket and makes up 23.5% of all families. Conversely, the $25,000 to $34,999 income bracket is the least frequent group with only 48 families (1.4%) belonging to this category.
| Income Bracket | # Families | % Families |
| Less than $10,000 | 126 | 3.7% |
| $10,000 to $14,999 | 54 | 1.6% |
| $15,000 to $24,999 | 71 | 2.1% |
| $25,000 to $34,999 | 48 | 1.4% |
| $35,000 to $49,999 | 167 | 4.9% |
| $50,000 to $74,999 | 507 | 14.9% |
| $75,000 to $99,999 | 605 | 17.8% |
| $100,000 to $149,999 | 799 | 23.5% |
| $150,000 to $199,999 | 432 | 12.7% |
| $200,000+ | 595 | 17.5% |
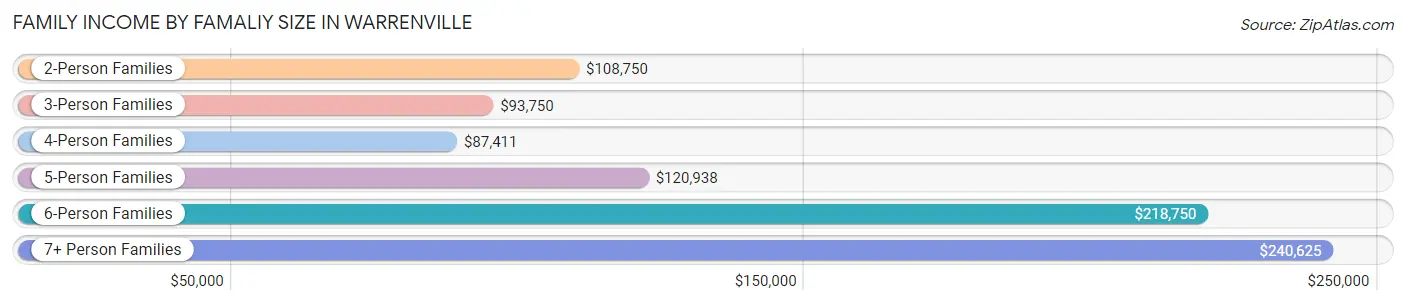
Family Income by Famaliy Size in Warrenville
7+ person families (52 | 1.5%) account for the highest median family income in Warrenville with $240,625 per family, while 2-person families (1,560 | 45.9%) have the highest median income of $54,375 per family member.
| Income Bracket | # Families | Median Income |
| 2-Person Families | 1,560 (45.9%) | $108,750 |
| 3-Person Families | 744 (21.9%) | $93,750 |
| 4-Person Families | 636 (18.7%) | $87,411 |
| 5-Person Families | 387 (11.4%) | $120,938 |
| 6-Person Families | 22 (0.6%) | $218,750 |
| 7+ Person Families | 52 (1.5%) | $240,625 |
| Total | 3,401 (100.0%) | $106,801 |
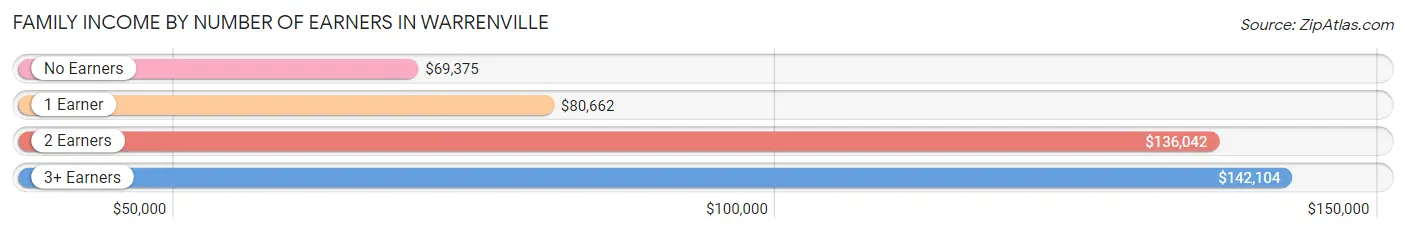
Family Income by Number of Earners in Warrenville
The median family income in Warrenville is $106,801, with families comprising 3+ earners (569) having the highest median family income of $142,104, while families with no earners (380) have the lowest median family income of $69,375, accounting for 16.7% and 11.2% of families, respectively.
| Number of Earners | # Families | Median Income |
| No Earners | 380 (11.2%) | $69,375 |
| 1 Earner | 912 (26.8%) | $80,662 |
| 2 Earners | 1,540 (45.3%) | $136,042 |
| 3+ Earners | 569 (16.7%) | $142,104 |
| Total | 3,401 (100.0%) | $106,801 |
Household Income in Warrenville
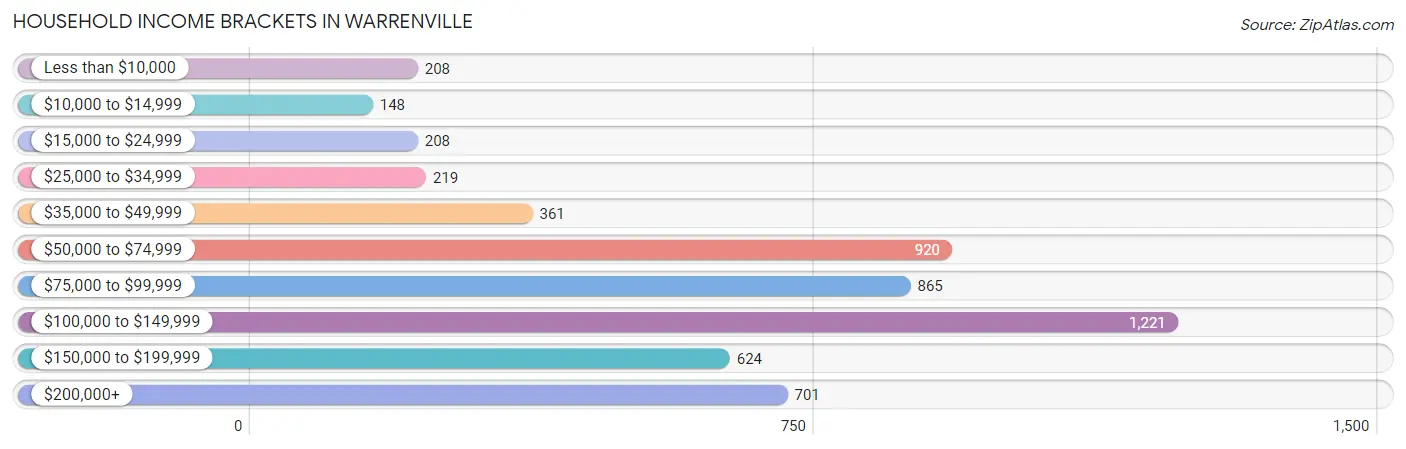
Household Income Brackets in Warrenville
With 1,221 households falling in the category, the $100,000 to $149,999 income range is the most frequent in Warrenville, accounting for 22.3% of all households. In contrast, only 148 households (2.7%) fall into the $10,000 to $14,999 income bracket, making it the least populous group.
| Income Bracket | # Households | % Households |
| Less than $10,000 | 208 | 3.8% |
| $10,000 to $14,999 | 148 | 2.7% |
| $15,000 to $24,999 | 208 | 3.8% |
| $25,000 to $34,999 | 219 | 4.0% |
| $35,000 to $49,999 | 361 | 6.6% |
| $50,000 to $74,999 | 920 | 16.8% |
| $75,000 to $99,999 | 865 | 15.8% |
| $100,000 to $149,999 | 1,221 | 22.3% |
| $150,000 to $199,999 | 624 | 11.4% |
| $200,000+ | 701 | 12.8% |
Household Income by Householder Age in Warrenville
The median household income in Warrenville is $95,919, with the highest median household income of $114,375 found in the 45 to 64 years age bracket for the primary householder. A total of 2,004 households (36.6%) fall into this category. Meanwhile, the 65+ years age bracket for the primary householder has the lowest median household income of $77,594, with 1,324 households (24.2%) in this group.
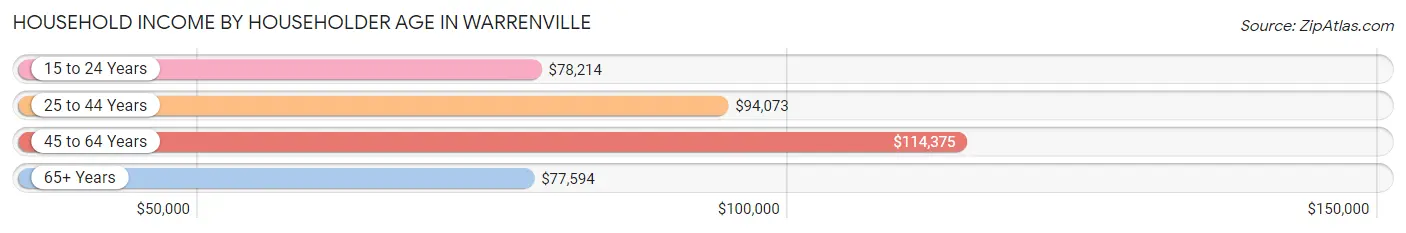
| Income Bracket | # Households | Median Income |
| 15 to 24 Years | 124 (2.3%) | $78,214 |
| 25 to 44 Years | 2,023 (36.9%) | $94,073 |
| 45 to 64 Years | 2,004 (36.6%) | $114,375 |
| 65+ Years | 1,324 (24.2%) | $77,594 |
| Total | 5,475 (100.0%) | $95,919 |
Poverty in Warrenville
Income Below Poverty by Sex and Age in Warrenville
With 7.6% poverty level for males and 9.6% for females among the residents of Warrenville, 6 to 11 year old males and 16 and 17 year old females are the most vulnerable to poverty, with 195 males (32.3%) and 132 females (53.9%) in their respective age groups living below the poverty level.
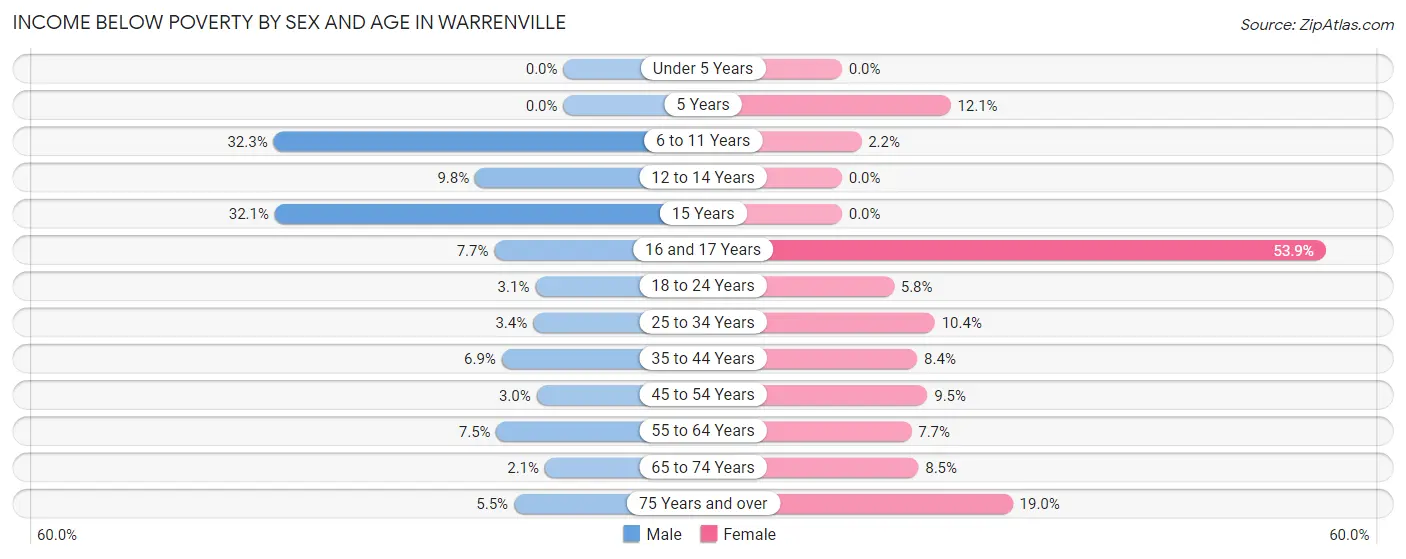
| Age Bracket | Male | Female |
| Under 5 Years | 0 (0.0%) | 0 (0.0%) |
| 5 Years | 0 (0.0%) | 15 (12.1%) |
| 6 to 11 Years | 195 (32.3%) | 10 (2.2%) |
| 12 to 14 Years | 23 (9.8%) | 0 (0.0%) |
| 15 Years | 36 (32.1%) | 0 (0.0%) |
| 16 and 17 Years | 15 (7.7%) | 132 (53.9%) |
| 18 to 24 Years | 13 (3.1%) | 33 (5.8%) |
| 25 to 34 Years | 38 (3.4%) | 114 (10.3%) |
| 35 to 44 Years | 73 (6.9%) | 70 (8.4%) |
| 45 to 54 Years | 23 (3.0%) | 93 (9.5%) |
| 55 to 64 Years | 73 (7.4%) | 66 (7.7%) |
| 65 to 74 Years | 15 (2.1%) | 74 (8.5%) |
| 75 Years and over | 17 (5.5%) | 66 (19.0%) |
| Total | 521 (7.6%) | 673 (9.6%) |
Income Above Poverty by Sex and Age in Warrenville
According to the poverty statistics in Warrenville, males aged under 5 years and females aged under 5 years are the age groups that are most secure financially, with 100.0% of males and 100.0% of females in these age groups living above the poverty line.
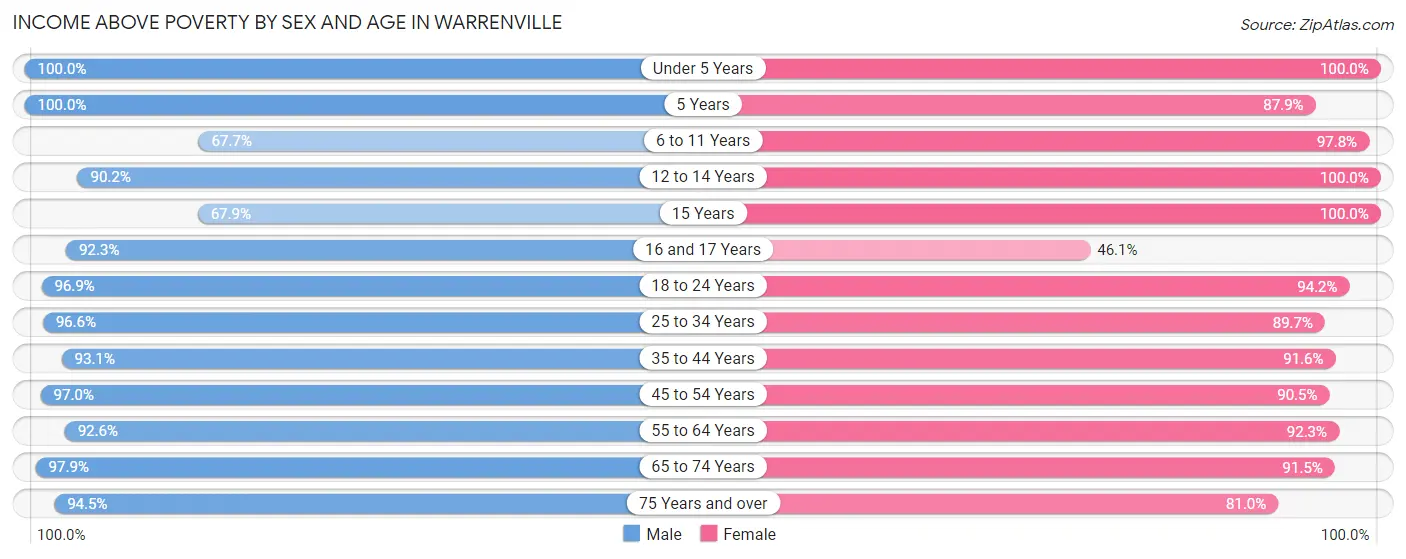
| Age Bracket | Male | Female |
| Under 5 Years | 248 (100.0%) | 211 (100.0%) |
| 5 Years | 81 (100.0%) | 109 (87.9%) |
| 6 to 11 Years | 409 (67.7%) | 452 (97.8%) |
| 12 to 14 Years | 211 (90.2%) | 245 (100.0%) |
| 15 Years | 76 (67.9%) | 156 (100.0%) |
| 16 and 17 Years | 180 (92.3%) | 113 (46.1%) |
| 18 to 24 Years | 402 (96.9%) | 537 (94.2%) |
| 25 to 34 Years | 1,091 (96.6%) | 987 (89.6%) |
| 35 to 44 Years | 989 (93.1%) | 764 (91.6%) |
| 45 to 54 Years | 748 (97.0%) | 884 (90.5%) |
| 55 to 64 Years | 907 (92.5%) | 787 (92.3%) |
| 65 to 74 Years | 712 (97.9%) | 795 (91.5%) |
| 75 Years and over | 292 (94.5%) | 281 (81.0%) |
| Total | 6,346 (92.4%) | 6,321 (90.4%) |
Income Below Poverty Among Married-Couple Families in Warrenville
The poverty statistics for married-couple families in Warrenville show that 4.1% or 108 of the total 2,640 families live below the poverty line. Families with 3 or 4 children have the highest poverty rate of 9.9%, comprising of 26 families. On the other hand, families with no children have the lowest poverty rate of 0.9%, which includes 14 families.
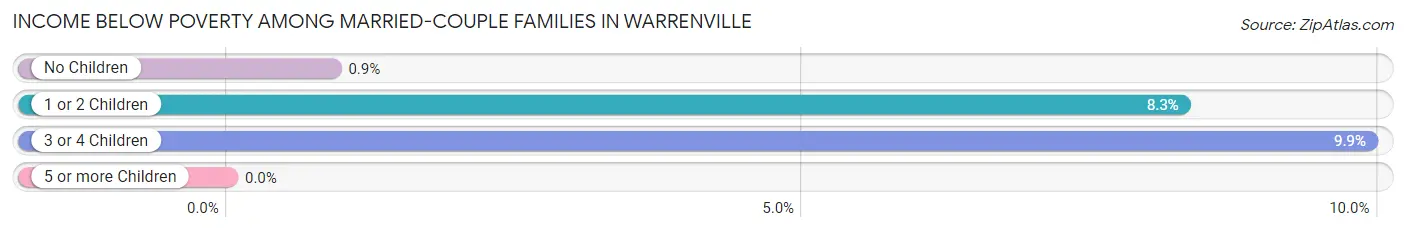
| Children | Above Poverty | Below Poverty |
| No Children | 1,544 (99.1%) | 14 (0.9%) |
| 1 or 2 Children | 752 (91.7%) | 68 (8.3%) |
| 3 or 4 Children | 236 (90.1%) | 26 (9.9%) |
| 5 or more Children | 0 (0.0%) | 0 (0.0%) |
| Total | 2,532 (95.9%) | 108 (4.1%) |
Income Below Poverty Among Single-Parent Households in Warrenville
According to the poverty data in Warrenville, 19.1% or 29 single-father households and 17.9% or 109 single-mother households are living below the poverty line. Among single-father households, those with no children have the highest poverty rate, with 29 households (23.2%) experiencing poverty. Likewise, among single-mother households, those with 3 or 4 children have the highest poverty rate, with 24 households (100.0%) falling below the poverty line.
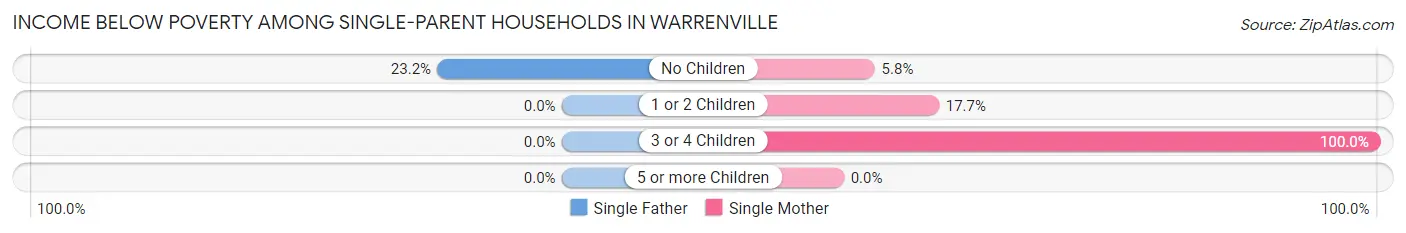
| Children | Single Father | Single Mother |
| No Children | 29 (23.2%) | 9 (5.8%) |
| 1 or 2 Children | 0 (0.0%) | 76 (17.7%) |
| 3 or 4 Children | 0 (0.0%) | 24 (100.0%) |
| 5 or more Children | 0 (0.0%) | 0 (0.0%) |
| Total | 29 (19.1%) | 109 (17.9%) |
Income Below Poverty Among Married-Couple vs Single-Parent Households in Warrenville
The poverty data for Warrenville shows that 108 of the married-couple family households (4.1%) and 138 of the single-parent households (18.1%) are living below the poverty level. Within the married-couple family households, those with 3 or 4 children have the highest poverty rate, with 26 households (9.9%) falling below the poverty line. Among the single-parent households, those with 3 or 4 children have the highest poverty rate, with 24 household (100.0%) living below poverty.
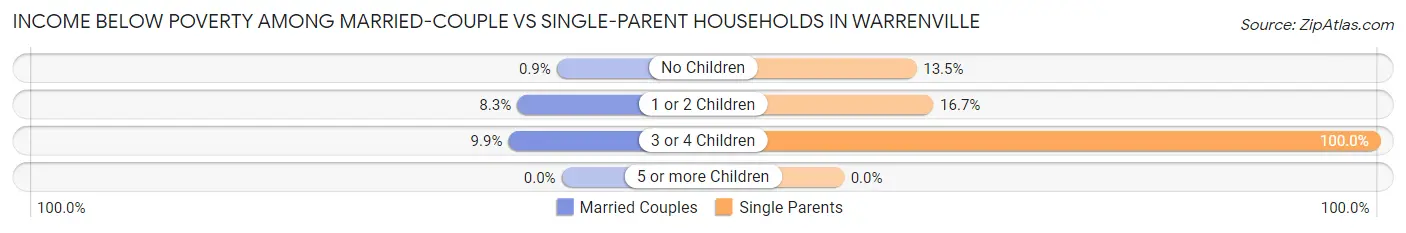
| Children | Married-Couple Families | Single-Parent Households |
| No Children | 14 (0.9%) | 38 (13.5%) |
| 1 or 2 Children | 68 (8.3%) | 76 (16.7%) |
| 3 or 4 Children | 26 (9.9%) | 24 (100.0%) |
| 5 or more Children | 0 (0.0%) | 0 (0.0%) |
| Total | 108 (4.1%) | 138 (18.1%) |
Race in Warrenville
The most populous races in Warrenville are White / Caucasian (10,485 | 75.2%), Hispanic or Latino (2,966 | 21.3%), and Two or more Races (1,022 | 7.3%).
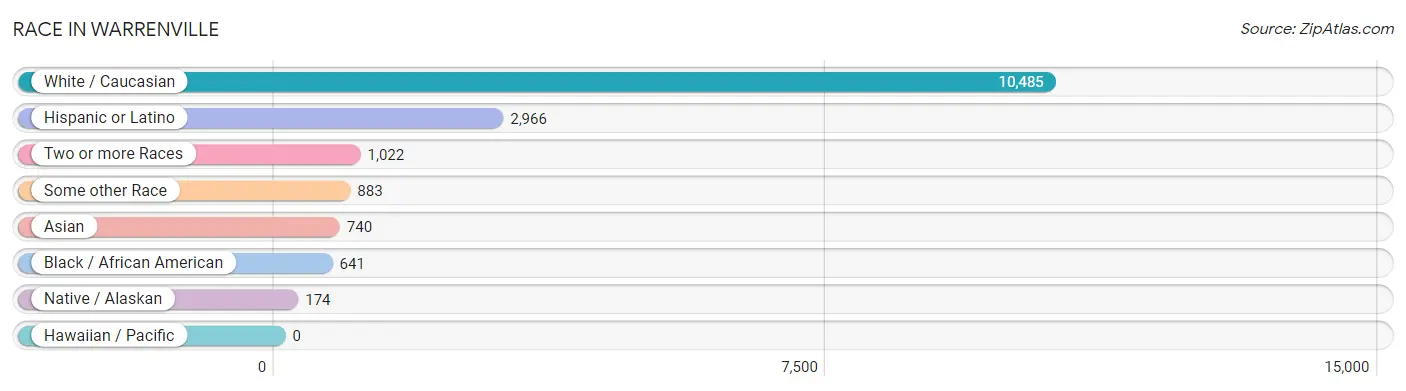
| Race | # Population | % Population |
| Asian | 740 | 5.3% |
| Black / African American | 641 | 4.6% |
| Hawaiian / Pacific | 0 | 0.0% |
| Hispanic or Latino | 2,966 | 21.3% |
| Native / Alaskan | 174 | 1.3% |
| White / Caucasian | 10,485 | 75.2% |
| Two or more Races | 1,022 | 7.3% |
| Some other Race | 883 | 6.3% |
| Total | 13,945 | 100.0% |
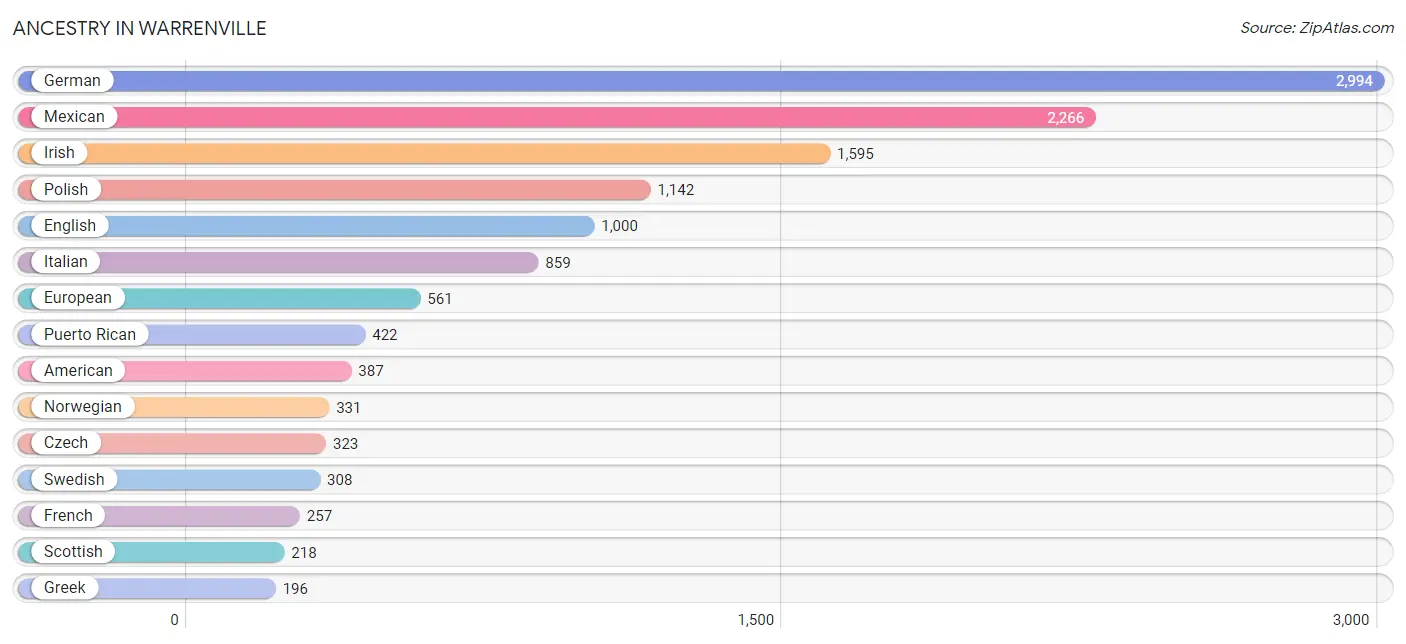
Ancestry in Warrenville
The most populous ancestries reported in Warrenville are German (2,994 | 21.5%), Mexican (2,266 | 16.3%), Irish (1,595 | 11.4%), Polish (1,142 | 8.2%), and English (1,000 | 7.2%), together accounting for 64.5% of all Warrenville residents.
| Ancestry | # Population | % Population |
| Albanian | 8 | 0.1% |
| American | 387 | 2.8% |
| Arab | 65 | 0.5% |
| Armenian | 10 | 0.1% |
| Austrian | 35 | 0.3% |
| Belgian | 16 | 0.1% |
| Bhutanese | 119 | 0.9% |
| Blackfeet | 16 | 0.1% |
| British | 131 | 0.9% |
| Bulgarian | 56 | 0.4% |
| Burmese | 49 | 0.4% |
| Cambodian | 18 | 0.1% |
| Canadian | 12 | 0.1% |
| Central American | 39 | 0.3% |
| Central American Indian | 64 | 0.5% |
| Cherokee | 40 | 0.3% |
| Chilean | 24 | 0.2% |
| Colombian | 26 | 0.2% |
| Croatian | 116 | 0.8% |
| Cuban | 101 | 0.7% |
| Czech | 323 | 2.3% |
| Czechoslovakian | 35 | 0.3% |
| Danish | 66 | 0.5% |
| Dutch | 177 | 1.3% |
| Eastern European | 39 | 0.3% |
| English | 1,000 | 7.2% |
| European | 561 | 4.0% |
| Filipino | 21 | 0.2% |
| Finnish | 19 | 0.1% |
| French | 257 | 1.8% |
| French Canadian | 135 | 1.0% |
| German | 2,994 | 21.5% |
| Greek | 196 | 1.4% |
| Guatemalan | 27 | 0.2% |
| Hungarian | 103 | 0.7% |
| Indian (Asian) | 154 | 1.1% |
| Irish | 1,595 | 11.4% |
| Israeli | 16 | 0.1% |
| Italian | 859 | 6.2% |
| Jamaican | 7 | 0.1% |
| Japanese | 25 | 0.2% |
| Korean | 160 | 1.1% |
| Lebanese | 47 | 0.3% |
| Lithuanian | 102 | 0.7% |
| Luxembourger | 4 | 0.0% |
| Mexican | 2,266 | 16.3% |
| Mexican American Indian | 130 | 0.9% |
| Moroccan | 8 | 0.1% |
| Nigerian | 41 | 0.3% |
| Northern European | 14 | 0.1% |
| Norwegian | 331 | 2.4% |
| Osage | 3 | 0.0% |
| Pakistani | 64 | 0.5% |
| Peruvian | 7 | 0.1% |
| Polish | 1,142 | 8.2% |
| Puerto Rican | 422 | 3.0% |
| Romanian | 31 | 0.2% |
| Russian | 155 | 1.1% |
| Salvadoran | 12 | 0.1% |
| Scandinavian | 96 | 0.7% |
| Scotch-Irish | 166 | 1.2% |
| Scottish | 218 | 1.6% |
| Serbian | 14 | 0.1% |
| Slovak | 52 | 0.4% |
| Slovene | 43 | 0.3% |
| South American | 57 | 0.4% |
| Spaniard | 33 | 0.2% |
| Spanish | 8 | 0.1% |
| Sri Lankan | 101 | 0.7% |
| Subsaharan African | 41 | 0.3% |
| Swedish | 308 | 2.2% |
| Swiss | 6 | 0.0% |
| Thai | 142 | 1.0% |
| Turkish | 45 | 0.3% |
| Ukrainian | 67 | 0.5% |
| Welsh | 71 | 0.5% |
| Yugoslavian | 45 | 0.3% | View All 77 Rows |
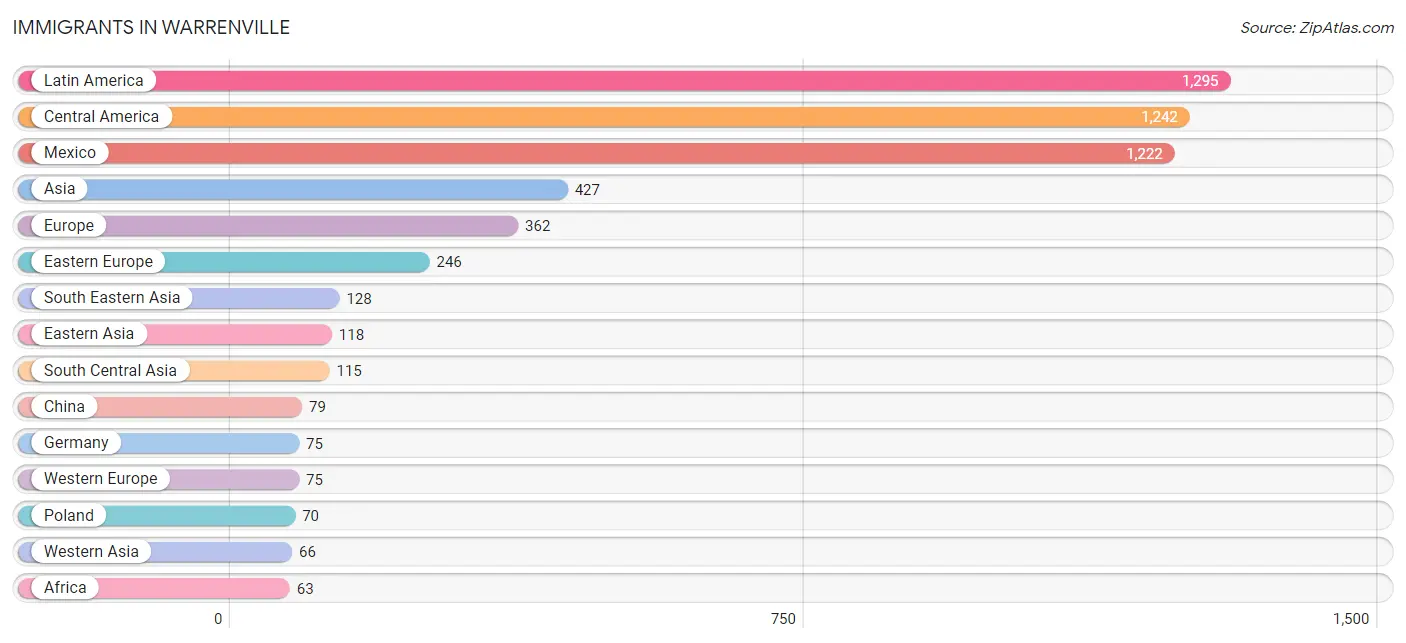
Immigrants in Warrenville
The most numerous immigrant groups reported in Warrenville came from Latin America (1,295 | 9.3%), Central America (1,242 | 8.9%), Mexico (1,222 | 8.8%), Asia (427 | 3.1%), and Europe (362 | 2.6%), together accounting for 32.6% of all Warrenville residents.
| Immigration Origin | # Population | % Population |
| Africa | 63 | 0.4% |
| Asia | 427 | 3.1% |
| Bolivia | 7 | 0.1% |
| Bosnia and Herzegovina | 10 | 0.1% |
| Bulgaria | 39 | 0.3% |
| Cambodia | 17 | 0.1% |
| Canada | 50 | 0.4% |
| Caribbean | 7 | 0.1% |
| Central America | 1,242 | 8.9% |
| Chile | 13 | 0.1% |
| China | 79 | 0.6% |
| Colombia | 26 | 0.2% |
| Croatia | 42 | 0.3% |
| Eastern Asia | 118 | 0.9% |
| Eastern Europe | 246 | 1.8% |
| El Salvador | 12 | 0.1% |
| England | 23 | 0.2% |
| Europe | 362 | 2.6% |
| Germany | 75 | 0.5% |
| Ghana | 4 | 0.0% |
| Greece | 8 | 0.1% |
| Guatemala | 8 | 0.1% |
| Hong Kong | 11 | 0.1% |
| India | 39 | 0.3% |
| Israel | 16 | 0.1% |
| Jamaica | 7 | 0.1% |
| Korea | 19 | 0.1% |
| Latin America | 1,295 | 9.3% |
| Lebanon | 30 | 0.2% |
| Lithuania | 40 | 0.3% |
| Mexico | 1,222 | 8.8% |
| Morocco | 18 | 0.1% |
| Nepal | 7 | 0.1% |
| Nigeria | 41 | 0.3% |
| Northern Africa | 18 | 0.1% |
| Northern Europe | 33 | 0.2% |
| Pakistan | 8 | 0.1% |
| Philippines | 54 | 0.4% |
| Poland | 70 | 0.5% |
| Russia | 18 | 0.1% |
| Saudi Arabia | 20 | 0.1% |
| South America | 46 | 0.3% |
| South Central Asia | 115 | 0.8% |
| South Eastern Asia | 128 | 0.9% |
| Southern Europe | 8 | 0.1% |
| Sri Lanka | 41 | 0.3% |
| Taiwan | 39 | 0.3% |
| Ukraine | 11 | 0.1% |
| Uzbekistan | 20 | 0.1% |
| Vietnam | 57 | 0.4% |
| Western Africa | 45 | 0.3% |
| Western Asia | 66 | 0.5% |
| Western Europe | 75 | 0.5% | View All 53 Rows |
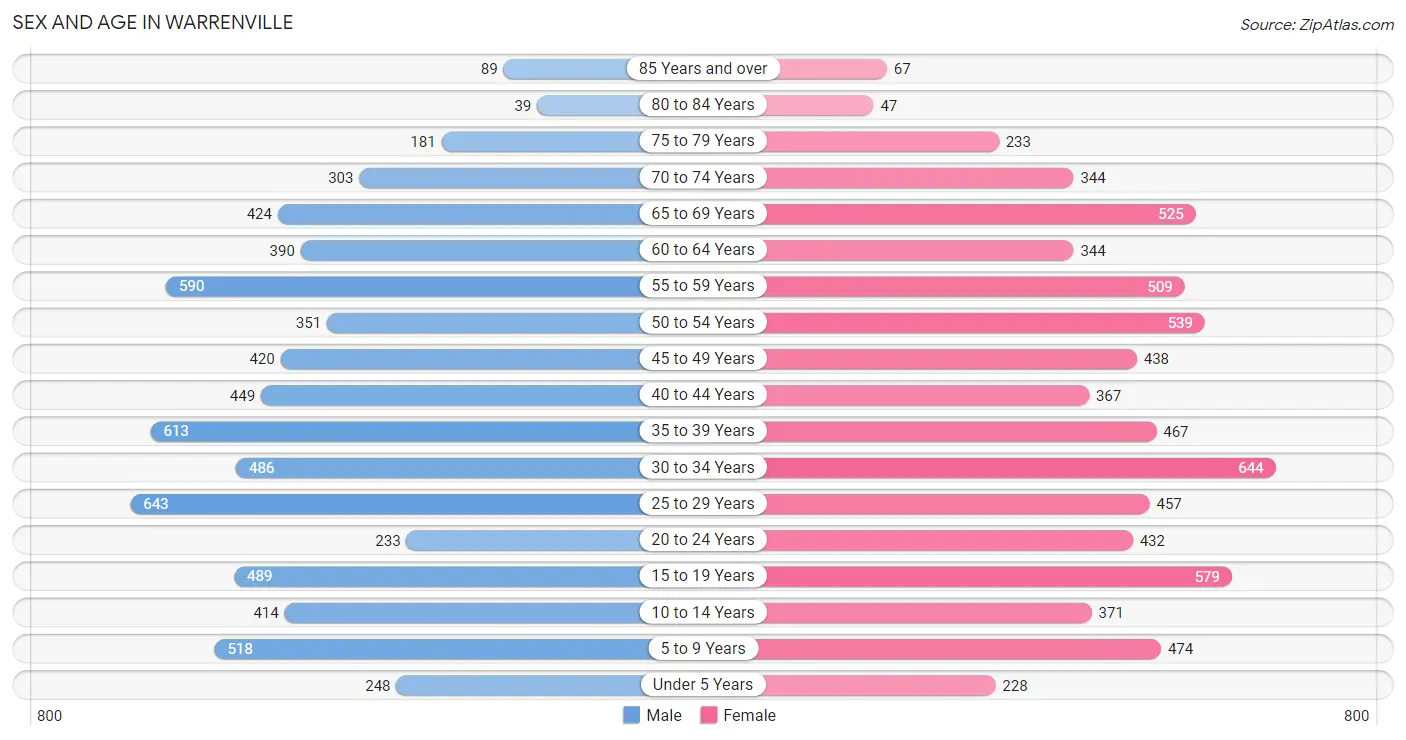
Sex and Age in Warrenville
Sex and Age in Warrenville
The most populous age groups in Warrenville are 25 to 29 Years (643 | 9.3%) for men and 30 to 34 Years (644 | 9.1%) for women.
| Age Bracket | Male | Female |
| Under 5 Years | 248 (3.6%) | 228 (3.2%) |
| 5 to 9 Years | 518 (7.5%) | 474 (6.7%) |
| 10 to 14 Years | 414 (6.0%) | 371 (5.2%) |
| 15 to 19 Years | 489 (7.1%) | 579 (8.2%) |
| 20 to 24 Years | 233 (3.4%) | 432 (6.1%) |
| 25 to 29 Years | 643 (9.3%) | 457 (6.5%) |
| 30 to 34 Years | 486 (7.1%) | 644 (9.1%) |
| 35 to 39 Years | 613 (8.9%) | 467 (6.6%) |
| 40 to 44 Years | 449 (6.5%) | 367 (5.2%) |
| 45 to 49 Years | 420 (6.1%) | 438 (6.2%) |
| 50 to 54 Years | 351 (5.1%) | 539 (7.6%) |
| 55 to 59 Years | 590 (8.6%) | 509 (7.2%) |
| 60 to 64 Years | 390 (5.7%) | 344 (4.9%) |
| 65 to 69 Years | 424 (6.2%) | 525 (7.4%) |
| 70 to 74 Years | 303 (4.4%) | 344 (4.9%) |
| 75 to 79 Years | 181 (2.6%) | 233 (3.3%) |
| 80 to 84 Years | 39 (0.6%) | 47 (0.7%) |
| 85 Years and over | 89 (1.3%) | 67 (0.9%) |
| Total | 6,880 (100.0%) | 7,065 (100.0%) |
Families and Households in Warrenville
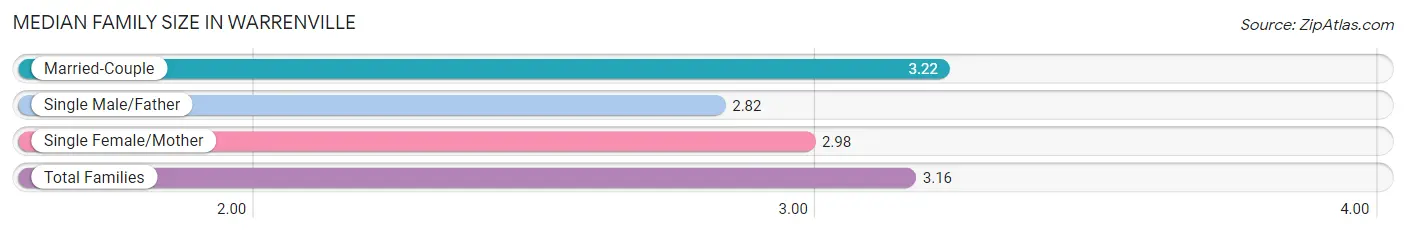
Median Family Size in Warrenville
The median family size in Warrenville is 3.16 persons per family, with married-couple families (2,640 | 77.6%) accounting for the largest median family size of 3.22 persons per family. On the other hand, single male/father families (152 | 4.5%) represent the smallest median family size with 2.82 persons per family.
| Family Type | # Families | Family Size |
| Married-Couple | 2,640 (77.6%) | 3.22 |
| Single Male/Father | 152 (4.5%) | 2.82 |
| Single Female/Mother | 609 (17.9%) | 2.98 |
| Total Families | 3,401 (100.0%) | 3.16 |
Median Household Size in Warrenville
The median household size in Warrenville is 2.53 persons per household, with single female/mother households (609 | 11.1%) accounting for the largest median household size of 3.3 persons per household. non-family households (2,074 | 37.9%) represent the smallest median household size with 1.39 persons per household.

| Household Type | # Households | Household Size |
| Married-Couple | 2,640 (48.2%) | 3.23 |
| Single Male/Father | 152 (2.8%) | 2.97 |
| Single Female/Mother | 609 (11.1%) | 3.30 |
| Non-family | 2,074 (37.9%) | 1.39 |
| Total Households | 5,475 (100.0%) | 2.53 |
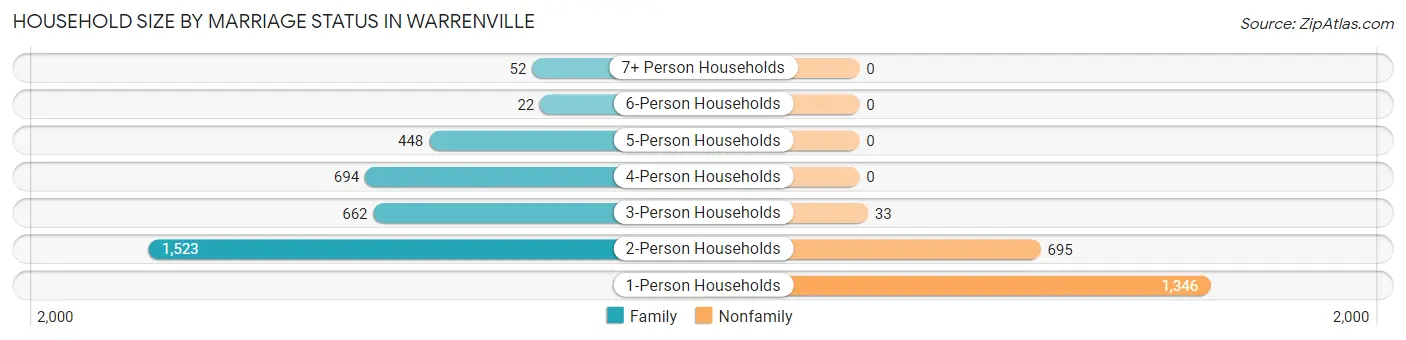
Household Size by Marriage Status in Warrenville
Out of a total of 5,475 households in Warrenville, 3,401 (62.1%) are family households, while 2,074 (37.9%) are nonfamily households. The most numerous type of family households are 2-person households, comprising 1,523, and the most common type of nonfamily households are 1-person households, comprising 1,346.
| Household Size | Family Households | Nonfamily Households |
| 1-Person Households | - | 1,346 (24.6%) |
| 2-Person Households | 1,523 (27.8%) | 695 (12.7%) |
| 3-Person Households | 662 (12.1%) | 33 (0.6%) |
| 4-Person Households | 694 (12.7%) | 0 (0.0%) |
| 5-Person Households | 448 (8.2%) | 0 (0.0%) |
| 6-Person Households | 22 (0.4%) | 0 (0.0%) |
| 7+ Person Households | 52 (0.9%) | 0 (0.0%) |
| Total | 3,401 (62.1%) | 2,074 (37.9%) |
Female Fertility in Warrenville
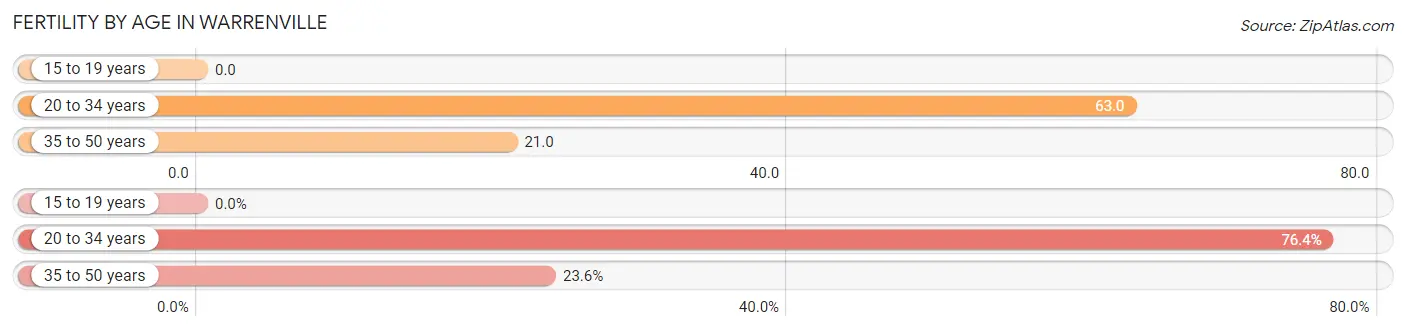
Fertility by Age in Warrenville
Average fertility rate in Warrenville is 36.0 births per 1,000 women. Women in the age bracket of 20 to 34 years have the highest fertility rate with 63.0 births per 1,000 women. Women in the age bracket of 20 to 34 years acount for 76.4% of all women with births.
| Age Bracket | Women with Births | Births / 1,000 Women |
| 15 to 19 years | 0 (0.0%) | 0.0 |
| 20 to 34 years | 97 (76.4%) | 63.0 |
| 35 to 50 years | 30 (23.6%) | 21.0 |
| Total | 127 (100.0%) | 36.0 |
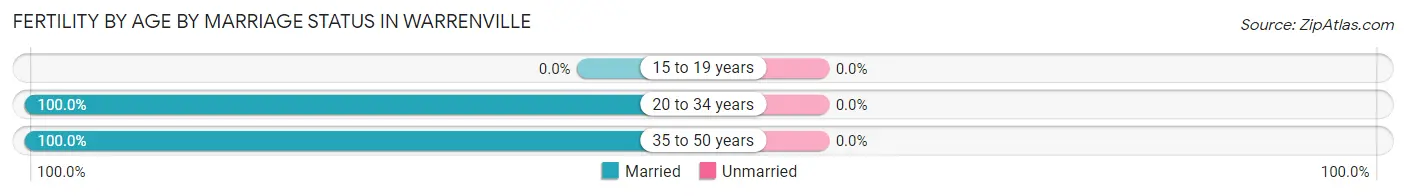
Fertility by Age by Marriage Status in Warrenville
| Age Bracket | Married | Unmarried |
| 15 to 19 years | 0 (0.0%) | 0 (0.0%) |
| 20 to 34 years | 97 (100.0%) | 0 (0.0%) |
| 35 to 50 years | 30 (100.0%) | 0 (0.0%) |
| Total | 127 (100.0%) | 0 (0.0%) |
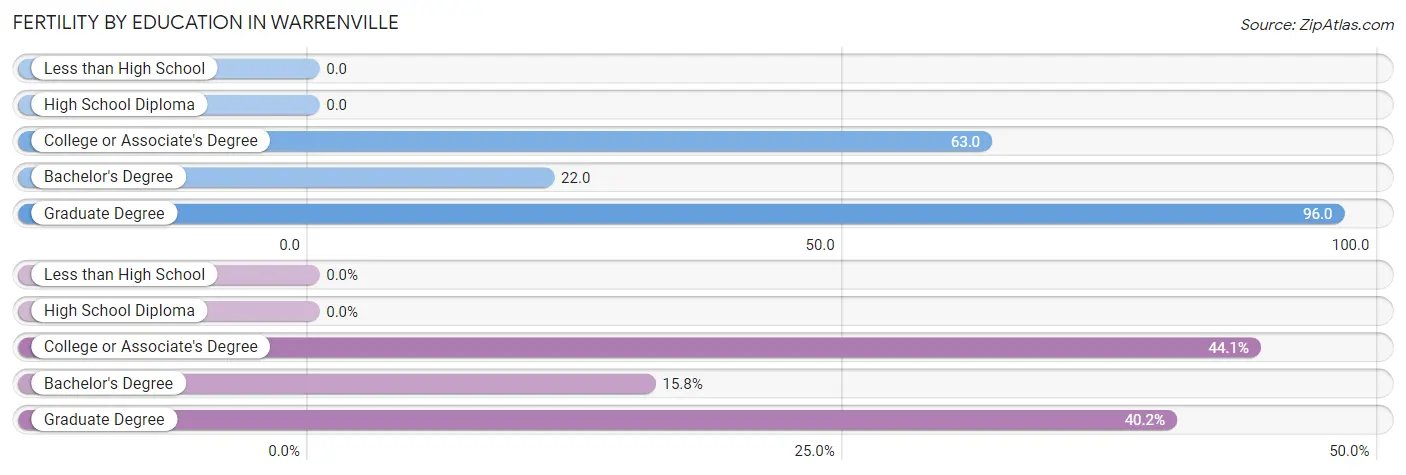
Fertility by Education in Warrenville
| Educational Attainment | Women with Births | Births / 1,000 Women |
| Less than High School | 0 (0.0%) | 0.0 |
| High School Diploma | 0 (0.0%) | 0.0 |
| College or Associate's Degree | 56 (44.1%) | 63.0 |
| Bachelor's Degree | 20 (15.8%) | 22.0 |
| Graduate Degree | 51 (40.2%) | 96.0 |
| Total | 127 (100.0%) | 36.0 |
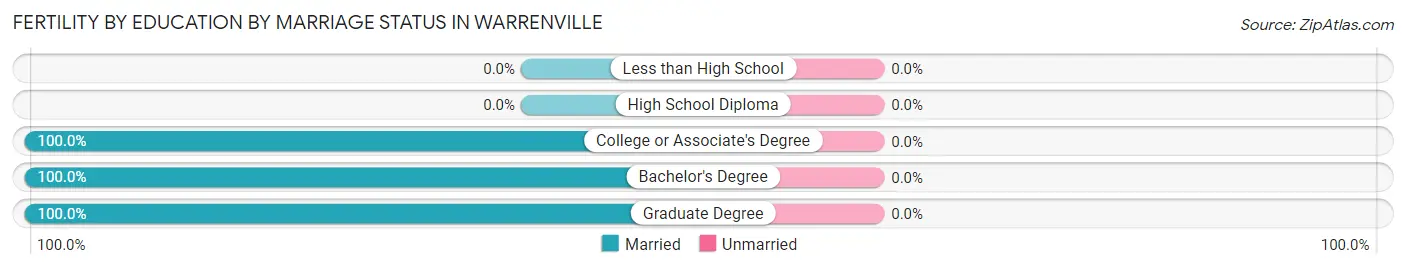
Fertility by Education by Marriage Status in Warrenville
| Educational Attainment | Married | Unmarried |
| Less than High School | 0 (0.0%) | 0 (0.0%) |
| High School Diploma | 0 (0.0%) | 0 (0.0%) |
| College or Associate's Degree | 56 (100.0%) | 0 (0.0%) |
| Bachelor's Degree | 20 (100.0%) | 0 (0.0%) |
| Graduate Degree | 51 (100.0%) | 0 (0.0%) |
| Total | 127 (100.0%) | 0 (0.0%) |
Employment Characteristics in Warrenville
Employment by Class of Employer in Warrenville
Among the 8,074 employed individuals in Warrenville, private company employees (5,840 | 72.3%), not-for-profit organizations (684 | 8.5%), and local government employees (667 | 8.3%) make up the most common classes of employment.
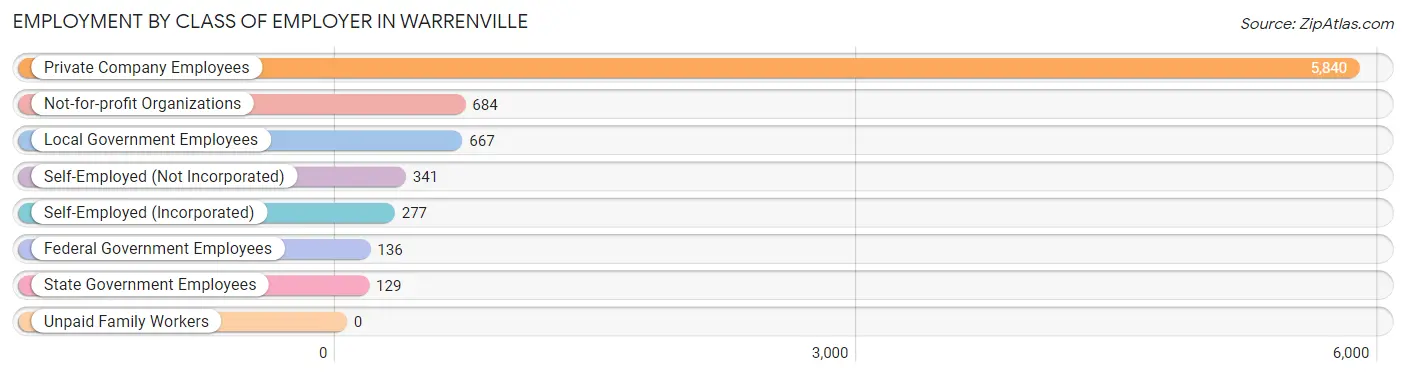
| Employer Class | # Employees | % Employees |
| Private Company Employees | 5,840 | 72.3% |
| Self-Employed (Incorporated) | 277 | 3.4% |
| Self-Employed (Not Incorporated) | 341 | 4.2% |
| Not-for-profit Organizations | 684 | 8.5% |
| Local Government Employees | 667 | 8.3% |
| State Government Employees | 129 | 1.6% |
| Federal Government Employees | 136 | 1.7% |
| Unpaid Family Workers | 0 | 0.0% |
| Total | 8,074 | 100.0% |
Employment Status by Age in Warrenville
According to the labor force statistics for Warrenville, out of the total population over 16 years of age (11,413), 74.4% or 8,491 individuals are in the labor force, with 3.5% or 297 of them unemployed. The age group with the highest labor force participation rate is 30 to 34 years, with 96.1% or 1,086 individuals in the labor force. Within the labor force, the 30 to 34 years age range has the highest percentage of unemployed individuals, with 8.7% or 94 of them being unemployed.
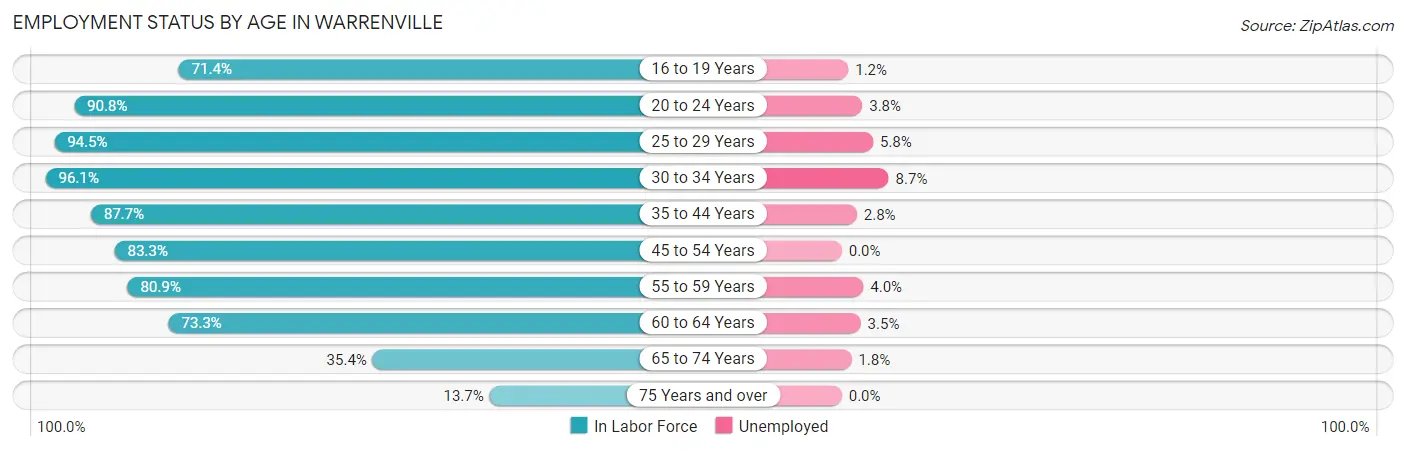
| Age Bracket | In Labor Force | Unemployed |
| 16 to 19 Years | 563 (71.4%) | 7 (1.2%) |
| 20 to 24 Years | 604 (90.8%) | 23 (3.8%) |
| 25 to 29 Years | 1,040 (94.5%) | 60 (5.8%) |
| 30 to 34 Years | 1,086 (96.1%) | 94 (8.7%) |
| 35 to 44 Years | 1,663 (87.7%) | 47 (2.8%) |
| 45 to 54 Years | 1,456 (83.3%) | 0 (0.0%) |
| 55 to 59 Years | 889 (80.9%) | 36 (4.0%) |
| 60 to 64 Years | 538 (73.3%) | 19 (3.5%) |
| 65 to 74 Years | 565 (35.4%) | 10 (1.8%) |
| 75 Years and over | 90 (13.7%) | 0 (0.0%) |
| Total | 8,491 (74.4%) | 297 (3.5%) |
Employment Status by Educational Attainment in Warrenville
According to labor force statistics for Warrenville, 86.6% of individuals (6,674) out of the total population between 25 and 64 years of age (7,707) are in the labor force, with 3.8% or 254 of them being unemployed. The group with the highest labor force participation rate are those with the educational attainment of bachelor's degree or higher, with 89.6% or 3,019 individuals in the labor force. Within the labor force, individuals with less than high school education have the highest percentage of unemployment, with 14.0% or 103 of them being unemployed.
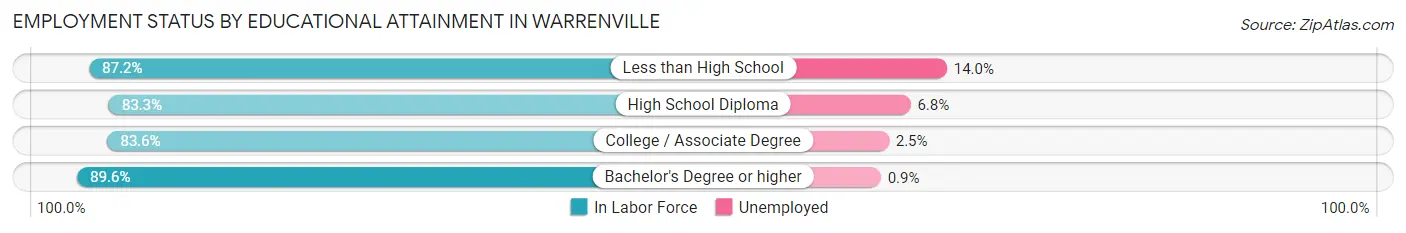
| Educational Attainment | In Labor Force | Unemployed |
| Less than High School | 734 (87.2%) | 118 (14.0%) |
| High School Diploma | 1,210 (83.3%) | 99 (6.8%) |
| College / Associate Degree | 1,708 (83.6%) | 51 (2.5%) |
| Bachelor's Degree or higher | 3,019 (89.6%) | 30 (0.9%) |
| Total | 6,674 (86.6%) | 293 (3.8%) |
Employment Occupations by Sex in Warrenville
Management, Business, Science and Arts Occupations
The most common Management, Business, Science and Arts occupations in Warrenville are Management (1,004 | 12.2%), Community & Social Service (874 | 10.7%), Business & Financial (634 | 7.7%), Computers, Engineering & Science (529 | 6.5%), and Education Instruction & Library (501 | 6.1%).
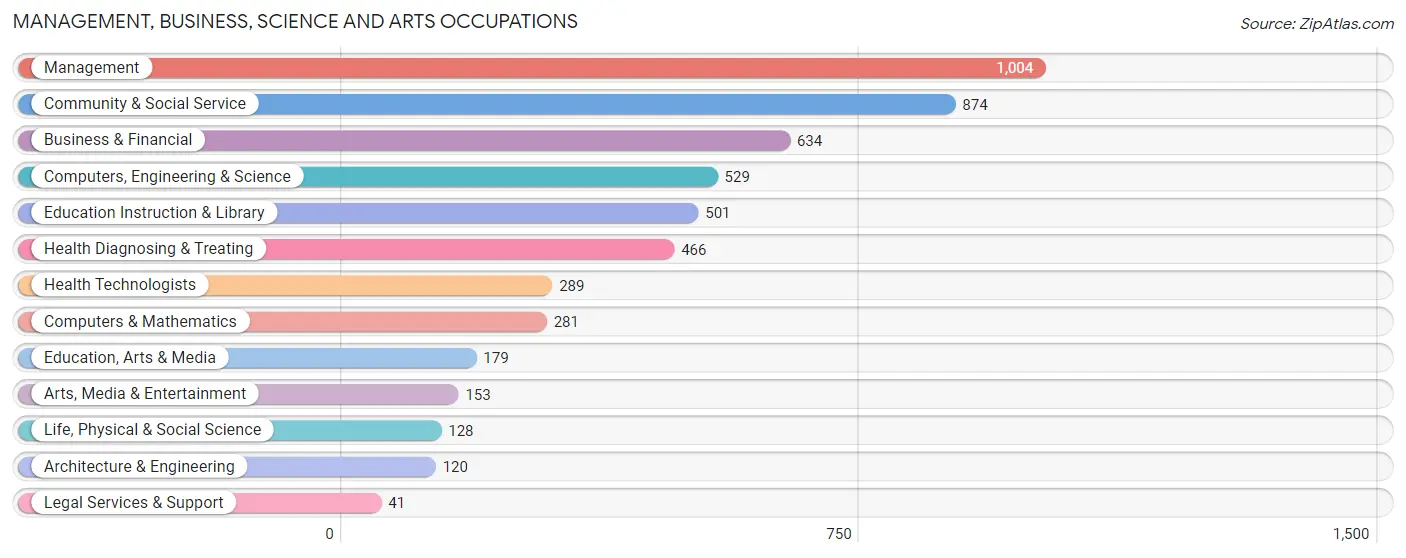
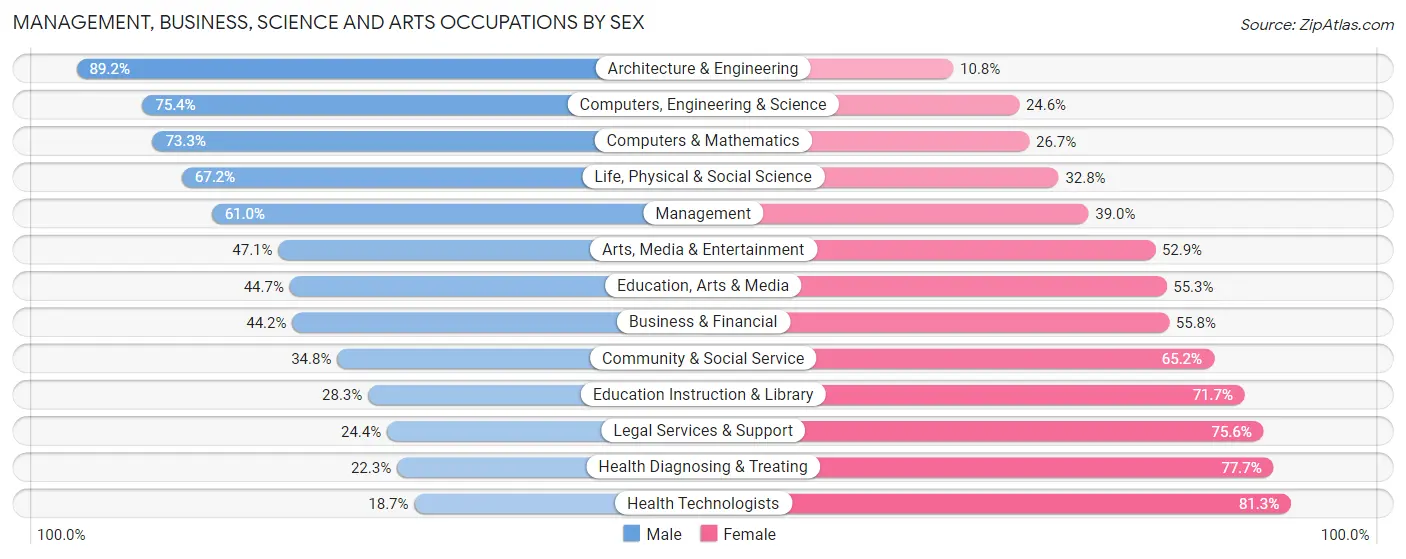
Management, Business, Science and Arts Occupations by Sex
Within the Management, Business, Science and Arts occupations in Warrenville, the most male-oriented occupations are Architecture & Engineering (89.2%), Computers, Engineering & Science (75.4%), and Computers & Mathematics (73.3%), while the most female-oriented occupations are Health Technologists (81.3%), Health Diagnosing & Treating (77.7%), and Legal Services & Support (75.6%).
| Occupation | Male | Female |
| Management | 612 (61.0%) | 392 (39.0%) |
| Business & Financial | 280 (44.2%) | 354 (55.8%) |
| Computers, Engineering & Science | 399 (75.4%) | 130 (24.6%) |
| Computers & Mathematics | 206 (73.3%) | 75 (26.7%) |
| Architecture & Engineering | 107 (89.2%) | 13 (10.8%) |
| Life, Physical & Social Science | 86 (67.2%) | 42 (32.8%) |
| Community & Social Service | 304 (34.8%) | 570 (65.2%) |
| Education, Arts & Media | 80 (44.7%) | 99 (55.3%) |
| Legal Services & Support | 10 (24.4%) | 31 (75.6%) |
| Education Instruction & Library | 142 (28.3%) | 359 (71.7%) |
| Arts, Media & Entertainment | 72 (47.1%) | 81 (52.9%) |
| Health Diagnosing & Treating | 104 (22.3%) | 362 (77.7%) |
| Health Technologists | 54 (18.7%) | 235 (81.3%) |
| Total (Category) | 1,699 (48.4%) | 1,808 (51.5%) |
| Total (Overall) | 4,316 (52.6%) | 3,883 (47.4%) |
Services Occupations
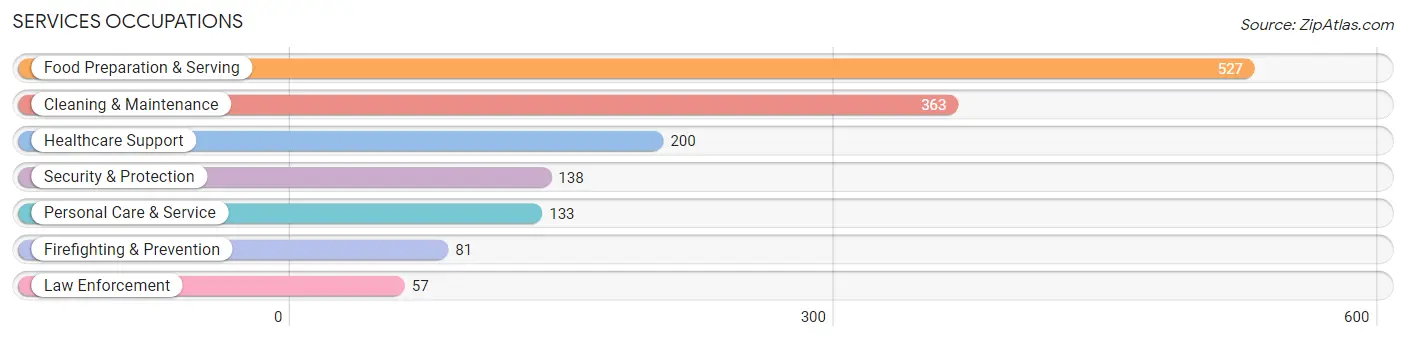
The most common Services occupations in Warrenville are Food Preparation & Serving (527 | 6.4%), Cleaning & Maintenance (363 | 4.4%), Healthcare Support (200 | 2.4%), Security & Protection (138 | 1.7%), and Personal Care & Service (133 | 1.6%).
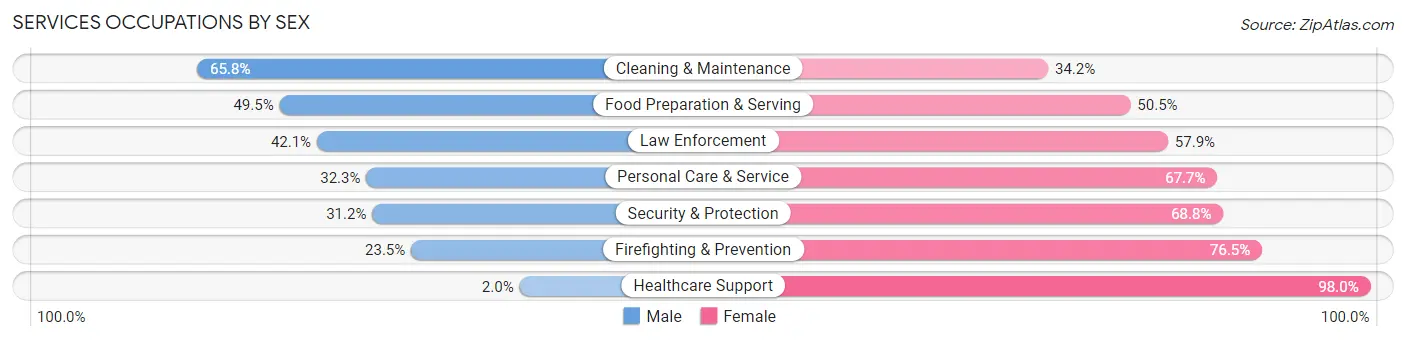
Services Occupations by Sex
Within the Services occupations in Warrenville, the most male-oriented occupations are Cleaning & Maintenance (65.8%), Food Preparation & Serving (49.5%), and Law Enforcement (42.1%), while the most female-oriented occupations are Healthcare Support (98.0%), Firefighting & Prevention (76.5%), and Security & Protection (68.8%).
| Occupation | Male | Female |
| Healthcare Support | 4 (2.0%) | 196 (98.0%) |
| Security & Protection | 43 (31.2%) | 95 (68.8%) |
| Firefighting & Prevention | 19 (23.5%) | 62 (76.5%) |
| Law Enforcement | 24 (42.1%) | 33 (57.9%) |
| Food Preparation & Serving | 261 (49.5%) | 266 (50.5%) |
| Cleaning & Maintenance | 239 (65.8%) | 124 (34.2%) |
| Personal Care & Service | 43 (32.3%) | 90 (67.7%) |
| Total (Category) | 590 (43.3%) | 771 (56.7%) |
| Total (Overall) | 4,316 (52.6%) | 3,883 (47.4%) |
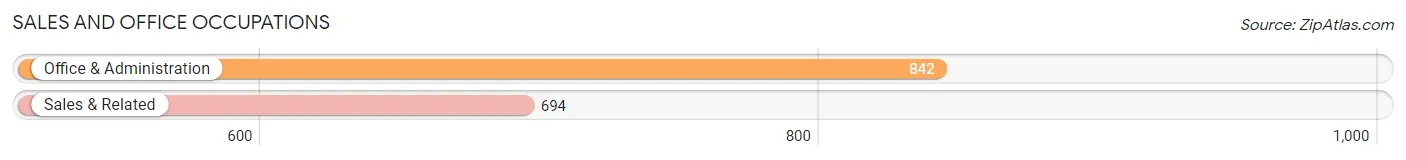
Sales and Office Occupations
The most common Sales and Office occupations in Warrenville are Office & Administration (842 | 10.3%), and Sales & Related (694 | 8.5%).
Sales and Office Occupations by Sex
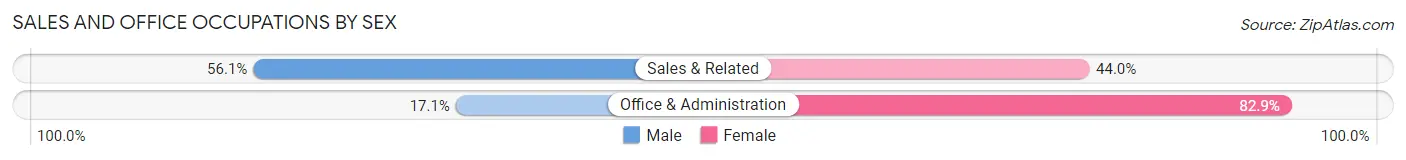
| Occupation | Male | Female |
| Sales & Related | 389 (56.0%) | 305 (44.0%) |
| Office & Administration | 144 (17.1%) | 698 (82.9%) |
| Total (Category) | 533 (34.7%) | 1,003 (65.3%) |
| Total (Overall) | 4,316 (52.6%) | 3,883 (47.4%) |
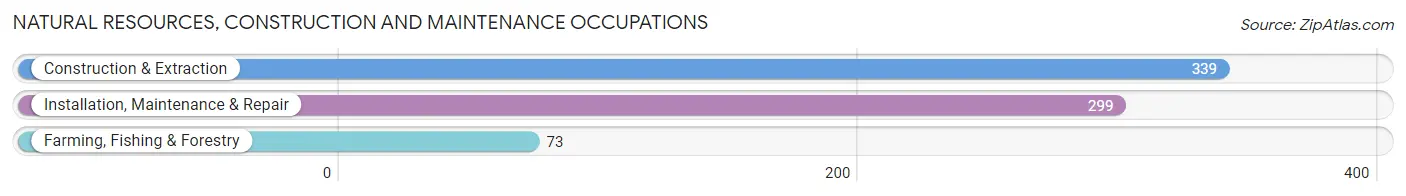
Natural Resources, Construction and Maintenance Occupations
The most common Natural Resources, Construction and Maintenance occupations in Warrenville are Construction & Extraction (339 | 4.1%), Installation, Maintenance & Repair (299 | 3.6%), and Farming, Fishing & Forestry (73 | 0.9%).
Natural Resources, Construction and Maintenance Occupations by Sex
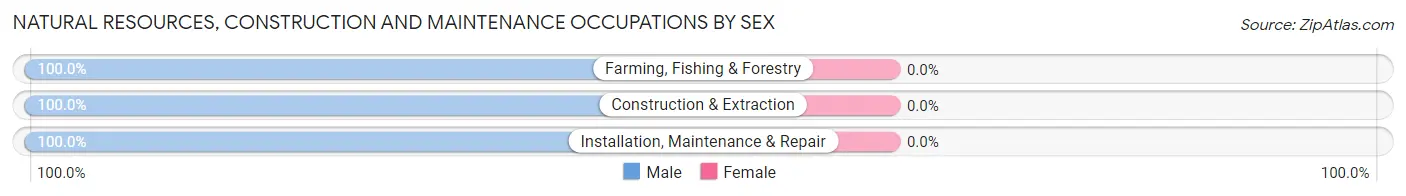
| Occupation | Male | Female |
| Farming, Fishing & Forestry | 73 (100.0%) | 0 (0.0%) |
| Construction & Extraction | 339 (100.0%) | 0 (0.0%) |
| Installation, Maintenance & Repair | 299 (100.0%) | 0 (0.0%) |
| Total (Category) | 711 (100.0%) | 0 (0.0%) |
| Total (Overall) | 4,316 (52.6%) | 3,883 (47.4%) |
Production, Transportation and Moving Occupations
The most common Production, Transportation and Moving occupations in Warrenville are Production (468 | 5.7%), Material Moving (430 | 5.2%), and Transportation (186 | 2.3%).
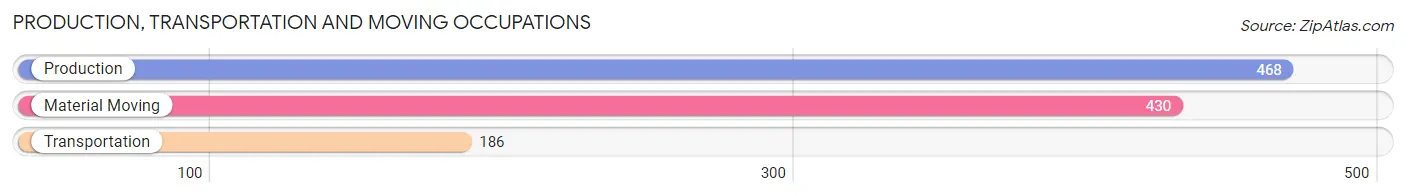
Production, Transportation and Moving Occupations by Sex
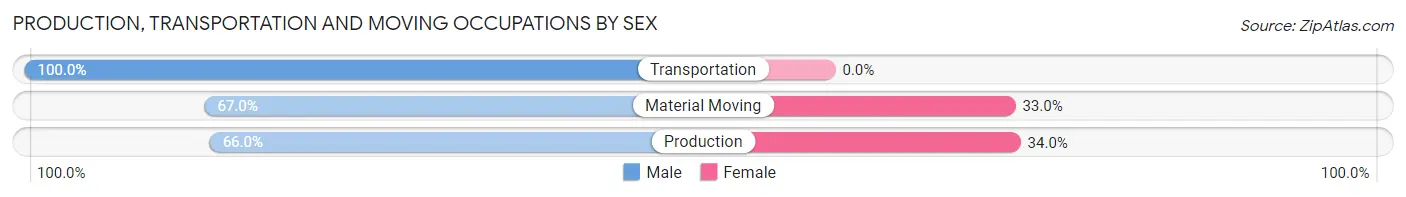
| Occupation | Male | Female |
| Production | 309 (66.0%) | 159 (34.0%) |
| Transportation | 186 (100.0%) | 0 (0.0%) |
| Material Moving | 288 (67.0%) | 142 (33.0%) |
| Total (Category) | 783 (72.2%) | 301 (27.8%) |
| Total (Overall) | 4,316 (52.6%) | 3,883 (47.4%) |
Employment Industries by Sex in Warrenville
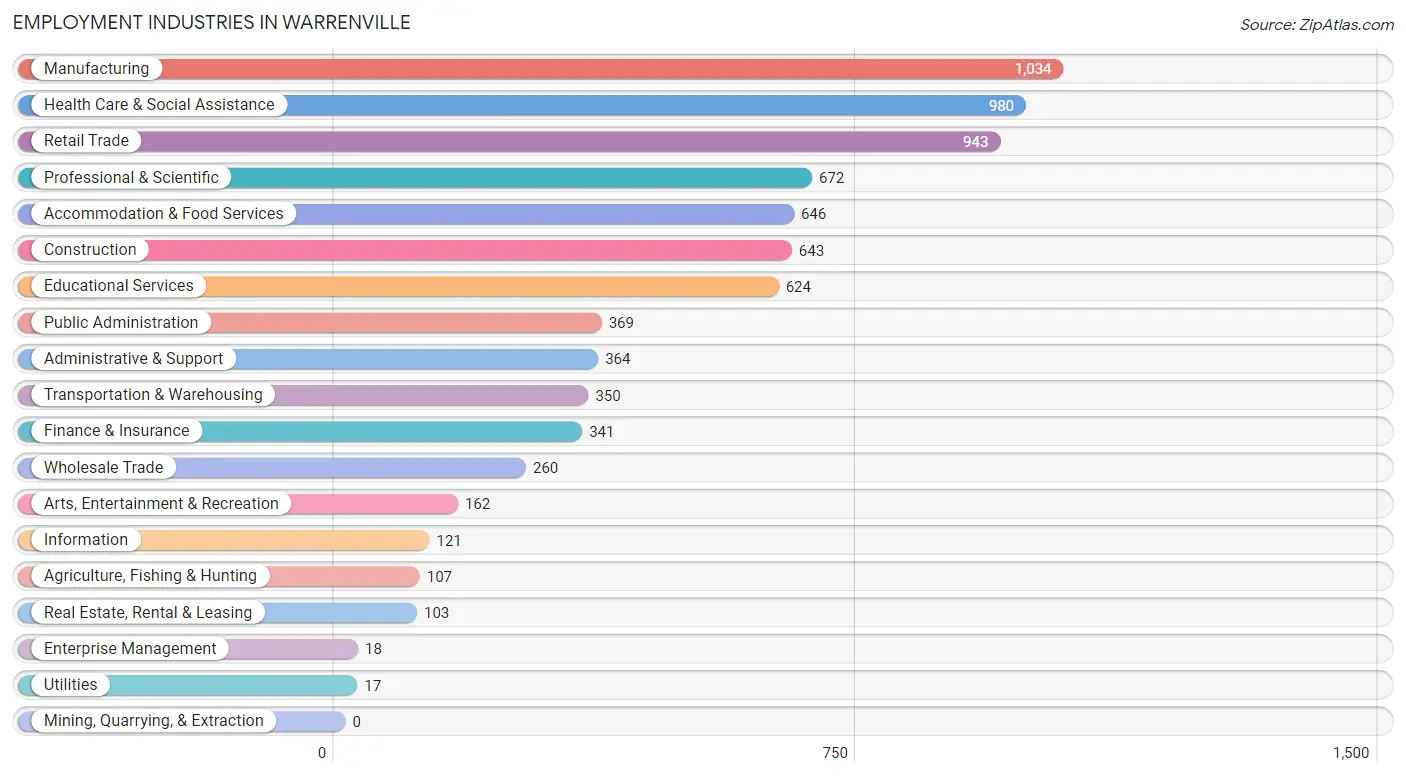
Employment Industries in Warrenville
The major employment industries in Warrenville include Manufacturing (1,034 | 12.6%), Health Care & Social Assistance (980 | 11.9%), Retail Trade (943 | 11.5%), Professional & Scientific (672 | 8.2%), and Accommodation & Food Services (646 | 7.9%).
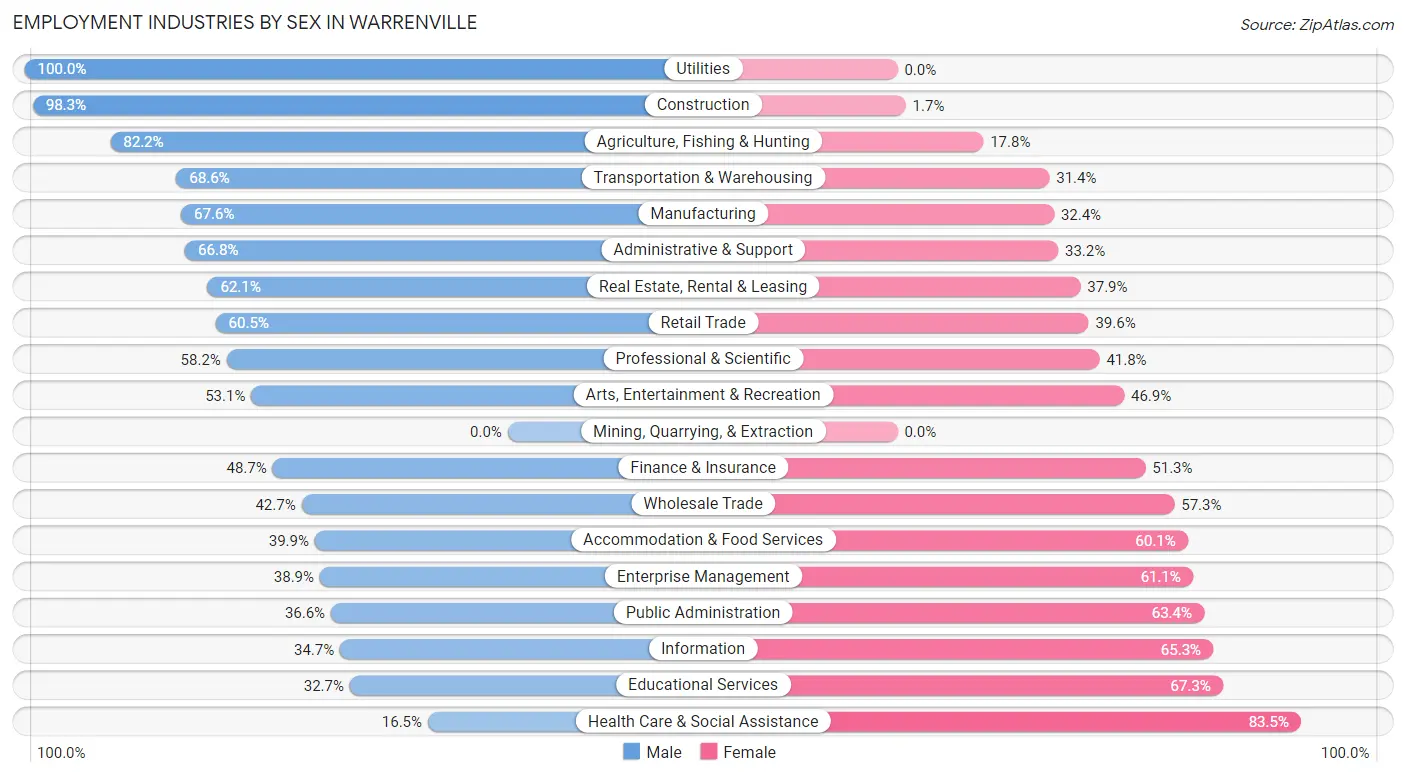
Employment Industries by Sex in Warrenville
The Warrenville industries that see more men than women are Utilities (100.0%), Construction (98.3%), and Agriculture, Fishing & Hunting (82.2%), whereas the industries that tend to have a higher number of women are Health Care & Social Assistance (83.5%), Educational Services (67.3%), and Information (65.3%).
| Industry | Male | Female |
| Agriculture, Fishing & Hunting | 88 (82.2%) | 19 (17.8%) |
| Mining, Quarrying, & Extraction | 0 (0.0%) | 0 (0.0%) |
| Construction | 632 (98.3%) | 11 (1.7%) |
| Manufacturing | 699 (67.6%) | 335 (32.4%) |
| Wholesale Trade | 111 (42.7%) | 149 (57.3%) |
| Retail Trade | 570 (60.5%) | 373 (39.6%) |
| Transportation & Warehousing | 240 (68.6%) | 110 (31.4%) |
| Utilities | 17 (100.0%) | 0 (0.0%) |
| Information | 42 (34.7%) | 79 (65.3%) |
| Finance & Insurance | 166 (48.7%) | 175 (51.3%) |
| Real Estate, Rental & Leasing | 64 (62.1%) | 39 (37.9%) |
| Professional & Scientific | 391 (58.2%) | 281 (41.8%) |
| Enterprise Management | 7 (38.9%) | 11 (61.1%) |
| Administrative & Support | 243 (66.8%) | 121 (33.2%) |
| Educational Services | 204 (32.7%) | 420 (67.3%) |
| Health Care & Social Assistance | 162 (16.5%) | 818 (83.5%) |
| Arts, Entertainment & Recreation | 86 (53.1%) | 76 (46.9%) |
| Accommodation & Food Services | 258 (39.9%) | 388 (60.1%) |
| Public Administration | 135 (36.6%) | 234 (63.4%) |
| Total | 4,316 (52.6%) | 3,883 (47.4%) |
Education in Warrenville
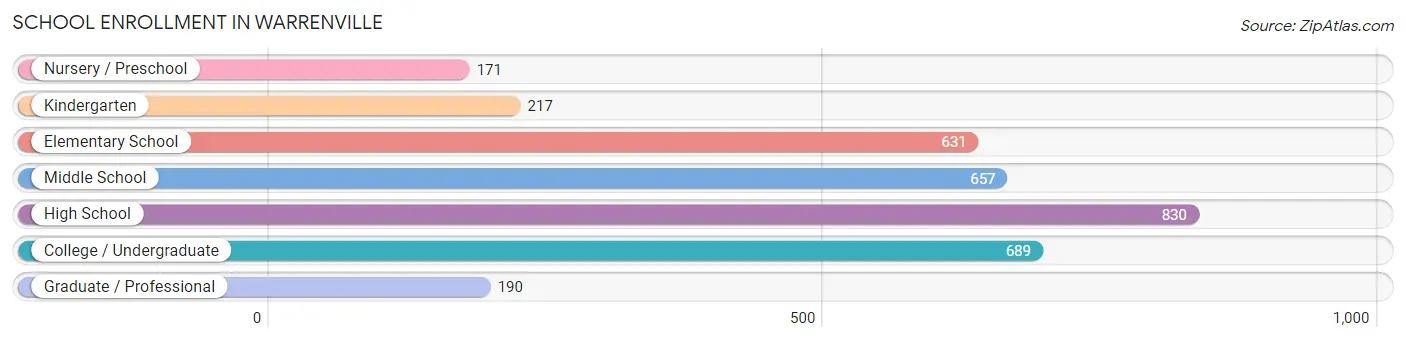
School Enrollment in Warrenville
The most common levels of schooling among the 3,385 students in Warrenville are high school (830 | 24.5%), college / undergraduate (689 | 20.3%), and middle school (657 | 19.4%).
| School Level | # Students | % Students |
| Nursery / Preschool | 171 | 5.1% |
| Kindergarten | 217 | 6.4% |
| Elementary School | 631 | 18.6% |
| Middle School | 657 | 19.4% |
| High School | 830 | 24.5% |
| College / Undergraduate | 689 | 20.3% |
| Graduate / Professional | 190 | 5.6% |
| Total | 3,385 | 100.0% |
School Enrollment by Age by Funding Source in Warrenville
Out of a total of 3,385 students who are enrolled in schools in Warrenville, 609 (18.0%) attend a private institution, while the remaining 2,776 (82.0%) are enrolled in public schools. The age group of 35 years and over has the highest likelihood of being enrolled in private schools, with 81 (62.8% in the age bracket) enrolled. Conversely, the age group of 10 to 14 year olds has the lowest likelihood of being enrolled in a private school, with 754 (96.5% in the age bracket) attending a public institution.
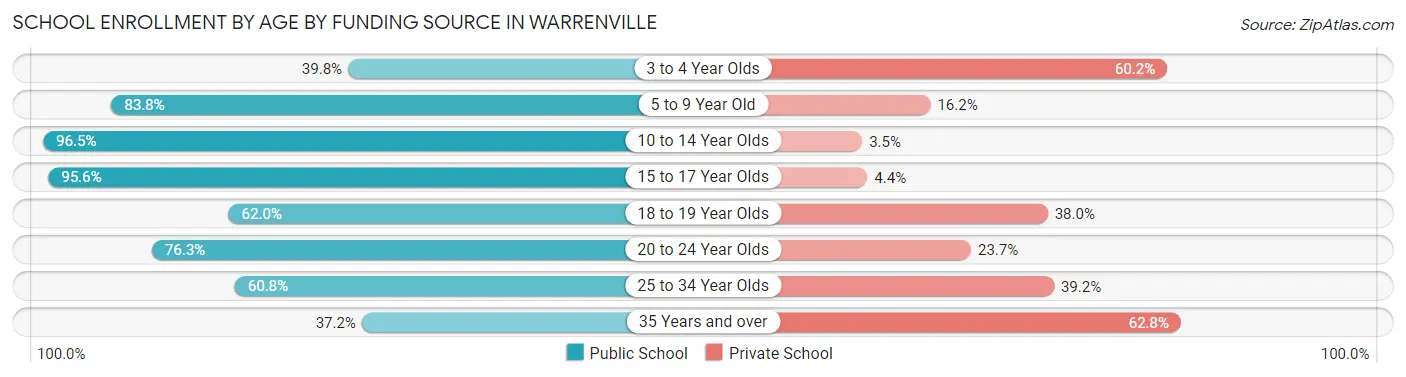
| Age Bracket | Public School | Private School |
| 3 to 4 Year Olds | 37 (39.8%) | 56 (60.2%) |
| 5 to 9 Year Old | 767 (83.8%) | 148 (16.2%) |
| 10 to 14 Year Olds | 754 (96.5%) | 27 (3.5%) |
| 15 to 17 Year Olds | 649 (95.6%) | 30 (4.4%) |
| 18 to 19 Year Olds | 137 (62.0%) | 84 (38.0%) |
| 20 to 24 Year Olds | 193 (76.3%) | 60 (23.7%) |
| 25 to 34 Year Olds | 191 (60.8%) | 123 (39.2%) |
| 35 Years and over | 48 (37.2%) | 81 (62.8%) |
| Total | 2,776 (82.0%) | 609 (18.0%) |
Educational Attainment by Field of Study in Warrenville
Business (854 | 19.2%), education (484 | 10.8%), science & technology (414 | 9.3%), bio, nature & agricultural (365 | 8.2%), and communications (348 | 7.8%) are the most common fields of study among 4,459 individuals in Warrenville who have obtained a bachelor's degree or higher.
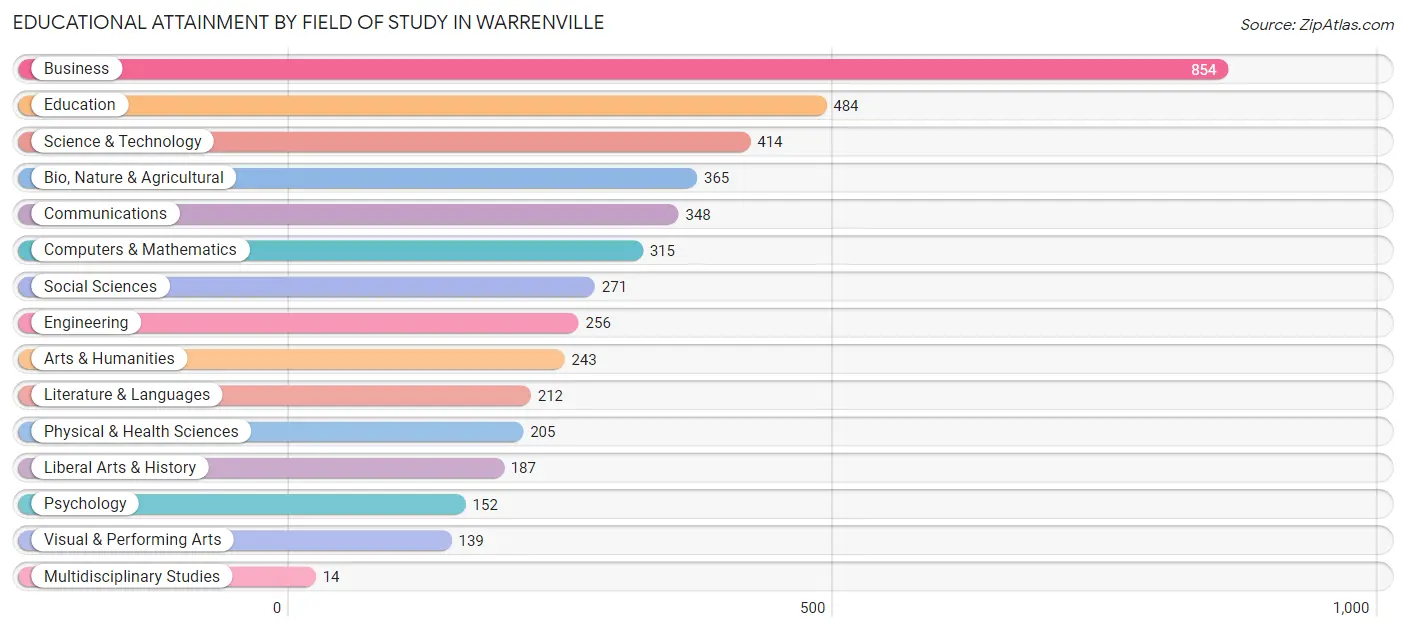
| Field of Study | # Graduates | % Graduates |
| Computers & Mathematics | 315 | 7.1% |
| Bio, Nature & Agricultural | 365 | 8.2% |
| Physical & Health Sciences | 205 | 4.6% |
| Psychology | 152 | 3.4% |
| Social Sciences | 271 | 6.1% |
| Engineering | 256 | 5.7% |
| Multidisciplinary Studies | 14 | 0.3% |
| Science & Technology | 414 | 9.3% |
| Business | 854 | 19.2% |
| Education | 484 | 10.8% |
| Literature & Languages | 212 | 4.8% |
| Liberal Arts & History | 187 | 4.2% |
| Visual & Performing Arts | 139 | 3.1% |
| Communications | 348 | 7.8% |
| Arts & Humanities | 243 | 5.4% |
| Total | 4,459 | 100.0% |
Transportation & Commute in Warrenville
Vehicle Availability by Sex in Warrenville
The most prevalent vehicle ownership categories in Warrenville are males with 2 vehicles (2,397, accounting for 55.9%) and females with 2 vehicles (1,988, making up 63.3%).
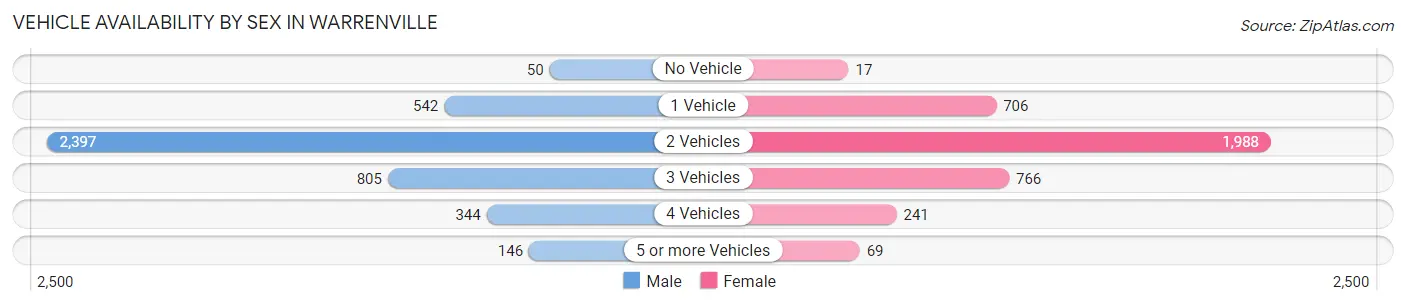
| Vehicles Available | Male | Female |
| No Vehicle | 50 (1.2%) | 17 (0.4%) |
| 1 Vehicle | 542 (12.7%) | 706 (18.6%) |
| 2 Vehicles | 2,397 (55.9%) | 1,988 (52.5%) |
| 3 Vehicles | 805 (18.8%) | 766 (20.2%) |
| 4 Vehicles | 344 (8.0%) | 241 (6.4%) |
| 5 or more Vehicles | 146 (3.4%) | 69 (1.8%) |
| Total | 4,284 (100.0%) | 3,787 (100.0%) |
Commute Time in Warrenville
The most frequently occuring commute durations in Warrenville are 15 to 19 minutes (1,707 commuters, 23.7%), 20 to 24 minutes (1,002 commuters, 13.9%), and 10 to 14 minutes (798 commuters, 11.1%).
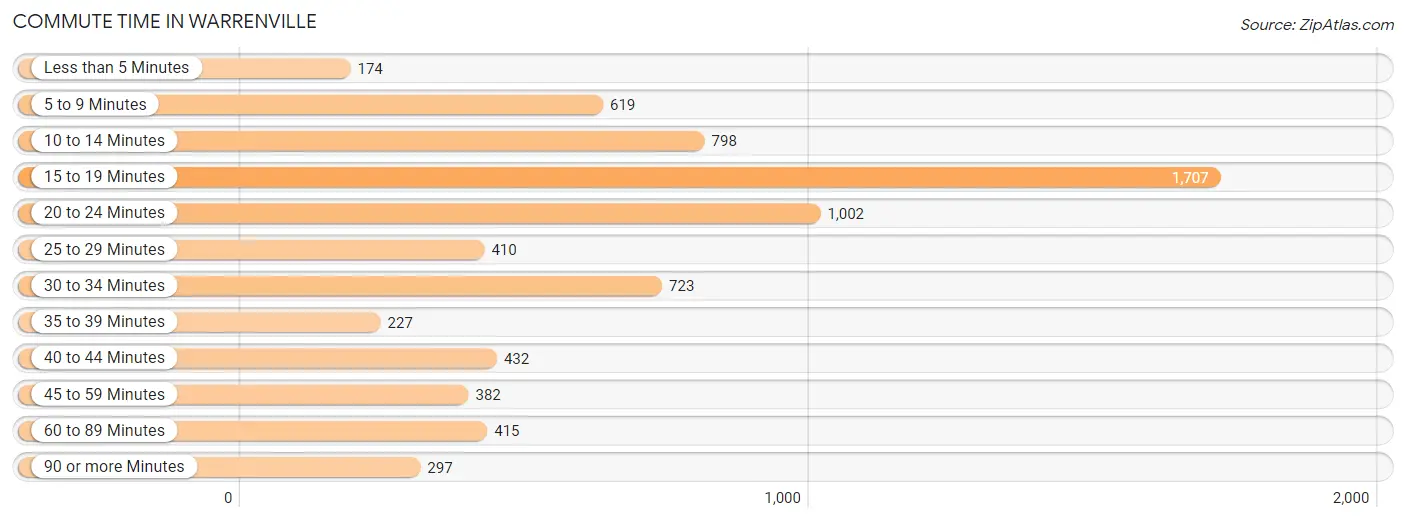
| Commute Time | # Commuters | % Commuters |
| Less than 5 Minutes | 174 | 2.4% |
| 5 to 9 Minutes | 619 | 8.6% |
| 10 to 14 Minutes | 798 | 11.1% |
| 15 to 19 Minutes | 1,707 | 23.7% |
| 20 to 24 Minutes | 1,002 | 13.9% |
| 25 to 29 Minutes | 410 | 5.7% |
| 30 to 34 Minutes | 723 | 10.1% |
| 35 to 39 Minutes | 227 | 3.2% |
| 40 to 44 Minutes | 432 | 6.0% |
| 45 to 59 Minutes | 382 | 5.3% |
| 60 to 89 Minutes | 415 | 5.8% |
| 90 or more Minutes | 297 | 4.1% |
Commute Time by Sex in Warrenville
The most common commute times in Warrenville are 15 to 19 minutes (843 commuters, 21.9%) for males and 15 to 19 minutes (864 commuters, 25.9%) for females.
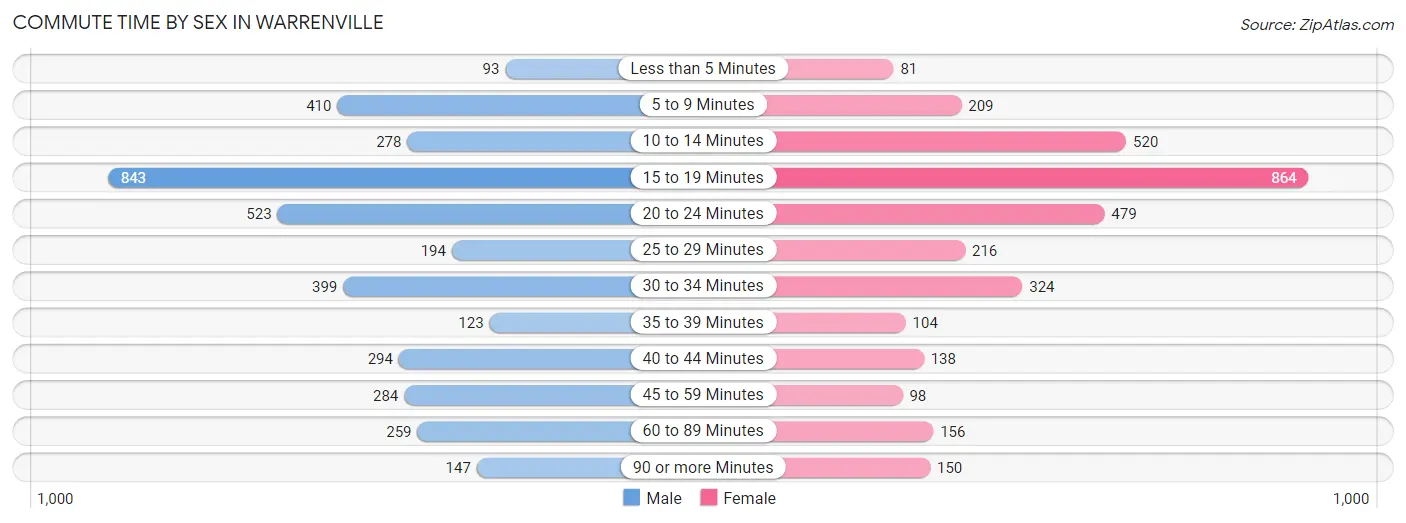
| Commute Time | Male | Female |
| Less than 5 Minutes | 93 (2.4%) | 81 (2.4%) |
| 5 to 9 Minutes | 410 (10.7%) | 209 (6.3%) |
| 10 to 14 Minutes | 278 (7.2%) | 520 (15.6%) |
| 15 to 19 Minutes | 843 (21.9%) | 864 (25.9%) |
| 20 to 24 Minutes | 523 (13.6%) | 479 (14.3%) |
| 25 to 29 Minutes | 194 (5.0%) | 216 (6.5%) |
| 30 to 34 Minutes | 399 (10.4%) | 324 (9.7%) |
| 35 to 39 Minutes | 123 (3.2%) | 104 (3.1%) |
| 40 to 44 Minutes | 294 (7.6%) | 138 (4.1%) |
| 45 to 59 Minutes | 284 (7.4%) | 98 (2.9%) |
| 60 to 89 Minutes | 259 (6.7%) | 156 (4.7%) |
| 90 or more Minutes | 147 (3.8%) | 150 (4.5%) |
Time of Departure to Work by Sex in Warrenville
The most frequent times of departure to work in Warrenville are 7:00 AM to 7:29 AM (646, 16.8%) for males and 7:00 AM to 7:29 AM (735, 22.0%) for females.
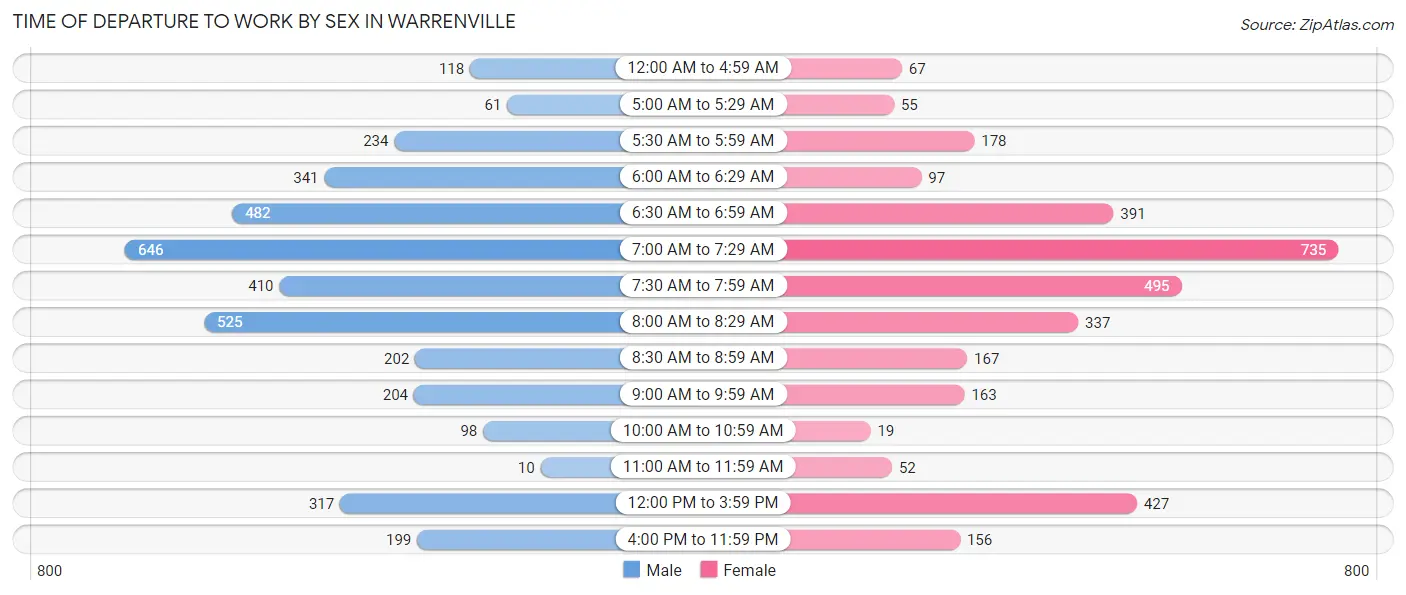
| Time of Departure | Male | Female |
| 12:00 AM to 4:59 AM | 118 (3.1%) | 67 (2.0%) |
| 5:00 AM to 5:29 AM | 61 (1.6%) | 55 (1.7%) |
| 5:30 AM to 5:59 AM | 234 (6.1%) | 178 (5.3%) |
| 6:00 AM to 6:29 AM | 341 (8.9%) | 97 (2.9%) |
| 6:30 AM to 6:59 AM | 482 (12.5%) | 391 (11.7%) |
| 7:00 AM to 7:29 AM | 646 (16.8%) | 735 (22.0%) |
| 7:30 AM to 7:59 AM | 410 (10.7%) | 495 (14.8%) |
| 8:00 AM to 8:29 AM | 525 (13.7%) | 337 (10.1%) |
| 8:30 AM to 8:59 AM | 202 (5.2%) | 167 (5.0%) |
| 9:00 AM to 9:59 AM | 204 (5.3%) | 163 (4.9%) |
| 10:00 AM to 10:59 AM | 98 (2.5%) | 19 (0.6%) |
| 11:00 AM to 11:59 AM | 10 (0.3%) | 52 (1.6%) |
| 12:00 PM to 3:59 PM | 317 (8.2%) | 427 (12.8%) |
| 4:00 PM to 11:59 PM | 199 (5.2%) | 156 (4.7%) |
| Total | 3,847 (100.0%) | 3,339 (100.0%) |
Housing Occupancy in Warrenville
Occupancy by Ownership in Warrenville
Of the total 5,475 dwellings in Warrenville, owner-occupied units account for 4,327 (79.0%), while renter-occupied units make up 1,148 (21.0%).
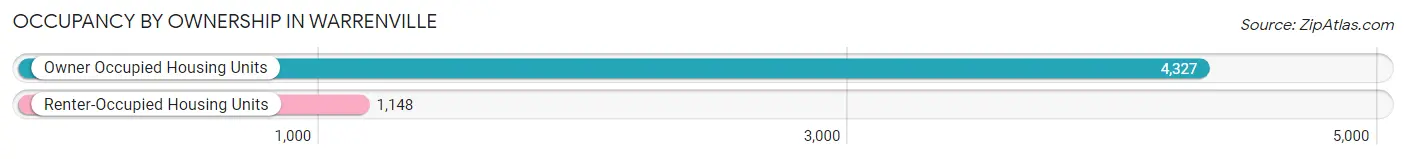
| Occupancy | # Housing Units | % Housing Units |
| Owner Occupied Housing Units | 4,327 | 79.0% |
| Renter-Occupied Housing Units | 1,148 | 21.0% |
| Total Occupied Housing Units | 5,475 | 100.0% |
Occupancy by Household Size in Warrenville
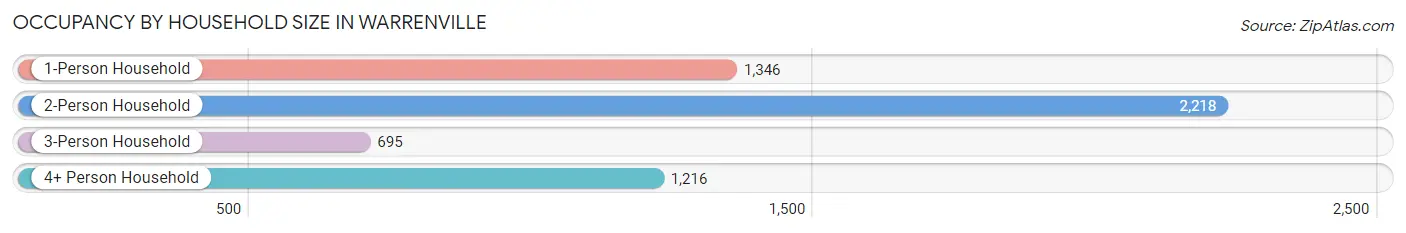
| Household Size | # Housing Units | % Housing Units |
| 1-Person Household | 1,346 | 24.6% |
| 2-Person Household | 2,218 | 40.5% |
| 3-Person Household | 695 | 12.7% |
| 4+ Person Household | 1,216 | 22.2% |
| Total Housing Units | 5,475 | 100.0% |
Occupancy by Ownership by Household Size in Warrenville
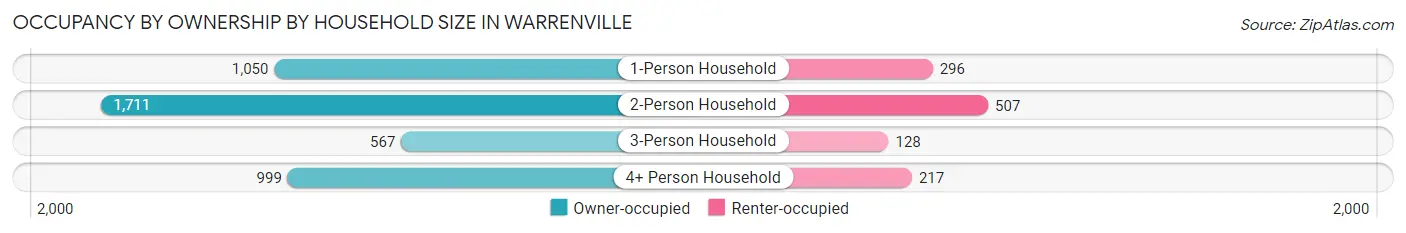
| Household Size | Owner-occupied | Renter-occupied |
| 1-Person Household | 1,050 (78.0%) | 296 (22.0%) |
| 2-Person Household | 1,711 (77.1%) | 507 (22.9%) |
| 3-Person Household | 567 (81.6%) | 128 (18.4%) |
| 4+ Person Household | 999 (82.2%) | 217 (17.8%) |
| Total Housing Units | 4,327 (79.0%) | 1,148 (21.0%) |
Occupancy by Educational Attainment in Warrenville
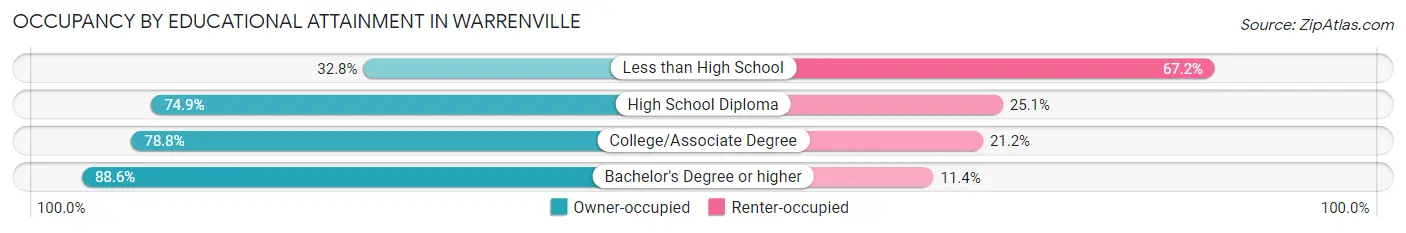
| Household Size | Owner-occupied | Renter-occupied |
| Less than High School | 134 (32.8%) | 274 (67.2%) |
| High School Diploma | 763 (74.9%) | 256 (25.1%) |
| College/Associate Degree | 1,266 (78.8%) | 340 (21.2%) |
| Bachelor's Degree or higher | 2,164 (88.6%) | 278 (11.4%) |
Occupancy by Age of Householder in Warrenville
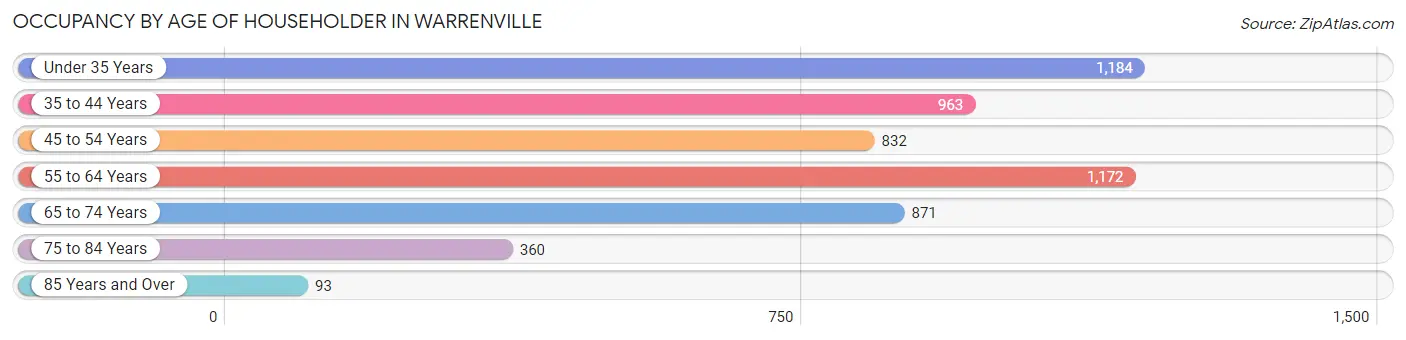
| Age Bracket | # Households | % Households |
| Under 35 Years | 1,184 | 21.6% |
| 35 to 44 Years | 963 | 17.6% |
| 45 to 54 Years | 832 | 15.2% |
| 55 to 64 Years | 1,172 | 21.4% |
| 65 to 74 Years | 871 | 15.9% |
| 75 to 84 Years | 360 | 6.6% |
| 85 Years and Over | 93 | 1.7% |
| Total | 5,475 | 100.0% |
Housing Finances in Warrenville
Median Income by Occupancy in Warrenville
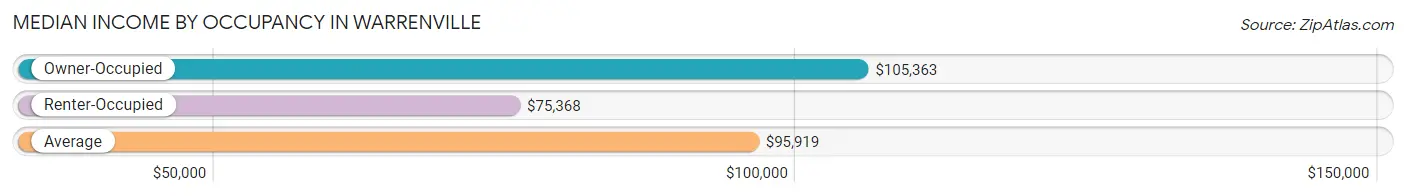
| Occupancy Type | # Households | Median Income |
| Owner-Occupied | 4,327 (79.0%) | $105,363 |
| Renter-Occupied | 1,148 (21.0%) | $75,368 |
| Average | 5,475 (100.0%) | $95,919 |
Occupancy by Householder Income Bracket in Warrenville
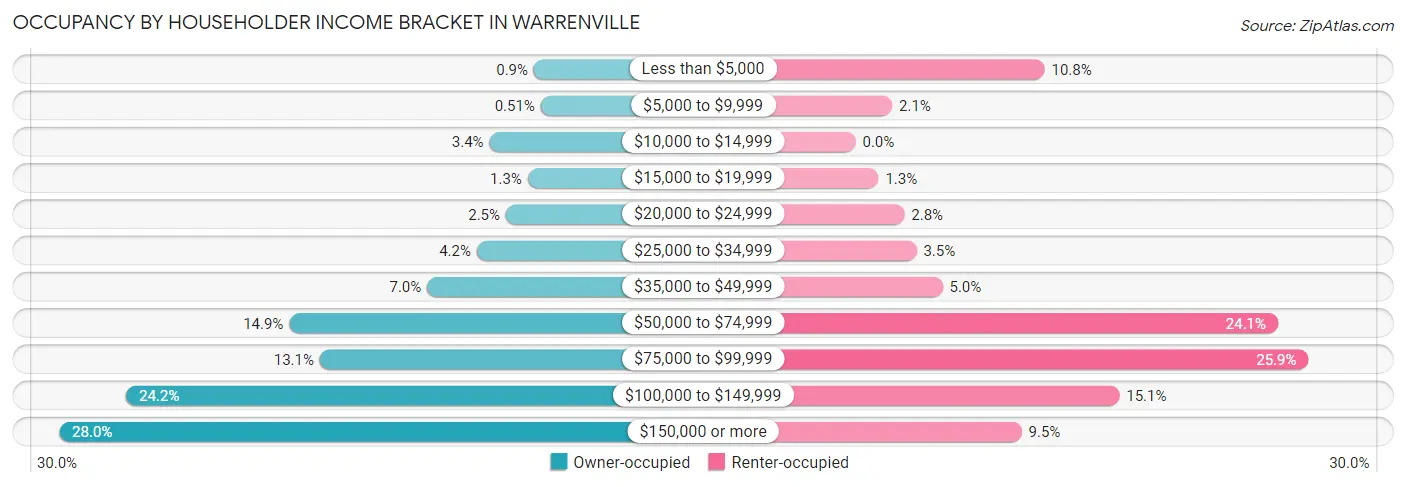
| Income Bracket | Owner-occupied | Renter-occupied |
| Less than $5,000 | 39 (0.9%) | 124 (10.8%) |
| $5,000 to $9,999 | 22 (0.5%) | 24 (2.1%) |
| $10,000 to $14,999 | 149 (3.4%) | 0 (0.0%) |
| $15,000 to $19,999 | 54 (1.3%) | 15 (1.3%) |
| $20,000 to $24,999 | 108 (2.5%) | 32 (2.8%) |
| $25,000 to $34,999 | 180 (4.2%) | 40 (3.5%) |
| $35,000 to $49,999 | 303 (7.0%) | 57 (5.0%) |
| $50,000 to $74,999 | 644 (14.9%) | 277 (24.1%) |
| $75,000 to $99,999 | 568 (13.1%) | 297 (25.9%) |
| $100,000 to $149,999 | 1,047 (24.2%) | 173 (15.1%) |
| $150,000 or more | 1,213 (28.0%) | 109 (9.5%) |
| Total | 4,327 (100.0%) | 1,148 (100.0%) |
Monthly Housing Cost Tiers in Warrenville
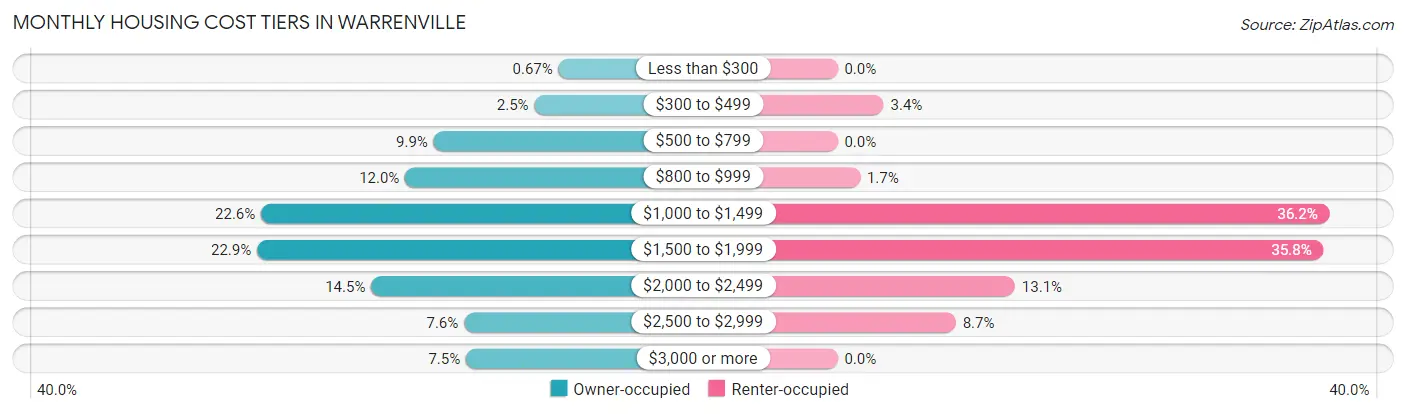
| Monthly Cost | Owner-occupied | Renter-occupied |
| Less than $300 | 29 (0.7%) | 0 (0.0%) |
| $300 to $499 | 106 (2.5%) | 39 (3.4%) |
| $500 to $799 | 427 (9.9%) | 0 (0.0%) |
| $800 to $999 | 518 (12.0%) | 19 (1.7%) |
| $1,000 to $1,499 | 977 (22.6%) | 416 (36.2%) |
| $1,500 to $1,999 | 990 (22.9%) | 411 (35.8%) |
| $2,000 to $2,499 | 626 (14.5%) | 150 (13.1%) |
| $2,500 to $2,999 | 330 (7.6%) | 100 (8.7%) |
| $3,000 or more | 324 (7.5%) | 0 (0.0%) |
| Total | 4,327 (100.0%) | 1,148 (100.0%) |
Physical Housing Characteristics in Warrenville
Housing Structures in Warrenville
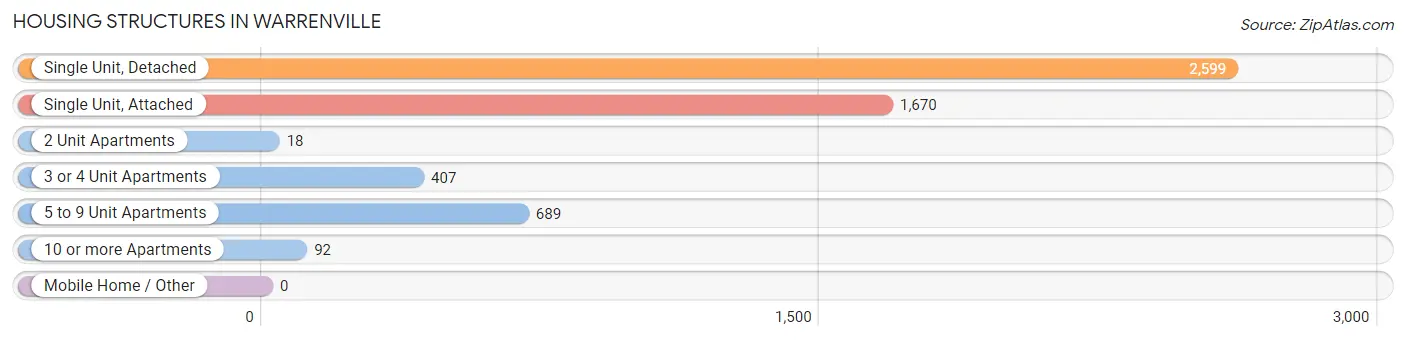
| Structure Type | # Housing Units | % Housing Units |
| Single Unit, Detached | 2,599 | 47.5% |
| Single Unit, Attached | 1,670 | 30.5% |
| 2 Unit Apartments | 18 | 0.3% |
| 3 or 4 Unit Apartments | 407 | 7.4% |
| 5 to 9 Unit Apartments | 689 | 12.6% |
| 10 or more Apartments | 92 | 1.7% |
| Mobile Home / Other | 0 | 0.0% |
| Total | 5,475 | 100.0% |
Housing Structures by Occupancy in Warrenville
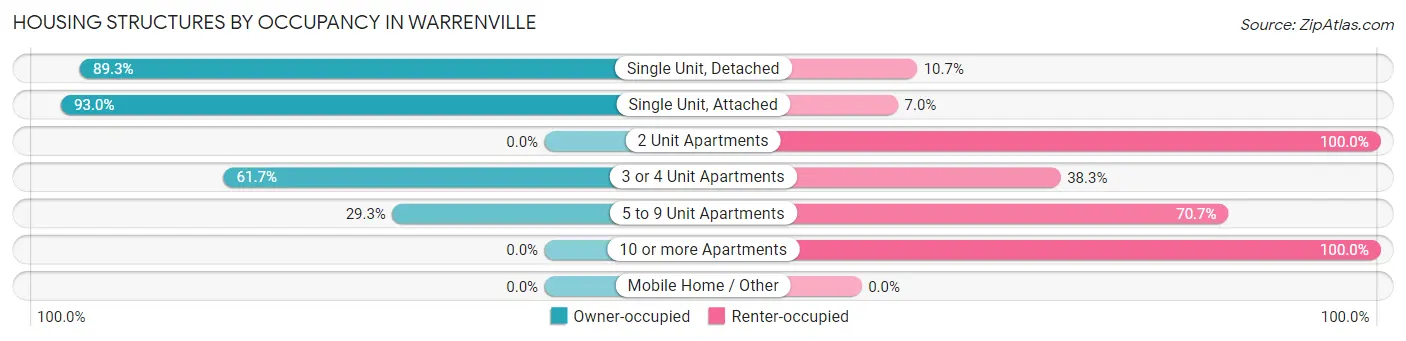
| Structure Type | Owner-occupied | Renter-occupied |
| Single Unit, Detached | 2,321 (89.3%) | 278 (10.7%) |
| Single Unit, Attached | 1,553 (93.0%) | 117 (7.0%) |
| 2 Unit Apartments | 0 (0.0%) | 18 (100.0%) |
| 3 or 4 Unit Apartments | 251 (61.7%) | 156 (38.3%) |
| 5 to 9 Unit Apartments | 202 (29.3%) | 487 (70.7%) |
| 10 or more Apartments | 0 (0.0%) | 92 (100.0%) |
| Mobile Home / Other | 0 (0.0%) | 0 (0.0%) |
| Total | 4,327 (79.0%) | 1,148 (21.0%) |
Housing Structures by Number of Rooms in Warrenville
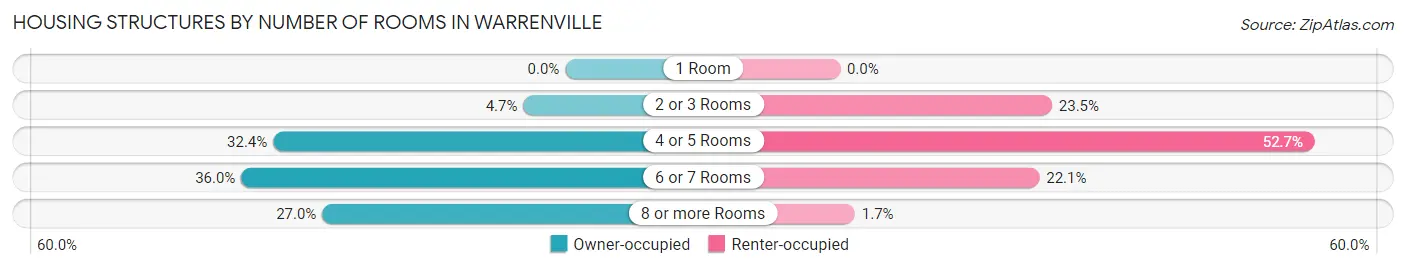
| Number of Rooms | Owner-occupied | Renter-occupied |
| 1 Room | 0 (0.0%) | 0 (0.0%) |
| 2 or 3 Rooms | 201 (4.6%) | 270 (23.5%) |
| 4 or 5 Rooms | 1,403 (32.4%) | 605 (52.7%) |
| 6 or 7 Rooms | 1,556 (36.0%) | 254 (22.1%) |
| 8 or more Rooms | 1,167 (27.0%) | 19 (1.7%) |
| Total | 4,327 (100.0%) | 1,148 (100.0%) |
Housing Structure by Heating Type in Warrenville
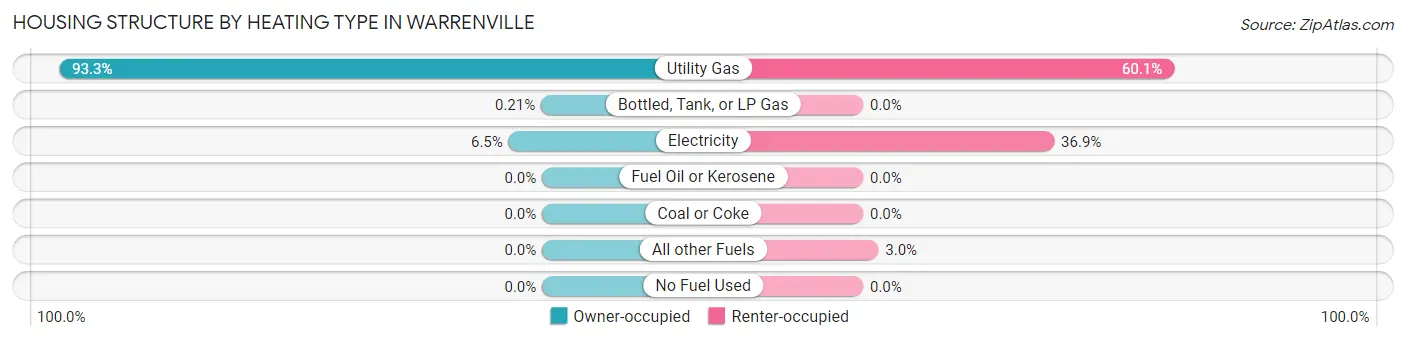
| Heating Type | Owner-occupied | Renter-occupied |
| Utility Gas | 4,038 (93.3%) | 690 (60.1%) |
| Bottled, Tank, or LP Gas | 9 (0.2%) | 0 (0.0%) |
| Electricity | 280 (6.5%) | 424 (36.9%) |
| Fuel Oil or Kerosene | 0 (0.0%) | 0 (0.0%) |
| Coal or Coke | 0 (0.0%) | 0 (0.0%) |
| All other Fuels | 0 (0.0%) | 34 (3.0%) |
| No Fuel Used | 0 (0.0%) | 0 (0.0%) |
| Total | 4,327 (100.0%) | 1,148 (100.0%) |
Household Vehicle Usage in Warrenville
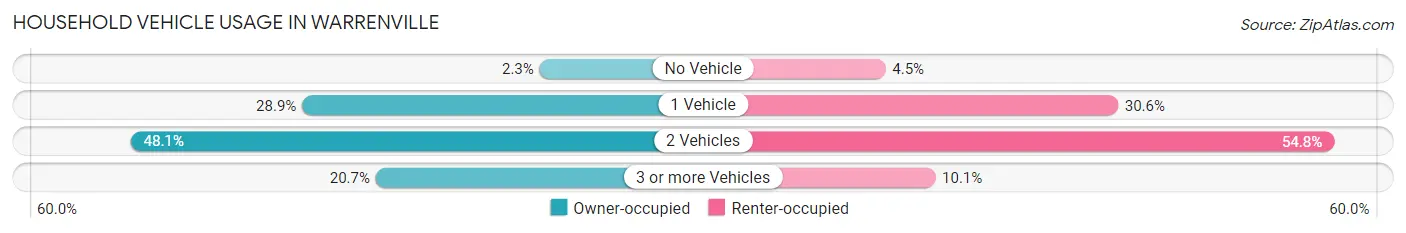
| Vehicles per Household | Owner-occupied | Renter-occupied |
| No Vehicle | 100 (2.3%) | 52 (4.5%) |
| 1 Vehicle | 1,251 (28.9%) | 351 (30.6%) |
| 2 Vehicles | 2,082 (48.1%) | 629 (54.8%) |
| 3 or more Vehicles | 894 (20.7%) | 116 (10.1%) |
| Total | 4,327 (100.0%) | 1,148 (100.0%) |
Real Estate & Mortgages in Warrenville
Real Estate and Mortgage Overview in Warrenville
| Characteristic | Without Mortgage | With Mortgage |
| Housing Units | 1,241 | 3,086 |
| Median Property Value | $238,500 | $263,500 |
| Median Household Income | $80,179 | $1,018 |
| Monthly Housing Costs | $862 | $324 |
| Real Estate Taxes | $5,764 | $72 |
Property Value by Mortgage Status in Warrenville
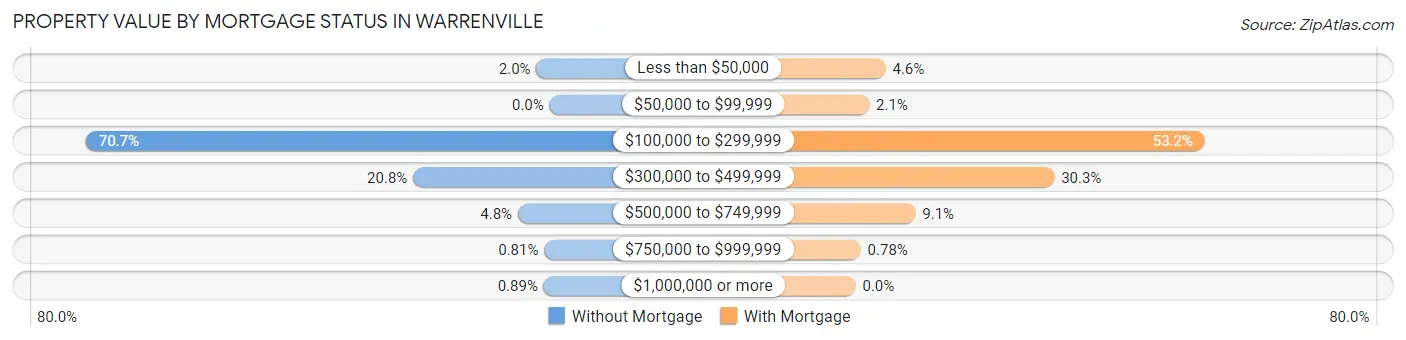
| Property Value | Without Mortgage | With Mortgage |
| Less than $50,000 | 25 (2.0%) | 141 (4.6%) |
| $50,000 to $99,999 | 0 (0.0%) | 64 (2.1%) |
| $100,000 to $299,999 | 877 (70.7%) | 1,642 (53.2%) |
| $300,000 to $499,999 | 258 (20.8%) | 934 (30.3%) |
| $500,000 to $749,999 | 60 (4.8%) | 281 (9.1%) |
| $750,000 to $999,999 | 10 (0.8%) | 24 (0.8%) |
| $1,000,000 or more | 11 (0.9%) | 0 (0.0%) |
| Total | 1,241 (100.0%) | 3,086 (100.0%) |
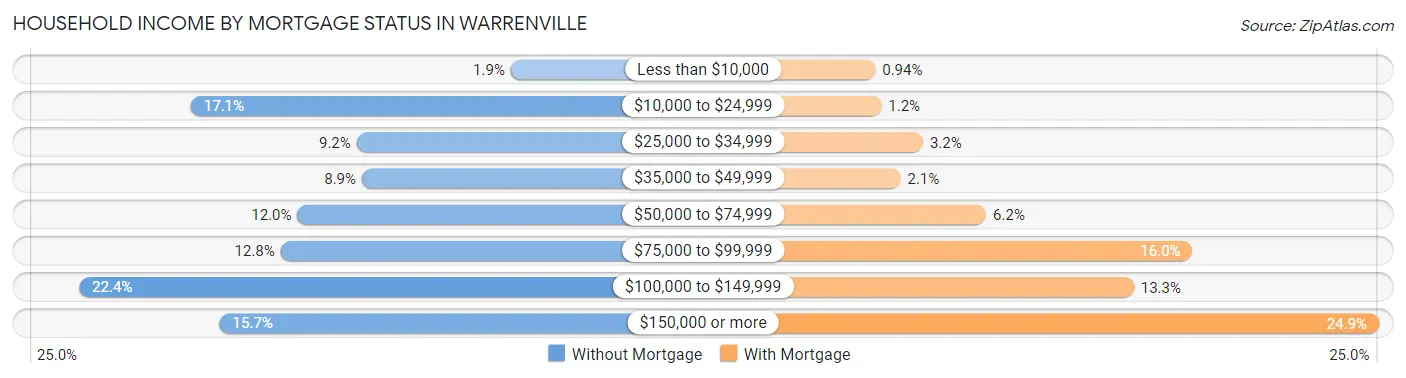
Household Income by Mortgage Status in Warrenville
| Household Income | Without Mortgage | With Mortgage |
| Less than $10,000 | 23 (1.8%) | 29 (0.9%) |
| $10,000 to $24,999 | 212 (17.1%) | 38 (1.2%) |
| $25,000 to $34,999 | 114 (9.2%) | 99 (3.2%) |
| $35,000 to $49,999 | 111 (8.9%) | 66 (2.1%) |
| $50,000 to $74,999 | 149 (12.0%) | 192 (6.2%) |
| $75,000 to $99,999 | 159 (12.8%) | 495 (16.0%) |
| $100,000 to $149,999 | 278 (22.4%) | 409 (13.3%) |
| $150,000 or more | 195 (15.7%) | 769 (24.9%) |
| Total | 1,241 (100.0%) | 3,086 (100.0%) |
Property Value to Household Income Ratio in Warrenville
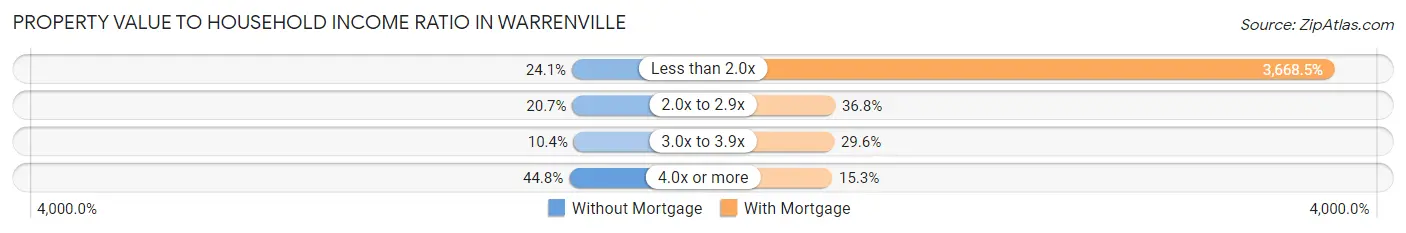
| Value-to-Income Ratio | Without Mortgage | With Mortgage |
| Less than 2.0x | 299 (24.1%) | 113,211 (3,668.5%) |
| 2.0x to 2.9x | 257 (20.7%) | 1,135 (36.8%) |
| 3.0x to 3.9x | 129 (10.4%) | 913 (29.6%) |
| 4.0x or more | 556 (44.8%) | 471 (15.3%) |
| Total | 1,241 (100.0%) | 3,086 (100.0%) |
Real Estate Taxes by Mortgage Status in Warrenville
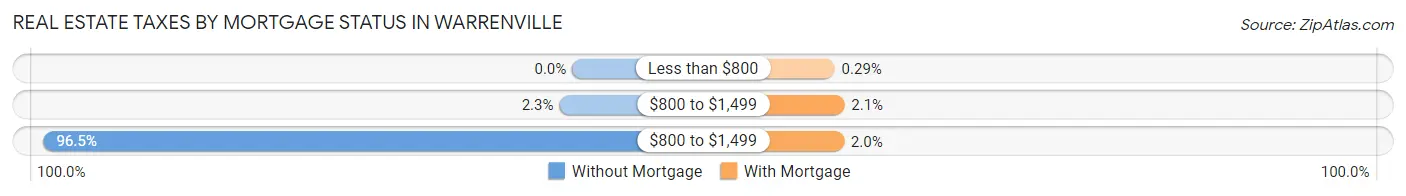
| Property Taxes | Without Mortgage | With Mortgage |
| Less than $800 | 0 (0.0%) | 9 (0.3%) |
| $800 to $1,499 | 29 (2.3%) | 64 (2.1%) |
| $800 to $1,499 | 1,198 (96.5%) | 61 (2.0%) |
| Total | 1,241 (100.0%) | 3,086 (100.0%) |
Health & Disability in Warrenville
Health Insurance Coverage by Age in Warrenville
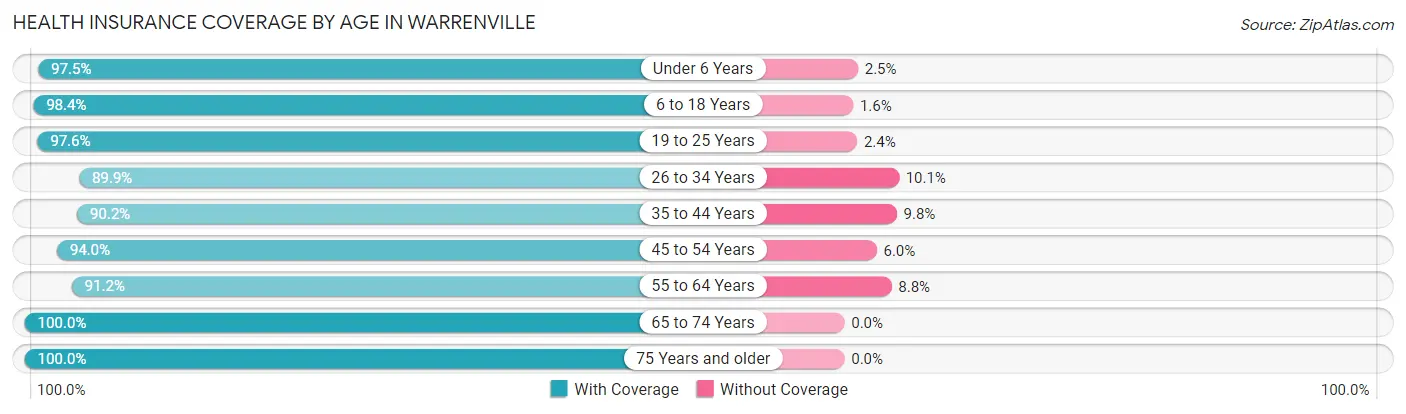
| Age Bracket | With Coverage | Without Coverage |
| Under 6 Years | 659 (97.5%) | 17 (2.5%) |
| 6 to 18 Years | 2,387 (98.4%) | 39 (1.6%) |
| 19 to 25 Years | 1,028 (97.6%) | 25 (2.4%) |
| 26 to 34 Years | 1,808 (89.9%) | 204 (10.1%) |
| 35 to 44 Years | 1,711 (90.2%) | 185 (9.8%) |
| 45 to 54 Years | 1,643 (94.0%) | 105 (6.0%) |
| 55 to 64 Years | 1,672 (91.2%) | 161 (8.8%) |
| 65 to 74 Years | 1,596 (100.0%) | 0 (0.0%) |
| 75 Years and older | 656 (100.0%) | 0 (0.0%) |
| Total | 13,160 (94.7%) | 736 (5.3%) |
Health Insurance Coverage by Citizenship Status in Warrenville
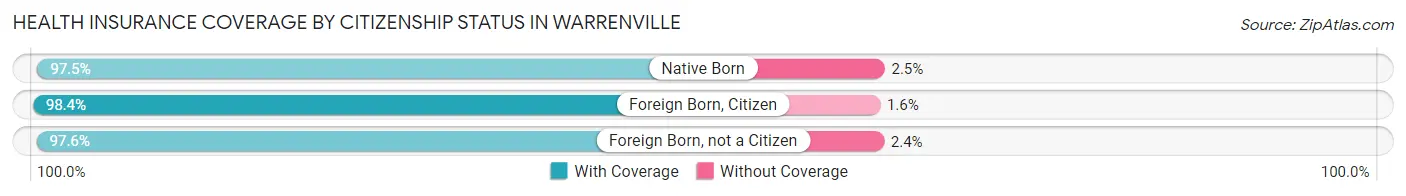
| Citizenship Status | With Coverage | Without Coverage |
| Native Born | 659 (97.5%) | 17 (2.5%) |
| Foreign Born, Citizen | 2,387 (98.4%) | 39 (1.6%) |
| Foreign Born, not a Citizen | 1,028 (97.6%) | 25 (2.4%) |
Health Insurance Coverage by Household Income in Warrenville
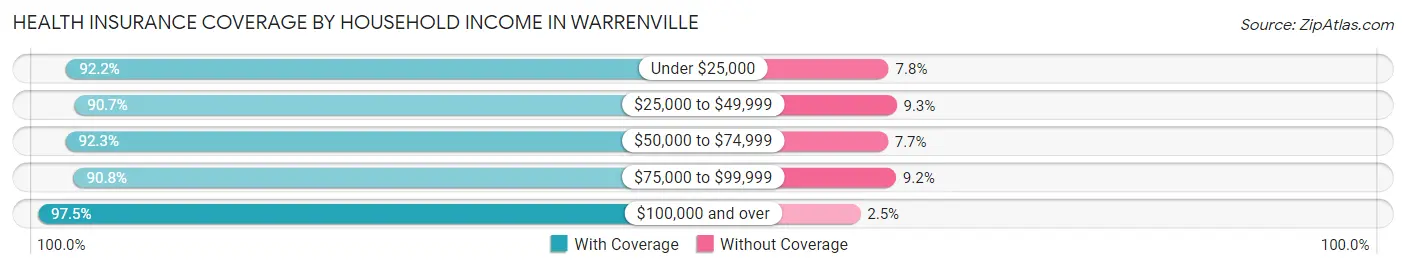
| Household Income | With Coverage | Without Coverage |
| Under $25,000 | 1,046 (92.2%) | 89 (7.8%) |
| $25,000 to $49,999 | 1,031 (90.7%) | 106 (9.3%) |
| $50,000 to $74,999 | 1,960 (92.3%) | 163 (7.7%) |
| $75,000 to $99,999 | 1,875 (90.8%) | 190 (9.2%) |
| $100,000 and over | 7,223 (97.5%) | 188 (2.5%) |
Public vs Private Health Insurance Coverage by Age in Warrenville
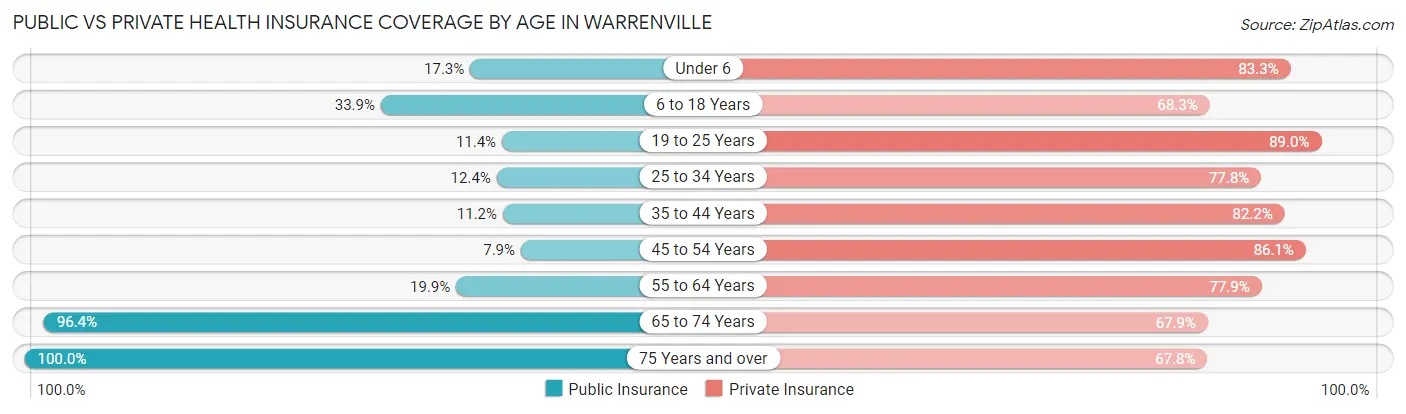
| Age Bracket | Public Insurance | Private Insurance |
| Under 6 | 117 (17.3%) | 563 (83.3%) |
| 6 to 18 Years | 822 (33.9%) | 1,656 (68.3%) |
| 19 to 25 Years | 120 (11.4%) | 937 (89.0%) |
| 25 to 34 Years | 249 (12.4%) | 1,566 (77.8%) |
| 35 to 44 Years | 213 (11.2%) | 1,558 (82.2%) |
| 45 to 54 Years | 138 (7.9%) | 1,505 (86.1%) |
| 55 to 64 Years | 365 (19.9%) | 1,428 (77.9%) |
| 65 to 74 Years | 1,539 (96.4%) | 1,084 (67.9%) |
| 75 Years and over | 656 (100.0%) | 445 (67.8%) |
| Total | 4,219 (30.4%) | 10,742 (77.3%) |
Disability Status by Sex by Age in Warrenville
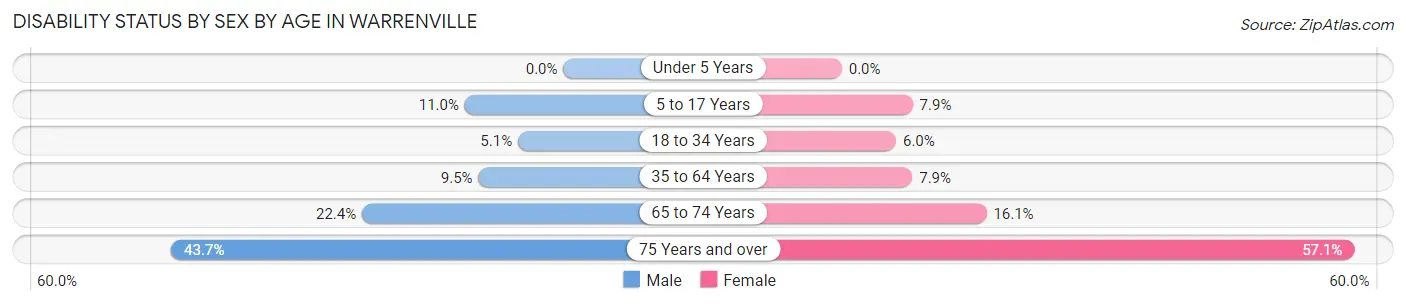
| Age Bracket | Male | Female |
| Under 5 Years | 0 (0.0%) | 0 (0.0%) |
| 5 to 17 Years | 136 (11.0%) | 98 (7.9%) |
| 18 to 34 Years | 78 (5.1%) | 101 (6.0%) |
| 35 to 64 Years | 266 (9.5%) | 209 (7.9%) |
| 65 to 74 Years | 163 (22.4%) | 140 (16.1%) |
| 75 Years and over | 135 (43.7%) | 198 (57.1%) |
Disability Class by Sex by Age in Warrenville
Disability Class: Hearing Difficulty
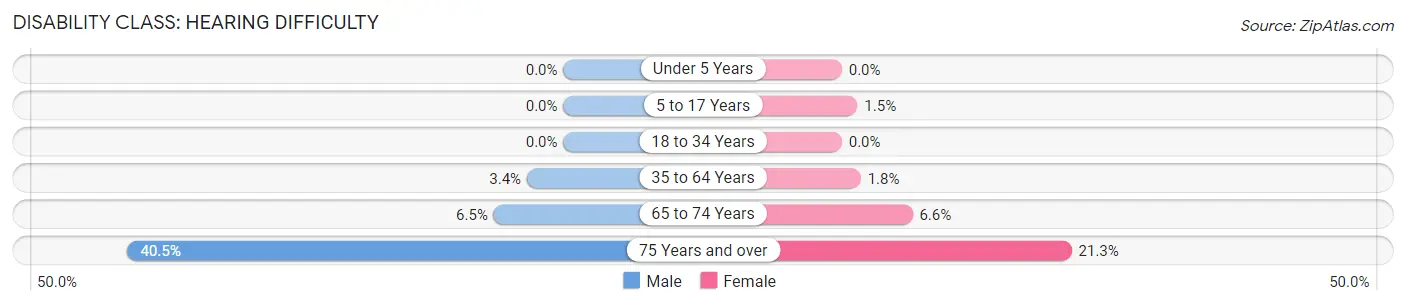
| Age Bracket | Male | Female |
| Under 5 Years | 0 (0.0%) | 0 (0.0%) |
| 5 to 17 Years | 0 (0.0%) | 18 (1.5%) |
| 18 to 34 Years | 0 (0.0%) | 0 (0.0%) |
| 35 to 64 Years | 95 (3.4%) | 47 (1.8%) |
| 65 to 74 Years | 47 (6.5%) | 57 (6.6%) |
| 75 Years and over | 125 (40.5%) | 74 (21.3%) |
Disability Class: Vision Difficulty
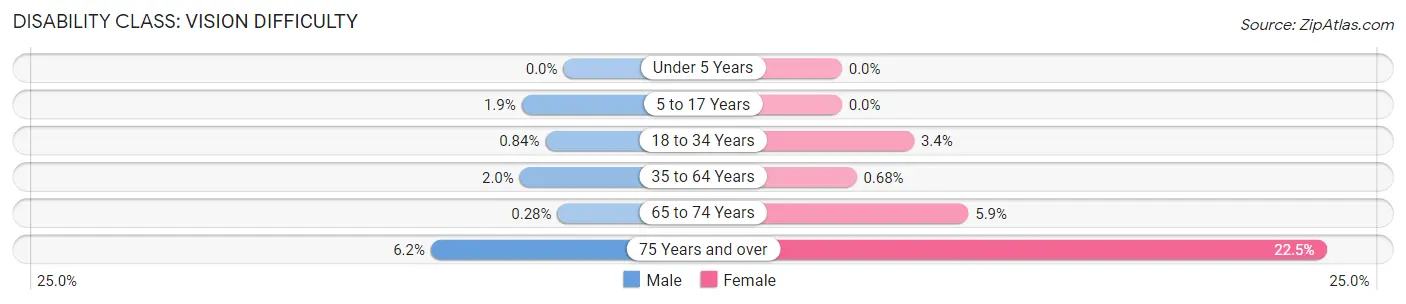
| Age Bracket | Male | Female |
| Under 5 Years | 0 (0.0%) | 0 (0.0%) |
| 5 to 17 Years | 24 (1.9%) | 0 (0.0%) |
| 18 to 34 Years | 13 (0.8%) | 56 (3.4%) |
| 35 to 64 Years | 57 (2.0%) | 18 (0.7%) |
| 65 to 74 Years | 2 (0.3%) | 51 (5.9%) |
| 75 Years and over | 19 (6.1%) | 78 (22.5%) |
Disability Class: Cognitive Difficulty
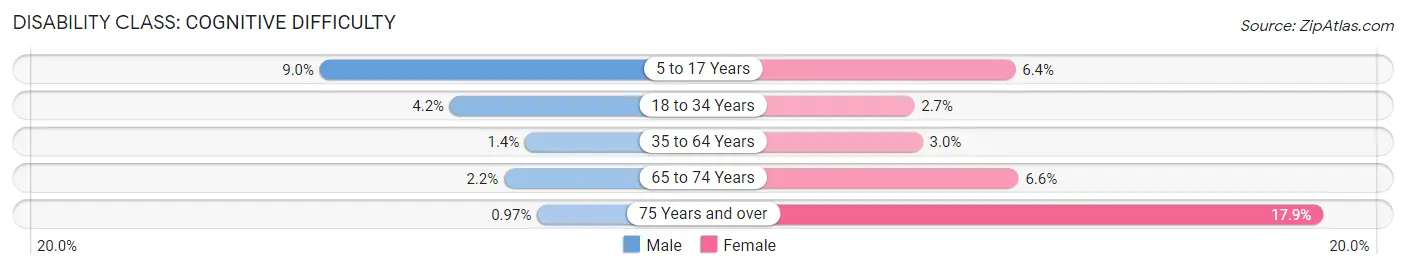
| Age Bracket | Male | Female |
| 5 to 17 Years | 112 (9.0%) | 80 (6.4%) |
| 18 to 34 Years | 65 (4.2%) | 45 (2.7%) |
| 35 to 64 Years | 40 (1.4%) | 80 (3.0%) |
| 65 to 74 Years | 16 (2.2%) | 57 (6.6%) |
| 75 Years and over | 3 (1.0%) | 62 (17.9%) |
Disability Class: Ambulatory Difficulty
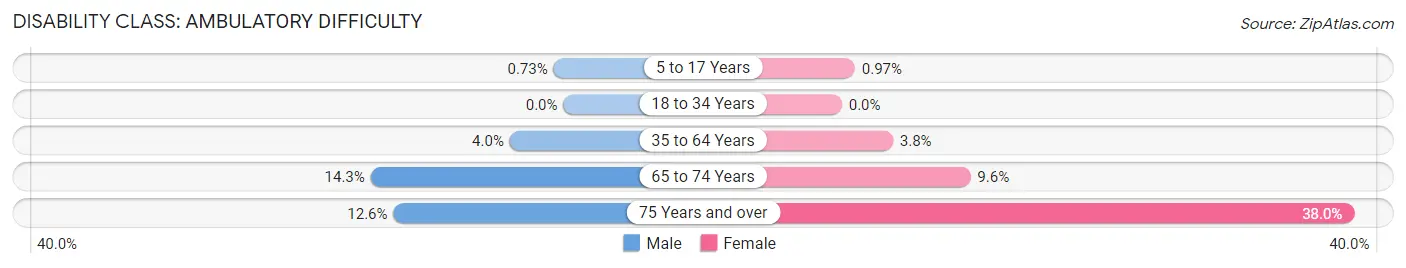
| Age Bracket | Male | Female |
| 5 to 17 Years | 9 (0.7%) | 12 (1.0%) |
| 18 to 34 Years | 0 (0.0%) | 0 (0.0%) |
| 35 to 64 Years | 112 (4.0%) | 101 (3.8%) |
| 65 to 74 Years | 104 (14.3%) | 83 (9.6%) |
| 75 Years and over | 39 (12.6%) | 132 (38.0%) |
Disability Class: Self-Care Difficulty
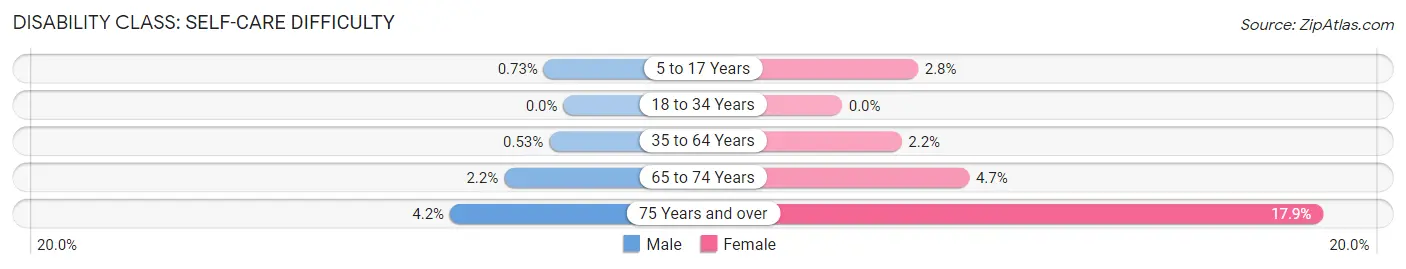
| Age Bracket | Male | Female |
| 5 to 17 Years | 9 (0.7%) | 35 (2.8%) |
| 18 to 34 Years | 0 (0.0%) | 0 (0.0%) |
| 35 to 64 Years | 15 (0.5%) | 59 (2.2%) |
| 65 to 74 Years | 16 (2.2%) | 41 (4.7%) |
| 75 Years and over | 13 (4.2%) | 62 (17.9%) |
Technology Access in Warrenville
Computing Device Access in Warrenville
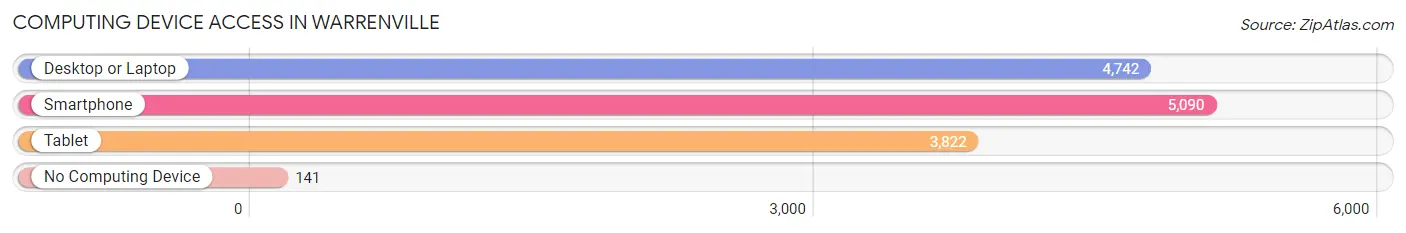
| Device Type | # Households | % Households |
| Desktop or Laptop | 4,742 | 86.6% |
| Smartphone | 5,090 | 93.0% |
| Tablet | 3,822 | 69.8% |
| No Computing Device | 141 | 2.6% |
| Total | 5,475 | 100.0% |
Internet Access in Warrenville
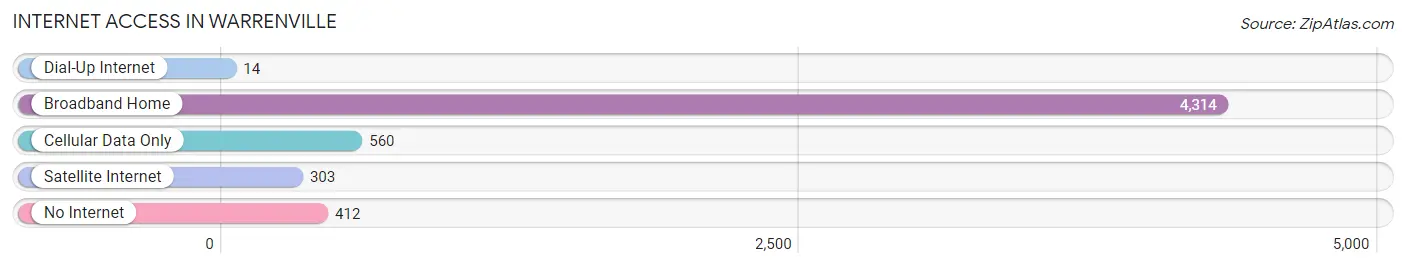
| Internet Type | # Households | % Households |
| Dial-Up Internet | 14 | 0.3% |
| Broadband Home | 4,314 | 78.8% |
| Cellular Data Only | 560 | 10.2% |
| Satellite Internet | 303 | 5.5% |
| No Internet | 412 | 7.5% |
| Total | 5,475 | 100.0% |
Warrenville Summary
Warrenville, IL is a small city located in DuPage County, Illinois, approximately 28 miles west of Chicago. The city is part of the Chicago metropolitan area and is home to a population of 13,140 people as of the 2010 census.
History
The area that is now Warrenville was first settled in the 1830s by settlers from New England. The first settler was William Warren, who built a log cabin in the area in 1833. The area was known as Warren’s Grove until 1837, when it was officially incorporated as the Village of Warrenville. The village was named after William Warren, who was the first settler in the area.
In the late 19th century, the village was a small farming community. The population of the village grew slowly until the 1950s, when the population began to increase rapidly due to the growth of the Chicago metropolitan area. The village was officially incorporated as a city in 1967.
Geography
Warrenville is located in DuPage County, Illinois, approximately 28 miles west of Chicago. The city is located in the Fox River Valley and is bordered by Naperville to the north, Winfield to the east, and Wheaton to the south. The city has a total area of 5.2 square miles, all of which is land.
The city is located in a flat, low-lying area and is surrounded by several small lakes and ponds. The Fox River runs through the city and is a popular recreational area for fishing, boating, and swimming.
Economy
The economy of Warrenville is largely based on manufacturing and technology. The city is home to several large companies, including Navistar International, Caterpillar, and Molex. The city is also home to several small businesses, including restaurants, retail stores, and professional services.
The city is also home to several educational institutions, including the College of DuPage, Northern Illinois University, and the University of Illinois at Chicago.
Demographics
As of the 2010 census, the population of Warrenville was 13,140 people. The racial makeup of the city was 87.3% White, 5.2% African American, 0.3% Native American, 3.2% Asian, and 3.9% from other races. The median household income was $76,837 and the median family income was $90,945.
The city is home to a large number of families, with 33.3% of households having children under the age of 18. The city is also home to a large number of seniors, with 16.3% of the population over the age of 65.
Conclusion
Warrenville, IL is a small city located in DuPage County, Illinois, approximately 28 miles west of Chicago. The city is part of the Chicago metropolitan area and is home to a population of 13,140 people as of the 2010 census. The city has a diverse economy, with a large manufacturing and technology sector, as well as several educational institutions. The city is also home to a large number of families and seniors, making it a great place to live for all ages.
Common Questions
What is Per Capita Income in Warrenville?
Per Capita income in Warrenville is $45,050.
What is the Median Family Income in Warrenville?
Median Family Income in Warrenville is $106,801.
What is the Median Household income in Warrenville?
Median Household Income in Warrenville is $95,919.
What is Income or Wage Gap in Warrenville?
Income or Wage Gap in Warrenville is 20.6%.
Women in Warrenville earn 79.4 cents for every dollar earned by a man.
What is Inequality or Gini Index in Warrenville?
Inequality or Gini Index in Warrenville is 0.39.
What is the Total Population of Warrenville?
Total Population of Warrenville is 13,945.
What is the Total Male Population of Warrenville?
Total Male Population of Warrenville is 6,880.
What is the Total Female Population of Warrenville?
Total Female Population of Warrenville is 7,065.
What is the Ratio of Males per 100 Females in Warrenville?
There are 97.38 Males per 100 Females in Warrenville.
What is the Ratio of Females per 100 Males in Warrenville?
There are 102.69 Females per 100 Males in Warrenville.
What is the Median Population Age in Warrenville?
Median Population Age in Warrenville is 38.5 Years.
What is the Average Family Size in Warrenville
Average Family Size in Warrenville is 3.2 People.
What is the Average Household Size in Warrenville
Average Household Size in Warrenville is 2.5 People.
How Large is the Labor Force in Warrenville?
There are 8,491 People in the Labor Forcein in Warrenville.
What is the Percentage of People in the Labor Force in Warrenville?
74.4% of People are in the Labor Force in Warrenville.
What is the Unemployment Rate in Warrenville?
Unemployment Rate in Warrenville is 3.5%.