Cities with the Most Immigrants from Northern Africa in New Jersey
RELATED REPORTS & OPTIONS
Northern Africa
New Jersey
Compare Cities
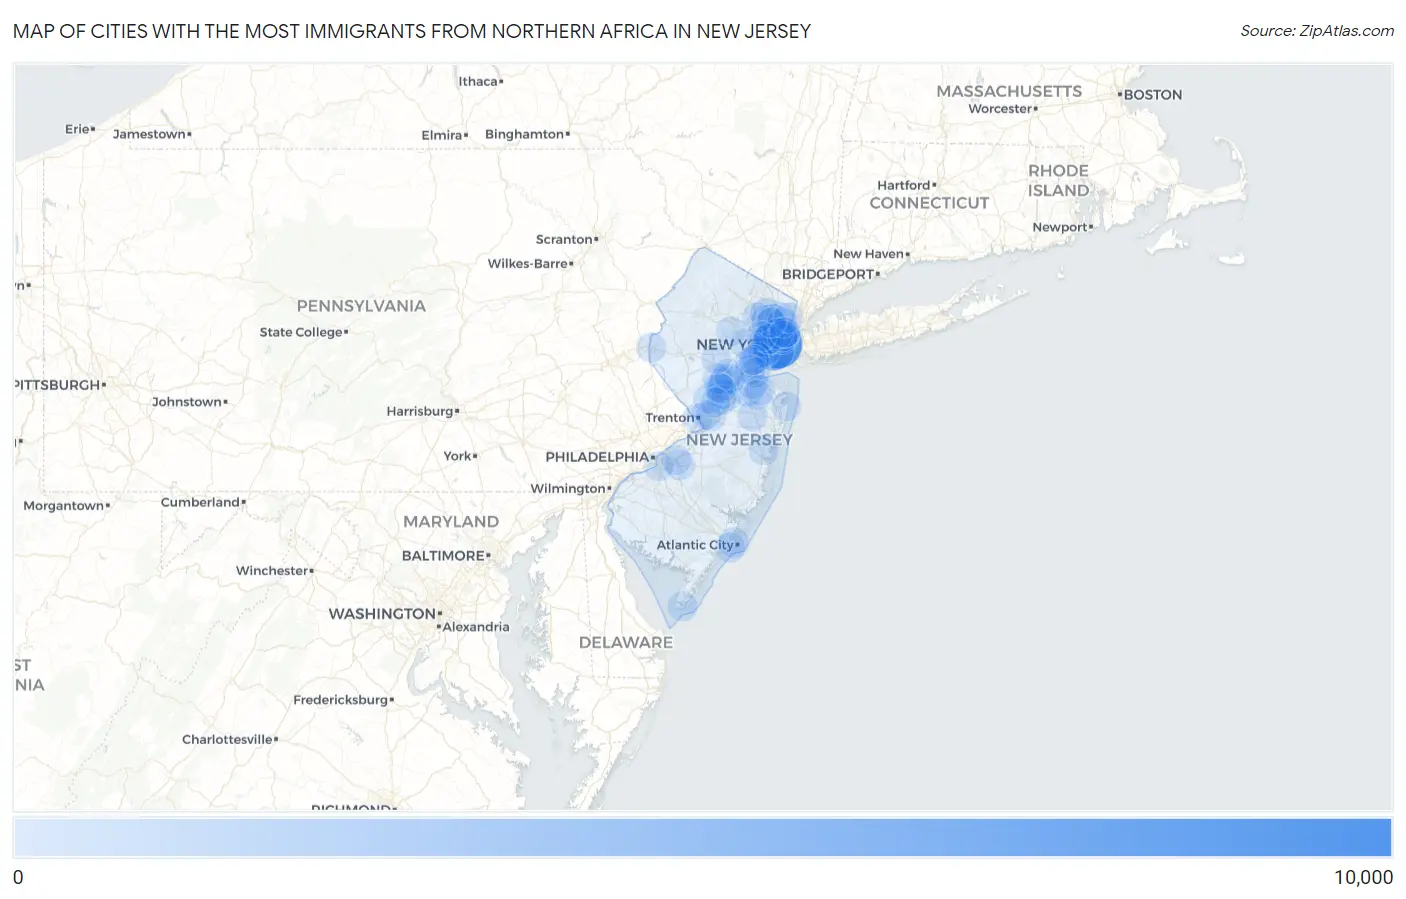
Map of Cities with the Most Immigrants from Northern Africa in New Jersey
0
10,000
Cities with the Most Immigrants from Northern Africa in New Jersey
| City | Northern Africa | vs State | vs National | |
| 1. | Jersey City | 8,077 | 42,620(18.95%)#1 | 421,832(1.91%)#2 |
| 2. | Bayonne | 4,454 | 42,620(10.45%)#2 | 421,832(1.06%)#5 |
| 3. | Clifton | 1,053 | 42,620(2.47%)#3 | 421,832(0.25%)#38 |
| 4. | Sayreville Borough | 813 | 42,620(1.91%)#4 | 421,832(0.19%)#54 |
| 5. | Paterson | 715 | 42,620(1.68%)#5 | 421,832(0.17%)#69 |
| 6. | Elizabeth | 629 | 42,620(1.48%)#6 | 421,832(0.15%)#86 |
| 7. | Union Beach Borough | 576 | 42,620(1.35%)#7 | 421,832(0.14%)#97 |
| 8. | Tinton Falls Borough | 466 | 42,620(1.09%)#8 | 421,832(0.11%)#127 |
| 9. | Milltown Borough | 438 | 42,620(1.03%)#9 | 421,832(0.10%)#139 |
| 10. | Kearny | 342 | 42,620(0.80%)#10 | 421,832(0.08%)#193 |
| 11. | Newark | 299 | 42,620(0.70%)#11 | 421,832(0.07%)#234 |
| 12. | Lodi Borough | 294 | 42,620(0.69%)#12 | 421,832(0.07%)#237 |
| 13. | Middlesex Borough | 289 | 42,620(0.68%)#13 | 421,832(0.07%)#242 |
| 14. | Preakness | 284 | 42,620(0.67%)#14 | 421,832(0.07%)#250 |
| 15. | West New York | 250 | 42,620(0.59%)#15 | 421,832(0.06%)#280 |
| 16. | Old Bridge | 247 | 42,620(0.58%)#16 | 421,832(0.06%)#285 |
| 17. | North Arlington Borough | 242 | 42,620(0.57%)#17 | 421,832(0.06%)#288 |
| 18. | Franklin Park | 240 | 42,620(0.56%)#18 | 421,832(0.06%)#292 |
| 19. | Woodland Park Borough | 228 | 42,620(0.53%)#19 | 421,832(0.05%)#308 |
| 20. | Dayton | 228 | 42,620(0.53%)#20 | 421,832(0.05%)#309 |
| 21. | South River Borough | 223 | 42,620(0.52%)#21 | 421,832(0.05%)#320 |
| 22. | Madison Park | 211 | 42,620(0.50%)#22 | 421,832(0.05%)#347 |
| 23. | Singac | 209 | 42,620(0.49%)#23 | 421,832(0.05%)#352 |
| 24. | Fairview Borough | 196 | 42,620(0.46%)#24 | 421,832(0.05%)#377 |
| 25. | Hoboken | 194 | 42,620(0.46%)#25 | 421,832(0.05%)#382 |
| 26. | Avenel | 188 | 42,620(0.44%)#26 | 421,832(0.04%)#396 |
| 27. | West Freehold | 187 | 42,620(0.44%)#27 | 421,832(0.04%)#401 |
| 28. | Linden | 182 | 42,620(0.43%)#28 | 421,832(0.04%)#411 |
| 29. | Fort Lee Borough | 181 | 42,620(0.42%)#29 | 421,832(0.04%)#412 |
| 30. | Summit | 169 | 42,620(0.40%)#30 | 421,832(0.04%)#435 |
| 31. | Little Ferry Borough | 165 | 42,620(0.39%)#31 | 421,832(0.04%)#447 |
| 32. | Trenton | 162 | 42,620(0.38%)#32 | 421,832(0.04%)#454 |
| 33. | Hackensack | 161 | 42,620(0.38%)#33 | 421,832(0.04%)#458 |
| 34. | Colonia | 161 | 42,620(0.38%)#34 | 421,832(0.04%)#459 |
| 35. | North Caldwell Borough | 153 | 42,620(0.36%)#35 | 421,832(0.04%)#480 |
| 36. | Cape May | 152 | 42,620(0.36%)#36 | 421,832(0.04%)#485 |
| 37. | Roselle Park Borough | 149 | 42,620(0.35%)#37 | 421,832(0.04%)#496 |
| 38. | Sicklerville | 141 | 42,620(0.33%)#38 | 421,832(0.03%)#524 |
| 39. | Mount Arlington Borough | 136 | 42,620(0.32%)#39 | 421,832(0.03%)#540 |
| 40. | Garfield | 133 | 42,620(0.31%)#40 | 421,832(0.03%)#546 |
| 41. | Perth Amboy | 131 | 42,620(0.31%)#41 | 421,832(0.03%)#550 |
| 42. | Atlantic City | 130 | 42,620(0.31%)#42 | 421,832(0.03%)#556 |
| 43. | Secaucus | 130 | 42,620(0.31%)#43 | 421,832(0.03%)#557 |
| 44. | Hamilton Square | 127 | 42,620(0.30%)#44 | 421,832(0.03%)#568 |
| 45. | Hillsborough | 122 | 42,620(0.29%)#45 | 421,832(0.03%)#591 |
| 46. | Carlstadt Borough | 121 | 42,620(0.28%)#46 | 421,832(0.03%)#595 |
| 47. | Union City | 120 | 42,620(0.28%)#47 | 421,832(0.03%)#596 |
| 48. | Mckee | 119 | 42,620(0.28%)#48 | 421,832(0.03%)#601 |
| 49. | Harrison | 114 | 42,620(0.27%)#49 | 421,832(0.03%)#623 |
| 50. | Fair Lawn Borough | 112 | 42,620(0.26%)#50 | 421,832(0.03%)#636 |
| 51. | Monmouth Junction | 112 | 42,620(0.26%)#51 | 421,832(0.03%)#638 |
| 52. | Voorhees | 110 | 42,620(0.26%)#52 | 421,832(0.03%)#648 |
| 53. | Marlton | 108 | 42,620(0.25%)#53 | 421,832(0.03%)#654 |
| 54. | Ridgefield Park | 105 | 42,620(0.25%)#54 | 421,832(0.02%)#673 |
| 55. | Six Mile Run | 104 | 42,620(0.24%)#55 | 421,832(0.02%)#678 |
| 56. | Cliffside Park Borough | 103 | 42,620(0.24%)#56 | 421,832(0.02%)#680 |
| 57. | Princeton | 101 | 42,620(0.24%)#57 | 421,832(0.02%)#692 |
| 58. | Fords | 100 | 42,620(0.23%)#58 | 421,832(0.02%)#695 |
| 59. | Montvale Borough | 96 | 42,620(0.23%)#59 | 421,832(0.02%)#719 |
| 60. | Strathmore | 96 | 42,620(0.23%)#60 | 421,832(0.02%)#720 |
| 61. | Wallington Borough | 92 | 42,620(0.22%)#61 | 421,832(0.02%)#742 |
| 62. | Blackwells Mills | 92 | 42,620(0.22%)#62 | 421,832(0.02%)#743 |
| 63. | Englewood | 91 | 42,620(0.21%)#63 | 421,832(0.02%)#750 |
| 64. | East Orange | 87 | 42,620(0.20%)#64 | 421,832(0.02%)#766 |
| 65. | Allendale Borough | 87 | 42,620(0.20%)#65 | 421,832(0.02%)#771 |
| 66. | Toms River | 86 | 42,620(0.20%)#66 | 421,832(0.02%)#773 |
| 67. | Princeton Meadows | 82 | 42,620(0.19%)#67 | 421,832(0.02%)#798 |
| 68. | Somerset | 80 | 42,620(0.19%)#68 | 421,832(0.02%)#808 |
| 69. | Kendall Park | 80 | 42,620(0.19%)#69 | 421,832(0.02%)#812 |
| 70. | Jamesburg Borough | 79 | 42,620(0.19%)#70 | 421,832(0.02%)#819 |
| 71. | Highland Park Borough | 77 | 42,620(0.18%)#71 | 421,832(0.02%)#835 |
| 72. | Ventnor City | 77 | 42,620(0.18%)#72 | 421,832(0.02%)#836 |
| 73. | River Edge Borough | 75 | 42,620(0.18%)#73 | 421,832(0.02%)#860 |
| 74. | Morristown | 72 | 42,620(0.17%)#74 | 421,832(0.02%)#881 |
| 75. | Flemington Borough | 72 | 42,620(0.17%)#75 | 421,832(0.02%)#885 |
| 76. | Elmwood Park Borough | 69 | 42,620(0.16%)#76 | 421,832(0.02%)#908 |
| 77. | Phillipsburg | 69 | 42,620(0.16%)#77 | 421,832(0.02%)#911 |
| 78. | New Milford Borough | 68 | 42,620(0.16%)#78 | 421,832(0.02%)#918 |
| 79. | Moonachie Borough | 68 | 42,620(0.16%)#79 | 421,832(0.02%)#925 |
| 80. | Rahway | 67 | 42,620(0.16%)#80 | 421,832(0.02%)#932 |
| 81. | Tenafly Borough | 67 | 42,620(0.16%)#81 | 421,832(0.02%)#934 |
| 82. | Long Branch | 65 | 42,620(0.15%)#82 | 421,832(0.02%)#950 |
| 83. | Guttenberg | 65 | 42,620(0.15%)#83 | 421,832(0.02%)#958 |
| 84. | Ramblewood | 64 | 42,620(0.15%)#84 | 421,832(0.02%)#967 |
| 85. | Mercerville | 62 | 42,620(0.15%)#85 | 421,832(0.01%)#985 |
| 86. | Gloucester City | 62 | 42,620(0.15%)#86 | 421,832(0.01%)#987 |
| 87. | Bridgewater Center | 62 | 42,620(0.15%)#87 | 421,832(0.01%)#988 |
| 88. | Saddle River Borough | 61 | 42,620(0.14%)#88 | 421,832(0.01%)#1,001 |
| 89. | Passaic | 58 | 42,620(0.14%)#89 | 421,832(0.01%)#1,025 |
| 90. | Monroe Manor | 58 | 42,620(0.14%)#90 | 421,832(0.01%)#1,036 |
| 91. | Helmetta Borough | 58 | 42,620(0.14%)#91 | 421,832(0.01%)#1,037 |
| 92. | Paramus Borough | 57 | 42,620(0.13%)#92 | 421,832(0.01%)#1,040 |
| 93. | New Providence Borough | 55 | 42,620(0.13%)#93 | 421,832(0.01%)#1,065 |
| 94. | Ten Mile Run | 55 | 42,620(0.13%)#94 | 421,832(0.01%)#1,067 |
| 95. | Franklin Lakes Borough | 54 | 42,620(0.13%)#95 | 421,832(0.01%)#1,078 |
| 96. | Morganville | 54 | 42,620(0.13%)#96 | 421,832(0.01%)#1,081 |
| 97. | Princeton Junction | 54 | 42,620(0.13%)#97 | 421,832(0.01%)#1,083 |
| 98. | Berlin Borough | 52 | 42,620(0.12%)#98 | 421,832(0.01%)#1,106 |
| 99. | Green Knoll | 50 | 42,620(0.12%)#99 | 421,832(0.01%)#1,133 |
| 100. | Ridgefield Borough | 49 | 42,620(0.11%)#100 | 421,832(0.01%)#1,151 |
Common Questions
What are the Top 10 Cities with the Most Immigrants from Northern Africa in New Jersey?
Top 10 Cities with the Most Immigrants from Northern Africa in New Jersey are:
#1
8,077
#2
4,454
#3
1,053
#4
715
#5
629
#6
342
#7
299
#8
250
#9
247
#10
240
What city has the Most Immigrants from Northern Africa in New Jersey?
Jersey City has the Most Immigrants from Northern Africa in New Jersey with 8,077.
What is the Total Immigrants from Northern Africa in the State of New Jersey?
Total Immigrants from Northern Africa in New Jersey is 42,620.
What is the Total Immigrants from Northern Africa in the United States?
Total Immigrants from Northern Africa in the United States is 421,832.