Zip Codes with the Highest Percentage of Households with Income Above $100,000 in Quincy, IL
RELATED REPORTS & OPTIONS
Household Income | $100k+
Quincy
Compare Zip Codes
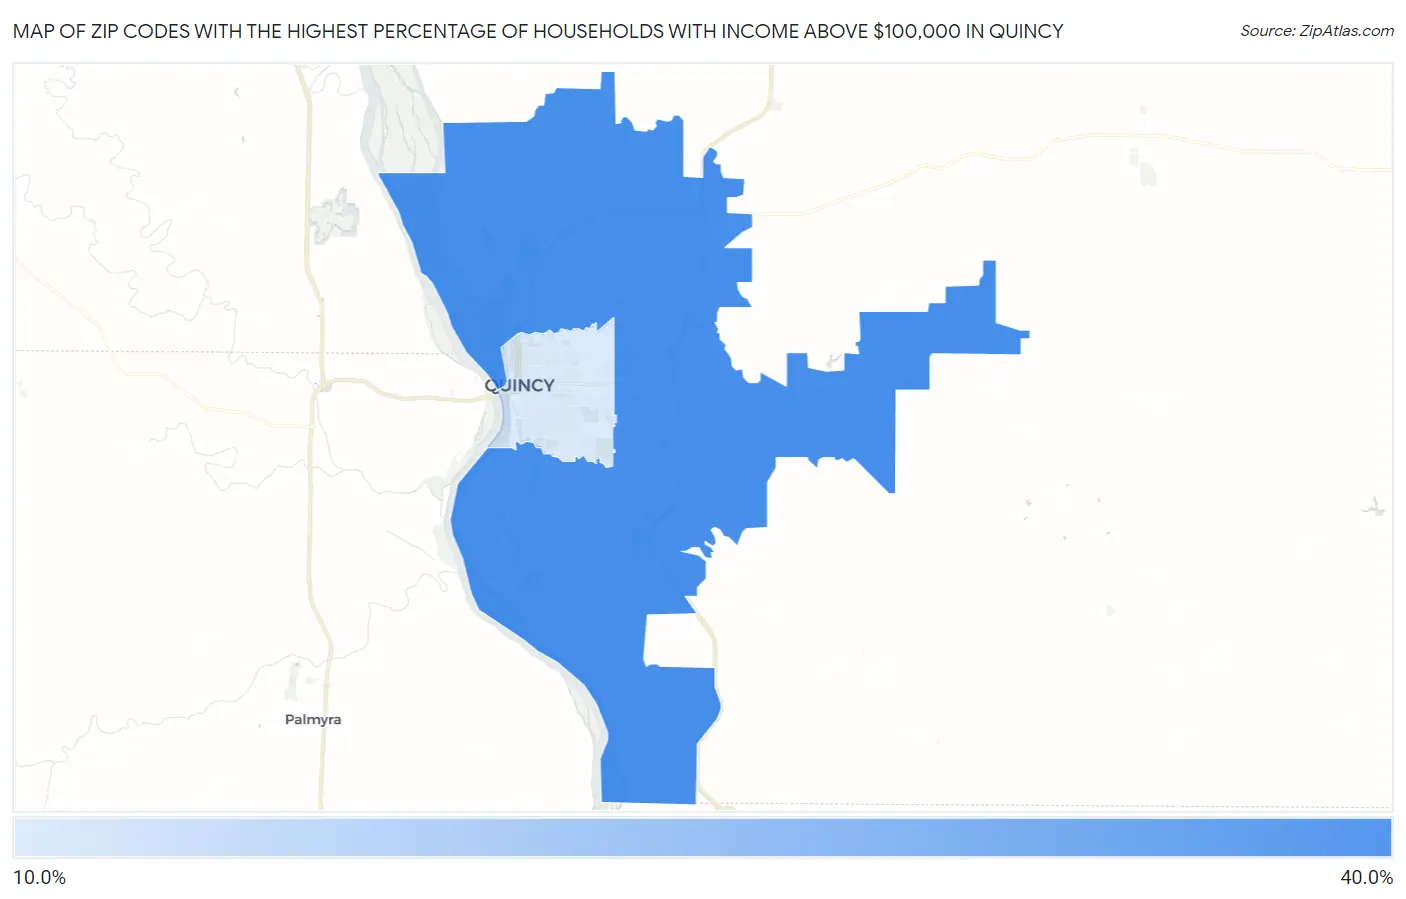
Map of Zip Codes with the Highest Percentage of Households with Income Above $100,000 in Quincy
19.1%
39.7%
Zip Codes with the Highest Percentage of Households with Income Above $100,000 in Quincy, IL
| Zip Code | Households with Income > $100k | vs State | vs National | |
| 1. | 62305 | 39.7% | 39.1%(+0.600)#426 | 37.3%(+2.40)#9,069 |
| 2. | 62301 | 19.1% | 39.1%(-20.0)#1,169 | 37.3%(-18.2)#24,747 |
1
Common Questions
What are the Top Zip Codes with the Highest Percentage of Households with Income Above $100,000 in Quincy, IL?
Top Zip Codes with the Highest Percentage of Households with Income Above $100,000 in Quincy, IL are:
What zip code has the Highest Percentage of Households with Income Above $100,000 in Quincy, IL?
62305 has the Highest Percentage of Households with Income Above $100,000 in Quincy, IL with 39.7%.
What is the Percentage of Households with Income Above $100,000 in Quincy, IL?
Percentage of Households with Income Above $100,000 in Quincy is 22.9%.
What is the Percentage of Households with Income Above $100,000 in Illinois?
Percentage of Households with Income Above $100,000 in Illinois is 39.1%.
What is the Percentage of Households with Income Above $100,000 in the United States?
Percentage of Households with Income Above $100,000 in the United States is 37.3%.