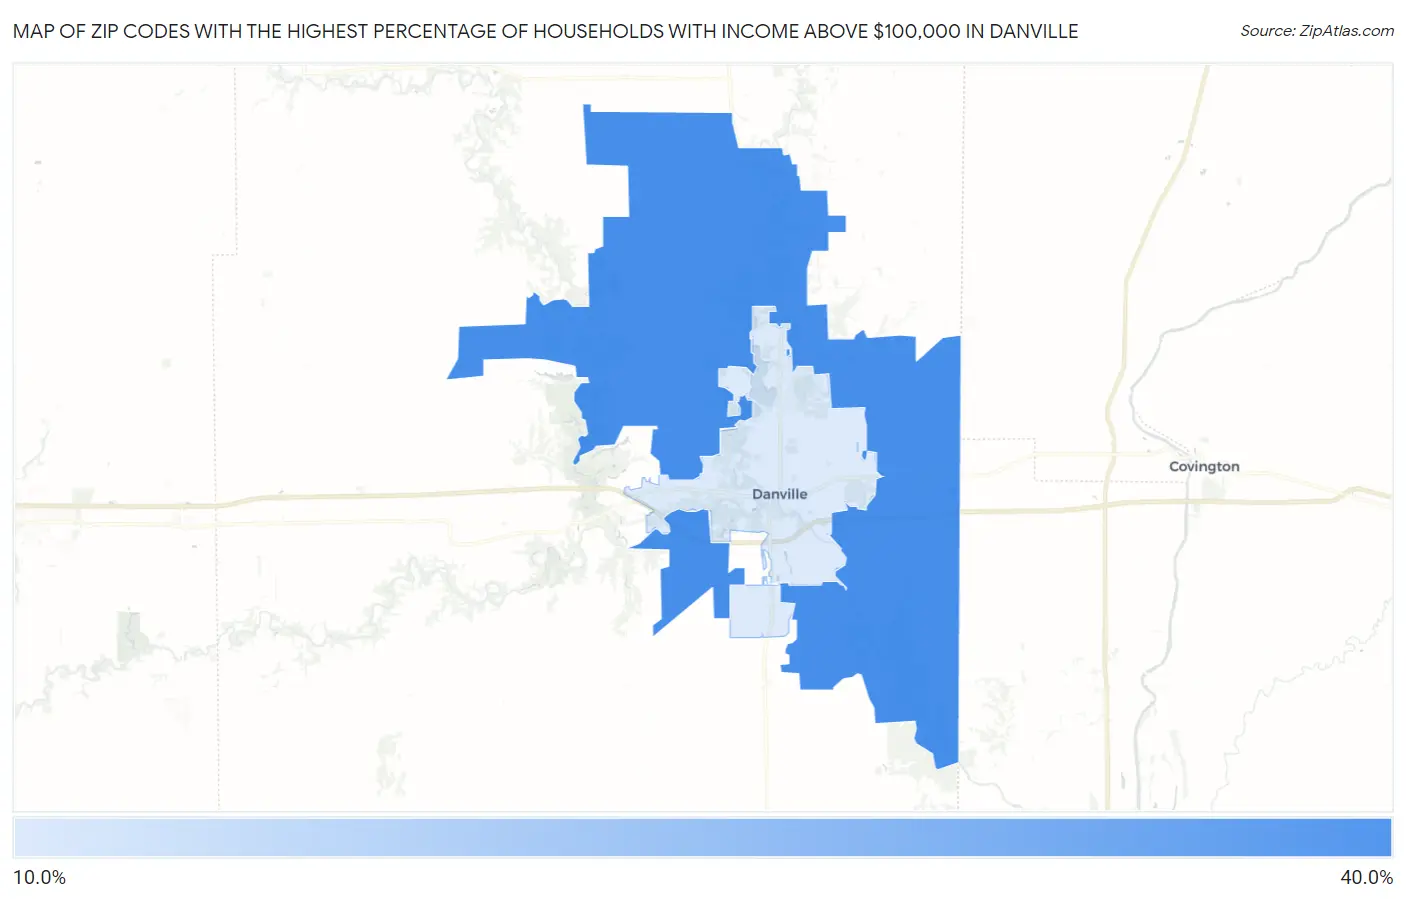
Zip Codes with the Highest Percentage of Households with Income Above $100,000 in Danville, IL
RELATED REPORTS & OPTIONS
Household Income | $100k+
Danville
Compare Zip Codes
Map of Zip Codes with the Highest Percentage of Households with Income Above $100,000 in Danville
17.5%
34.9%
Zip Codes with the Highest Percentage of Households with Income Above $100,000 in Danville, IL
| Zip Code | Households with Income > $100k | vs State | vs National | |
| 1. | 61834 | 34.9% | 39.1%(-4.20)#561 | 37.3%(-2.40)#11,833 |
| 2. | 61832 | 17.5% | 39.1%(-21.6)#1,212 | 37.3%(-19.8)#25,897 |
1
Common Questions
What are the Top Zip Codes with the Highest Percentage of Households with Income Above $100,000 in Danville, IL?
Top Zip Codes with the Highest Percentage of Households with Income Above $100,000 in Danville, IL are:
What zip code has the Highest Percentage of Households with Income Above $100,000 in Danville, IL?
61834 has the Highest Percentage of Households with Income Above $100,000 in Danville, IL with 34.9%.
What is the Percentage of Households with Income Above $100,000 in Danville, IL?
Percentage of Households with Income Above $100,000 in Danville is 16.5%.
What is the Percentage of Households with Income Above $100,000 in Illinois?
Percentage of Households with Income Above $100,000 in Illinois is 39.1%.
What is the Percentage of Households with Income Above $100,000 in the United States?
Percentage of Households with Income Above $100,000 in the United States is 37.3%.