Zip Codes with the Highest Percentage of Households with Income Above $100,000 in Chicago, IL
RELATED REPORTS & OPTIONS
Household Income | $100k+
Chicago
Compare Zip Codes
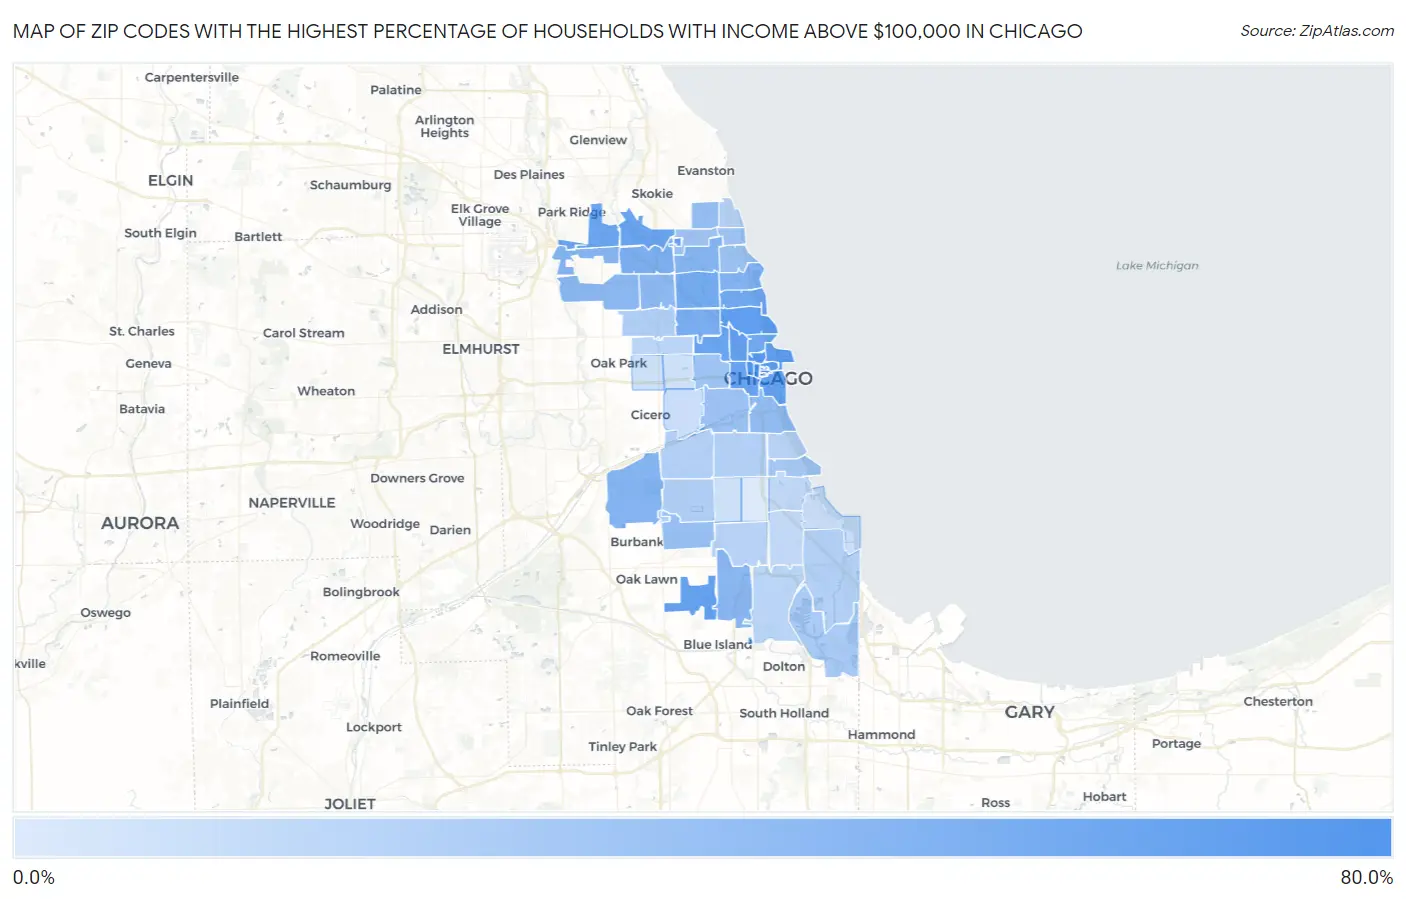
Map of Zip Codes with the Highest Percentage of Households with Income Above $100,000 in Chicago
8.0%
74.6%
Zip Codes with the Highest Percentage of Households with Income Above $100,000 in Chicago, IL
| Zip Code | Households with Income > $100k | vs State | vs National | |
| 1. | 60606 | 74.6% | 39.1%(+35.5)#16 | 37.3%(+37.3)#603 |
| 2. | 60661 | 68.6% | 39.1%(+29.5)#35 | 37.3%(+31.3)#1,098 |
| 3. | 60654 | 66.9% | 39.1%(+27.8)#41 | 37.3%(+29.6)#1,279 |
| 4. | 60601 | 66.0% | 39.1%(+26.9)#48 | 37.3%(+28.7)#1,402 |
| 5. | 60603 | 65.0% | 39.1%(+25.9)#52 | 37.3%(+27.7)#1,547 |
| 6. | 60611 | 61.3% | 39.1%(+22.2)#78 | 37.3%(+24.0)#2,113 |
| 7. | 60614 | 61.1% | 39.1%(+22.0)#80 | 37.3%(+23.8)#2,154 |
| 8. | 60642 | 60.2% | 39.1%(+21.1)#86 | 37.3%(+22.9)#2,319 |
| 9. | 60602 | 59.8% | 39.1%(+20.7)#88 | 37.3%(+22.5)#2,418 |
| 10. | 60605 | 58.8% | 39.1%(+19.7)#93 | 37.3%(+21.5)#2,597 |
| 11. | 60655 | 58.5% | 39.1%(+19.4)#98 | 37.3%(+21.2)#2,654 |
| 12. | 60607 | 57.0% | 39.1%(+17.9)#116 | 37.3%(+19.7)#2,977 |
| 13. | 60622 | 56.8% | 39.1%(+17.7)#120 | 37.3%(+19.5)#3,016 |
| 14. | 60631 | 55.5% | 39.1%(+16.4)#135 | 37.3%(+18.2)#3,320 |
| 15. | 60646 | 55.4% | 39.1%(+16.3)#137 | 37.3%(+18.1)#3,349 |
| 16. | 60657 | 52.6% | 39.1%(+13.5)#162 | 37.3%(+15.3)#4,077 |
| 17. | 60610 | 52.3% | 39.1%(+13.2)#167 | 37.3%(+15.0)#4,156 |
| 18. | 60618 | 50.6% | 39.1%(+11.5)#197 | 37.3%(+13.3)#4,649 |
| 19. | 60647 | 48.9% | 39.1%(+9.80)#226 | 37.3%(+11.6)#5,192 |
| 20. | 60630 | 46.1% | 39.1%(+7.00)#277 | 37.3%(+8.80)#6,155 |
| 21. | 60613 | 45.4% | 39.1%(+6.30)#288 | 37.3%(+8.10)#6,434 |
| 22. | 60638 | 43.3% | 39.1%(+4.20)#330 | 37.3%(+6.00)#7,284 |
| 23. | 60656 | 41.9% | 39.1%(+2.80)#368 | 37.3%(+4.60)#7,925 |
| 24. | 60625 | 41.6% | 39.1%(+2.50)#377 | 37.3%(+4.30)#8,066 |
| 25. | 60643 | 40.5% | 39.1%(+1.40)#406 | 37.3%(+3.20)#8,644 |
| 26. | 60634 | 39.6% | 39.1%(+0.500)#430 | 37.3%(+2.30)#9,115 |
| 27. | 60641 | 39.2% | 39.1%(+0.100)#441 | 37.3%(+1.90)#9,309 |
| 28. | 60616 | 36.6% | 39.1%(-2.50)#510 | 37.3%(-0.700)#10,807 |
| 29. | 60645 | 35.4% | 39.1%(-3.70)#541 | 37.3%(-1.90)#11,521 |
| 30. | 60604 | 35.2% | 39.1%(-3.90)#554 | 37.3%(-2.10)#11,692 |
| 31. | 60652 | 34.6% | 39.1%(-4.50)#573 | 37.3%(-2.70)#12,007 |
| 32. | 60640 | 32.9% | 39.1%(-6.20)#626 | 37.3%(-4.40)#13,177 |
| 33. | 60608 | 32.6% | 39.1%(-6.50)#638 | 37.3%(-4.70)#13,380 |
| 34. | 60612 | 31.9% | 39.1%(-7.20)#674 | 37.3%(-5.40)#13,939 |
| 35. | 60659 | 31.1% | 39.1%(-8.00)#693 | 37.3%(-6.20)#14,550 |
| 36. | 60660 | 31.0% | 39.1%(-8.10)#697 | 37.3%(-6.30)#14,633 |
| 37. | 60615 | 29.4% | 39.1%(-9.70)#760 | 37.3%(-7.90)#15,903 |
| 38. | 60633 | 27.3% | 39.1%(-11.8)#857 | 37.3%(-10.00)#17,719 |
| 39. | 60629 | 24.6% | 39.1%(-14.5)#957 | 37.3%(-12.7)#20,081 |
| 40. | 60639 | 24.6% | 39.1%(-14.5)#958 | 37.3%(-12.7)#20,082 |
| 41. | 60617 | 23.8% | 39.1%(-15.3)#998 | 37.3%(-13.5)#20,813 |
| 42. | 60632 | 23.4% | 39.1%(-15.7)#1,013 | 37.3%(-13.9)#21,207 |
| 43. | 60626 | 23.4% | 39.1%(-15.7)#1,014 | 37.3%(-13.9)#21,208 |
| 44. | 60609 | 23.1% | 39.1%(-16.0)#1,028 | 37.3%(-14.2)#21,466 |
| 45. | 60653 | 22.0% | 39.1%(-17.1)#1,066 | 37.3%(-15.3)#22,384 |
| 46. | 60620 | 21.2% | 39.1%(-17.9)#1,095 | 37.3%(-16.1)#23,062 |
| 47. | 60651 | 20.4% | 39.1%(-18.7)#1,126 | 37.3%(-16.9)#23,702 |
| 48. | 60628 | 20.3% | 39.1%(-18.8)#1,132 | 37.3%(-17.0)#23,776 |
| 49. | 60619 | 17.9% | 39.1%(-21.2)#1,199 | 37.3%(-19.4)#25,603 |
| 50. | 60637 | 17.6% | 39.1%(-21.5)#1,209 | 37.3%(-19.7)#25,822 |
| 51. | 60623 | 14.3% | 39.1%(-24.8)#1,276 | 37.3%(-23.0)#27,923 |
| 52. | 60649 | 14.2% | 39.1%(-24.9)#1,280 | 37.3%(-23.1)#27,995 |
| 53. | 60636 | 13.1% | 39.1%(-26.0)#1,295 | 37.3%(-24.2)#28,532 |
| 54. | 60644 | 13.0% | 39.1%(-26.1)#1,297 | 37.3%(-24.3)#28,571 |
| 55. | 60624 | 12.9% | 39.1%(-26.2)#1,298 | 37.3%(-24.4)#28,621 |
| 56. | 60621 | 8.0% | 39.1%(-31.1)#1,332 | 37.3%(-29.3)#30,434 |
1
Common Questions
What are the Top 10 Zip Codes with the Highest Percentage of Households with Income Above $100,000 in Chicago, IL?
Top 10 Zip Codes with the Highest Percentage of Households with Income Above $100,000 in Chicago, IL are:
What zip code has the Highest Percentage of Households with Income Above $100,000 in Chicago, IL?
60606 has the Highest Percentage of Households with Income Above $100,000 in Chicago, IL with 74.6%.
What is the Percentage of Households with Income Above $100,000 in Chicago, IL?
Percentage of Households with Income Above $100,000 in Chicago is 36.5%.
What is the Percentage of Households with Income Above $100,000 in Illinois?
Percentage of Households with Income Above $100,000 in Illinois is 39.1%.
What is the Percentage of Households with Income Above $100,000 in the United States?
Percentage of Households with Income Above $100,000 in the United States is 37.3%.