Zip Codes with the Highest Percentage of Households with Income Above $100,000 in Bloomington, IL
RELATED REPORTS & OPTIONS
Household Income | $100k+
Bloomington
Compare Zip Codes
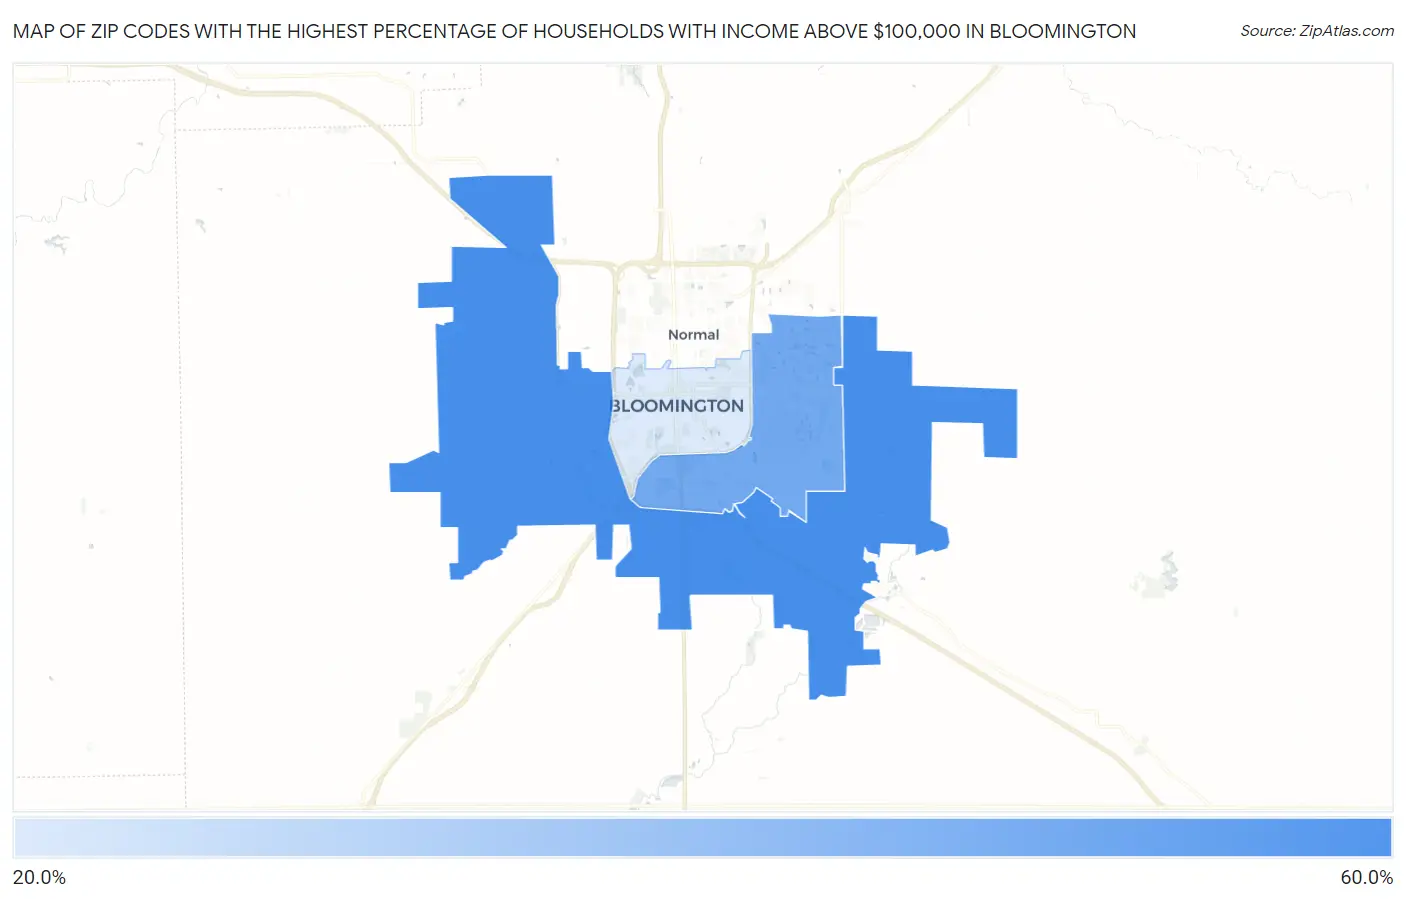
Map of Zip Codes with the Highest Percentage of Households with Income Above $100,000 in Bloomington
21.7%
54.0%
Zip Codes with the Highest Percentage of Households with Income Above $100,000 in Bloomington, IL
| Zip Code | Households with Income > $100k | vs State | vs National | |
| 1. | 61705 | 54.0% | 39.1%(+14.9)#152 | 37.3%(+16.7)#3,720 |
| 2. | 61704 | 44.0% | 39.1%(+4.90)#311 | 37.3%(+6.70)#7,001 |
| 3. | 61701 | 21.7% | 39.1%(-17.4)#1,078 | 37.3%(-15.6)#22,651 |
1
Common Questions
What are the Top Zip Codes with the Highest Percentage of Households with Income Above $100,000 in Bloomington, IL?
Top Zip Codes with the Highest Percentage of Households with Income Above $100,000 in Bloomington, IL are:
What zip code has the Highest Percentage of Households with Income Above $100,000 in Bloomington, IL?
61705 has the Highest Percentage of Households with Income Above $100,000 in Bloomington, IL with 54.0%.
What is the Percentage of Households with Income Above $100,000 in Bloomington, IL?
Percentage of Households with Income Above $100,000 in Bloomington is 34.2%.
What is the Percentage of Households with Income Above $100,000 in Illinois?
Percentage of Households with Income Above $100,000 in Illinois is 39.1%.
What is the Percentage of Households with Income Above $100,000 in the United States?
Percentage of Households with Income Above $100,000 in the United States is 37.3%.