Zip Codes with the Highest Percentage of Households with Income Above $100,000 in Springfield, IL
RELATED REPORTS & OPTIONS
Household Income | $100k+
Springfield
Compare Zip Codes
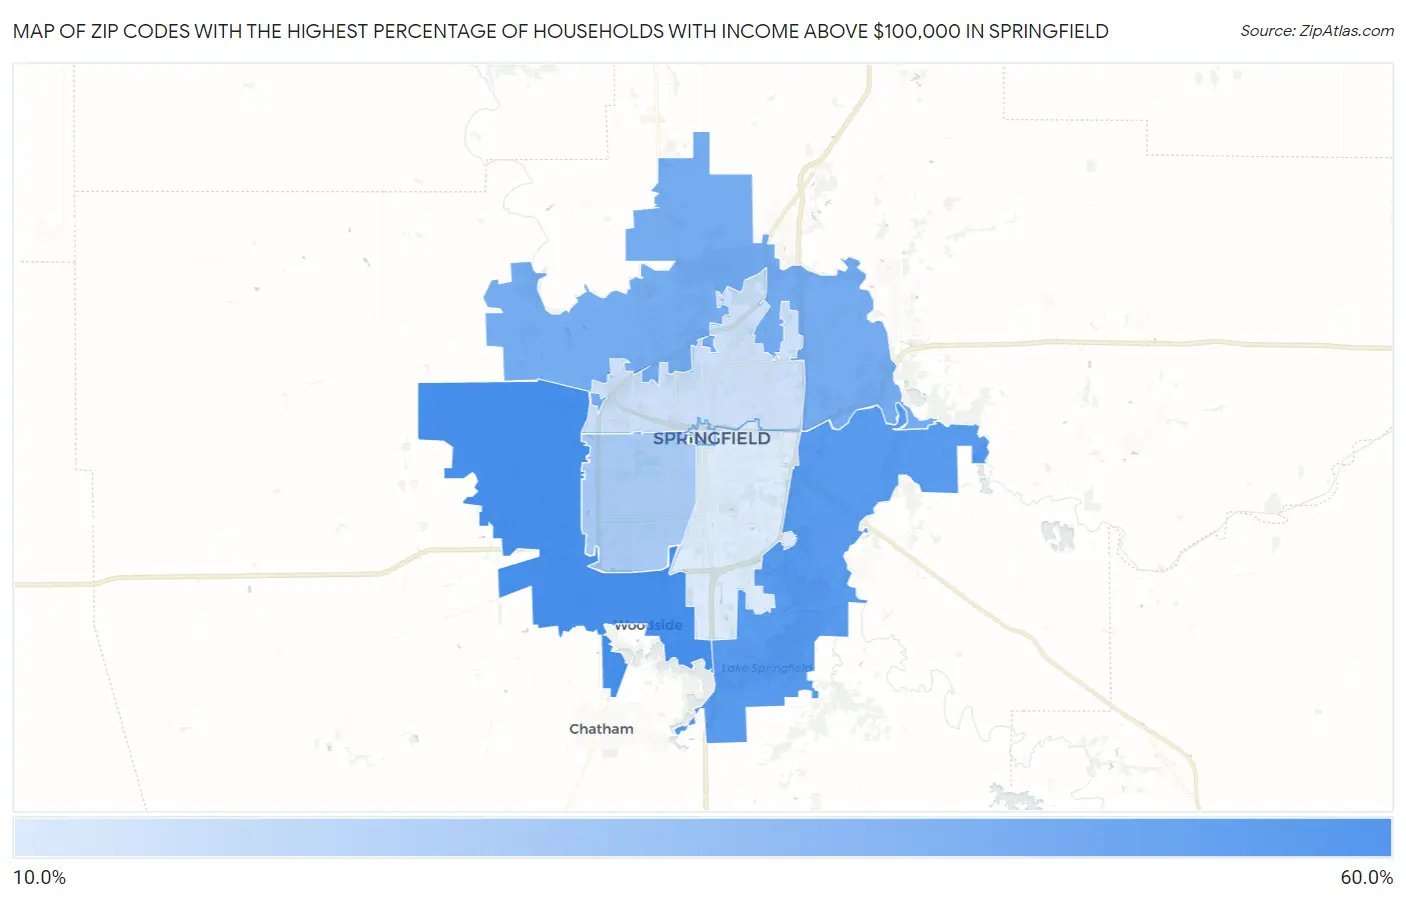
Map of Zip Codes with the Highest Percentage of Households with Income Above $100,000 in Springfield
16.5%
57.1%
Zip Codes with the Highest Percentage of Households with Income Above $100,000 in Springfield, IL
| Zip Code | Households with Income > $100k | vs State | vs National | |
| 1. | 62711 | 57.1% | 39.1%(+18.0)#115 | 37.3%(+19.8)#2,955 |
| 2. | 62712 | 52.1% | 39.1%(+13.0)#170 | 37.3%(+14.8)#4,217 |
| 3. | 62707 | 43.5% | 39.1%(+4.40)#321 | 37.3%(+6.20)#7,215 |
| 4. | 62704 | 29.7% | 39.1%(-9.40)#750 | 37.3%(-7.60)#15,662 |
| 5. | 62702 | 20.3% | 39.1%(-18.8)#1,134 | 37.3%(-17.0)#23,788 |
| 6. | 62701 | 17.8% | 39.1%(-21.3)#1,204 | 37.3%(-19.5)#25,726 |
| 7. | 62703 | 16.5% | 39.1%(-22.6)#1,233 | 37.3%(-20.8)#26,550 |
1
Common Questions
What are the Top 5 Zip Codes with the Highest Percentage of Households with Income Above $100,000 in Springfield, IL?
Top 5 Zip Codes with the Highest Percentage of Households with Income Above $100,000 in Springfield, IL are:
What zip code has the Highest Percentage of Households with Income Above $100,000 in Springfield, IL?
62711 has the Highest Percentage of Households with Income Above $100,000 in Springfield, IL with 57.1%.
What is the Percentage of Households with Income Above $100,000 in Springfield, IL?
Percentage of Households with Income Above $100,000 in Springfield is 29.7%.
What is the Percentage of Households with Income Above $100,000 in Illinois?
Percentage of Households with Income Above $100,000 in Illinois is 39.1%.
What is the Percentage of Households with Income Above $100,000 in the United States?
Percentage of Households with Income Above $100,000 in the United States is 37.3%.