Zip Codes with the Highest Percentage of Households with Income Above $100,000 in Downers Grove, IL
RELATED REPORTS & OPTIONS
Household Income | $100k+
Downers Grove
Compare Zip Codes
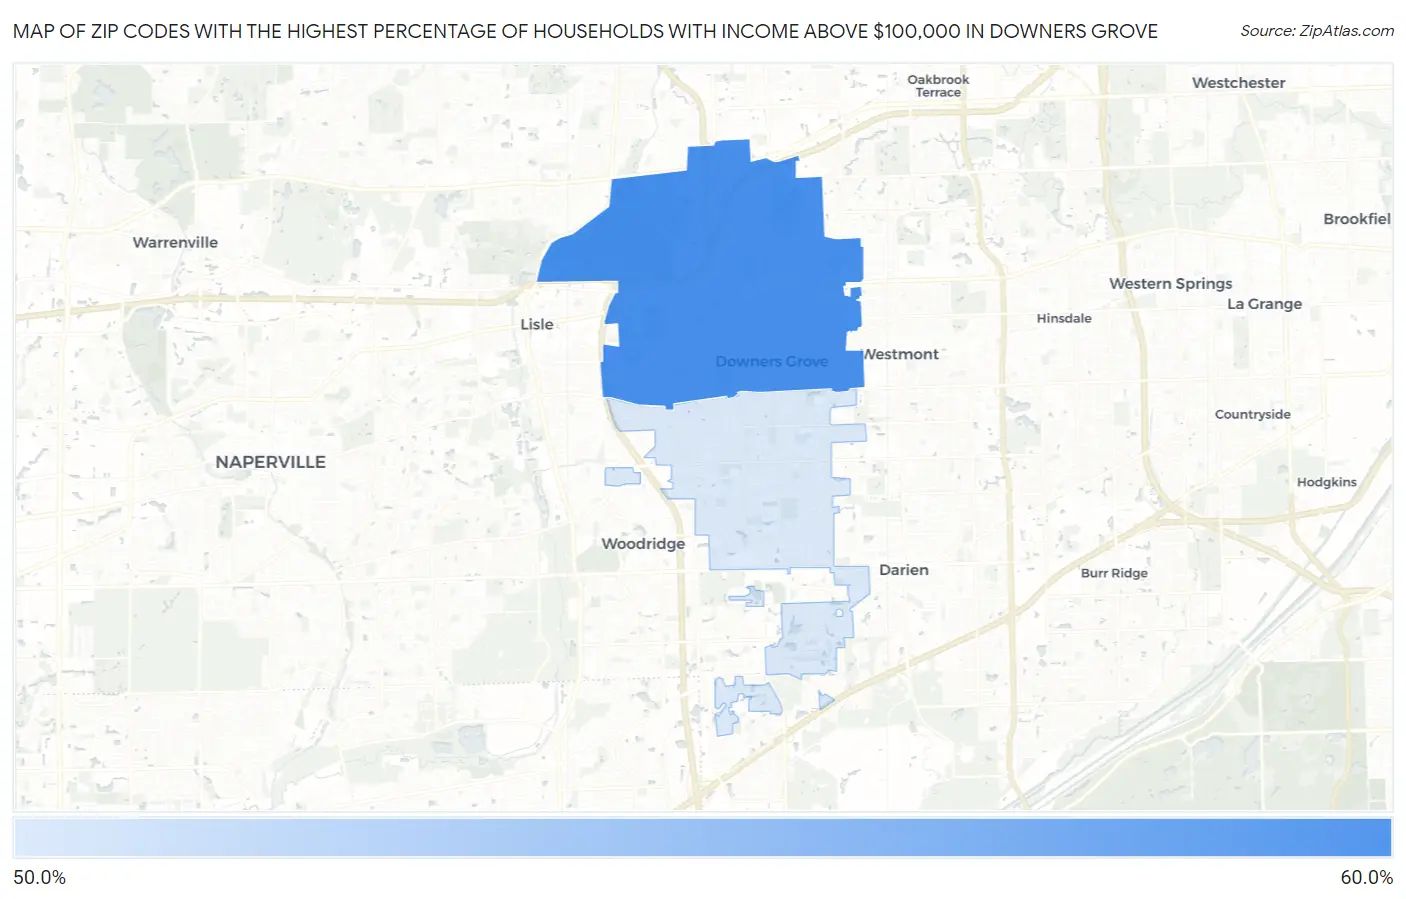
Map of Zip Codes with the Highest Percentage of Households with Income Above $100,000 in Downers Grove
54.6%
56.2%
Zip Codes with the Highest Percentage of Households with Income Above $100,000 in Downers Grove, IL
| Zip Code | Households with Income > $100k | vs State | vs National | |
| 1. | 60515 | 56.2% | 39.1%(+17.1)#130 | 37.3%(+18.9)#3,151 |
| 2. | 60516 | 54.6% | 39.1%(+15.5)#146 | 37.3%(+17.3)#3,547 |
1
Common Questions
What are the Top Zip Codes with the Highest Percentage of Households with Income Above $100,000 in Downers Grove, IL?
Top Zip Codes with the Highest Percentage of Households with Income Above $100,000 in Downers Grove, IL are:
What zip code has the Highest Percentage of Households with Income Above $100,000 in Downers Grove, IL?
60515 has the Highest Percentage of Households with Income Above $100,000 in Downers Grove, IL with 56.2%.
What is the Percentage of Households with Income Above $100,000 in Downers Grove, IL?
Percentage of Households with Income Above $100,000 in Downers Grove is 55.3%.
What is the Percentage of Households with Income Above $100,000 in Illinois?
Percentage of Households with Income Above $100,000 in Illinois is 39.1%.
What is the Percentage of Households with Income Above $100,000 in the United States?
Percentage of Households with Income Above $100,000 in the United States is 37.3%.