Zip Codes with the Highest Percentage of Households with Income Above $100,000 in Bolingbrook, IL
RELATED REPORTS & OPTIONS
Household Income | $100k+
Bolingbrook
Compare Zip Codes
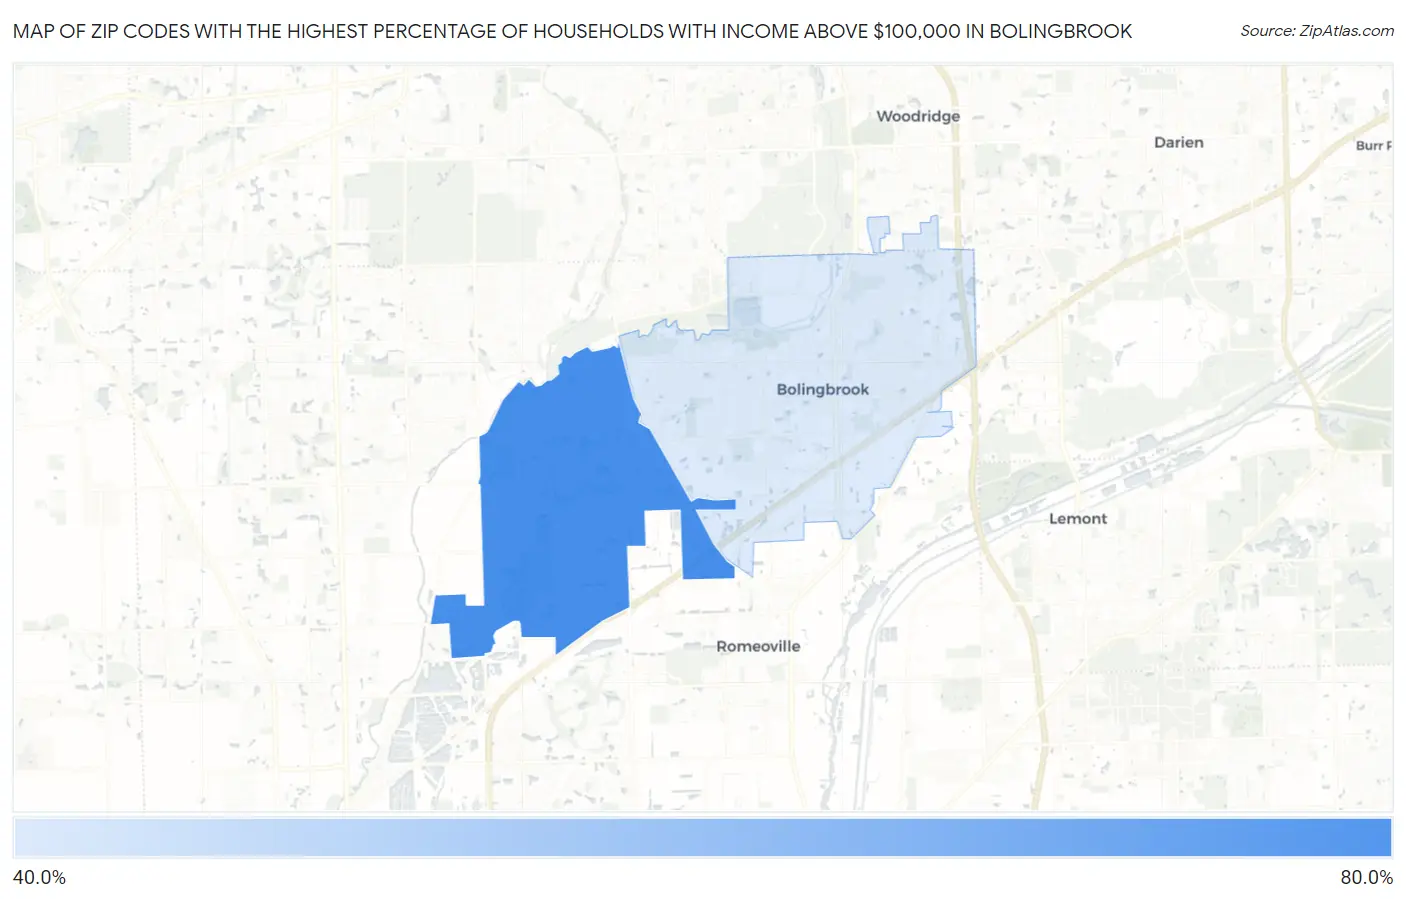
Map of Zip Codes with the Highest Percentage of Households with Income Above $100,000 in Bolingbrook
41.9%
76.4%
Zip Codes with the Highest Percentage of Households with Income Above $100,000 in Bolingbrook, IL
| Zip Code | Households with Income > $100k | vs State | vs National | |
| 1. | 60490 | 76.4% | 39.1%(+37.3)#12 | 37.3%(+39.1)#501 |
| 2. | 60440 | 41.9% | 39.1%(+2.80)#367 | 37.3%(+4.60)#7,918 |
1
Common Questions
What are the Top Zip Codes with the Highest Percentage of Households with Income Above $100,000 in Bolingbrook, IL?
Top Zip Codes with the Highest Percentage of Households with Income Above $100,000 in Bolingbrook, IL are:
What zip code has the Highest Percentage of Households with Income Above $100,000 in Bolingbrook, IL?
60490 has the Highest Percentage of Households with Income Above $100,000 in Bolingbrook, IL with 76.4%.
What is the Percentage of Households with Income Above $100,000 in Bolingbrook, IL?
Percentage of Households with Income Above $100,000 in Bolingbrook is 51.1%.
What is the Percentage of Households with Income Above $100,000 in Illinois?
Percentage of Households with Income Above $100,000 in Illinois is 39.1%.
What is the Percentage of Households with Income Above $100,000 in the United States?
Percentage of Households with Income Above $100,000 in the United States is 37.3%.