Colona, IL Map & Demographics
Colona Map
Colona Overview
$37,672
PER CAPITA INCOME
$78,580
AVG FAMILY INCOME
$64,375
AVG HOUSEHOLD INCOME
29.9%
WAGE / INCOME GAP [ % ]
70.1¢/ $1
WAGE / INCOME GAP [ $ ]
0.41
INEQUALITY / GINI INDEX
5,404
TOTAL POPULATION
2,615
MALE POPULATION
2,789
FEMALE POPULATION
93.76
MALES / 100 FEMALES
106.65
FEMALES / 100 MALES
42.9
MEDIAN AGE
2.9
AVG FAMILY SIZE
2.4
AVG HOUSEHOLD SIZE
3,238
LABOR FORCE [ PEOPLE ]
70.0%
PERCENT IN LABOR FORCE
3.4%
UNEMPLOYMENT RATE
Colona Zip Codes
Colona Area Codes
Income in Colona
Income Overview in Colona
Per Capita Income in Colona is $37,672, while median incomes of families and households are $78,580 and $64,375 respectively.
| Characteristic | Number | Measure |
| Per Capita Income | 5,404 | $37,672 |
| Median Family Income | 1,467 | $78,580 |
| Mean Family Income | 1,467 | $105,897 |
| Median Household Income | 2,290 | $64,375 |
| Mean Household Income | 2,290 | $87,495 |
| Income Deficit | 1,467 | $0 |
| Wage / Income Gap (%) | 5,404 | 29.89% |
| Wage / Income Gap ($) | 5,404 | 70.11¢ per $1 |
| Gini / Inequality Index | 5,404 | 0.41 |
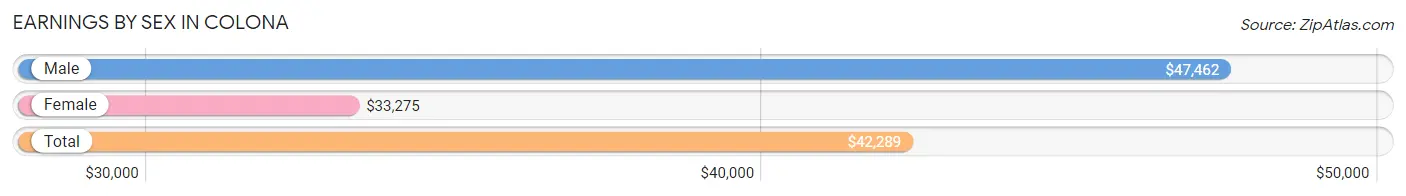
Earnings by Sex in Colona
Average Earnings in Colona are $42,289, $47,462 for men and $33,275 for women, a difference of 29.9%.
| Sex | Number | Average Earnings |
| Male | 1,515 (45.7%) | $47,462 |
| Female | 1,804 (54.3%) | $33,275 |
| Total | 3,319 (100.0%) | $42,289 |
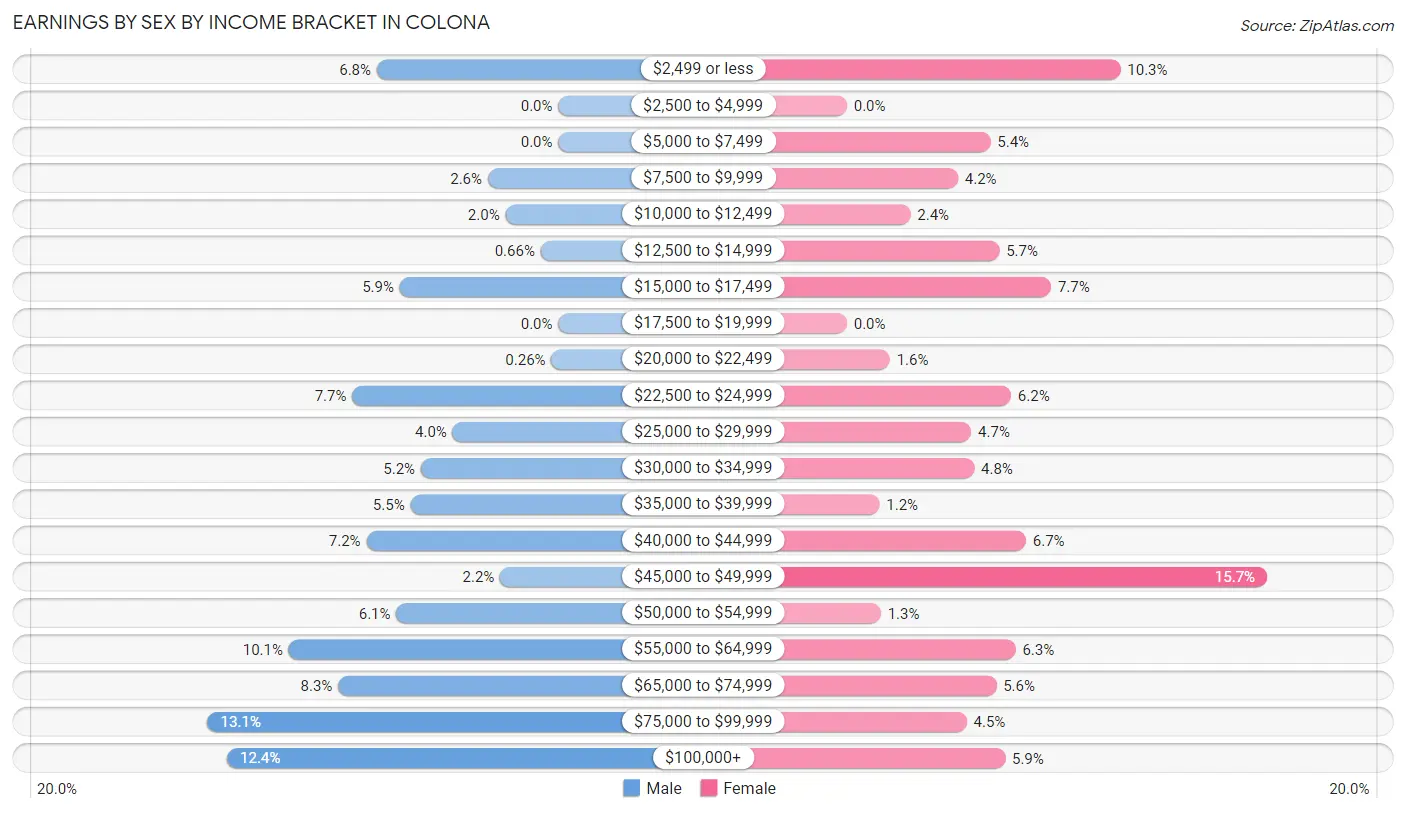
Earnings by Sex by Income Bracket in Colona
The most common earnings brackets in Colona are $75,000 to $99,999 for men (199 | 13.1%) and $45,000 to $49,999 for women (284 | 15.7%).
| Income | Male | Female |
| $2,499 or less | 103 (6.8%) | 185 (10.2%) |
| $2,500 to $4,999 | 0 (0.0%) | 0 (0.0%) |
| $5,000 to $7,499 | 0 (0.0%) | 97 (5.4%) |
| $7,500 to $9,999 | 40 (2.6%) | 75 (4.2%) |
| $10,000 to $12,499 | 30 (2.0%) | 43 (2.4%) |
| $12,500 to $14,999 | 10 (0.7%) | 103 (5.7%) |
| $15,000 to $17,499 | 90 (5.9%) | 138 (7.6%) |
| $17,500 to $19,999 | 0 (0.0%) | 0 (0.0%) |
| $20,000 to $22,499 | 4 (0.3%) | 29 (1.6%) |
| $22,500 to $24,999 | 117 (7.7%) | 111 (6.1%) |
| $25,000 to $29,999 | 60 (4.0%) | 84 (4.7%) |
| $30,000 to $34,999 | 78 (5.1%) | 86 (4.8%) |
| $35,000 to $39,999 | 84 (5.5%) | 22 (1.2%) |
| $40,000 to $44,999 | 109 (7.2%) | 121 (6.7%) |
| $45,000 to $49,999 | 33 (2.2%) | 284 (15.7%) |
| $50,000 to $54,999 | 92 (6.1%) | 23 (1.3%) |
| $55,000 to $64,999 | 153 (10.1%) | 114 (6.3%) |
| $65,000 to $74,999 | 125 (8.3%) | 101 (5.6%) |
| $75,000 to $99,999 | 199 (13.1%) | 81 (4.5%) |
| $100,000+ | 188 (12.4%) | 107 (5.9%) |
| Total | 1,515 (100.0%) | 1,804 (100.0%) |
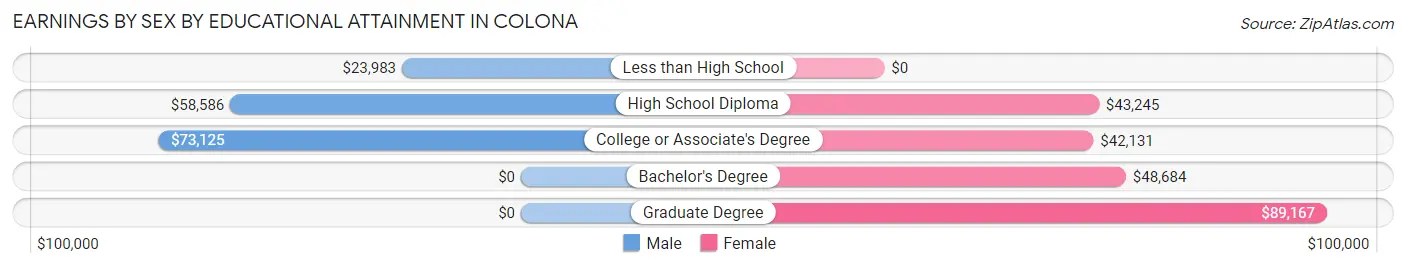
Earnings by Sex by Educational Attainment in Colona
Average earnings in Colona are $57,993 for men and $44,399 for women, a difference of 23.4%. Men with an educational attainment of college or associate's degree enjoy the highest average annual earnings of $73,125, while those with less than high school education earn the least with $23,983. Women with an educational attainment of graduate degree earn the most with the average annual earnings of $89,167, while those with college or associate's degree education have the smallest earnings of $42,131.
| Educational Attainment | Male Income | Female Income |
| Less than High School | $23,983 | $0 |
| High School Diploma | $58,586 | $43,245 |
| College or Associate's Degree | $73,125 | $42,131 |
| Bachelor's Degree | - | - |
| Graduate Degree | - | - |
| Total | $57,993 | $44,399 |
Family Income in Colona
Family Income Brackets in Colona
According to the Colona family income data, there are 420 families falling into the $50,000 to $74,999 income range, which is the most common income bracket and makes up 28.6% of all families.
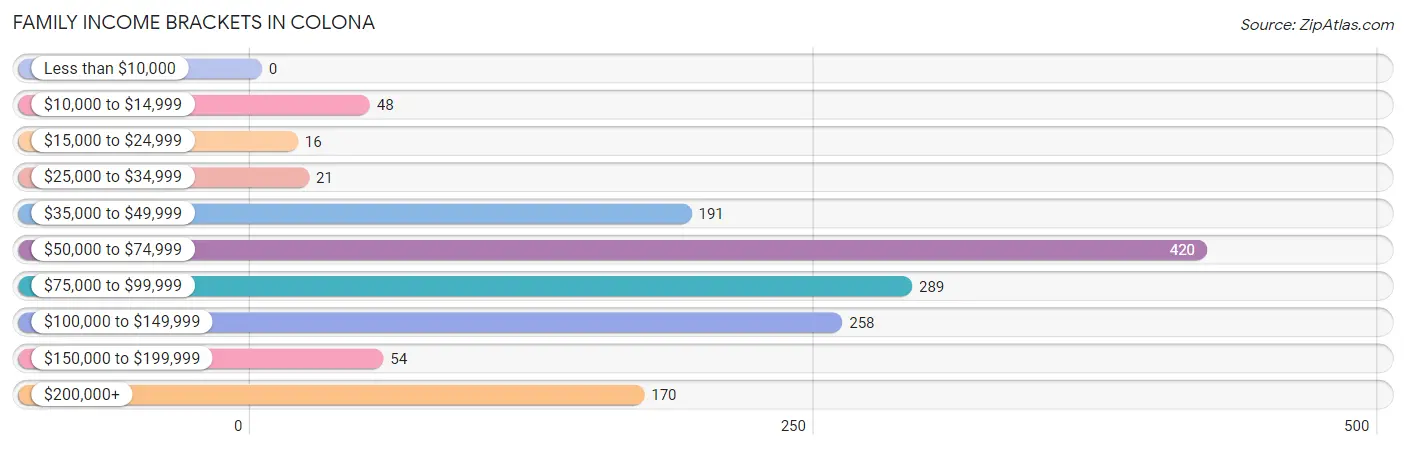
| Income Bracket | # Families | % Families |
| Less than $10,000 | 0 | 0.0% |
| $10,000 to $14,999 | 48 | 3.3% |
| $15,000 to $24,999 | 16 | 1.1% |
| $25,000 to $34,999 | 21 | 1.4% |
| $35,000 to $49,999 | 191 | 13.0% |
| $50,000 to $74,999 | 420 | 28.6% |
| $75,000 to $99,999 | 289 | 19.7% |
| $100,000 to $149,999 | 258 | 17.6% |
| $150,000 to $199,999 | 54 | 3.7% |
| $200,000+ | 170 | 11.6% |
Family Income by Famaliy Size in Colona
4-person families (137 | 9.3%) account for the highest median family income in Colona with $99,702 per family, while 2-person families (629 | 42.9%) have the highest median income of $36,290 per family member.
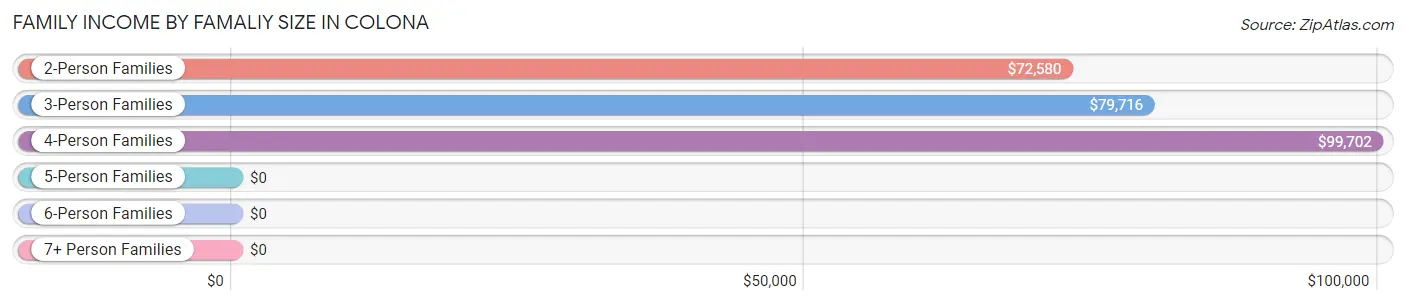
| Income Bracket | # Families | Median Income |
| 2-Person Families | 629 (42.9%) | $72,580 |
| 3-Person Families | 627 (42.7%) | $79,716 |
| 4-Person Families | 137 (9.3%) | $99,702 |
| 5-Person Families | 22 (1.5%) | $0 |
| 6-Person Families | 52 (3.5%) | $0 |
| 7+ Person Families | 0 (0.0%) | $0 |
| Total | 1,467 (100.0%) | $78,580 |
Family Income by Number of Earners in Colona
The median family income in Colona is $78,580, with families comprising 3+ earners (217) having the highest median family income of $104,007, while families with no earners (253) have the lowest median family income of $46,005, accounting for 14.8% and 17.2% of families, respectively.
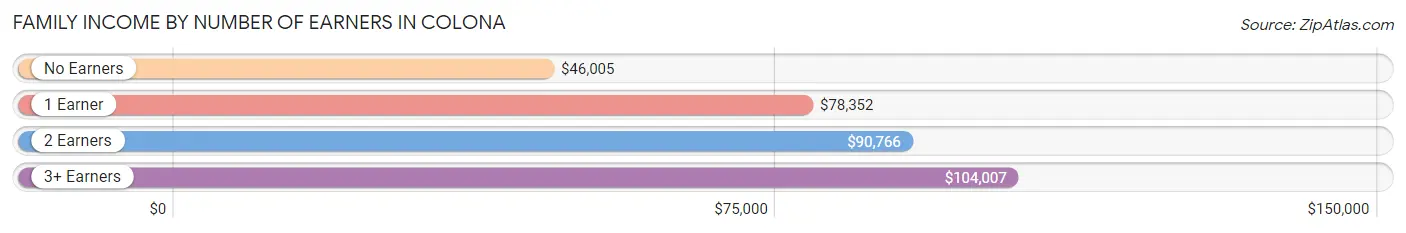
| Number of Earners | # Families | Median Income |
| No Earners | 253 (17.2%) | $46,005 |
| 1 Earner | 279 (19.0%) | $78,352 |
| 2 Earners | 718 (48.9%) | $90,766 |
| 3+ Earners | 217 (14.8%) | $104,007 |
| Total | 1,467 (100.0%) | $78,580 |
Household Income in Colona
Household Income Brackets in Colona
With 536 households falling in the category, the $50,000 to $74,999 income range is the most frequent in Colona, accounting for 23.4% of all households. In contrast, only 14 households (0.6%) fall into the less than $10,000 income bracket, making it the least populous group.
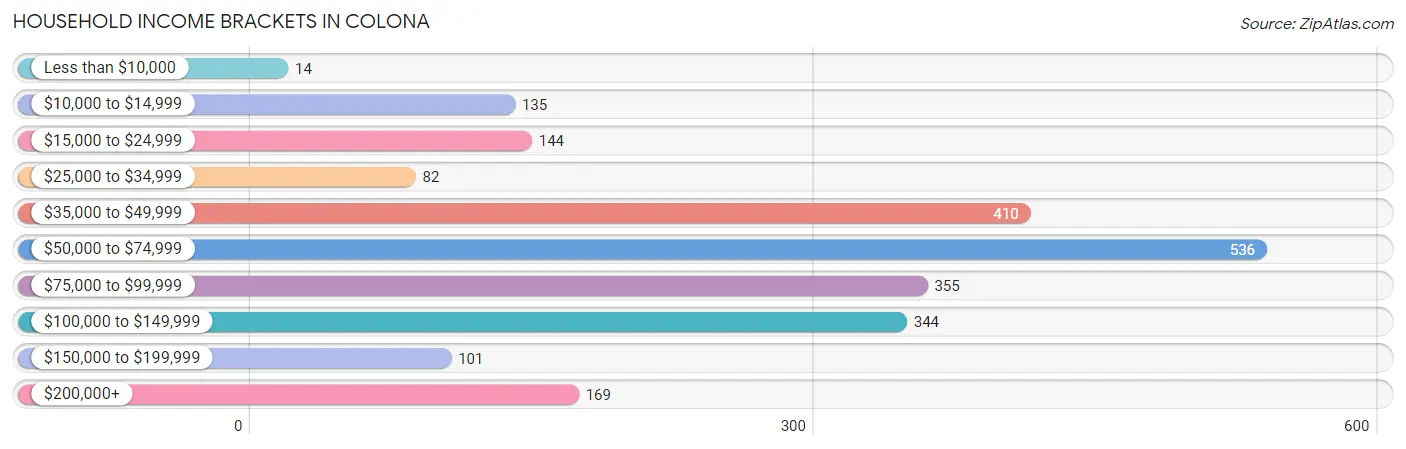
| Income Bracket | # Households | % Households |
| Less than $10,000 | 14 | 0.6% |
| $10,000 to $14,999 | 135 | 5.9% |
| $15,000 to $24,999 | 144 | 6.3% |
| $25,000 to $34,999 | 82 | 3.6% |
| $35,000 to $49,999 | 410 | 17.9% |
| $50,000 to $74,999 | 536 | 23.4% |
| $75,000 to $99,999 | 355 | 15.5% |
| $100,000 to $149,999 | 344 | 15.0% |
| $150,000 to $199,999 | 101 | 4.4% |
| $200,000+ | 169 | 7.4% |
Household Income by Householder Age in Colona
The median household income in Colona is $64,375, with the highest median household income of $96,250 found in the 25 to 44 years age bracket for the primary householder. A total of 762 households (33.3%) fall into this category. Meanwhile, the 65+ years age bracket for the primary householder has the lowest median household income of $38,922, with 683 households (29.8%) in this group.
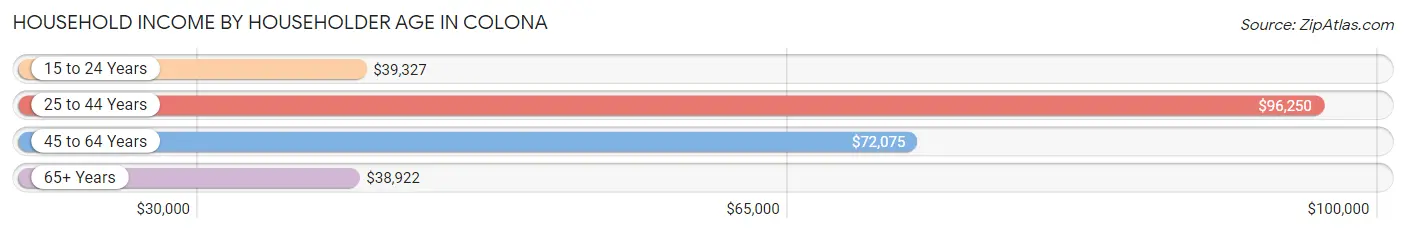
| Income Bracket | # Households | Median Income |
| 15 to 24 Years | 114 (5.0%) | $39,327 |
| 25 to 44 Years | 762 (33.3%) | $96,250 |
| 45 to 64 Years | 731 (31.9%) | $72,075 |
| 65+ Years | 683 (29.8%) | $38,922 |
| Total | 2,290 (100.0%) | $64,375 |
Poverty in Colona
Income Below Poverty by Sex and Age in Colona
With 4.2% poverty level for males and 7.2% for females among the residents of Colona, 75 year old and over males and 18 to 24 year old females are the most vulnerable to poverty, with 93 males (36.0%) and 71 females (26.7%) in their respective age groups living below the poverty level.
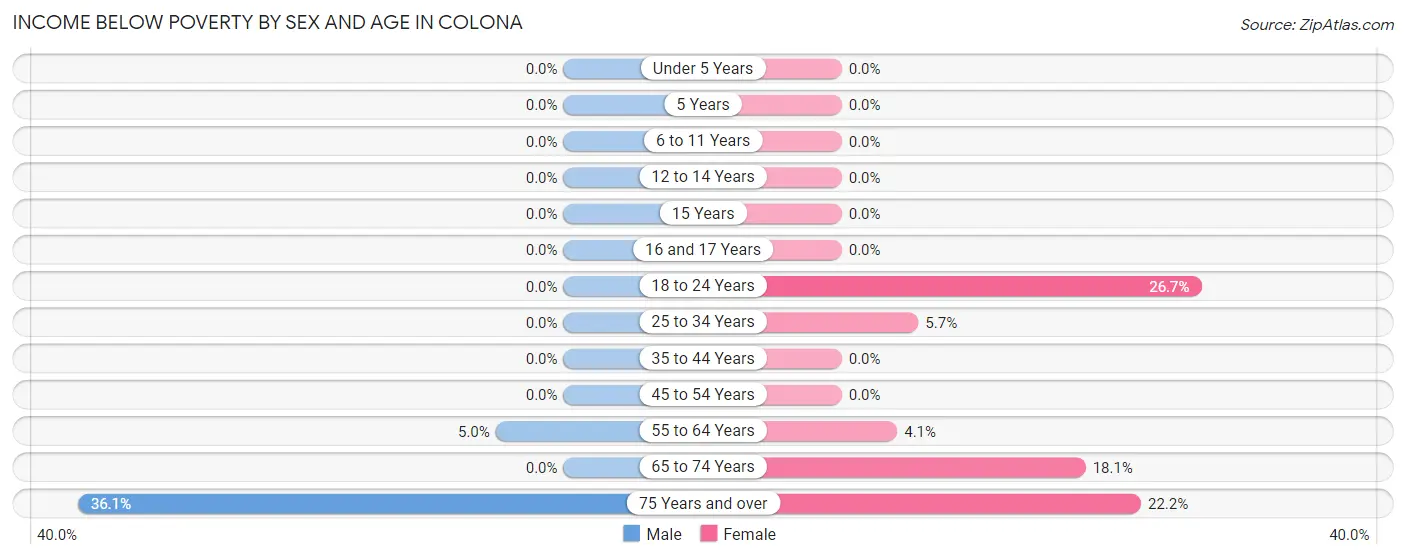
| Age Bracket | Male | Female |
| Under 5 Years | 0 (0.0%) | 0 (0.0%) |
| 5 Years | 0 (0.0%) | 0 (0.0%) |
| 6 to 11 Years | 0 (0.0%) | 0 (0.0%) |
| 12 to 14 Years | 0 (0.0%) | 0 (0.0%) |
| 15 Years | 0 (0.0%) | 0 (0.0%) |
| 16 and 17 Years | 0 (0.0%) | 0 (0.0%) |
| 18 to 24 Years | 0 (0.0%) | 71 (26.7%) |
| 25 to 34 Years | 0 (0.0%) | 21 (5.7%) |
| 35 to 44 Years | 0 (0.0%) | 0 (0.0%) |
| 45 to 54 Years | 0 (0.0%) | 0 (0.0%) |
| 55 to 64 Years | 16 (5.0%) | 18 (4.1%) |
| 65 to 74 Years | 0 (0.0%) | 69 (18.1%) |
| 75 Years and over | 93 (36.0%) | 22 (22.2%) |
| Total | 109 (4.2%) | 201 (7.2%) |
Income Above Poverty by Sex and Age in Colona
According to the poverty statistics in Colona, males aged under 5 years and females aged under 5 years are the age groups that are most secure financially, with 100.0% of males and 100.0% of females in these age groups living above the poverty line.
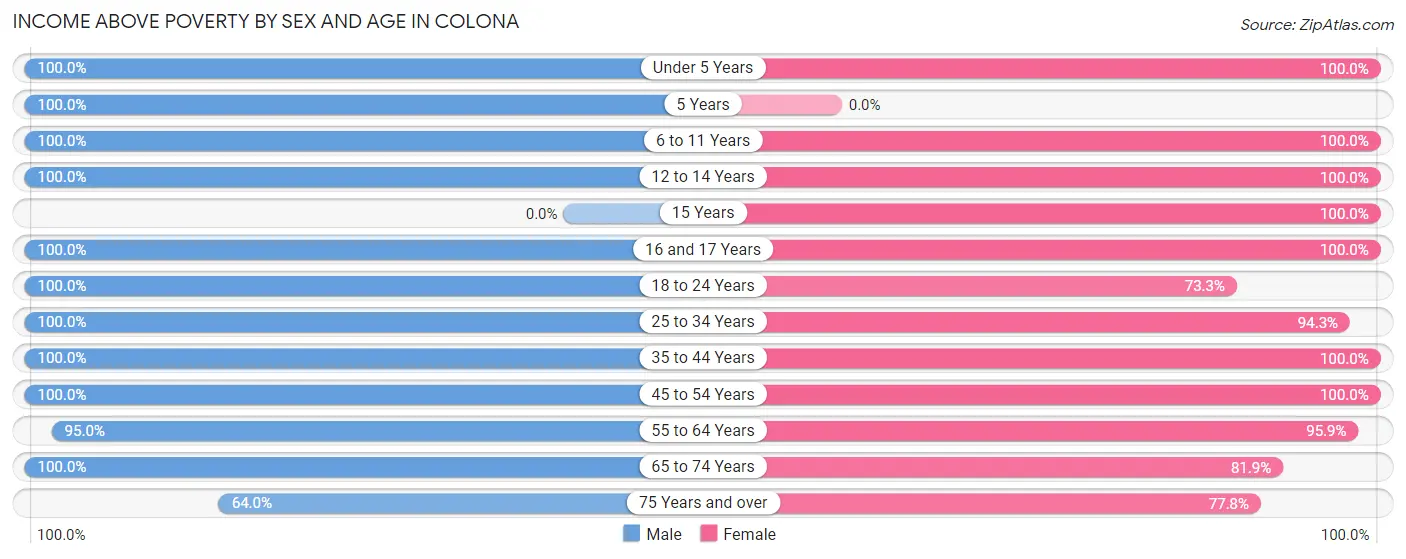
| Age Bracket | Male | Female |
| Under 5 Years | 95 (100.0%) | 31 (100.0%) |
| 5 Years | 102 (100.0%) | 0 (0.0%) |
| 6 to 11 Years | 55 (100.0%) | 161 (100.0%) |
| 12 to 14 Years | 194 (100.0%) | 111 (100.0%) |
| 15 Years | 0 (0.0%) | 29 (100.0%) |
| 16 and 17 Years | 82 (100.0%) | 140 (100.0%) |
| 18 to 24 Years | 251 (100.0%) | 195 (73.3%) |
| 25 to 34 Years | 318 (100.0%) | 348 (94.3%) |
| 35 to 44 Years | 416 (100.0%) | 379 (100.0%) |
| 45 to 54 Years | 239 (100.0%) | 386 (100.0%) |
| 55 to 64 Years | 302 (95.0%) | 419 (95.9%) |
| 65 to 74 Years | 287 (100.0%) | 312 (81.9%) |
| 75 Years and over | 165 (63.9%) | 77 (77.8%) |
| Total | 2,506 (95.8%) | 2,588 (92.8%) |
Income Below Poverty Among Married-Couple Families in Colona
The poverty statistics for married-couple families in Colona show that 5.8% or 65 of the total 1,122 families live below the poverty line. Families with no children have the highest poverty rate of 10.5%, comprising of 65 families. On the other hand, families with 1 or 2 children have the lowest poverty rate of 0.0%, which includes 0 families.
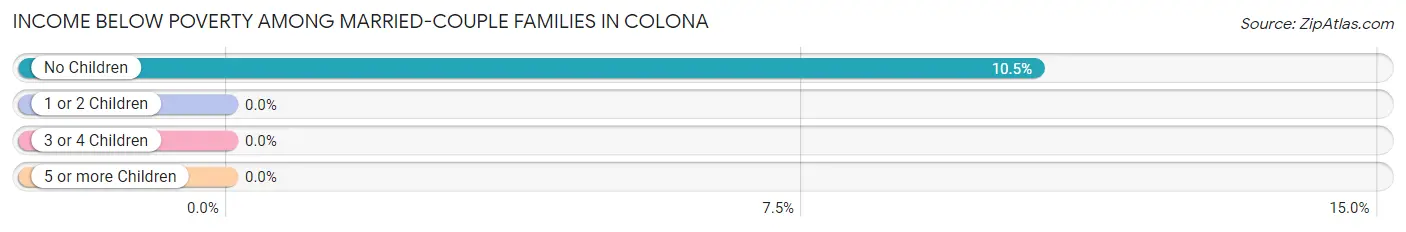
| Children | Above Poverty | Below Poverty |
| No Children | 553 (89.5%) | 65 (10.5%) |
| 1 or 2 Children | 464 (100.0%) | 0 (0.0%) |
| 3 or 4 Children | 40 (100.0%) | 0 (0.0%) |
| 5 or more Children | 0 (0.0%) | 0 (0.0%) |
| Total | 1,057 (94.2%) | 65 (5.8%) |
Income Below Poverty Among Single-Parent Households in Colona
| Children | Single Father | Single Mother |
| No Children | 0 (0.0%) | 0 (0.0%) |
| 1 or 2 Children | 0 (0.0%) | 0 (0.0%) |
| 3 or 4 Children | 0 (0.0%) | 0 (0.0%) |
| 5 or more Children | 0 (0.0%) | 0 (0.0%) |
| Total | 0 (0.0%) | 0 (0.0%) |
Income Below Poverty Among Married-Couple vs Single-Parent Households in Colona
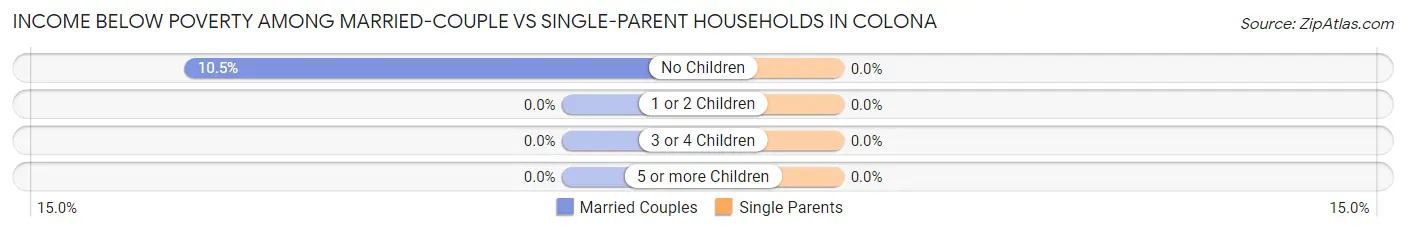
| Children | Married-Couple Families | Single-Parent Households |
| No Children | 65 (10.5%) | 0 (0.0%) |
| 1 or 2 Children | 0 (0.0%) | 0 (0.0%) |
| 3 or 4 Children | 0 (0.0%) | 0 (0.0%) |
| 5 or more Children | 0 (0.0%) | 0 (0.0%) |
| Total | 65 (5.8%) | 0 (0.0%) |
Race in Colona
The most populous races in Colona are White / Caucasian (4,797 | 88.8%), Hispanic or Latino (592 | 11.0%), and Two or more Races (454 | 8.4%).
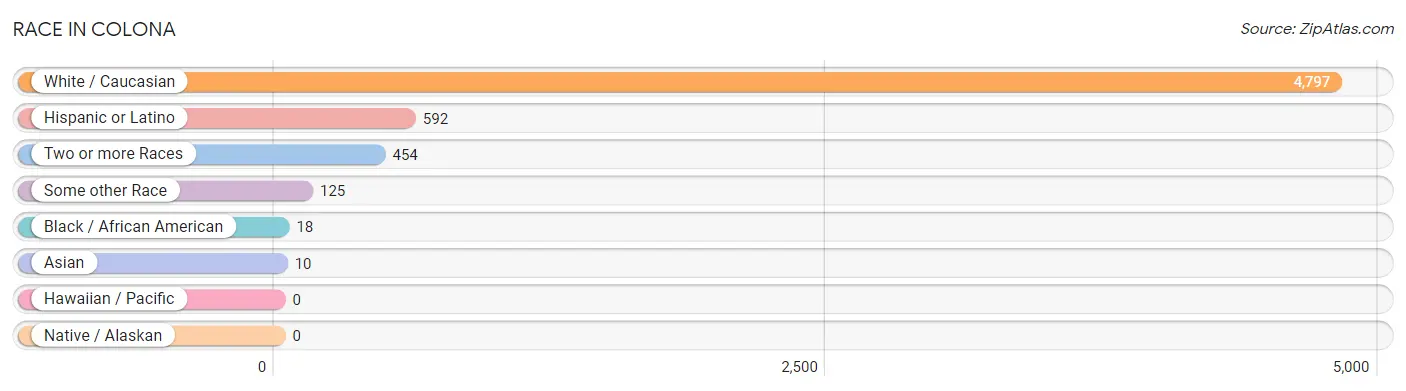
| Race | # Population | % Population |
| Asian | 10 | 0.2% |
| Black / African American | 18 | 0.3% |
| Hawaiian / Pacific | 0 | 0.0% |
| Hispanic or Latino | 592 | 11.0% |
| Native / Alaskan | 0 | 0.0% |
| White / Caucasian | 4,797 | 88.8% |
| Two or more Races | 454 | 8.4% |
| Some other Race | 125 | 2.3% |
| Total | 5,404 | 100.0% |
Ancestry in Colona
The most populous ancestries reported in Colona are German (1,022 | 18.9%), Irish (686 | 12.7%), Mexican (573 | 10.6%), American (445 | 8.2%), and Italian (361 | 6.7%), together accounting for 57.1% of all Colona residents.
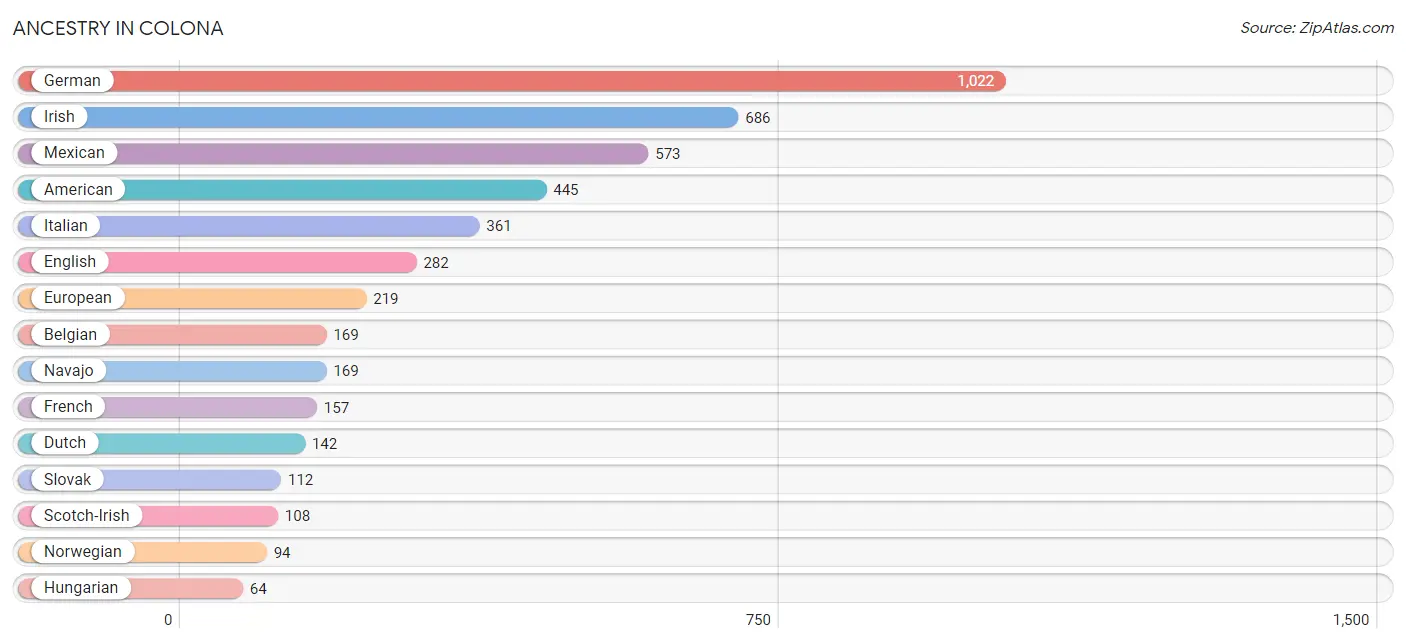
| Ancestry | # Population | % Population |
| American | 445 | 8.2% |
| Belgian | 169 | 3.1% |
| Blackfeet | 11 | 0.2% |
| British | 16 | 0.3% |
| Cherokee | 18 | 0.3% |
| Danish | 19 | 0.4% |
| Dutch | 142 | 2.6% |
| Eastern European | 37 | 0.7% |
| English | 282 | 5.2% |
| European | 219 | 4.1% |
| French | 157 | 2.9% |
| French Canadian | 16 | 0.3% |
| German | 1,022 | 18.9% |
| Greek | 14 | 0.3% |
| Hungarian | 64 | 1.2% |
| Irish | 686 | 12.7% |
| Italian | 361 | 6.7% |
| Mexican | 573 | 10.6% |
| Navajo | 169 | 3.1% |
| Norwegian | 94 | 1.7% |
| Polish | 14 | 0.3% |
| Scandinavian | 23 | 0.4% |
| Scotch-Irish | 108 | 2.0% |
| Scottish | 23 | 0.4% |
| Slovak | 112 | 2.1% |
| Spaniard | 19 | 0.4% |
| Sri Lankan | 34 | 0.6% |
| Swedish | 44 | 0.8% | View All 28 Rows |
Immigrants in Colona
The most numerous immigrant groups reported in Colona came from Asia (10 | 0.2%), South Eastern Asia (10 | 0.2%), Vietnam (10 | 0.2%), Europe (6 | 0.1%), and Southern Europe (6 | 0.1%), together accounting for 0.8% of all Colona residents.
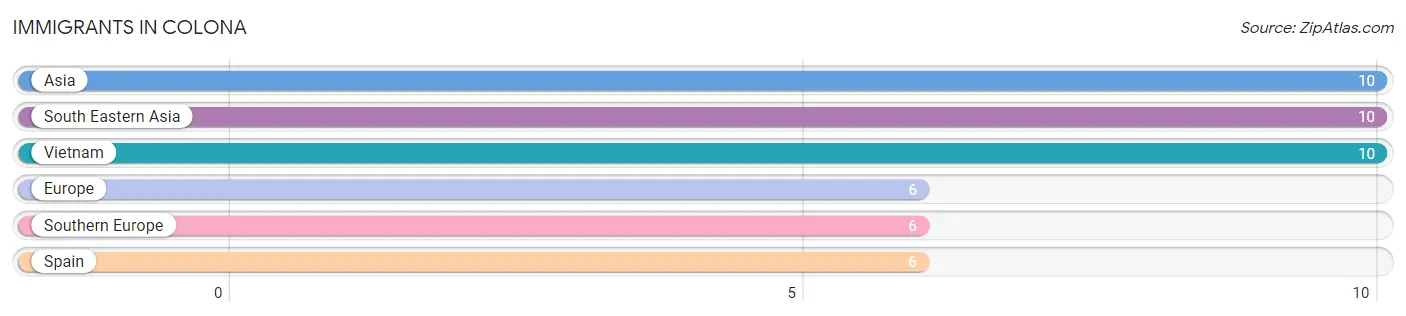
| Immigration Origin | # Population | % Population |
| Asia | 10 | 0.2% |
| Europe | 6 | 0.1% |
| South Eastern Asia | 10 | 0.2% |
| Southern Europe | 6 | 0.1% |
| Spain | 6 | 0.1% |
| Vietnam | 10 | 0.2% | View All 6 Rows |
Sex and Age in Colona
Sex and Age in Colona
The most populous age groups in Colona are 40 to 44 Years (347 | 13.3%) for men and 55 to 59 Years (308 | 11.0%) for women.
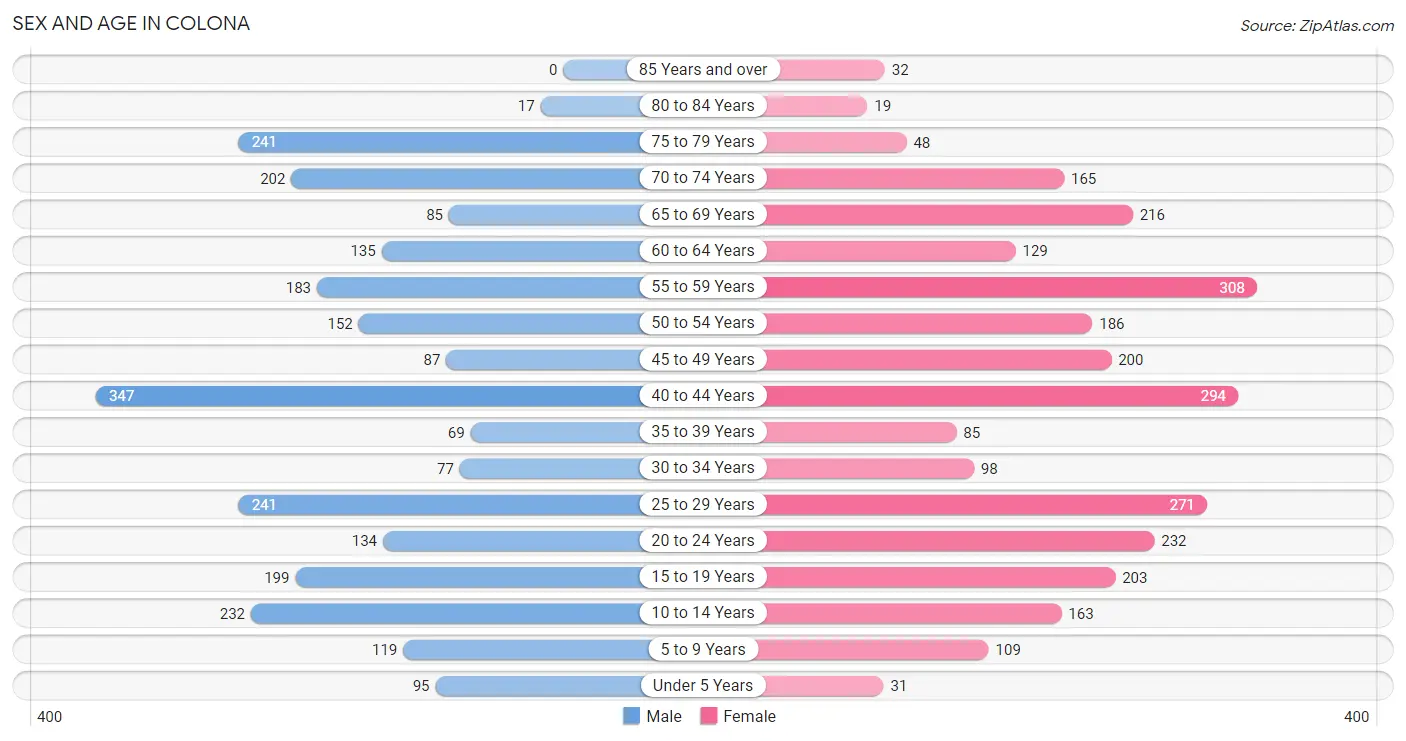
| Age Bracket | Male | Female |
| Under 5 Years | 95 (3.6%) | 31 (1.1%) |
| 5 to 9 Years | 119 (4.5%) | 109 (3.9%) |
| 10 to 14 Years | 232 (8.9%) | 163 (5.8%) |
| 15 to 19 Years | 199 (7.6%) | 203 (7.3%) |
| 20 to 24 Years | 134 (5.1%) | 232 (8.3%) |
| 25 to 29 Years | 241 (9.2%) | 271 (9.7%) |
| 30 to 34 Years | 77 (2.9%) | 98 (3.5%) |
| 35 to 39 Years | 69 (2.6%) | 85 (3.0%) |
| 40 to 44 Years | 347 (13.3%) | 294 (10.5%) |
| 45 to 49 Years | 87 (3.3%) | 200 (7.2%) |
| 50 to 54 Years | 152 (5.8%) | 186 (6.7%) |
| 55 to 59 Years | 183 (7.0%) | 308 (11.0%) |
| 60 to 64 Years | 135 (5.2%) | 129 (4.6%) |
| 65 to 69 Years | 85 (3.3%) | 216 (7.7%) |
| 70 to 74 Years | 202 (7.7%) | 165 (5.9%) |
| 75 to 79 Years | 241 (9.2%) | 48 (1.7%) |
| 80 to 84 Years | 17 (0.6%) | 19 (0.7%) |
| 85 Years and over | 0 (0.0%) | 32 (1.1%) |
| Total | 2,615 (100.0%) | 2,789 (100.0%) |
Families and Households in Colona
Median Family Size in Colona
The median family size in Colona is 2.92 persons per family, with single female/mother families (321 | 21.9%) accounting for the largest median family size of 3.29 persons per family. On the other hand, married-couple families (1,122 | 76.5%) represent the smallest median family size with 2.81 persons per family.
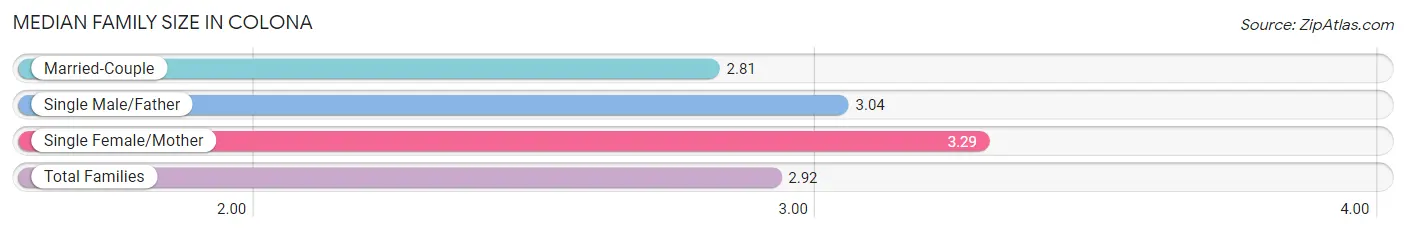
| Family Type | # Families | Family Size |
| Married-Couple | 1,122 (76.5%) | 2.81 |
| Single Male/Father | 24 (1.6%) | 3.04 |
| Single Female/Mother | 321 (21.9%) | 3.29 |
| Total Families | 1,467 (100.0%) | 2.92 |
Median Household Size in Colona
The median household size in Colona is 2.36 persons per household, with single female/mother households (321 | 14.0%) accounting for the largest median household size of 3.75 persons per household. non-family households (823 | 35.9%) represent the smallest median household size with 1.16 persons per household.
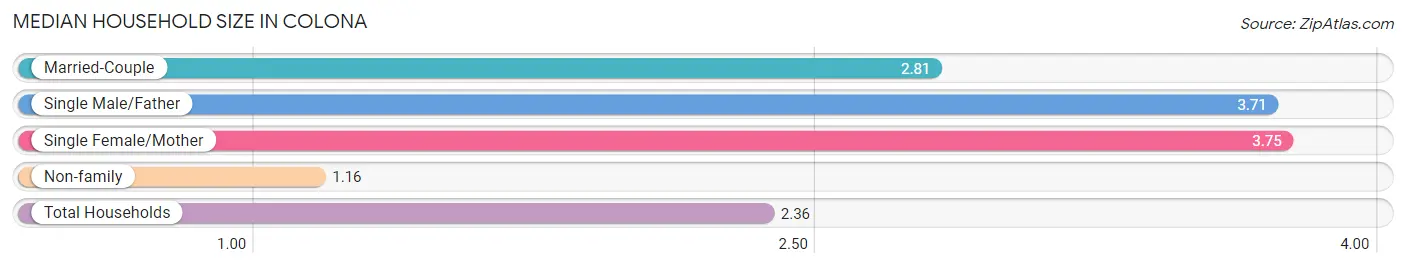
| Household Type | # Households | Household Size |
| Married-Couple | 1,122 (49.0%) | 2.81 |
| Single Male/Father | 24 (1.1%) | 3.71 |
| Single Female/Mother | 321 (14.0%) | 3.75 |
| Non-family | 823 (35.9%) | 1.16 |
| Total Households | 2,290 (100.0%) | 2.36 |
Household Size by Marriage Status in Colona
Out of a total of 2,290 households in Colona, 1,467 (64.1%) are family households, while 823 (35.9%) are nonfamily households. The most numerous type of family households are 3-person households, comprising 623, and the most common type of nonfamily households are 1-person households, comprising 687.
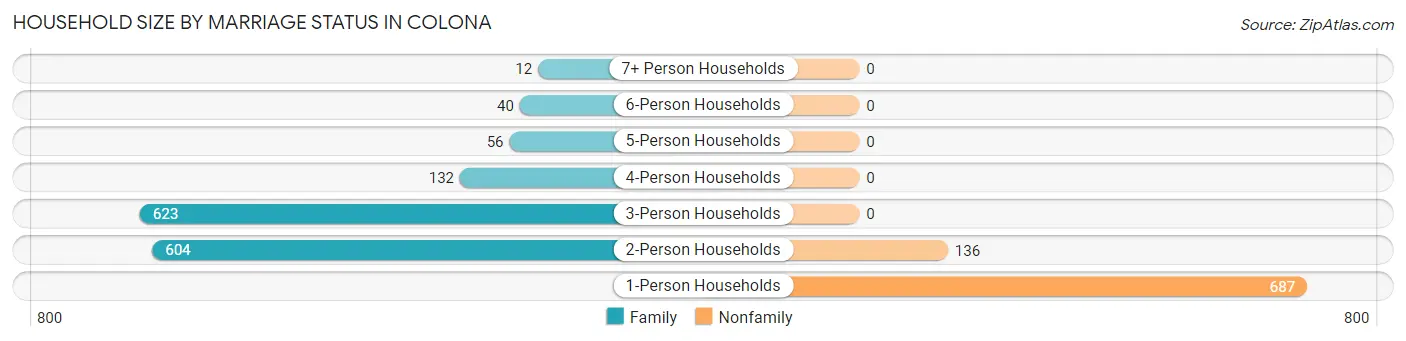
| Household Size | Family Households | Nonfamily Households |
| 1-Person Households | - | 687 (30.0%) |
| 2-Person Households | 604 (26.4%) | 136 (5.9%) |
| 3-Person Households | 623 (27.2%) | 0 (0.0%) |
| 4-Person Households | 132 (5.8%) | 0 (0.0%) |
| 5-Person Households | 56 (2.5%) | 0 (0.0%) |
| 6-Person Households | 40 (1.8%) | 0 (0.0%) |
| 7+ Person Households | 12 (0.5%) | 0 (0.0%) |
| Total | 1,467 (64.1%) | 823 (35.9%) |
Female Fertility in Colona
Fertility by Age in Colona
Average fertility rate in Colona is 35.0 births per 1,000 women. Women in the age bracket of 20 to 34 years have the highest fertility rate with 57.0 births per 1,000 women. Women in the age bracket of 20 to 34 years acount for 69.4% of all women with births.
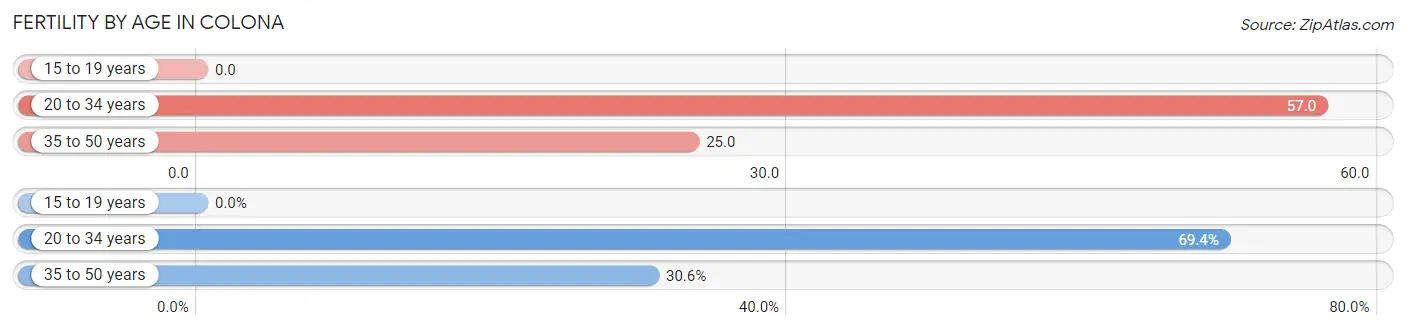
| Age Bracket | Women with Births | Births / 1,000 Women |
| 15 to 19 years | 0 (0.0%) | 0.0 |
| 20 to 34 years | 34 (69.4%) | 57.0 |
| 35 to 50 years | 15 (30.6%) | 25.0 |
| Total | 49 (100.0%) | 35.0 |
Fertility by Age by Marriage Status in Colona
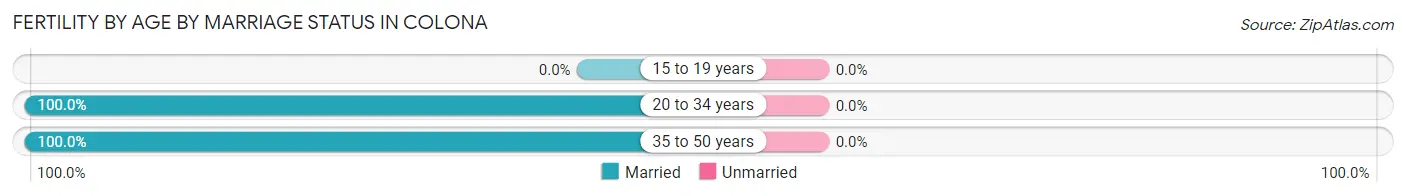
| Age Bracket | Married | Unmarried |
| 15 to 19 years | 0 (0.0%) | 0 (0.0%) |
| 20 to 34 years | 34 (100.0%) | 0 (0.0%) |
| 35 to 50 years | 15 (100.0%) | 0 (0.0%) |
| Total | 49 (100.0%) | 0 (0.0%) |
Fertility by Education in Colona
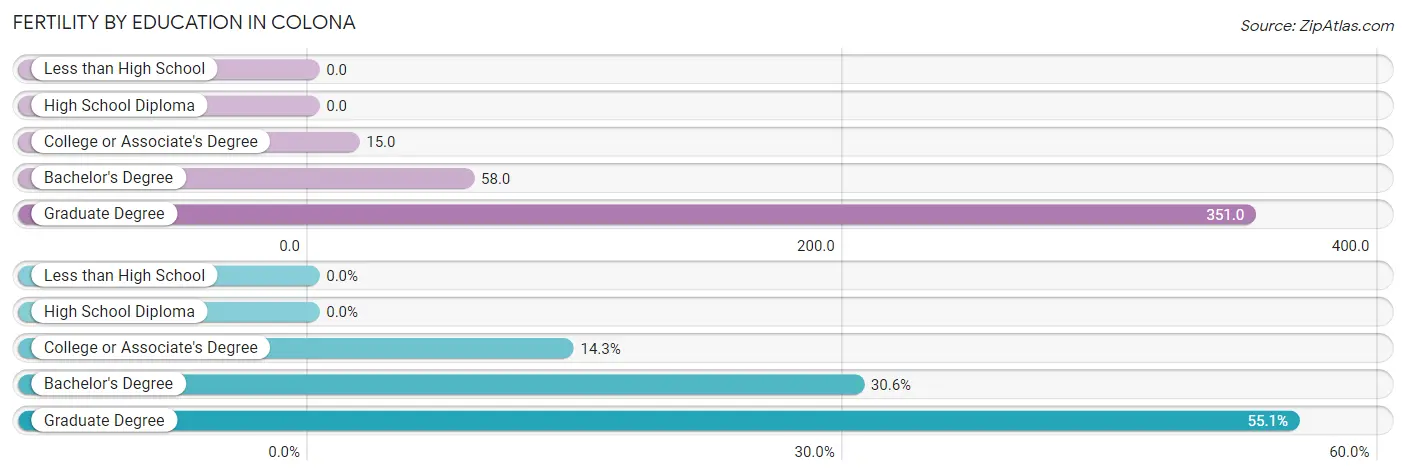
| Educational Attainment | Women with Births | Births / 1,000 Women |
| Less than High School | 0 (0.0%) | 0.0 |
| High School Diploma | 0 (0.0%) | 0.0 |
| College or Associate's Degree | 7 (14.3%) | 15.0 |
| Bachelor's Degree | 15 (30.6%) | 58.0 |
| Graduate Degree | 27 (55.1%) | 351.0 |
| Total | 49 (100.0%) | 35.0 |
Fertility by Education by Marriage Status in Colona
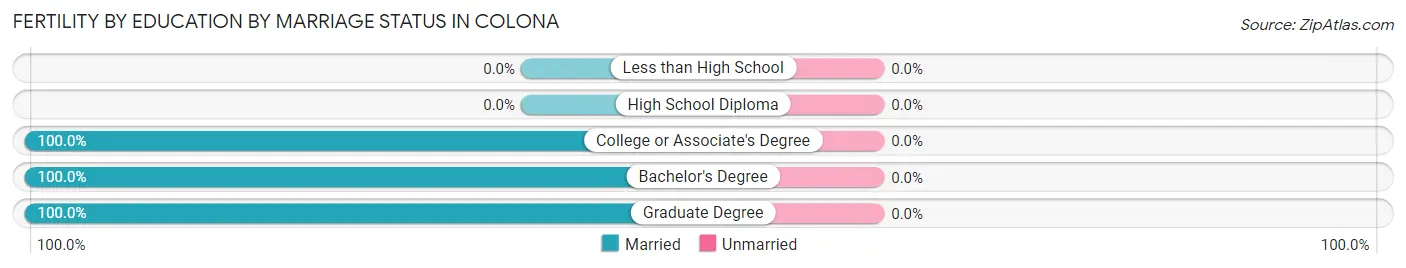
| Educational Attainment | Married | Unmarried |
| Less than High School | 0 (0.0%) | 0 (0.0%) |
| High School Diploma | 0 (0.0%) | 0 (0.0%) |
| College or Associate's Degree | 7 (100.0%) | 0 (0.0%) |
| Bachelor's Degree | 15 (100.0%) | 0 (0.0%) |
| Graduate Degree | 27 (100.0%) | 0 (0.0%) |
| Total | 49 (100.0%) | 0 (0.0%) |
Employment Characteristics in Colona
Employment by Class of Employer in Colona
Among the 3,061 employed individuals in Colona, private company employees (2,204 | 72.0%), not-for-profit organizations (314 | 10.3%), and local government employees (211 | 6.9%) make up the most common classes of employment.
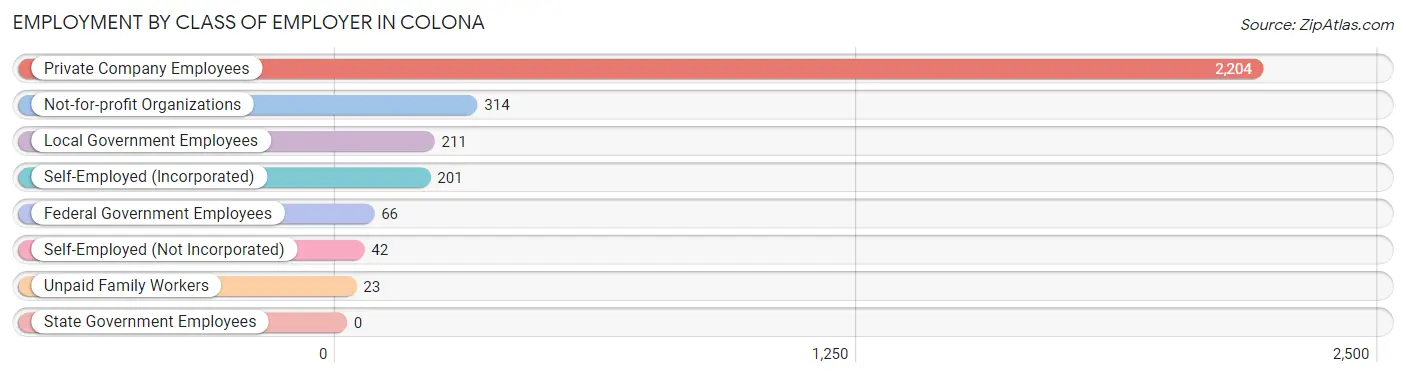
| Employer Class | # Employees | % Employees |
| Private Company Employees | 2,204 | 72.0% |
| Self-Employed (Incorporated) | 201 | 6.6% |
| Self-Employed (Not Incorporated) | 42 | 1.4% |
| Not-for-profit Organizations | 314 | 10.3% |
| Local Government Employees | 211 | 6.9% |
| State Government Employees | 0 | 0.0% |
| Federal Government Employees | 66 | 2.2% |
| Unpaid Family Workers | 23 | 0.7% |
| Total | 3,061 | 100.0% |
Employment Status by Age in Colona
According to the labor force statistics for Colona, out of the total population over 16 years of age (4,626), 70.0% or 3,238 individuals are in the labor force, with 3.4% or 110 of them unemployed. The age group with the highest labor force participation rate is 25 to 29 years, with 100.0% or 512 individuals in the labor force. Within the labor force, the 60 to 64 years age range has the highest percentage of unemployed individuals, with 12.9% or 15 of them being unemployed.
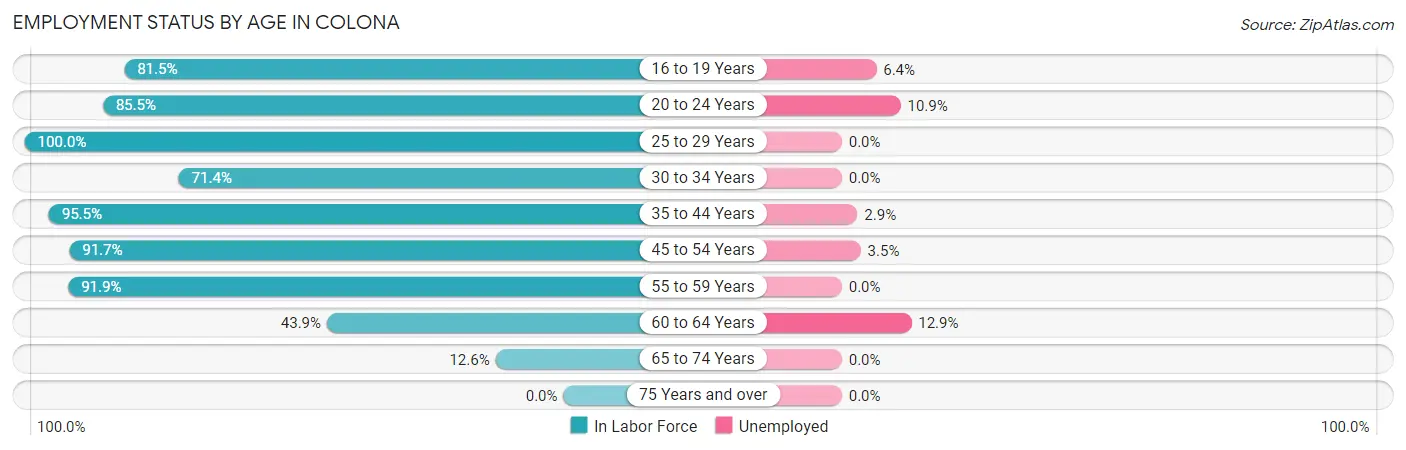
| Age Bracket | In Labor Force | Unemployed |
| 16 to 19 Years | 304 (81.5%) | 19 (6.4%) |
| 20 to 24 Years | 313 (85.5%) | 34 (10.9%) |
| 25 to 29 Years | 512 (100.0%) | 0 (0.0%) |
| 30 to 34 Years | 125 (71.4%) | 0 (0.0%) |
| 35 to 44 Years | 759 (95.5%) | 22 (2.9%) |
| 45 to 54 Years | 573 (91.7%) | 20 (3.5%) |
| 55 to 59 Years | 451 (91.9%) | 0 (0.0%) |
| 60 to 64 Years | 116 (43.9%) | 15 (12.9%) |
| 65 to 74 Years | 84 (12.6%) | 0 (0.0%) |
| 75 Years and over | 0 (0.0%) | 0 (0.0%) |
| Total | 3,238 (70.0%) | 110 (3.4%) |
Employment Status by Educational Attainment in Colona
According to labor force statistics for Colona, 88.6% of individuals (2,536) out of the total population between 25 and 64 years of age (2,862) are in the labor force, with 2.2% or 56 of them being unemployed. The group with the highest labor force participation rate are those with the educational attainment of bachelor's degree or higher, with 92.5% or 482 individuals in the labor force. Within the labor force, individuals with bachelor's degree or higher education have the highest percentage of unemployment, with 7.3% or 35 of them being unemployed.
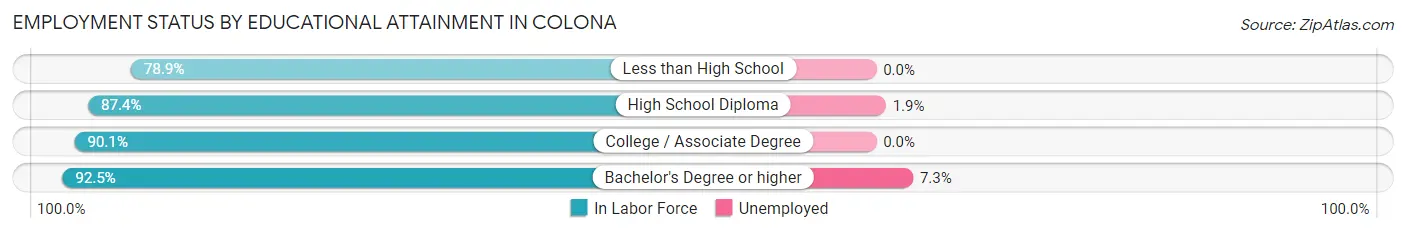
| Educational Attainment | In Labor Force | Unemployed |
| Less than High School | 135 (78.9%) | 0 (0.0%) |
| High School Diploma | 1,176 (87.4%) | 26 (1.9%) |
| College / Associate Degree | 743 (90.1%) | 0 (0.0%) |
| Bachelor's Degree or higher | 482 (92.5%) | 38 (7.3%) |
| Total | 2,536 (88.6%) | 63 (2.2%) |
Employment Occupations by Sex in Colona
Management, Business, Science and Arts Occupations
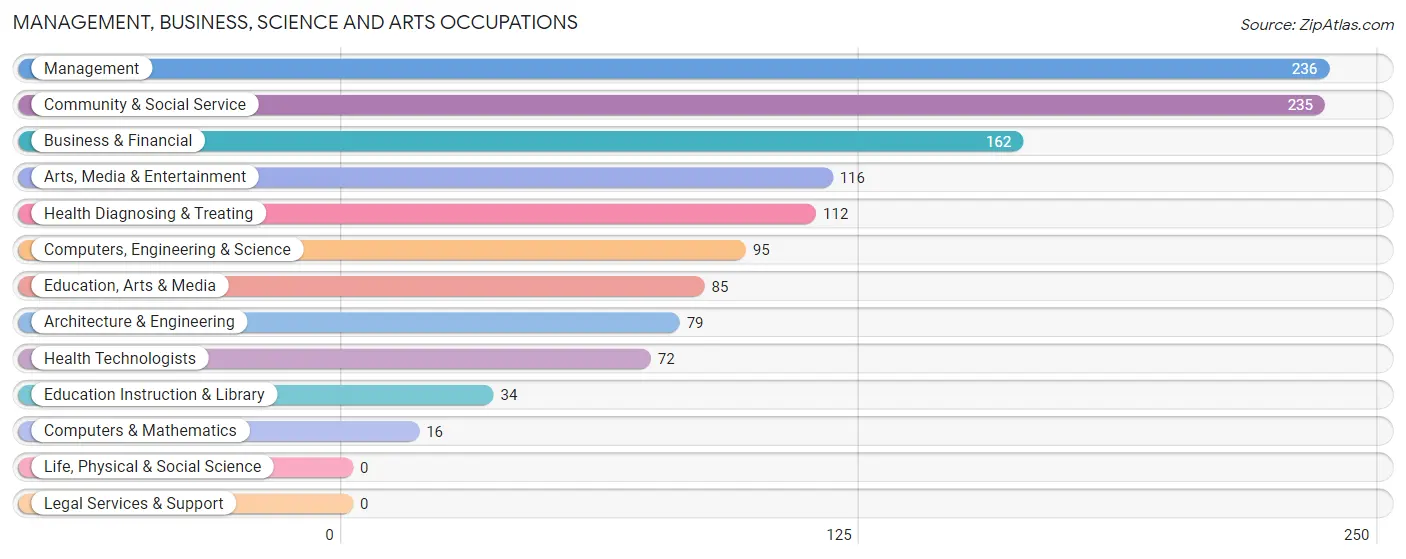
The most common Management, Business, Science and Arts occupations in Colona are Management (236 | 7.6%), Community & Social Service (235 | 7.6%), Business & Financial (162 | 5.2%), Arts, Media & Entertainment (116 | 3.7%), and Health Diagnosing & Treating (112 | 3.6%).
Management, Business, Science and Arts Occupations by Sex
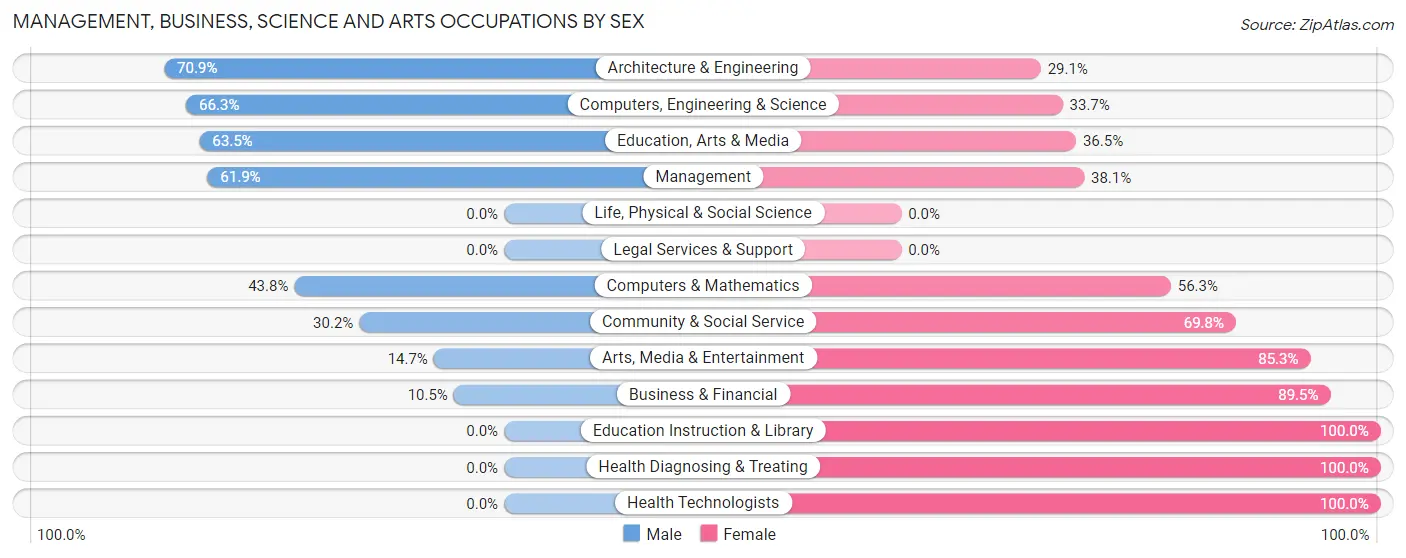
Within the Management, Business, Science and Arts occupations in Colona, the most male-oriented occupations are Architecture & Engineering (70.9%), Computers, Engineering & Science (66.3%), and Education, Arts & Media (63.5%), while the most female-oriented occupations are Education Instruction & Library (100.0%), Health Diagnosing & Treating (100.0%), and Health Technologists (100.0%).
| Occupation | Male | Female |
| Management | 146 (61.9%) | 90 (38.1%) |
| Business & Financial | 17 (10.5%) | 145 (89.5%) |
| Computers, Engineering & Science | 63 (66.3%) | 32 (33.7%) |
| Computers & Mathematics | 7 (43.8%) | 9 (56.2%) |
| Architecture & Engineering | 56 (70.9%) | 23 (29.1%) |
| Life, Physical & Social Science | 0 (0.0%) | 0 (0.0%) |
| Community & Social Service | 71 (30.2%) | 164 (69.8%) |
| Education, Arts & Media | 54 (63.5%) | 31 (36.5%) |
| Legal Services & Support | 0 (0.0%) | 0 (0.0%) |
| Education Instruction & Library | 0 (0.0%) | 34 (100.0%) |
| Arts, Media & Entertainment | 17 (14.7%) | 99 (85.3%) |
| Health Diagnosing & Treating | 0 (0.0%) | 112 (100.0%) |
| Health Technologists | 0 (0.0%) | 72 (100.0%) |
| Total (Category) | 297 (35.4%) | 543 (64.6%) |
| Total (Overall) | 1,487 (47.9%) | 1,620 (52.1%) |
Services Occupations
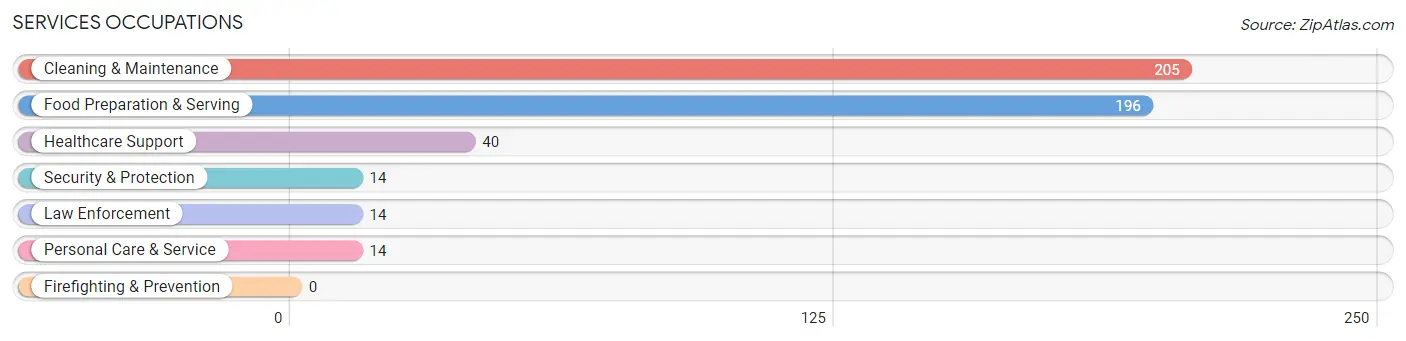
The most common Services occupations in Colona are Cleaning & Maintenance (205 | 6.6%), Food Preparation & Serving (196 | 6.3%), Healthcare Support (40 | 1.3%), Security & Protection (14 | 0.4%), and Law Enforcement (14 | 0.4%).
Services Occupations by Sex
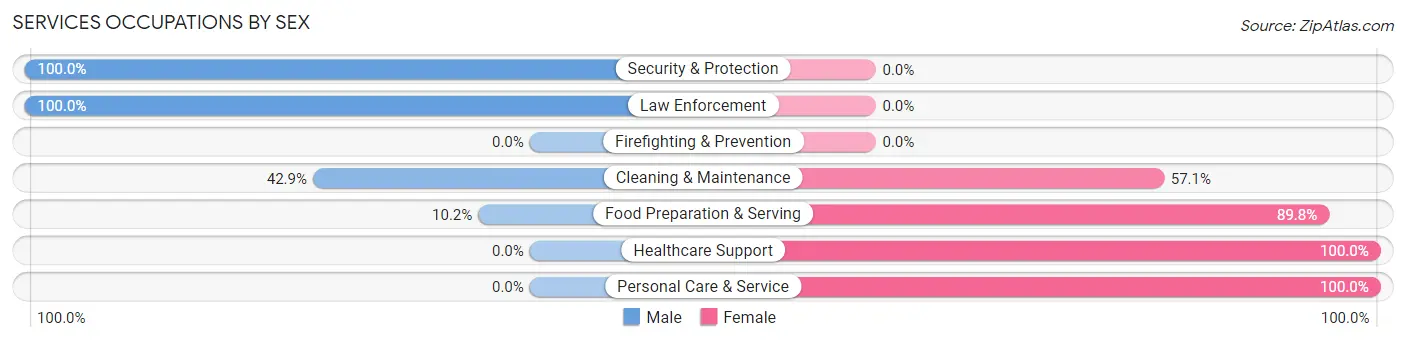
Within the Services occupations in Colona, the most male-oriented occupations are Security & Protection (100.0%), Law Enforcement (100.0%), and Cleaning & Maintenance (42.9%), while the most female-oriented occupations are Healthcare Support (100.0%), Personal Care & Service (100.0%), and Food Preparation & Serving (89.8%).
| Occupation | Male | Female |
| Healthcare Support | 0 (0.0%) | 40 (100.0%) |
| Security & Protection | 14 (100.0%) | 0 (0.0%) |
| Firefighting & Prevention | 0 (0.0%) | 0 (0.0%) |
| Law Enforcement | 14 (100.0%) | 0 (0.0%) |
| Food Preparation & Serving | 20 (10.2%) | 176 (89.8%) |
| Cleaning & Maintenance | 88 (42.9%) | 117 (57.1%) |
| Personal Care & Service | 0 (0.0%) | 14 (100.0%) |
| Total (Category) | 122 (26.0%) | 347 (74.0%) |
| Total (Overall) | 1,487 (47.9%) | 1,620 (52.1%) |
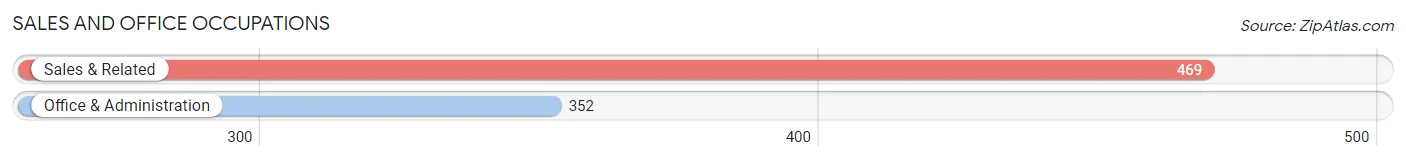
Sales and Office Occupations
The most common Sales and Office occupations in Colona are Sales & Related (469 | 15.1%), and Office & Administration (352 | 11.3%).
Sales and Office Occupations by Sex
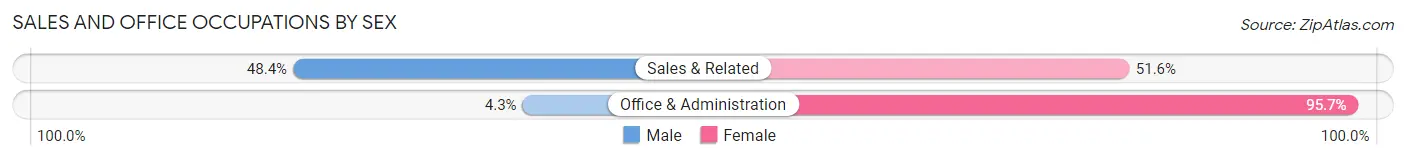
| Occupation | Male | Female |
| Sales & Related | 227 (48.4%) | 242 (51.6%) |
| Office & Administration | 15 (4.3%) | 337 (95.7%) |
| Total (Category) | 242 (29.5%) | 579 (70.5%) |
| Total (Overall) | 1,487 (47.9%) | 1,620 (52.1%) |
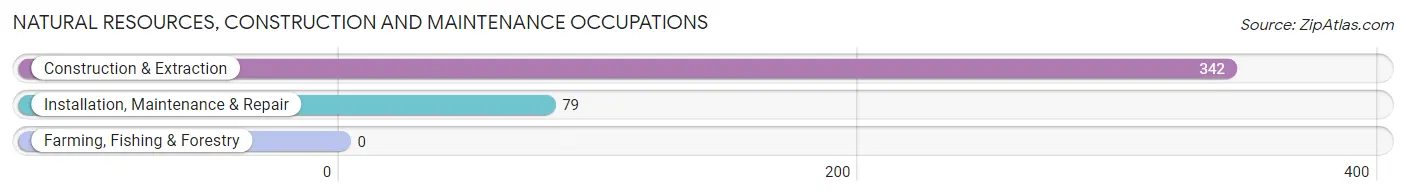
Natural Resources, Construction and Maintenance Occupations
The most common Natural Resources, Construction and Maintenance occupations in Colona are Construction & Extraction (342 | 11.0%), and Installation, Maintenance & Repair (79 | 2.5%).
Natural Resources, Construction and Maintenance Occupations by Sex
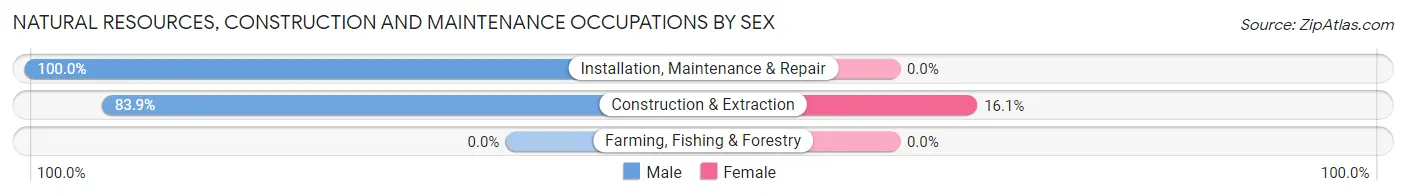
| Occupation | Male | Female |
| Farming, Fishing & Forestry | 0 (0.0%) | 0 (0.0%) |
| Construction & Extraction | 287 (83.9%) | 55 (16.1%) |
| Installation, Maintenance & Repair | 79 (100.0%) | 0 (0.0%) |
| Total (Category) | 366 (86.9%) | 55 (13.1%) |
| Total (Overall) | 1,487 (47.9%) | 1,620 (52.1%) |
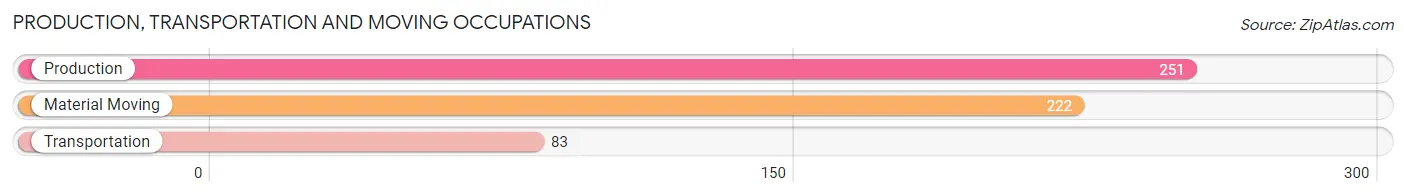
Production, Transportation and Moving Occupations
The most common Production, Transportation and Moving occupations in Colona are Production (251 | 8.1%), Material Moving (222 | 7.1%), and Transportation (83 | 2.7%).
Production, Transportation and Moving Occupations by Sex
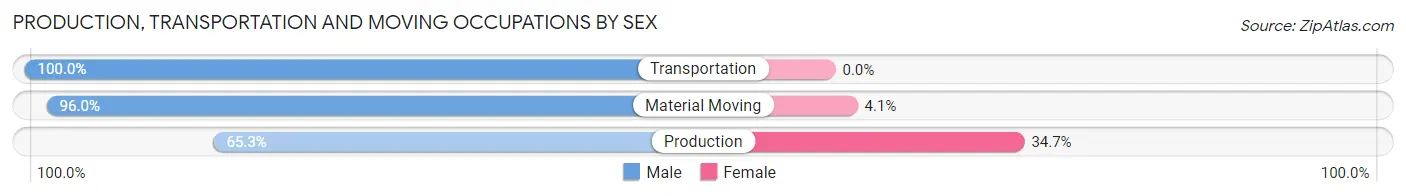
| Occupation | Male | Female |
| Production | 164 (65.3%) | 87 (34.7%) |
| Transportation | 83 (100.0%) | 0 (0.0%) |
| Material Moving | 213 (96.0%) | 9 (4.1%) |
| Total (Category) | 460 (82.7%) | 96 (17.3%) |
| Total (Overall) | 1,487 (47.9%) | 1,620 (52.1%) |
Employment Industries by Sex in Colona
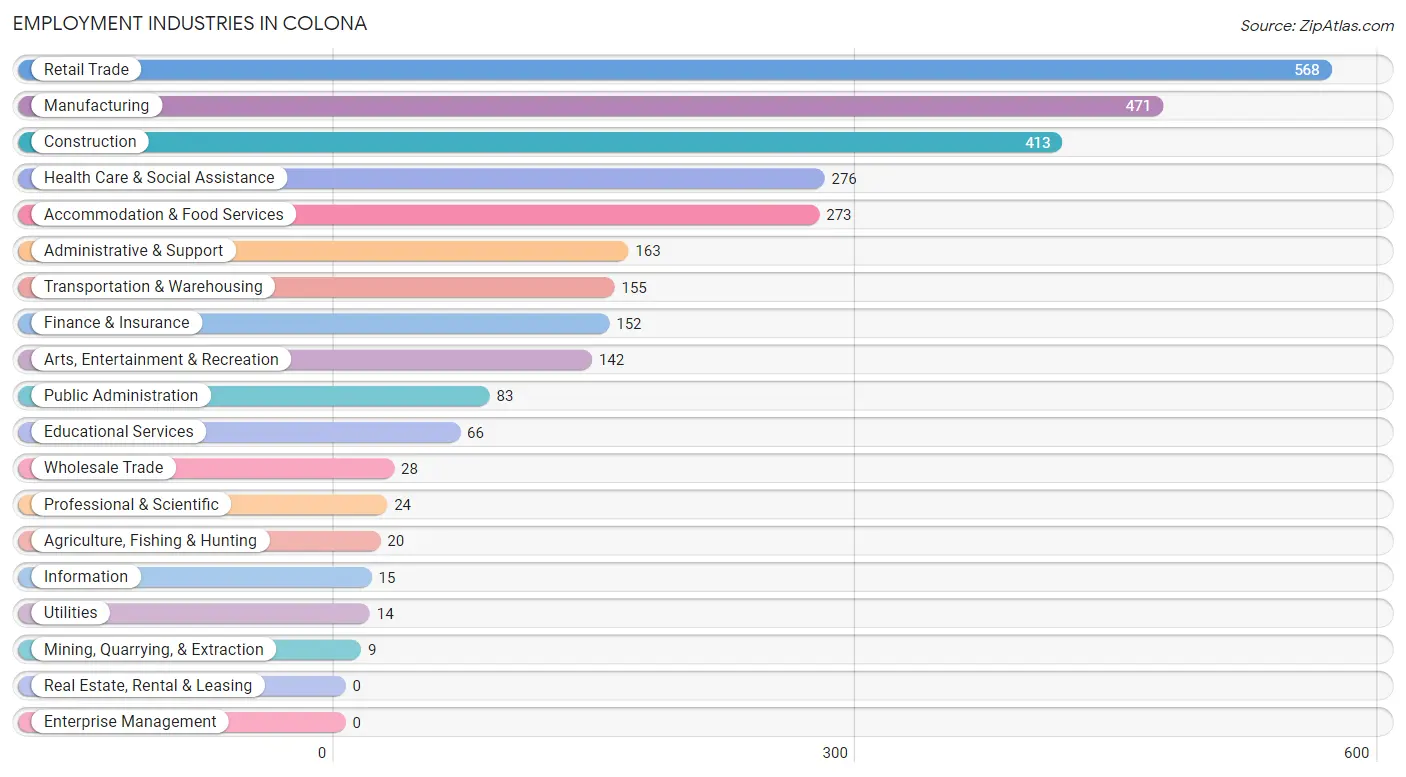
Employment Industries in Colona
The major employment industries in Colona include Retail Trade (568 | 18.3%), Manufacturing (471 | 15.2%), Construction (413 | 13.3%), Health Care & Social Assistance (276 | 8.9%), and Accommodation & Food Services (273 | 8.8%).
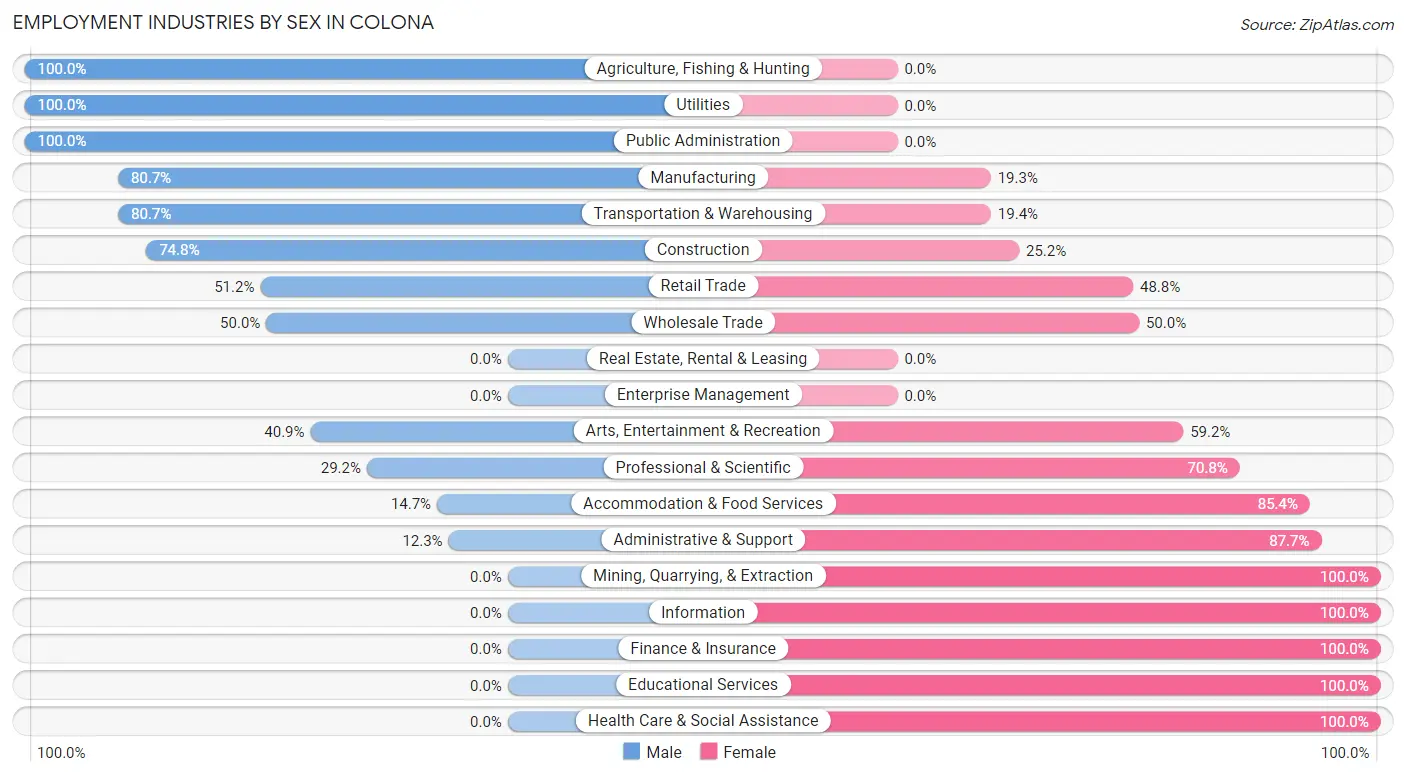
Employment Industries by Sex in Colona
The Colona industries that see more men than women are Agriculture, Fishing & Hunting (100.0%), Utilities (100.0%), and Public Administration (100.0%), whereas the industries that tend to have a higher number of women are Mining, Quarrying, & Extraction (100.0%), Information (100.0%), and Finance & Insurance (100.0%).
| Industry | Male | Female |
| Agriculture, Fishing & Hunting | 20 (100.0%) | 0 (0.0%) |
| Mining, Quarrying, & Extraction | 0 (0.0%) | 9 (100.0%) |
| Construction | 309 (74.8%) | 104 (25.2%) |
| Manufacturing | 380 (80.7%) | 91 (19.3%) |
| Wholesale Trade | 14 (50.0%) | 14 (50.0%) |
| Retail Trade | 291 (51.2%) | 277 (48.8%) |
| Transportation & Warehousing | 125 (80.6%) | 30 (19.4%) |
| Utilities | 14 (100.0%) | 0 (0.0%) |
| Information | 0 (0.0%) | 15 (100.0%) |
| Finance & Insurance | 0 (0.0%) | 152 (100.0%) |
| Real Estate, Rental & Leasing | 0 (0.0%) | 0 (0.0%) |
| Professional & Scientific | 7 (29.2%) | 17 (70.8%) |
| Enterprise Management | 0 (0.0%) | 0 (0.0%) |
| Administrative & Support | 20 (12.3%) | 143 (87.7%) |
| Educational Services | 0 (0.0%) | 66 (100.0%) |
| Health Care & Social Assistance | 0 (0.0%) | 276 (100.0%) |
| Arts, Entertainment & Recreation | 58 (40.8%) | 84 (59.2%) |
| Accommodation & Food Services | 40 (14.6%) | 233 (85.4%) |
| Public Administration | 83 (100.0%) | 0 (0.0%) |
| Total | 1,487 (47.9%) | 1,620 (52.1%) |
Education in Colona
School Enrollment in Colona
The most common levels of schooling among the 1,203 students in Colona are high school (459 | 38.2%), middle school (263 | 21.9%), and elementary school (134 | 11.1%).
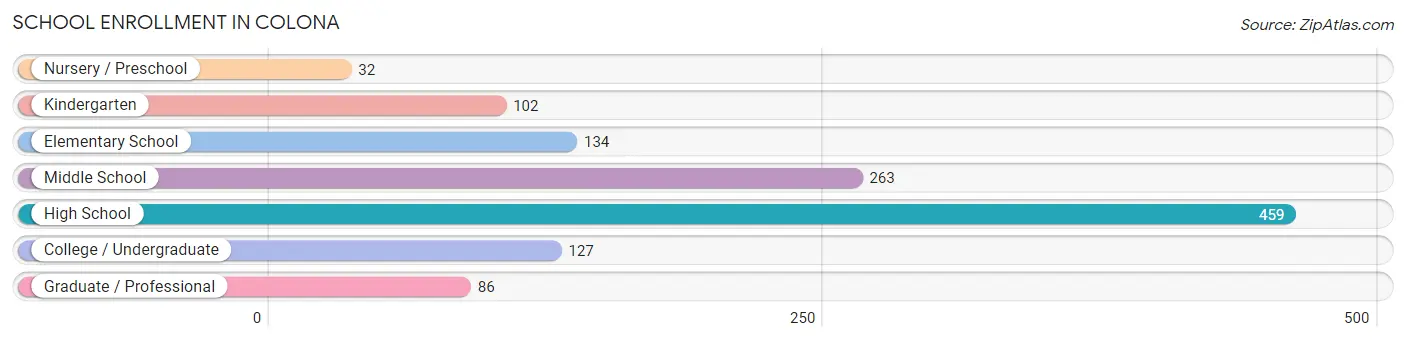
| School Level | # Students | % Students |
| Nursery / Preschool | 32 | 2.7% |
| Kindergarten | 102 | 8.5% |
| Elementary School | 134 | 11.1% |
| Middle School | 263 | 21.9% |
| High School | 459 | 38.2% |
| College / Undergraduate | 127 | 10.6% |
| Graduate / Professional | 86 | 7.1% |
| Total | 1,203 | 100.0% |
School Enrollment by Age by Funding Source in Colona
Out of a total of 1,203 students who are enrolled in schools in Colona, 143 (11.9%) attend a private institution, while the remaining 1,060 (88.1%) are enrolled in public schools. The age group of 3 to 4 year olds has the highest likelihood of being enrolled in private schools, with 22 (68.8% in the age bracket) enrolled. Conversely, the age group of 5 to 9 year old has the lowest likelihood of being enrolled in a private school, with 228 (100.0% in the age bracket) attending a public institution.
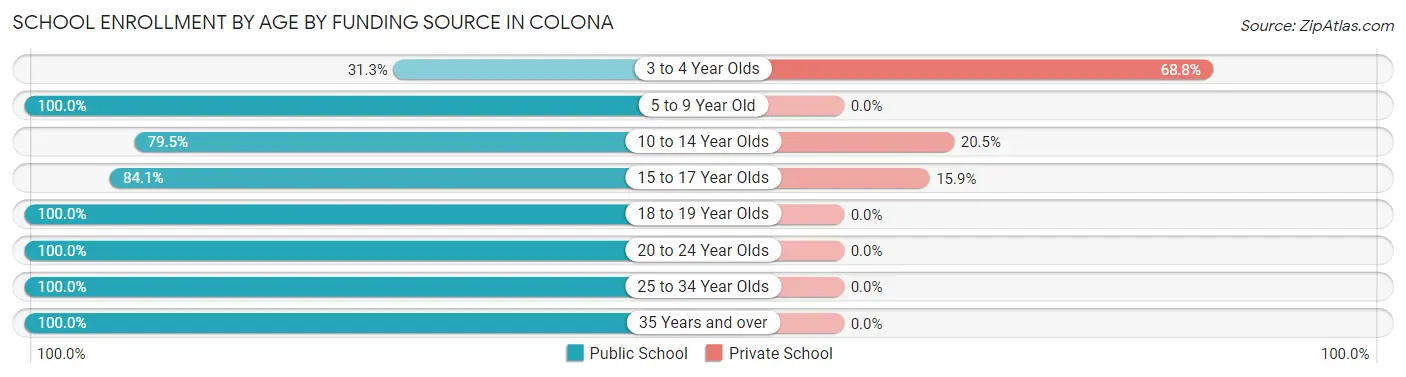
| Age Bracket | Public School | Private School |
| 3 to 4 Year Olds | 10 (31.2%) | 22 (68.8%) |
| 5 to 9 Year Old | 228 (100.0%) | 0 (0.0%) |
| 10 to 14 Year Olds | 314 (79.5%) | 81 (20.5%) |
| 15 to 17 Year Olds | 211 (84.1%) | 40 (15.9%) |
| 18 to 19 Year Olds | 84 (100.0%) | 0 (0.0%) |
| 20 to 24 Year Olds | 75 (100.0%) | 0 (0.0%) |
| 25 to 34 Year Olds | 18 (100.0%) | 0 (0.0%) |
| 35 Years and over | 120 (100.0%) | 0 (0.0%) |
| Total | 1,060 (88.1%) | 143 (11.9%) |
Educational Attainment by Field of Study in Colona
Business (152 | 22.0%), engineering (99 | 14.3%), science & technology (99 | 14.3%), liberal arts & history (92 | 13.3%), and arts & humanities (87 | 12.6%) are the most common fields of study among 691 individuals in Colona who have obtained a bachelor's degree or higher.
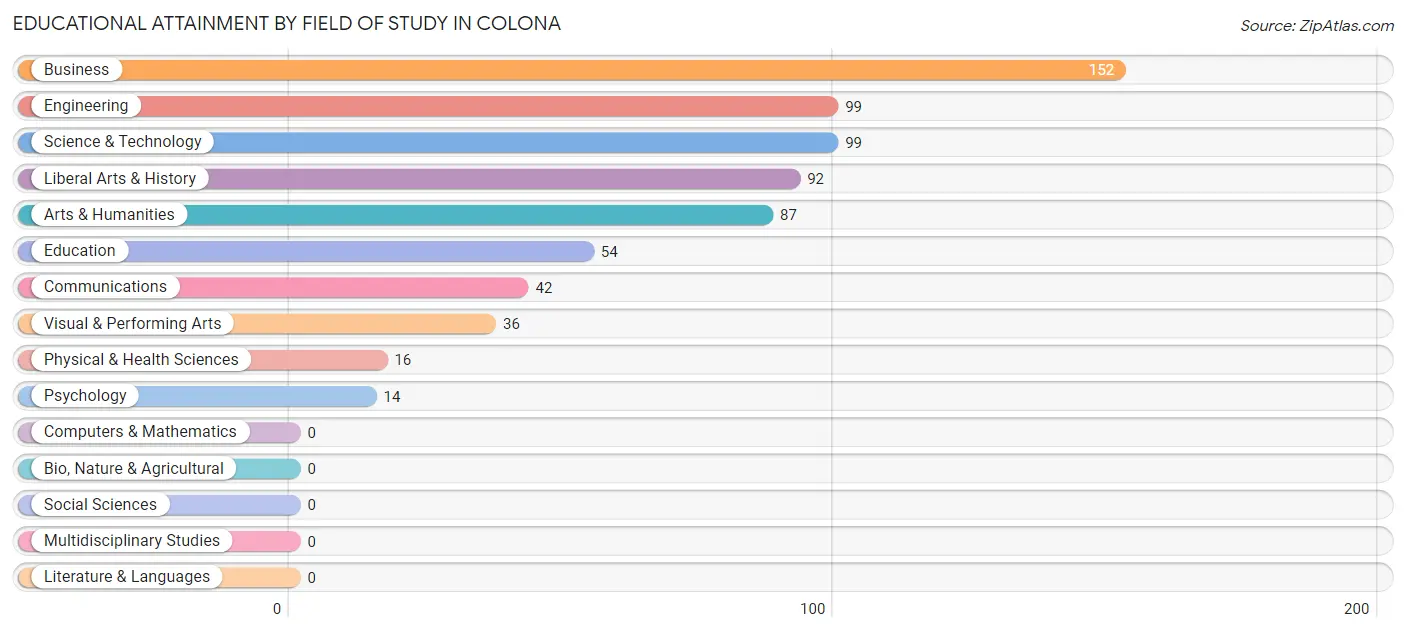
| Field of Study | # Graduates | % Graduates |
| Computers & Mathematics | 0 | 0.0% |
| Bio, Nature & Agricultural | 0 | 0.0% |
| Physical & Health Sciences | 16 | 2.3% |
| Psychology | 14 | 2.0% |
| Social Sciences | 0 | 0.0% |
| Engineering | 99 | 14.3% |
| Multidisciplinary Studies | 0 | 0.0% |
| Science & Technology | 99 | 14.3% |
| Business | 152 | 22.0% |
| Education | 54 | 7.8% |
| Literature & Languages | 0 | 0.0% |
| Liberal Arts & History | 92 | 13.3% |
| Visual & Performing Arts | 36 | 5.2% |
| Communications | 42 | 6.1% |
| Arts & Humanities | 87 | 12.6% |
| Total | 691 | 100.0% |
Transportation & Commute in Colona
Vehicle Availability by Sex in Colona
The most prevalent vehicle ownership categories in Colona are males with 2 vehicles (468, accounting for 33.0%) and females with 2 vehicles (652, making up 28.5%).
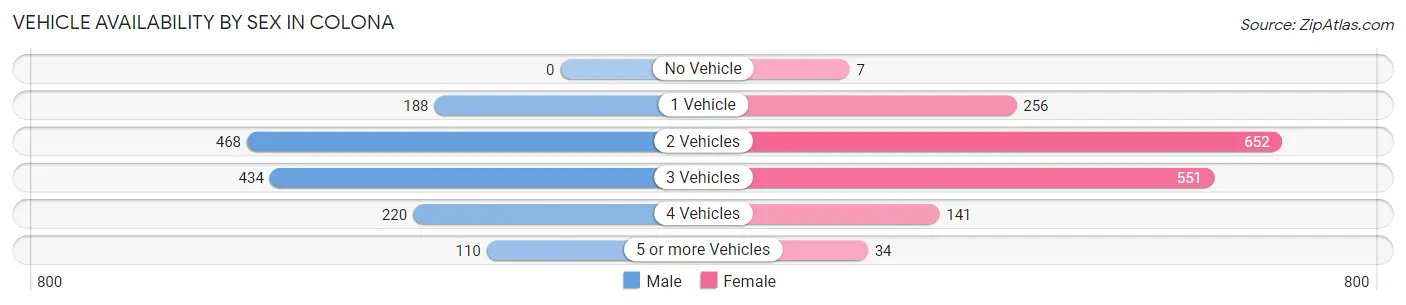
| Vehicles Available | Male | Female |
| No Vehicle | 0 (0.0%) | 7 (0.4%) |
| 1 Vehicle | 188 (13.2%) | 256 (15.6%) |
| 2 Vehicles | 468 (33.0%) | 652 (39.7%) |
| 3 Vehicles | 434 (30.6%) | 551 (33.6%) |
| 4 Vehicles | 220 (15.5%) | 141 (8.6%) |
| 5 or more Vehicles | 110 (7.7%) | 34 (2.1%) |
| Total | 1,420 (100.0%) | 1,641 (100.0%) |
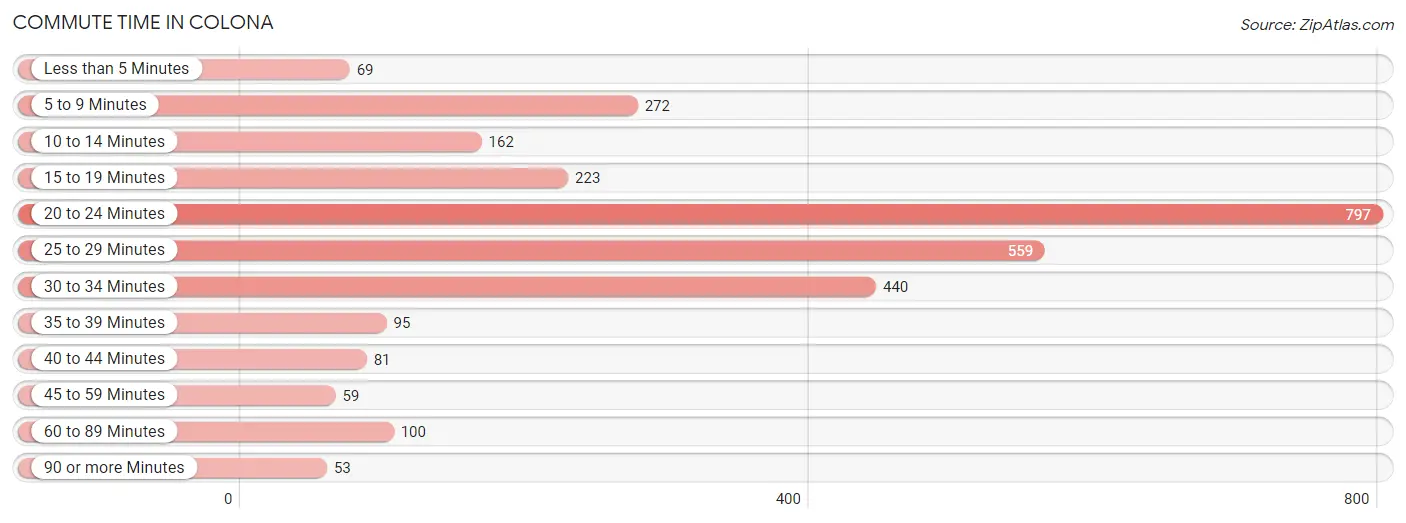
Commute Time in Colona
The most frequently occuring commute durations in Colona are 20 to 24 minutes (797 commuters, 27.4%), 25 to 29 minutes (559 commuters, 19.2%), and 30 to 34 minutes (440 commuters, 15.1%).
| Commute Time | # Commuters | % Commuters |
| Less than 5 Minutes | 69 | 2.4% |
| 5 to 9 Minutes | 272 | 9.3% |
| 10 to 14 Minutes | 162 | 5.6% |
| 15 to 19 Minutes | 223 | 7.7% |
| 20 to 24 Minutes | 797 | 27.4% |
| 25 to 29 Minutes | 559 | 19.2% |
| 30 to 34 Minutes | 440 | 15.1% |
| 35 to 39 Minutes | 95 | 3.3% |
| 40 to 44 Minutes | 81 | 2.8% |
| 45 to 59 Minutes | 59 | 2.0% |
| 60 to 89 Minutes | 100 | 3.4% |
| 90 or more Minutes | 53 | 1.8% |
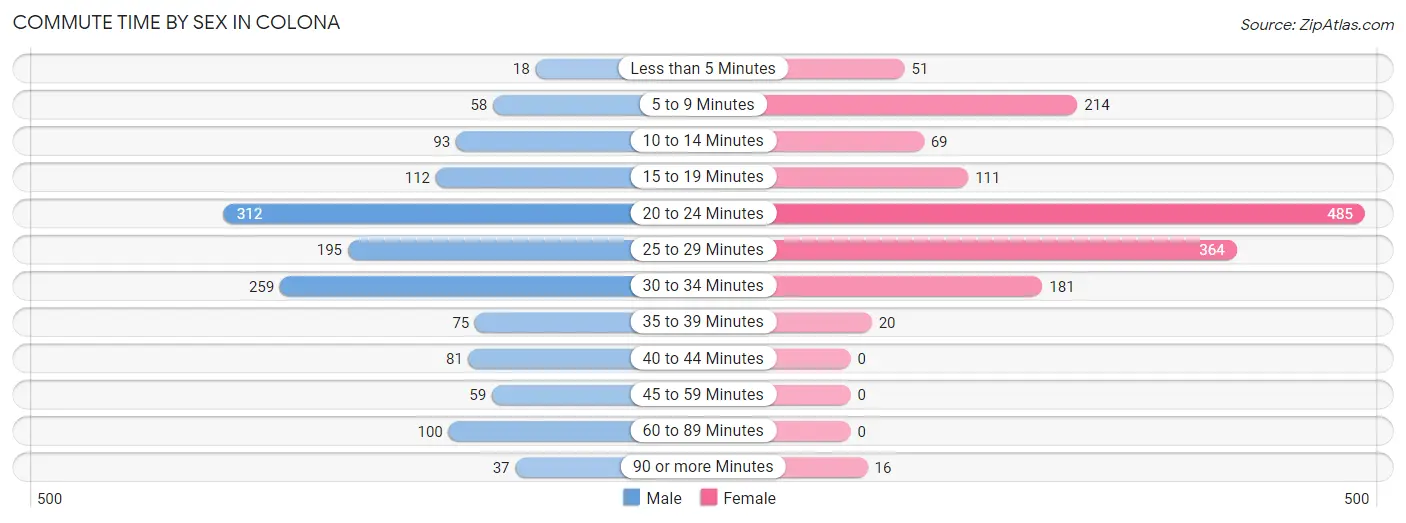
Commute Time by Sex in Colona
The most common commute times in Colona are 20 to 24 minutes (312 commuters, 22.3%) for males and 20 to 24 minutes (485 commuters, 32.1%) for females.
| Commute Time | Male | Female |
| Less than 5 Minutes | 18 (1.3%) | 51 (3.4%) |
| 5 to 9 Minutes | 58 (4.2%) | 214 (14.2%) |
| 10 to 14 Minutes | 93 (6.7%) | 69 (4.6%) |
| 15 to 19 Minutes | 112 (8.0%) | 111 (7.3%) |
| 20 to 24 Minutes | 312 (22.3%) | 485 (32.1%) |
| 25 to 29 Minutes | 195 (13.9%) | 364 (24.1%) |
| 30 to 34 Minutes | 259 (18.5%) | 181 (12.0%) |
| 35 to 39 Minutes | 75 (5.4%) | 20 (1.3%) |
| 40 to 44 Minutes | 81 (5.8%) | 0 (0.0%) |
| 45 to 59 Minutes | 59 (4.2%) | 0 (0.0%) |
| 60 to 89 Minutes | 100 (7.1%) | 0 (0.0%) |
| 90 or more Minutes | 37 (2.6%) | 16 (1.1%) |
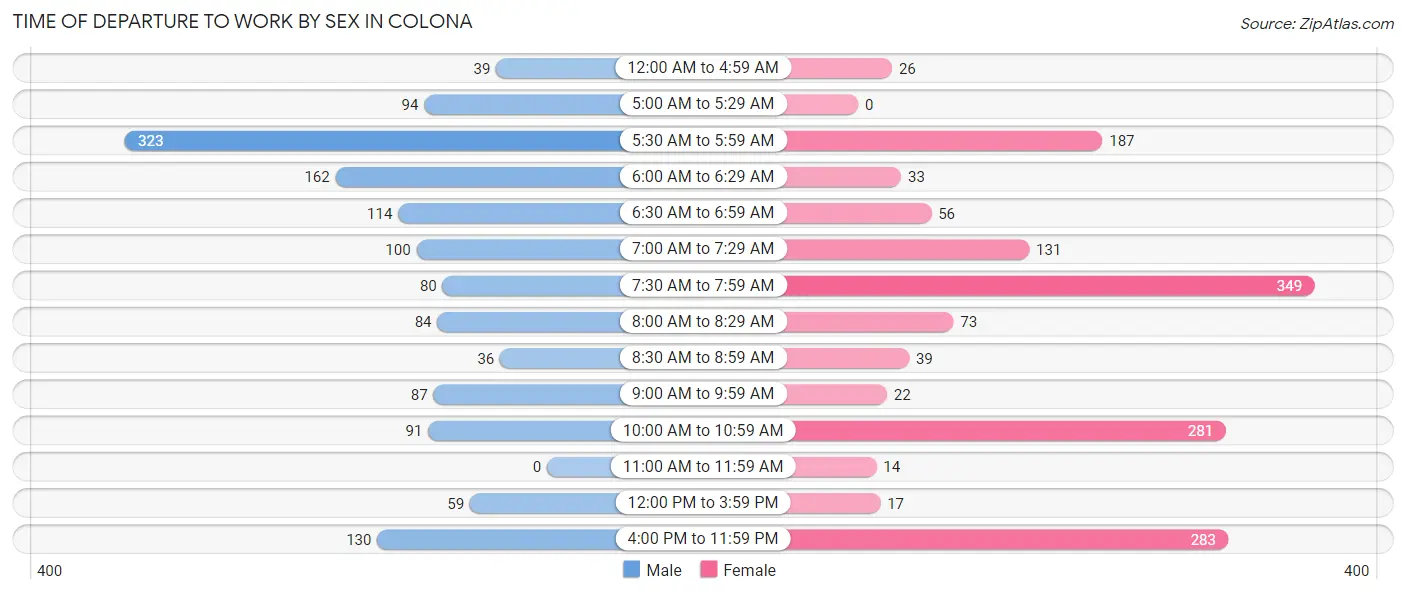
Time of Departure to Work by Sex in Colona
The most frequent times of departure to work in Colona are 5:30 AM to 5:59 AM (323, 23.1%) for males and 7:30 AM to 7:59 AM (349, 23.1%) for females.
| Time of Departure | Male | Female |
| 12:00 AM to 4:59 AM | 39 (2.8%) | 26 (1.7%) |
| 5:00 AM to 5:29 AM | 94 (6.7%) | 0 (0.0%) |
| 5:30 AM to 5:59 AM | 323 (23.1%) | 187 (12.4%) |
| 6:00 AM to 6:29 AM | 162 (11.6%) | 33 (2.2%) |
| 6:30 AM to 6:59 AM | 114 (8.2%) | 56 (3.7%) |
| 7:00 AM to 7:29 AM | 100 (7.1%) | 131 (8.7%) |
| 7:30 AM to 7:59 AM | 80 (5.7%) | 349 (23.1%) |
| 8:00 AM to 8:29 AM | 84 (6.0%) | 73 (4.8%) |
| 8:30 AM to 8:59 AM | 36 (2.6%) | 39 (2.6%) |
| 9:00 AM to 9:59 AM | 87 (6.2%) | 22 (1.5%) |
| 10:00 AM to 10:59 AM | 91 (6.5%) | 281 (18.6%) |
| 11:00 AM to 11:59 AM | 0 (0.0%) | 14 (0.9%) |
| 12:00 PM to 3:59 PM | 59 (4.2%) | 17 (1.1%) |
| 4:00 PM to 11:59 PM | 130 (9.3%) | 283 (18.7%) |
| Total | 1,399 (100.0%) | 1,511 (100.0%) |
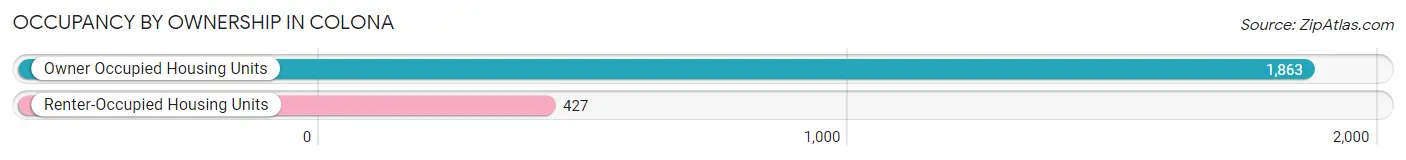
Housing Occupancy in Colona
Occupancy by Ownership in Colona
Of the total 2,290 dwellings in Colona, owner-occupied units account for 1,863 (81.4%), while renter-occupied units make up 427 (18.6%).
| Occupancy | # Housing Units | % Housing Units |
| Owner Occupied Housing Units | 1,863 | 81.4% |
| Renter-Occupied Housing Units | 427 | 18.6% |
| Total Occupied Housing Units | 2,290 | 100.0% |
Occupancy by Household Size in Colona
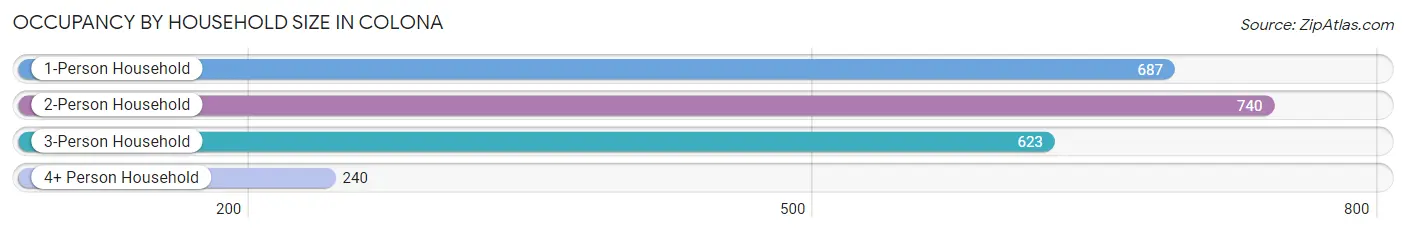
| Household Size | # Housing Units | % Housing Units |
| 1-Person Household | 687 | 30.0% |
| 2-Person Household | 740 | 32.3% |
| 3-Person Household | 623 | 27.2% |
| 4+ Person Household | 240 | 10.5% |
| Total Housing Units | 2,290 | 100.0% |
Occupancy by Ownership by Household Size in Colona
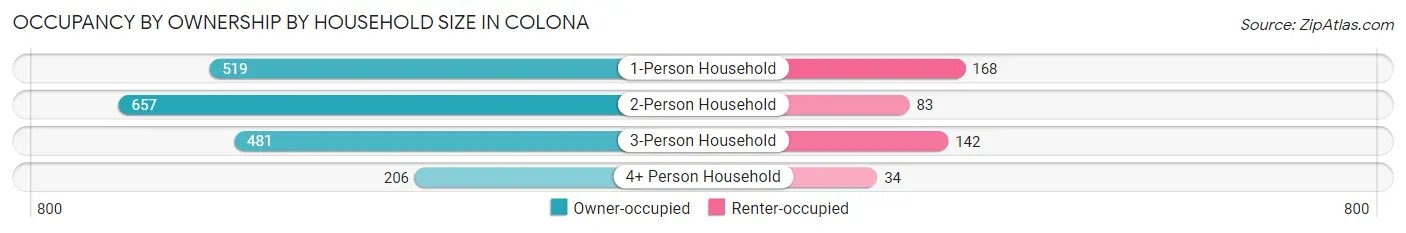
| Household Size | Owner-occupied | Renter-occupied |
| 1-Person Household | 519 (75.5%) | 168 (24.4%) |
| 2-Person Household | 657 (88.8%) | 83 (11.2%) |
| 3-Person Household | 481 (77.2%) | 142 (22.8%) |
| 4+ Person Household | 206 (85.8%) | 34 (14.2%) |
| Total Housing Units | 1,863 (81.4%) | 427 (18.6%) |
Occupancy by Educational Attainment in Colona
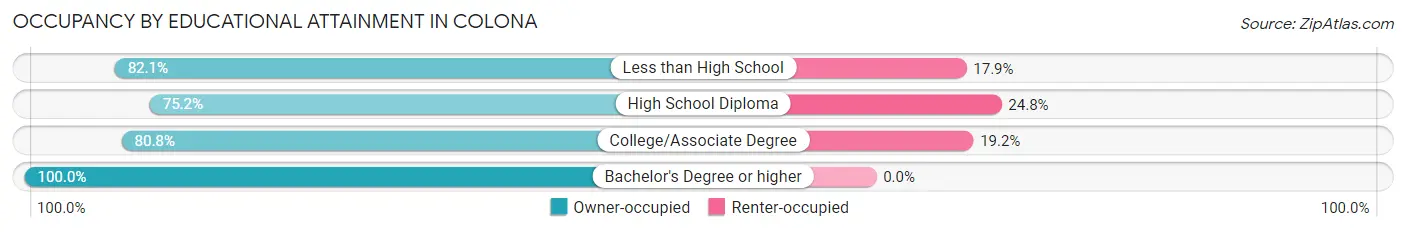
| Household Size | Owner-occupied | Renter-occupied |
| Less than High School | 124 (82.1%) | 27 (17.9%) |
| High School Diploma | 781 (75.2%) | 258 (24.8%) |
| College/Associate Degree | 596 (80.8%) | 142 (19.2%) |
| Bachelor's Degree or higher | 362 (100.0%) | 0 (0.0%) |
Occupancy by Age of Householder in Colona
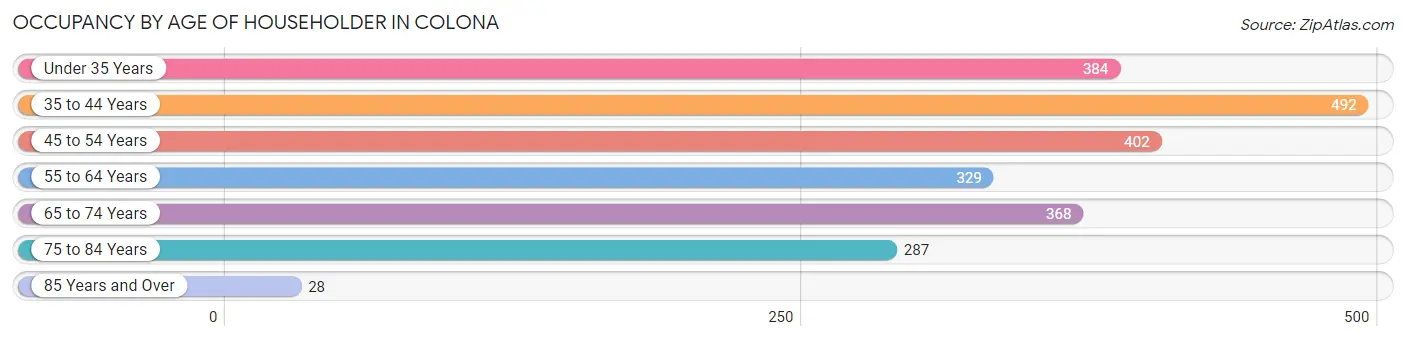
| Age Bracket | # Households | % Households |
| Under 35 Years | 384 | 16.8% |
| 35 to 44 Years | 492 | 21.5% |
| 45 to 54 Years | 402 | 17.5% |
| 55 to 64 Years | 329 | 14.4% |
| 65 to 74 Years | 368 | 16.1% |
| 75 to 84 Years | 287 | 12.5% |
| 85 Years and Over | 28 | 1.2% |
| Total | 2,290 | 100.0% |
Housing Finances in Colona
Median Income by Occupancy in Colona
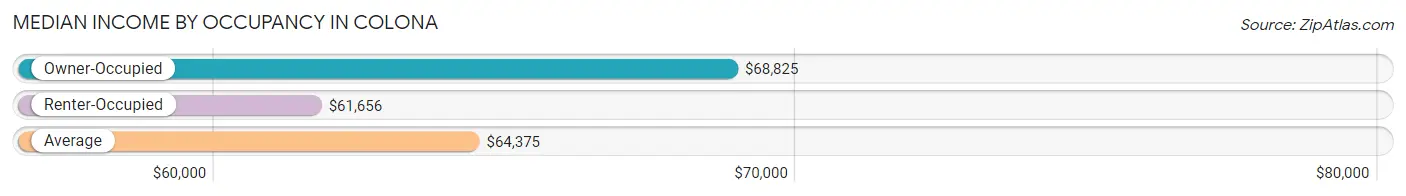
| Occupancy Type | # Households | Median Income |
| Owner-Occupied | 1,863 (81.4%) | $68,825 |
| Renter-Occupied | 427 (18.6%) | $61,656 |
| Average | 2,290 (100.0%) | $64,375 |
Occupancy by Householder Income Bracket in Colona
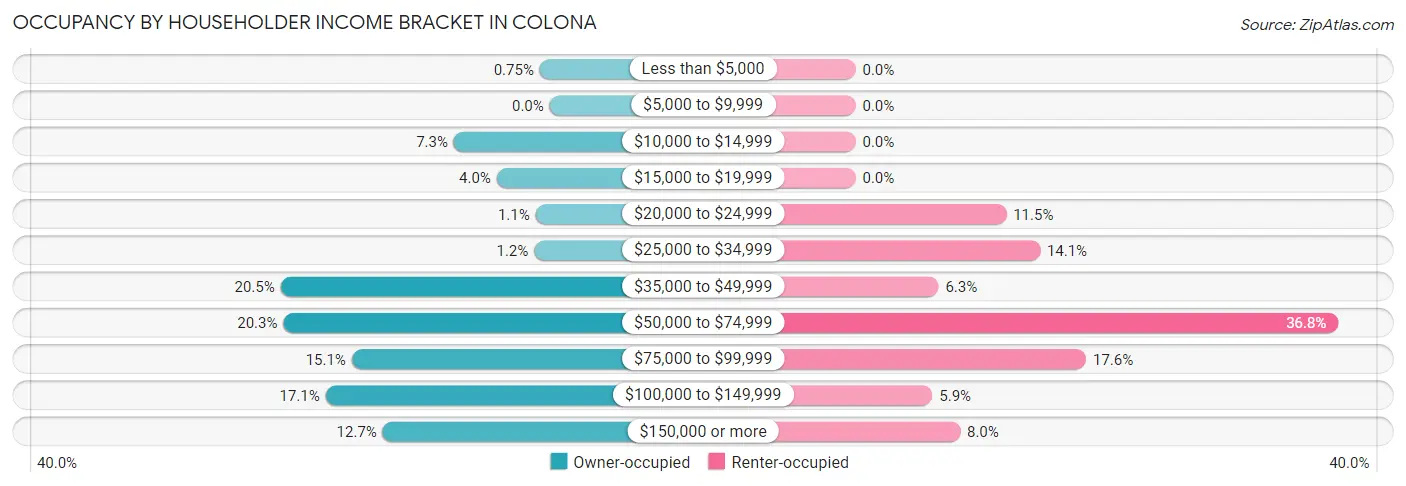
| Income Bracket | Owner-occupied | Renter-occupied |
| Less than $5,000 | 14 (0.7%) | 0 (0.0%) |
| $5,000 to $9,999 | 0 (0.0%) | 0 (0.0%) |
| $10,000 to $14,999 | 136 (7.3%) | 0 (0.0%) |
| $15,000 to $19,999 | 75 (4.0%) | 0 (0.0%) |
| $20,000 to $24,999 | 20 (1.1%) | 49 (11.5%) |
| $25,000 to $34,999 | 22 (1.2%) | 60 (14.1%) |
| $35,000 to $49,999 | 382 (20.5%) | 27 (6.3%) |
| $50,000 to $74,999 | 378 (20.3%) | 157 (36.8%) |
| $75,000 to $99,999 | 281 (15.1%) | 75 (17.6%) |
| $100,000 to $149,999 | 318 (17.1%) | 25 (5.9%) |
| $150,000 or more | 237 (12.7%) | 34 (8.0%) |
| Total | 1,863 (100.0%) | 427 (100.0%) |
Monthly Housing Cost Tiers in Colona
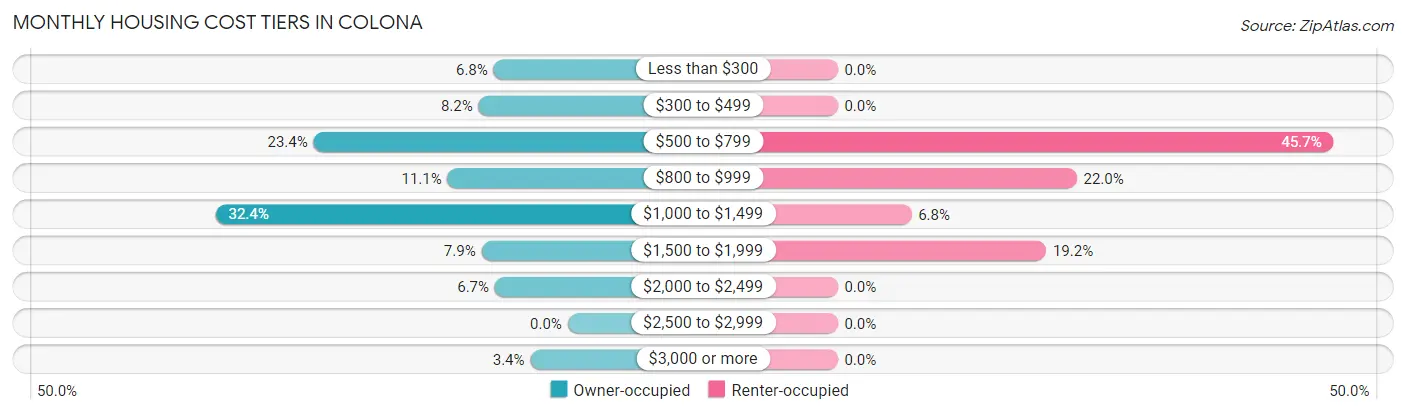
| Monthly Cost | Owner-occupied | Renter-occupied |
| Less than $300 | 127 (6.8%) | 0 (0.0%) |
| $300 to $499 | 153 (8.2%) | 0 (0.0%) |
| $500 to $799 | 436 (23.4%) | 195 (45.7%) |
| $800 to $999 | 206 (11.1%) | 94 (22.0%) |
| $1,000 to $1,499 | 604 (32.4%) | 29 (6.8%) |
| $1,500 to $1,999 | 148 (7.9%) | 82 (19.2%) |
| $2,000 to $2,499 | 125 (6.7%) | 0 (0.0%) |
| $2,500 to $2,999 | 0 (0.0%) | 0 (0.0%) |
| $3,000 or more | 64 (3.4%) | 0 (0.0%) |
| Total | 1,863 (100.0%) | 427 (100.0%) |
Physical Housing Characteristics in Colona
Housing Structures in Colona
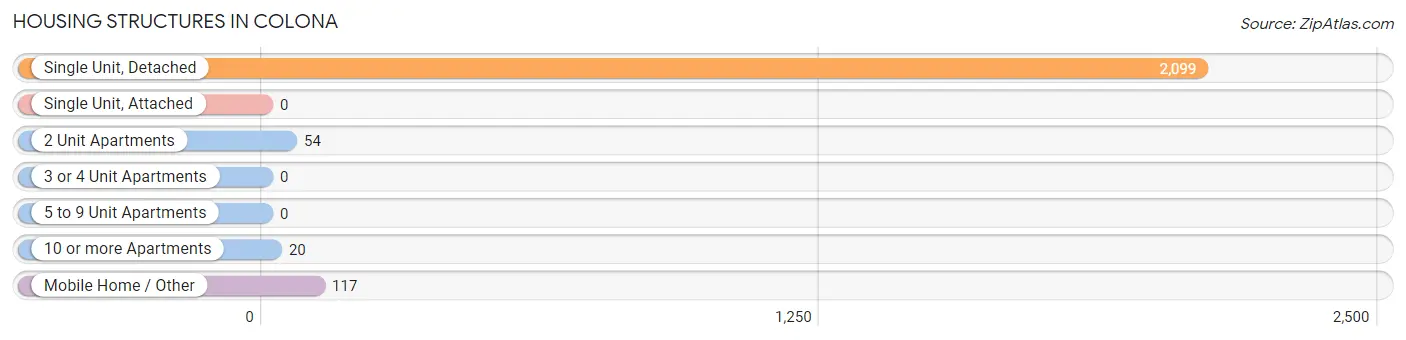
| Structure Type | # Housing Units | % Housing Units |
| Single Unit, Detached | 2,099 | 91.7% |
| Single Unit, Attached | 0 | 0.0% |
| 2 Unit Apartments | 54 | 2.4% |
| 3 or 4 Unit Apartments | 0 | 0.0% |
| 5 to 9 Unit Apartments | 0 | 0.0% |
| 10 or more Apartments | 20 | 0.9% |
| Mobile Home / Other | 117 | 5.1% |
| Total | 2,290 | 100.0% |
Housing Structures by Occupancy in Colona
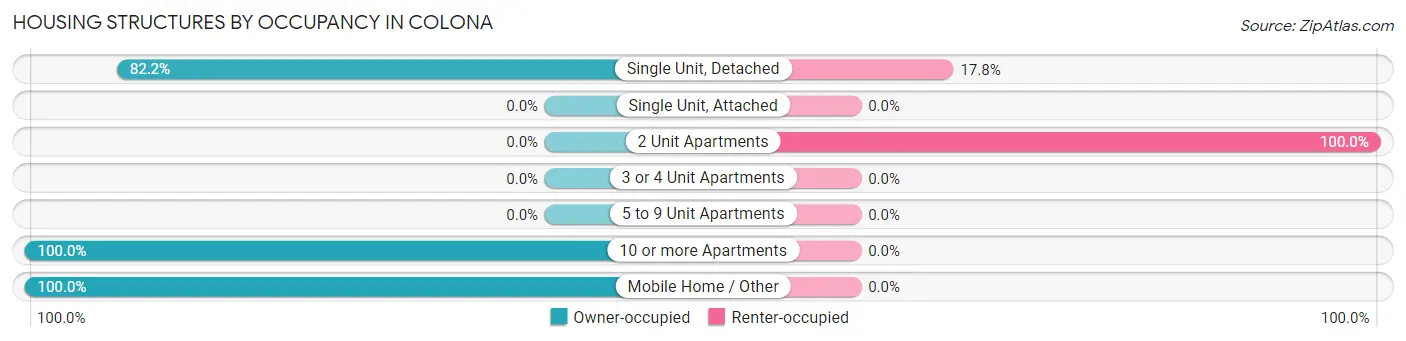
| Structure Type | Owner-occupied | Renter-occupied |
| Single Unit, Detached | 1,726 (82.2%) | 373 (17.8%) |
| Single Unit, Attached | 0 (0.0%) | 0 (0.0%) |
| 2 Unit Apartments | 0 (0.0%) | 54 (100.0%) |
| 3 or 4 Unit Apartments | 0 (0.0%) | 0 (0.0%) |
| 5 to 9 Unit Apartments | 0 (0.0%) | 0 (0.0%) |
| 10 or more Apartments | 20 (100.0%) | 0 (0.0%) |
| Mobile Home / Other | 117 (100.0%) | 0 (0.0%) |
| Total | 1,863 (81.4%) | 427 (18.6%) |
Housing Structures by Number of Rooms in Colona
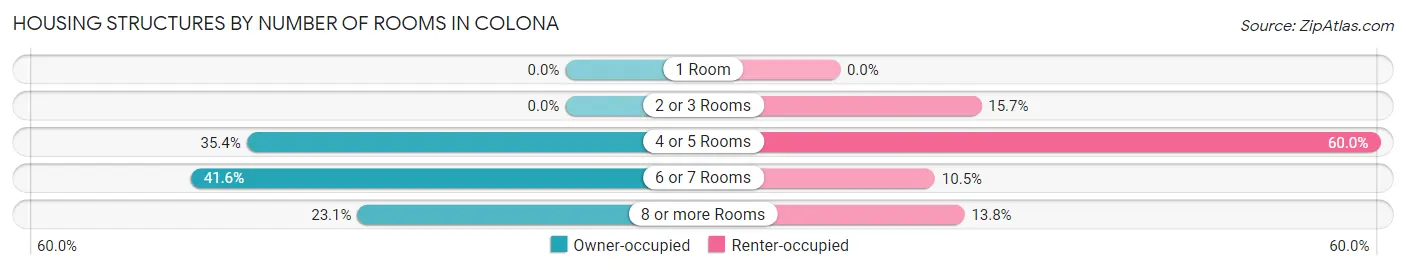
| Number of Rooms | Owner-occupied | Renter-occupied |
| 1 Room | 0 (0.0%) | 0 (0.0%) |
| 2 or 3 Rooms | 0 (0.0%) | 67 (15.7%) |
| 4 or 5 Rooms | 659 (35.4%) | 256 (60.0%) |
| 6 or 7 Rooms | 774 (41.5%) | 45 (10.5%) |
| 8 or more Rooms | 430 (23.1%) | 59 (13.8%) |
| Total | 1,863 (100.0%) | 427 (100.0%) |
Housing Structure by Heating Type in Colona
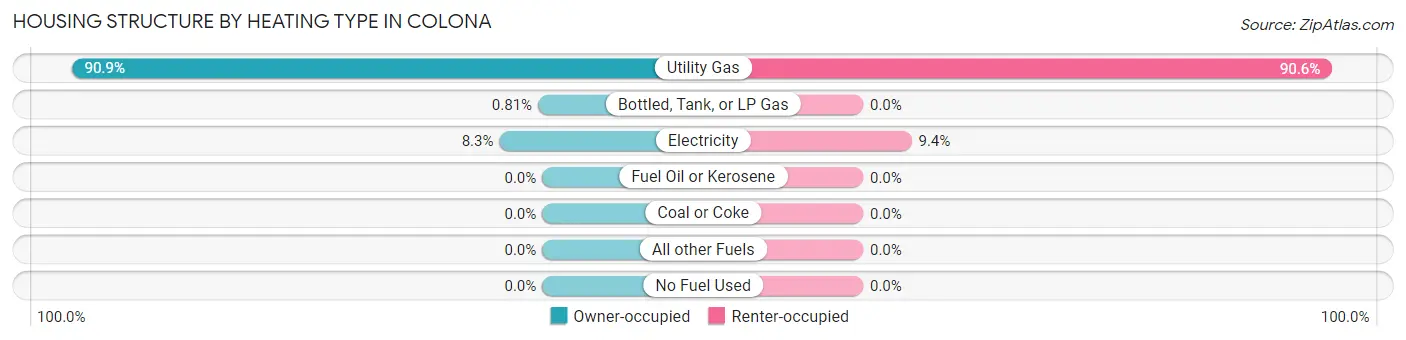
| Heating Type | Owner-occupied | Renter-occupied |
| Utility Gas | 1,694 (90.9%) | 387 (90.6%) |
| Bottled, Tank, or LP Gas | 15 (0.8%) | 0 (0.0%) |
| Electricity | 154 (8.3%) | 40 (9.4%) |
| Fuel Oil or Kerosene | 0 (0.0%) | 0 (0.0%) |
| Coal or Coke | 0 (0.0%) | 0 (0.0%) |
| All other Fuels | 0 (0.0%) | 0 (0.0%) |
| No Fuel Used | 0 (0.0%) | 0 (0.0%) |
| Total | 1,863 (100.0%) | 427 (100.0%) |
Household Vehicle Usage in Colona
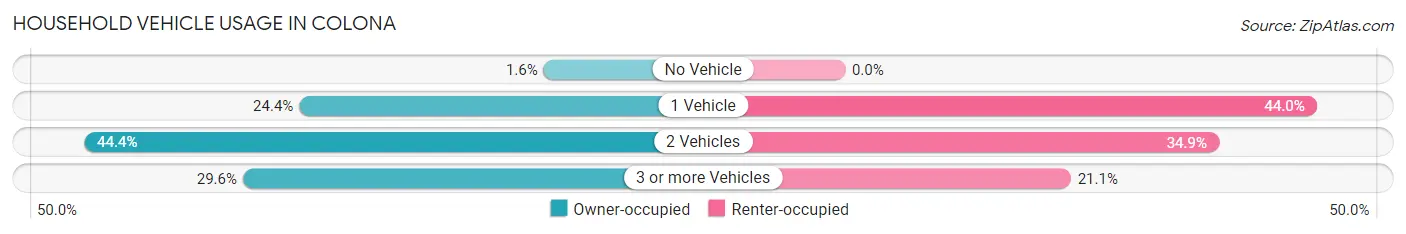
| Vehicles per Household | Owner-occupied | Renter-occupied |
| No Vehicle | 29 (1.6%) | 0 (0.0%) |
| 1 Vehicle | 454 (24.4%) | 188 (44.0%) |
| 2 Vehicles | 828 (44.4%) | 149 (34.9%) |
| 3 or more Vehicles | 552 (29.6%) | 90 (21.1%) |
| Total | 1,863 (100.0%) | 427 (100.0%) |
Real Estate & Mortgages in Colona
Real Estate and Mortgage Overview in Colona
| Characteristic | Without Mortgage | With Mortgage |
| Housing Units | 735 | 1,128 |
| Median Property Value | $141,400 | $131,800 |
| Median Household Income | $39,402 | $208 |
| Monthly Housing Costs | $561 | $44 |
| Real Estate Taxes | $3,199 | $5 |
Property Value by Mortgage Status in Colona
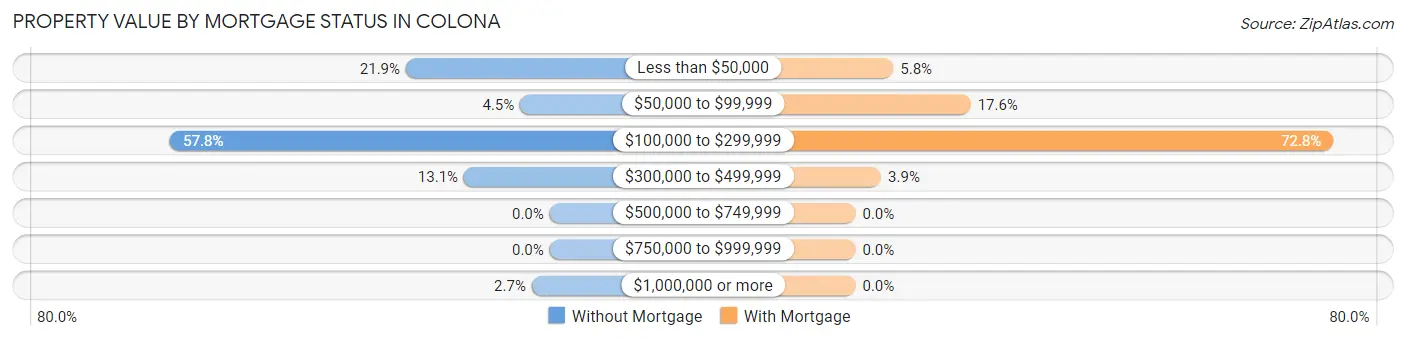
| Property Value | Without Mortgage | With Mortgage |
| Less than $50,000 | 161 (21.9%) | 65 (5.8%) |
| $50,000 to $99,999 | 33 (4.5%) | 198 (17.5%) |
| $100,000 to $299,999 | 425 (57.8%) | 821 (72.8%) |
| $300,000 to $499,999 | 96 (13.1%) | 44 (3.9%) |
| $500,000 to $749,999 | 0 (0.0%) | 0 (0.0%) |
| $750,000 to $999,999 | 0 (0.0%) | 0 (0.0%) |
| $1,000,000 or more | 20 (2.7%) | 0 (0.0%) |
| Total | 735 (100.0%) | 1,128 (100.0%) |
Household Income by Mortgage Status in Colona
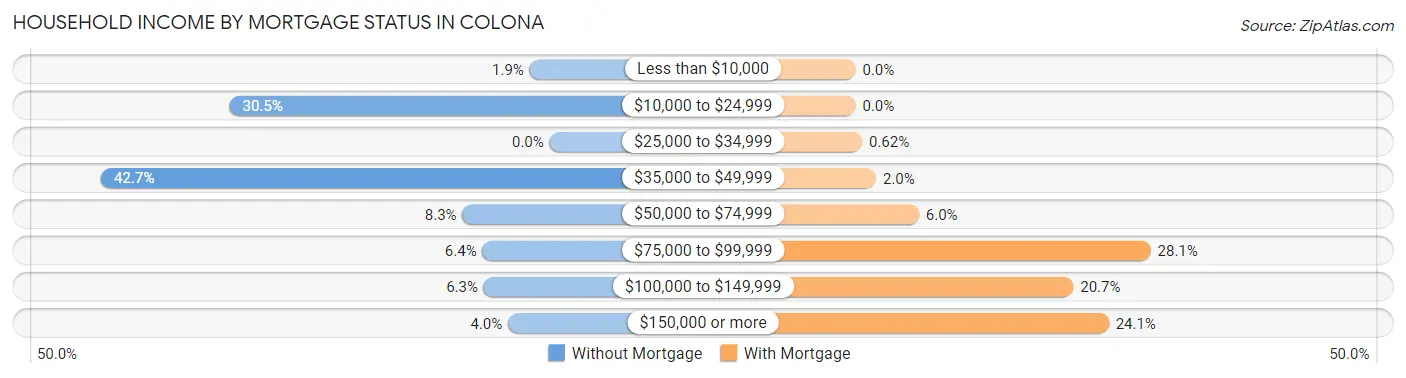
| Household Income | Without Mortgage | With Mortgage |
| Less than $10,000 | 14 (1.9%) | 0 (0.0%) |
| $10,000 to $24,999 | 224 (30.5%) | 0 (0.0%) |
| $25,000 to $34,999 | 0 (0.0%) | 7 (0.6%) |
| $35,000 to $49,999 | 314 (42.7%) | 22 (1.9%) |
| $50,000 to $74,999 | 61 (8.3%) | 68 (6.0%) |
| $75,000 to $99,999 | 47 (6.4%) | 317 (28.1%) |
| $100,000 to $149,999 | 46 (6.3%) | 234 (20.7%) |
| $150,000 or more | 29 (4.0%) | 272 (24.1%) |
| Total | 735 (100.0%) | 1,128 (100.0%) |
Property Value to Household Income Ratio in Colona
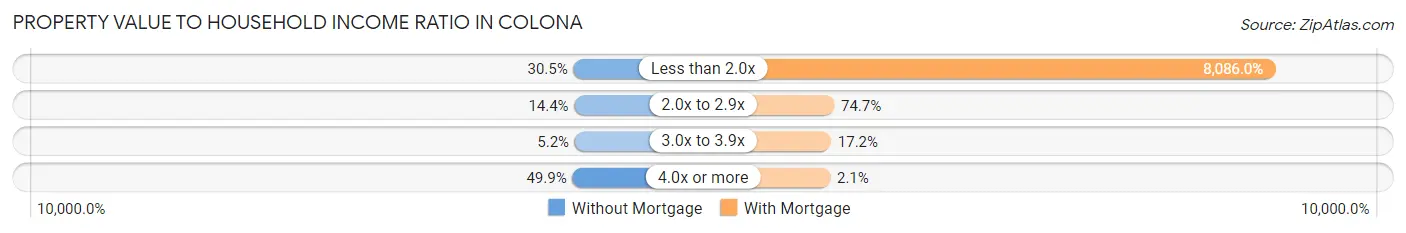
| Value-to-Income Ratio | Without Mortgage | With Mortgage |
| Less than 2.0x | 224 (30.5%) | 91,210 (8,086.0%) |
| 2.0x to 2.9x | 106 (14.4%) | 842 (74.7%) |
| 3.0x to 3.9x | 38 (5.2%) | 194 (17.2%) |
| 4.0x or more | 367 (49.9%) | 24 (2.1%) |
| Total | 735 (100.0%) | 1,128 (100.0%) |
Real Estate Taxes by Mortgage Status in Colona
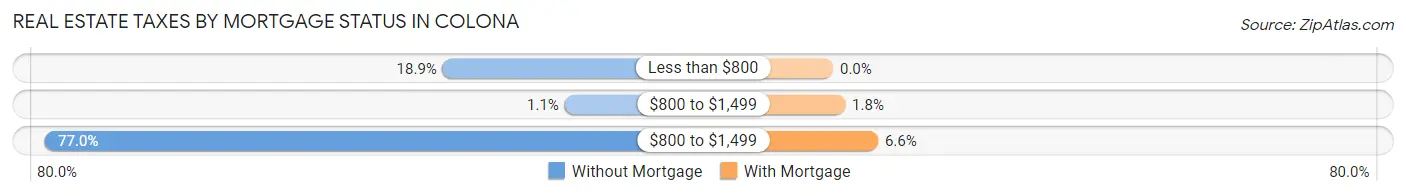
| Property Taxes | Without Mortgage | With Mortgage |
| Less than $800 | 139 (18.9%) | 0 (0.0%) |
| $800 to $1,499 | 8 (1.1%) | 20 (1.8%) |
| $800 to $1,499 | 566 (77.0%) | 74 (6.6%) |
| Total | 735 (100.0%) | 1,128 (100.0%) |
Health & Disability in Colona
Health Insurance Coverage by Age in Colona
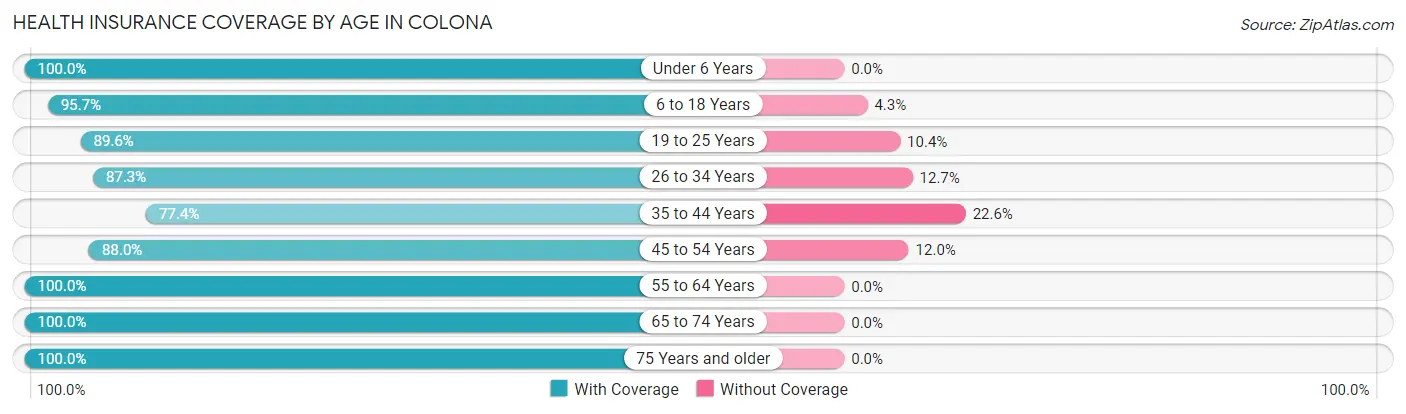
| Age Bracket | With Coverage | Without Coverage |
| Under 6 Years | 228 (100.0%) | 0 (0.0%) |
| 6 to 18 Years | 819 (95.7%) | 37 (4.3%) |
| 19 to 25 Years | 387 (89.6%) | 45 (10.4%) |
| 26 to 34 Years | 582 (87.3%) | 85 (12.7%) |
| 35 to 44 Years | 615 (77.4%) | 180 (22.6%) |
| 45 to 54 Years | 550 (88.0%) | 75 (12.0%) |
| 55 to 64 Years | 755 (100.0%) | 0 (0.0%) |
| 65 to 74 Years | 668 (100.0%) | 0 (0.0%) |
| 75 Years and older | 357 (100.0%) | 0 (0.0%) |
| Total | 4,961 (92.2%) | 422 (7.8%) |
Health Insurance Coverage by Citizenship Status in Colona
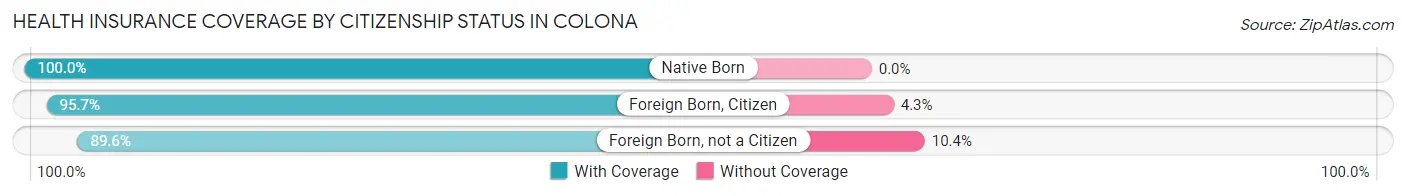
| Citizenship Status | With Coverage | Without Coverage |
| Native Born | 228 (100.0%) | 0 (0.0%) |
| Foreign Born, Citizen | 819 (95.7%) | 37 (4.3%) |
| Foreign Born, not a Citizen | 387 (89.6%) | 45 (10.4%) |
Health Insurance Coverage by Household Income in Colona
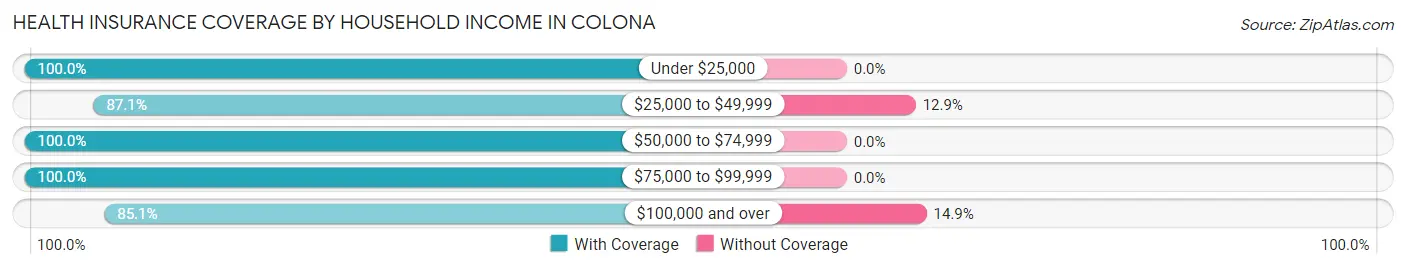
| Household Income | With Coverage | Without Coverage |
| Under $25,000 | 367 (100.0%) | 0 (0.0%) |
| $25,000 to $49,999 | 803 (87.1%) | 119 (12.9%) |
| $50,000 to $74,999 | 1,254 (100.0%) | 0 (0.0%) |
| $75,000 to $99,999 | 812 (100.0%) | 0 (0.0%) |
| $100,000 and over | 1,725 (85.1%) | 303 (14.9%) |
Public vs Private Health Insurance Coverage by Age in Colona
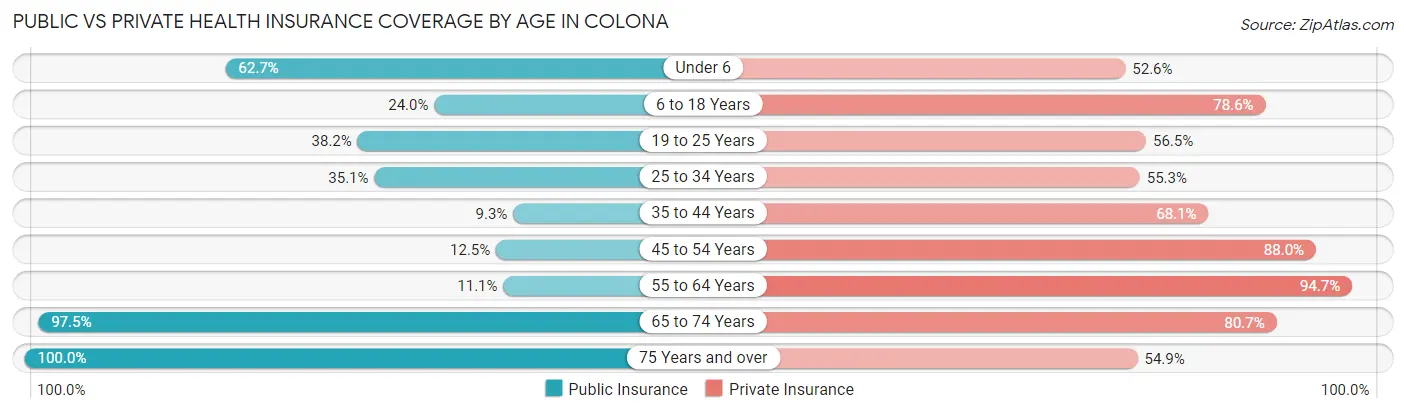
| Age Bracket | Public Insurance | Private Insurance |
| Under 6 | 143 (62.7%) | 120 (52.6%) |
| 6 to 18 Years | 205 (23.9%) | 673 (78.6%) |
| 19 to 25 Years | 165 (38.2%) | 244 (56.5%) |
| 25 to 34 Years | 234 (35.1%) | 369 (55.3%) |
| 35 to 44 Years | 74 (9.3%) | 541 (68.0%) |
| 45 to 54 Years | 78 (12.5%) | 550 (88.0%) |
| 55 to 64 Years | 84 (11.1%) | 715 (94.7%) |
| 65 to 74 Years | 651 (97.5%) | 539 (80.7%) |
| 75 Years and over | 357 (100.0%) | 196 (54.9%) |
| Total | 1,991 (37.0%) | 3,947 (73.3%) |
Disability Status by Sex by Age in Colona
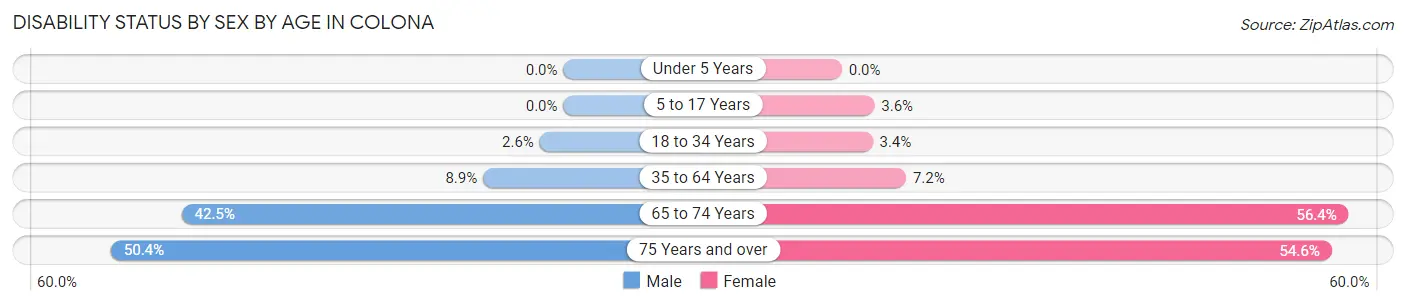
| Age Bracket | Male | Female |
| Under 5 Years | 0 (0.0%) | 0 (0.0%) |
| 5 to 17 Years | 0 (0.0%) | 16 (3.6%) |
| 18 to 34 Years | 15 (2.6%) | 21 (3.4%) |
| 35 to 64 Years | 87 (8.9%) | 86 (7.1%) |
| 65 to 74 Years | 122 (42.5%) | 215 (56.4%) |
| 75 Years and over | 130 (50.4%) | 54 (54.5%) |
Disability Class by Sex by Age in Colona
Disability Class: Hearing Difficulty
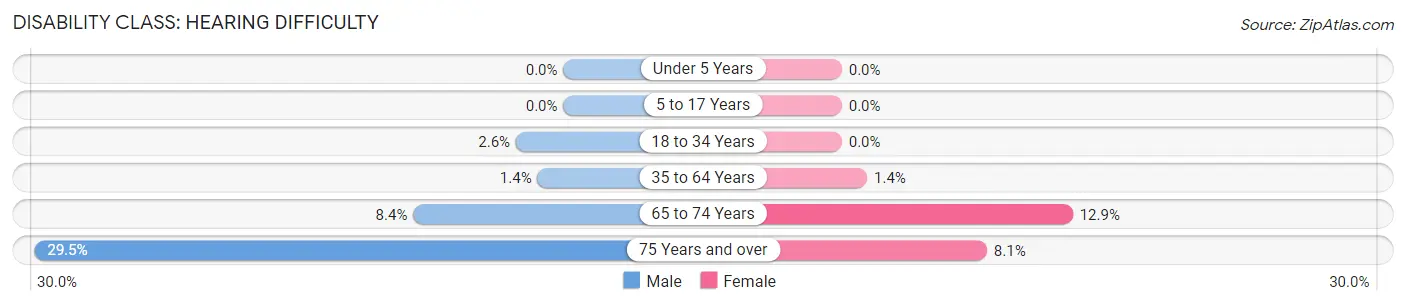
| Age Bracket | Male | Female |
| Under 5 Years | 0 (0.0%) | 0 (0.0%) |
| 5 to 17 Years | 0 (0.0%) | 0 (0.0%) |
| 18 to 34 Years | 15 (2.6%) | 0 (0.0%) |
| 35 to 64 Years | 14 (1.4%) | 17 (1.4%) |
| 65 to 74 Years | 24 (8.4%) | 49 (12.9%) |
| 75 Years and over | 76 (29.5%) | 8 (8.1%) |
Disability Class: Vision Difficulty
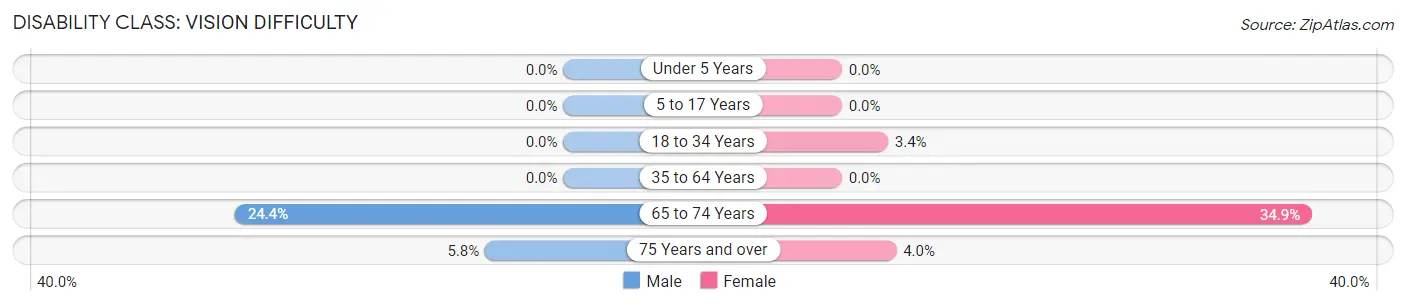
| Age Bracket | Male | Female |
| Under 5 Years | 0 (0.0%) | 0 (0.0%) |
| 5 to 17 Years | 0 (0.0%) | 0 (0.0%) |
| 18 to 34 Years | 0 (0.0%) | 21 (3.4%) |
| 35 to 64 Years | 0 (0.0%) | 0 (0.0%) |
| 65 to 74 Years | 70 (24.4%) | 133 (34.9%) |
| 75 Years and over | 15 (5.8%) | 4 (4.0%) |
Disability Class: Cognitive Difficulty
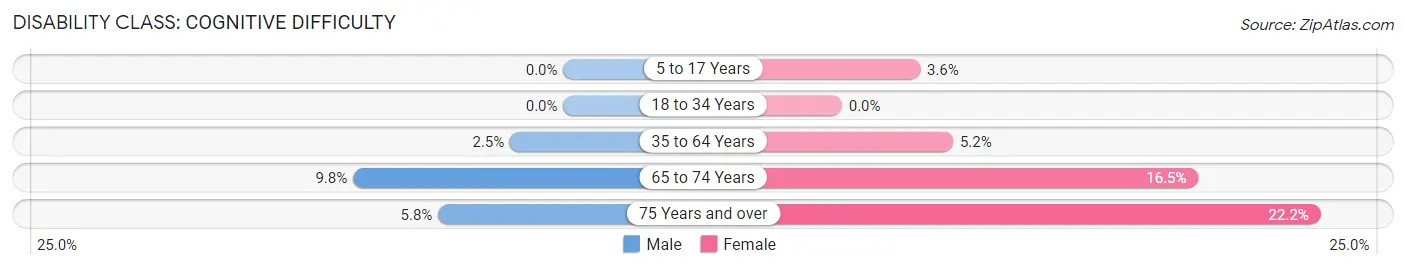
| Age Bracket | Male | Female |
| 5 to 17 Years | 0 (0.0%) | 16 (3.6%) |
| 18 to 34 Years | 0 (0.0%) | 0 (0.0%) |
| 35 to 64 Years | 24 (2.5%) | 62 (5.2%) |
| 65 to 74 Years | 28 (9.8%) | 63 (16.5%) |
| 75 Years and over | 15 (5.8%) | 22 (22.2%) |
Disability Class: Ambulatory Difficulty
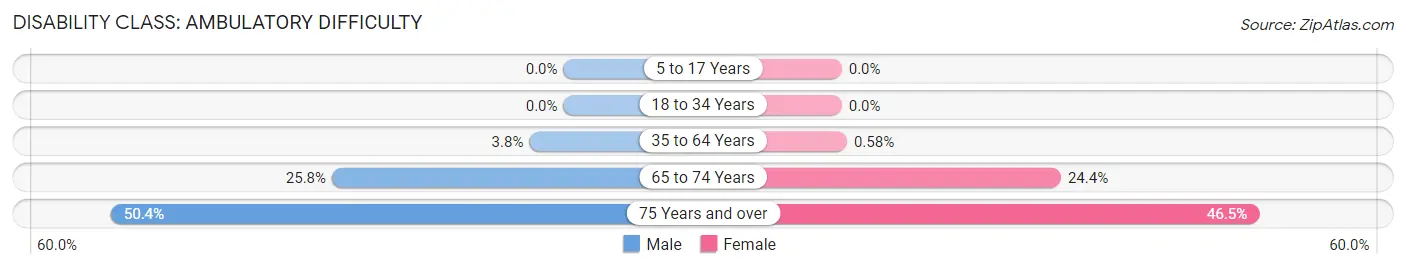
| Age Bracket | Male | Female |
| 5 to 17 Years | 0 (0.0%) | 0 (0.0%) |
| 18 to 34 Years | 0 (0.0%) | 0 (0.0%) |
| 35 to 64 Years | 37 (3.8%) | 7 (0.6%) |
| 65 to 74 Years | 74 (25.8%) | 93 (24.4%) |
| 75 Years and over | 130 (50.4%) | 46 (46.5%) |
Disability Class: Self-Care Difficulty
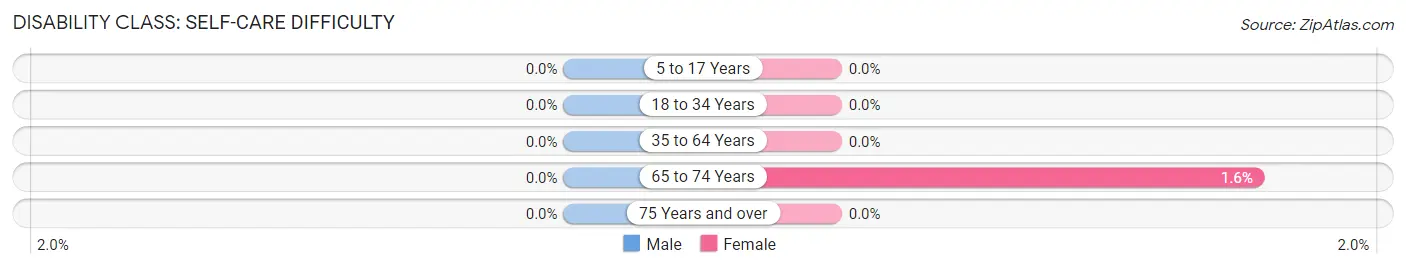
| Age Bracket | Male | Female |
| 5 to 17 Years | 0 (0.0%) | 0 (0.0%) |
| 18 to 34 Years | 0 (0.0%) | 0 (0.0%) |
| 35 to 64 Years | 0 (0.0%) | 0 (0.0%) |
| 65 to 74 Years | 0 (0.0%) | 6 (1.6%) |
| 75 Years and over | 0 (0.0%) | 0 (0.0%) |
Technology Access in Colona
Computing Device Access in Colona
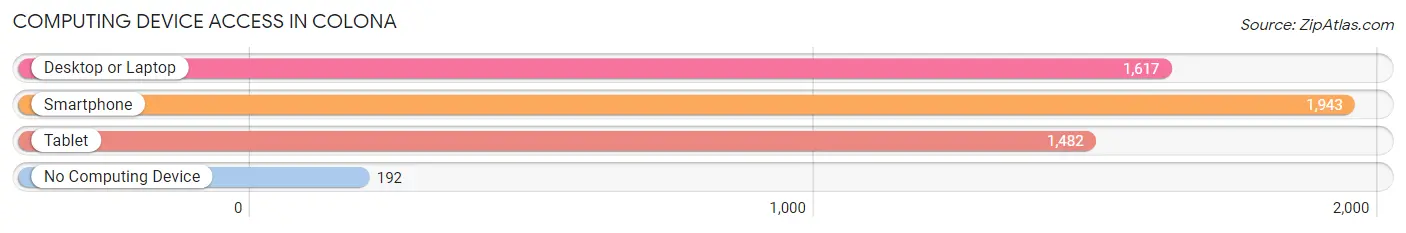
| Device Type | # Households | % Households |
| Desktop or Laptop | 1,617 | 70.6% |
| Smartphone | 1,943 | 84.9% |
| Tablet | 1,482 | 64.7% |
| No Computing Device | 192 | 8.4% |
| Total | 2,290 | 100.0% |
Internet Access in Colona
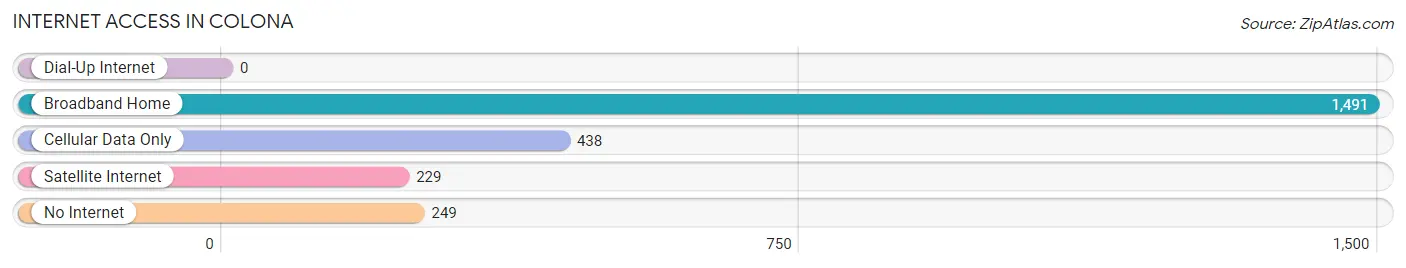
| Internet Type | # Households | % Households |
| Dial-Up Internet | 0 | 0.0% |
| Broadband Home | 1,491 | 65.1% |
| Cellular Data Only | 438 | 19.1% |
| Satellite Internet | 229 | 10.0% |
| No Internet | 249 | 10.9% |
| Total | 2,290 | 100.0% |
Colona Summary
Colona, Illinois is a small city located in Henry County, Illinois. It is situated on the banks of the Mississippi River, just south of the Quad Cities. The city has a population of approximately 5,000 people and is part of the Quad Cities Metropolitan Statistical Area.
History
Colona was founded in 1836 by a group of settlers from New York. The city was named after the Colona family, who were among the first settlers. The city was incorporated in 1867 and has remained a small, rural community ever since.
The city was a major hub for the coal mining industry in the late 19th and early 20th centuries. The coal mines provided employment for many of the city’s residents and helped to fuel the local economy. The coal mines eventually closed in the 1950s, but the city has since diversified its economy and is now home to a variety of businesses.
Geography
Colona is located in the northwest corner of Henry County, Illinois. It is situated on the banks of the Mississippi River, just south of the Quad Cities. The city has a total area of 2.2 square miles, all of which is land. The city is located in a flat, low-lying area and is surrounded by farmland.
The climate in Colona is humid continental, with hot, humid summers and cold, snowy winters. The average annual temperature is around 50 degrees Fahrenheit, with an average high of around 75 degrees in the summer and an average low of around 25 degrees in the winter.
Economy
Colona’s economy is largely based on agriculture and manufacturing. The city is home to several large manufacturing plants, including a John Deere plant and a Caterpillar plant. The city also has a variety of small businesses, including restaurants, retail stores, and service providers.
The city is also home to a number of tourist attractions, including the Colona Historical Museum, the Colona Zoo, and the Colona Water Park. These attractions bring in visitors from all over the region and help to boost the local economy.
Demographics
As of the 2010 census, Colona had a population of 5,000 people. The racial makeup of the city was 95.2% White, 0.8% African American, 0.4% Native American, 0.4% Asian, 0.2% from other races, and 2.8% from two or more races. Hispanic or Latino of any race were 1.2% of the population.
The median income for a household in Colona was $41,250, and the median income for a family was $50,000. The per capita income for the city was $20,845. About 8.2% of families and 10.2% of the population were below the poverty line, including 14.2% of those under age 18 and 6.2% of those age 65 or over.
Colona is a small, rural city with a rich history and a diverse economy. The city has a variety of businesses and attractions that help to boost the local economy and provide employment for its residents. The city is also home to a variety of cultural and recreational activities, making it an attractive place to live and visit.
Common Questions
What is Per Capita Income in Colona?
Per Capita income in Colona is $37,672.
What is the Median Family Income in Colona?
Median Family Income in Colona is $78,580.
What is the Median Household income in Colona?
Median Household Income in Colona is $64,375.
What is Income or Wage Gap in Colona?
Income or Wage Gap in Colona is 29.9%.
Women in Colona earn 70.1 cents for every dollar earned by a man.
What is Inequality or Gini Index in Colona?
Inequality or Gini Index in Colona is 0.41.
What is the Total Population of Colona?
Total Population of Colona is 5,404.
What is the Total Male Population of Colona?
Total Male Population of Colona is 2,615.
What is the Total Female Population of Colona?
Total Female Population of Colona is 2,789.
What is the Ratio of Males per 100 Females in Colona?
There are 93.76 Males per 100 Females in Colona.
What is the Ratio of Females per 100 Males in Colona?
There are 106.65 Females per 100 Males in Colona.
What is the Median Population Age in Colona?
Median Population Age in Colona is 42.9 Years.
What is the Average Family Size in Colona
Average Family Size in Colona is 2.9 People.
What is the Average Household Size in Colona
Average Household Size in Colona is 2.4 People.
How Large is the Labor Force in Colona?
There are 3,238 People in the Labor Forcein in Colona.
What is the Percentage of People in the Labor Force in Colona?
70.0% of People are in the Labor Force in Colona.
What is the Unemployment Rate in Colona?
Unemployment Rate in Colona is 3.4%.