Olive Branch, IL Map & Demographics
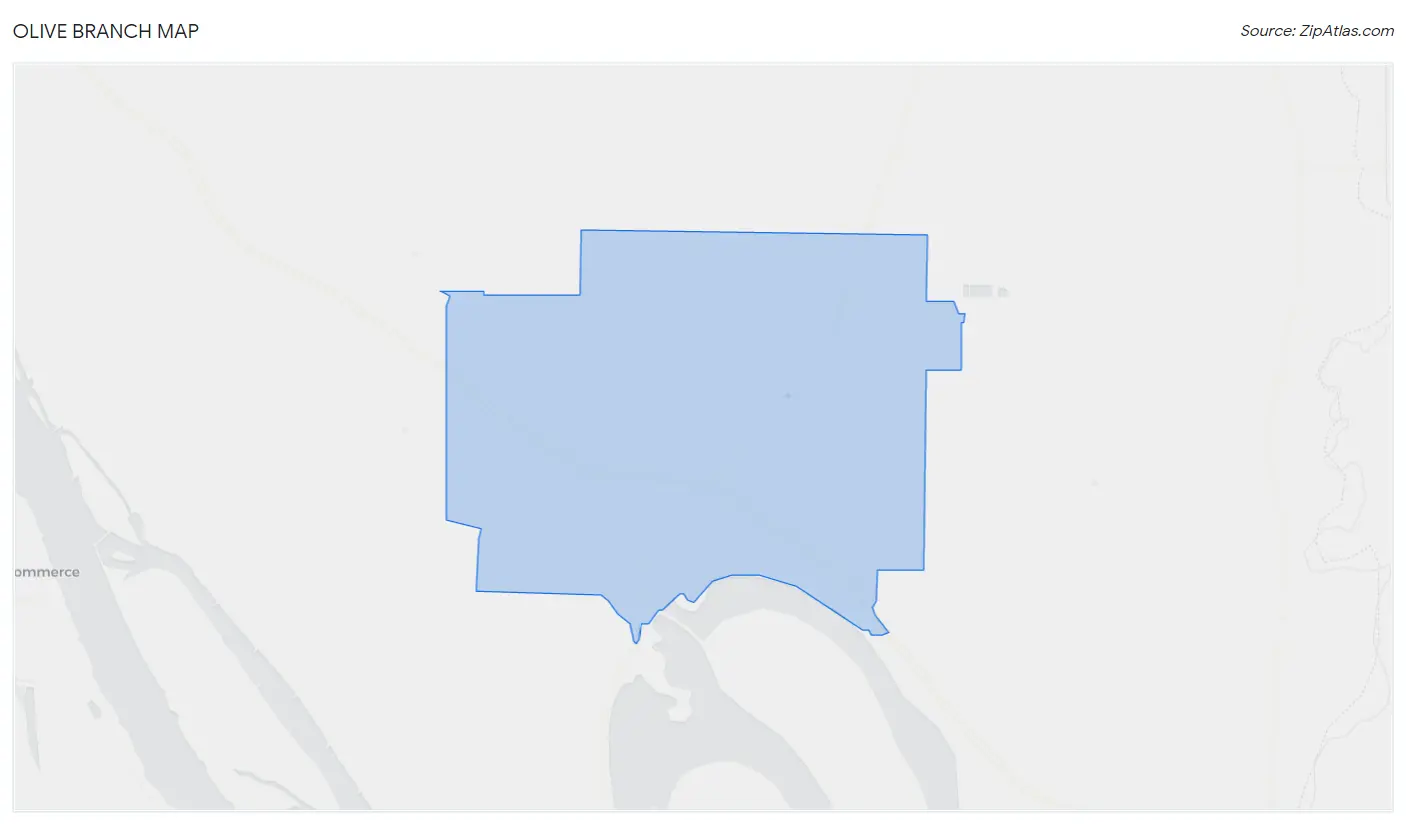
Olive Branch Map
Olive Branch Overview
$27,663
PER CAPITA INCOME
40.9%
WAGE / INCOME GAP [ % ]
59.1¢/ $1
WAGE / INCOME GAP [ $ ]
0.41
INEQUALITY / GINI INDEX
578
TOTAL POPULATION
299
MALE POPULATION
279
FEMALE POPULATION
107.17
MALES / 100 FEMALES
93.31
FEMALES / 100 MALES
49.2
MEDIAN AGE
3.7
AVG FAMILY SIZE
2.9
AVG HOUSEHOLD SIZE
233
LABOR FORCE [ PEOPLE ]
53.9%
PERCENT IN LABOR FORCE
Olive Branch Zip Codes
Olive Branch Area Codes
Income in Olive Branch
Income Overview in Olive Branch
| Characteristic | Number | Measure |
| Per Capita Income | 578 | $27,663 |
| Median Family Income | 141 | $0 |
| Mean Family Income | 141 | $59,016 |
| Median Household Income | 200 | $0 |
| Mean Household Income | 200 | $52,766 |
| Income Deficit | 141 | $0 |
| Wage / Income Gap (%) | 578 | 40.93% |
| Wage / Income Gap ($) | 578 | 59.07¢ per $1 |
| Gini / Inequality Index | 578 | 0.41 |
Earnings by Sex in Olive Branch
Average Earnings in Olive Branch are $48,750, $62,951 for men and $37,188 for women, a difference of 40.9%.
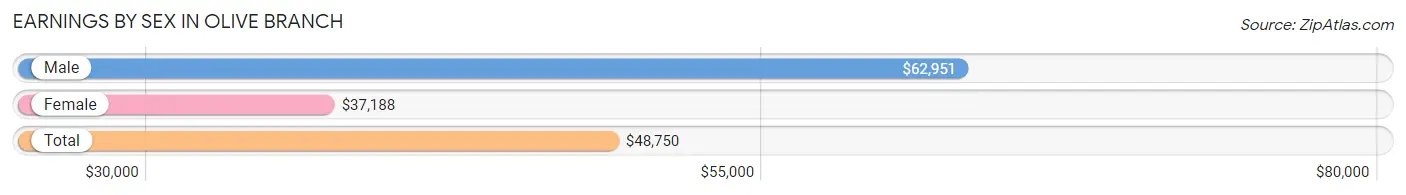
| Sex | Number | Average Earnings |
| Male | 178 (74.2%) | $62,951 |
| Female | 62 (25.8%) | $37,188 |
| Total | 240 (100.0%) | $48,750 |
Earnings by Sex by Income Bracket in Olive Branch
The most common earnings brackets in Olive Branch are $55,000 to $64,999 for men (72 | 40.5%) and $15,000 to $17,499 for women (17 | 27.4%).
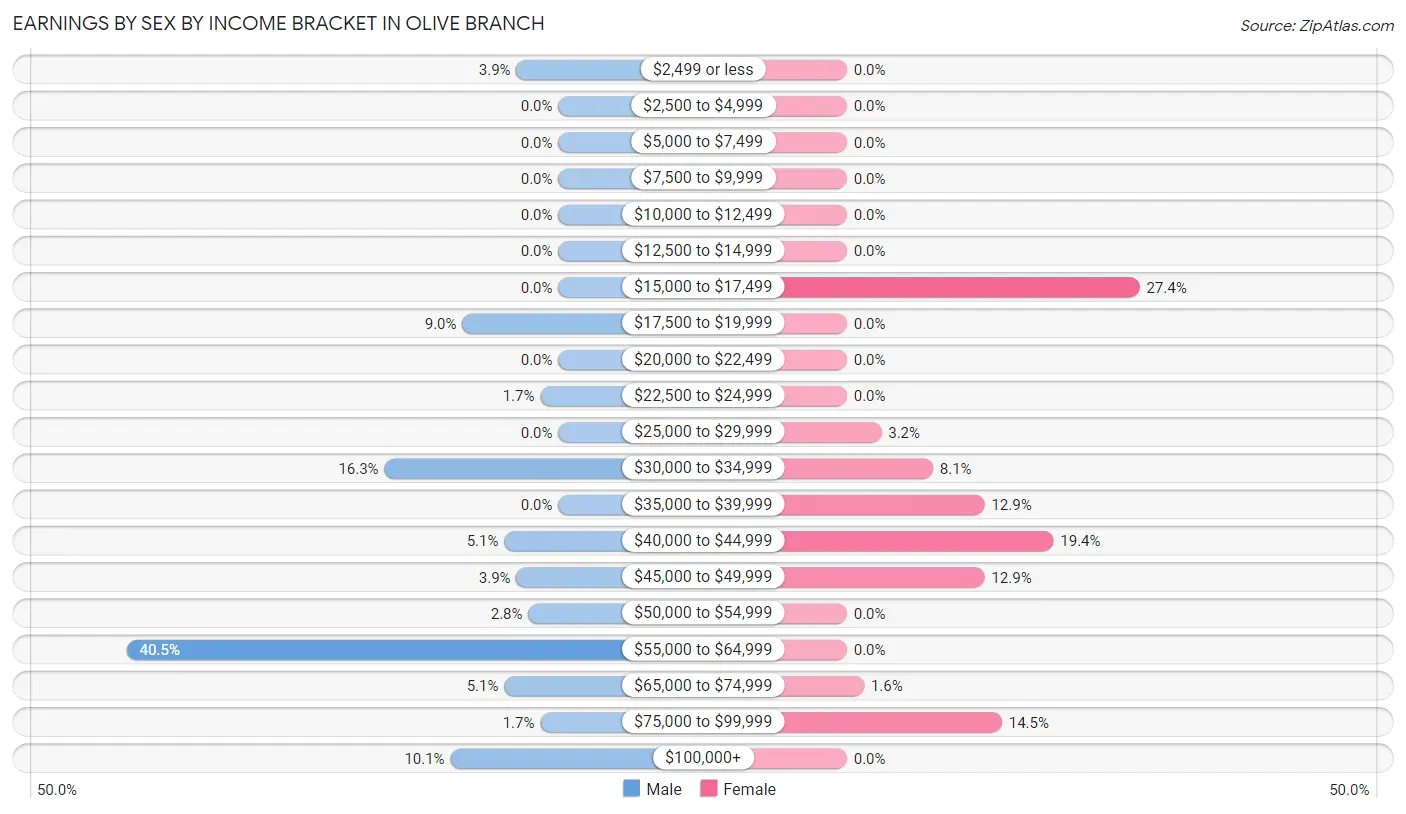
| Income | Male | Female |
| $2,499 or less | 7 (3.9%) | 0 (0.0%) |
| $2,500 to $4,999 | 0 (0.0%) | 0 (0.0%) |
| $5,000 to $7,499 | 0 (0.0%) | 0 (0.0%) |
| $7,500 to $9,999 | 0 (0.0%) | 0 (0.0%) |
| $10,000 to $12,499 | 0 (0.0%) | 0 (0.0%) |
| $12,500 to $14,999 | 0 (0.0%) | 0 (0.0%) |
| $15,000 to $17,499 | 0 (0.0%) | 17 (27.4%) |
| $17,500 to $19,999 | 16 (9.0%) | 0 (0.0%) |
| $20,000 to $22,499 | 0 (0.0%) | 0 (0.0%) |
| $22,500 to $24,999 | 3 (1.7%) | 0 (0.0%) |
| $25,000 to $29,999 | 0 (0.0%) | 2 (3.2%) |
| $30,000 to $34,999 | 29 (16.3%) | 5 (8.1%) |
| $35,000 to $39,999 | 0 (0.0%) | 8 (12.9%) |
| $40,000 to $44,999 | 9 (5.1%) | 12 (19.4%) |
| $45,000 to $49,999 | 7 (3.9%) | 8 (12.9%) |
| $50,000 to $54,999 | 5 (2.8%) | 0 (0.0%) |
| $55,000 to $64,999 | 72 (40.5%) | 0 (0.0%) |
| $65,000 to $74,999 | 9 (5.1%) | 1 (1.6%) |
| $75,000 to $99,999 | 3 (1.7%) | 9 (14.5%) |
| $100,000+ | 18 (10.1%) | 0 (0.0%) |
| Total | 178 (100.0%) | 62 (100.0%) |
Earnings by Sex by Educational Attainment in Olive Branch
Average earnings in Olive Branch are $63,021 for men and $37,188 for women, a difference of 41.0%. Men with an educational attainment of college or associate's degree enjoy the highest average annual earnings of $66,667, while those with high school diploma education earn the least with $62,882. Women with an educational attainment of college or associate's degree earn the most with the average annual earnings of $31,875, while those with college or associate's degree education have the smallest earnings of $31,875.
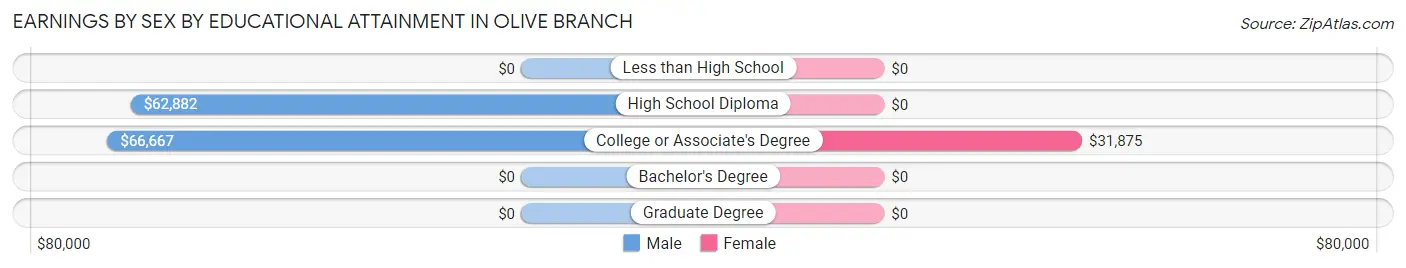
| Educational Attainment | Male Income | Female Income |
| Less than High School | - | - |
| High School Diploma | $62,882 | $0 |
| College or Associate's Degree | $66,667 | $31,875 |
| Bachelor's Degree | - | - |
| Graduate Degree | - | - |
| Total | $63,021 | $37,188 |
Family Income in Olive Branch
Family Income Brackets in Olive Branch
According to the Olive Branch family income data, there are 33 families falling into the $15,000 to $24,999 income range, which is the most common income bracket and makes up 23.4% of all families.
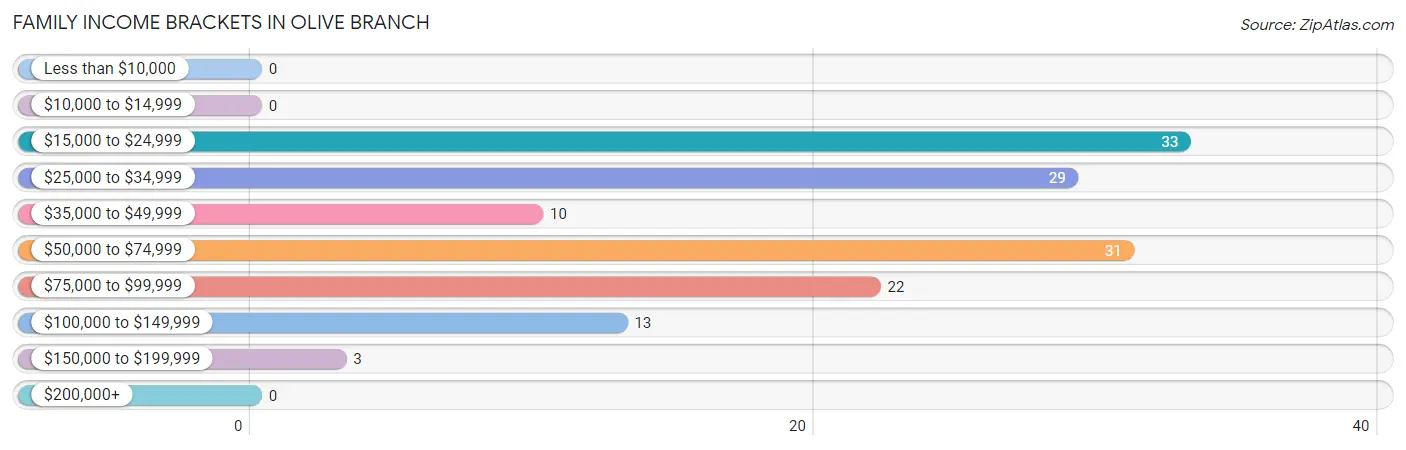
| Income Bracket | # Families | % Families |
| Less than $10,000 | 0 | 0.0% |
| $10,000 to $14,999 | 0 | 0.0% |
| $15,000 to $24,999 | 33 | 23.4% |
| $25,000 to $34,999 | 29 | 20.6% |
| $35,000 to $49,999 | 10 | 7.1% |
| $50,000 to $74,999 | 31 | 22.0% |
| $75,000 to $99,999 | 22 | 15.6% |
| $100,000 to $149,999 | 13 | 9.2% |
| $150,000 to $199,999 | 3 | 2.1% |
| $200,000+ | 0 | 0.0% |
Family Income by Famaliy Size in Olive Branch
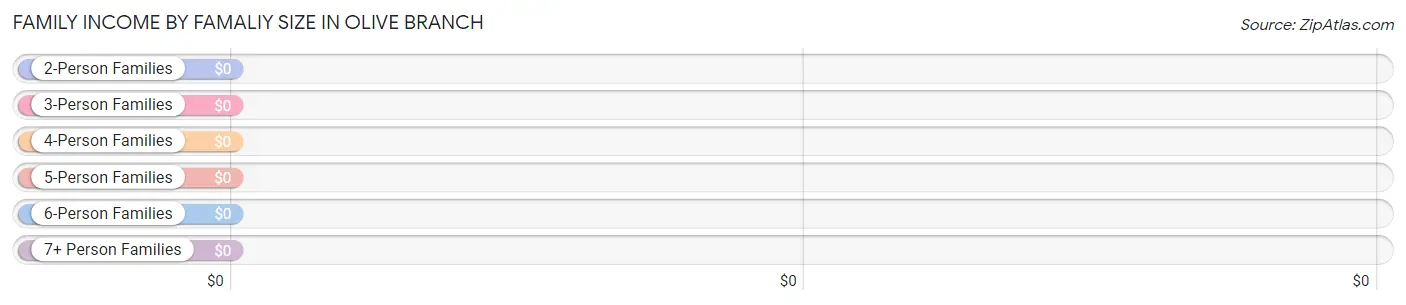
| Income Bracket | # Families | Median Income |
| 2-Person Families | 90 (63.8%) | $0 |
| 3-Person Families | 33 (23.4%) | $0 |
| 4-Person Families | 0 (0.0%) | $0 |
| 5-Person Families | 15 (10.6%) | $0 |
| 6-Person Families | 3 (2.1%) | $0 |
| 7+ Person Families | 0 (0.0%) | $0 |
| Total | 141 (100.0%) | $0 |
Family Income by Number of Earners in Olive Branch
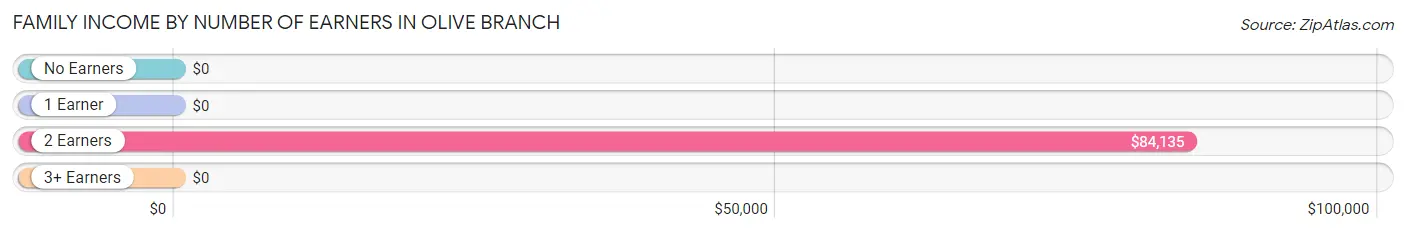
| Number of Earners | # Families | Median Income |
| No Earners | 27 (19.2%) | $0 |
| 1 Earner | 76 (53.9%) | $0 |
| 2 Earners | 35 (24.8%) | $84,135 |
| 3+ Earners | 3 (2.1%) | $0 |
| Total | 141 (100.0%) | $0 |
Household Income in Olive Branch
Household Income Brackets in Olive Branch
With 39 households falling in the category, the $15,000 to $24,999 income range is the most frequent in Olive Branch, accounting for 19.5% of all households.
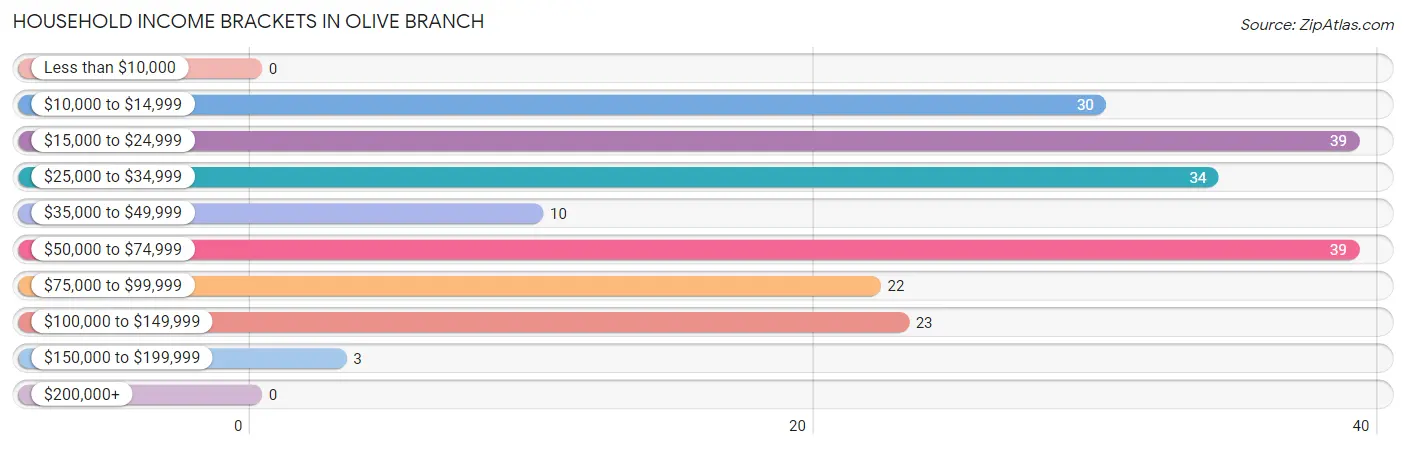
| Income Bracket | # Households | % Households |
| Less than $10,000 | 0 | 0.0% |
| $10,000 to $14,999 | 30 | 15.0% |
| $15,000 to $24,999 | 39 | 19.5% |
| $25,000 to $34,999 | 34 | 17.0% |
| $35,000 to $49,999 | 10 | 5.0% |
| $50,000 to $74,999 | 39 | 19.5% |
| $75,000 to $99,999 | 22 | 11.0% |
| $100,000 to $149,999 | 23 | 11.5% |
| $150,000 to $199,999 | 3 | 1.5% |
| $200,000+ | 0 | 0.0% |
Household Income by Householder Age in Olive Branch
The median household income in Olive Branch is $0, with the highest median household income of $71,083 found in the 25 to 44 years age bracket for the primary householder. A total of 45 households (22.5%) fall into this category. Meanwhile, the 15 to 24 years age bracket for the primary householder has the lowest median household income of $0, with 1 households (0.5%) in this group.
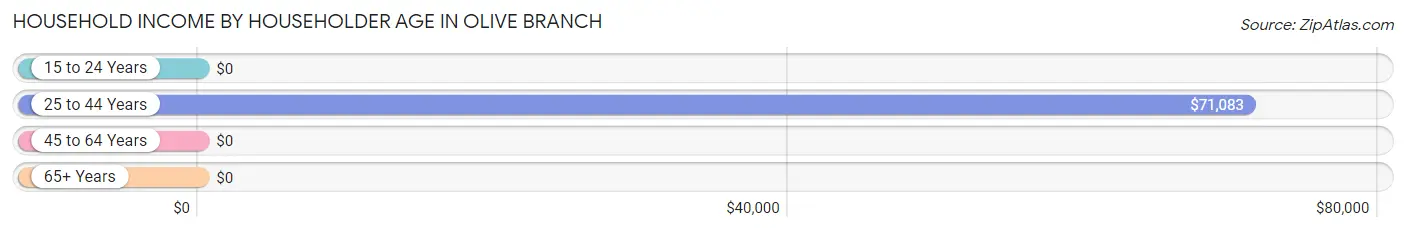
| Income Bracket | # Households | Median Income |
| 15 to 24 Years | 1 (0.5%) | $0 |
| 25 to 44 Years | 45 (22.5%) | $71,083 |
| 45 to 64 Years | 84 (42.0%) | $0 |
| 65+ Years | 70 (35.0%) | $0 |
| Total | 200 (100.0%) | $0 |
Poverty in Olive Branch
Income Below Poverty by Sex and Age in Olive Branch
With 5.3% poverty level for males and 49.1% for females among the residents of Olive Branch, 25 to 34 year old males and 75 year old and over females are the most vulnerable to poverty, with 16 males (55.2%) and 25 females (100.0%) in their respective age groups living below the poverty level.
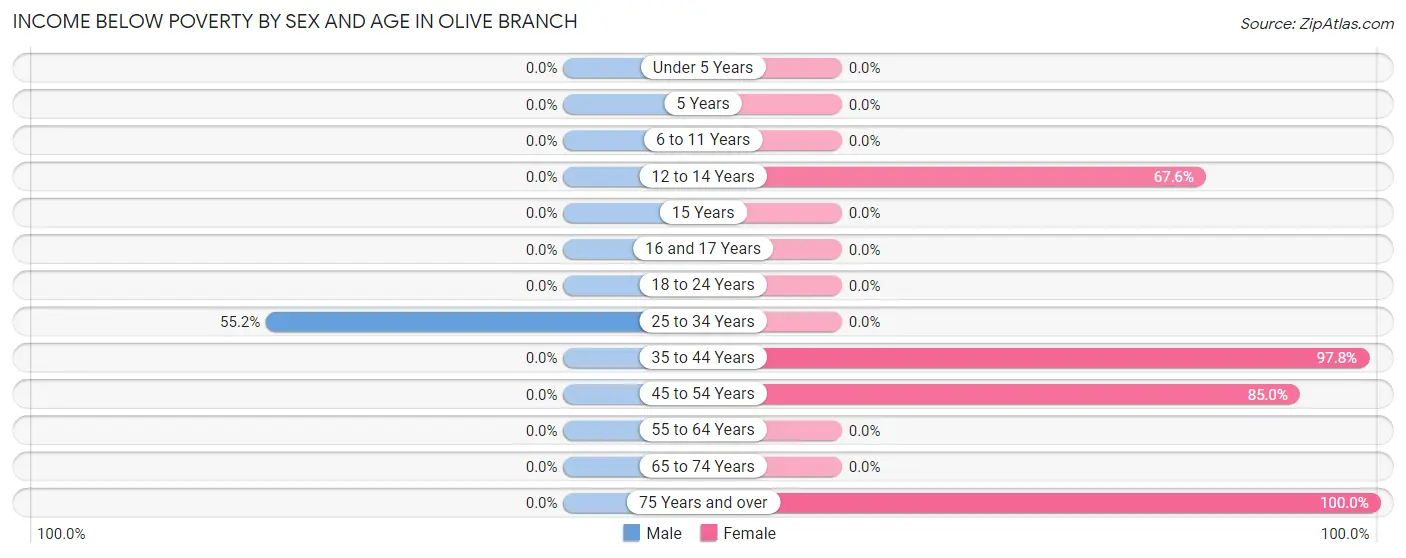
| Age Bracket | Male | Female |
| Under 5 Years | 0 (0.0%) | 0 (0.0%) |
| 5 Years | 0 (0.0%) | 0 (0.0%) |
| 6 to 11 Years | 0 (0.0%) | 0 (0.0%) |
| 12 to 14 Years | 0 (0.0%) | 50 (67.6%) |
| 15 Years | 0 (0.0%) | 0 (0.0%) |
| 16 and 17 Years | 0 (0.0%) | 0 (0.0%) |
| 18 to 24 Years | 0 (0.0%) | 0 (0.0%) |
| 25 to 34 Years | 16 (55.2%) | 0 (0.0%) |
| 35 to 44 Years | 0 (0.0%) | 45 (97.8%) |
| 45 to 54 Years | 0 (0.0%) | 17 (85.0%) |
| 55 to 64 Years | 0 (0.0%) | 0 (0.0%) |
| 65 to 74 Years | 0 (0.0%) | 0 (0.0%) |
| 75 Years and over | 0 (0.0%) | 25 (100.0%) |
| Total | 16 (5.3%) | 137 (49.1%) |
Income Above Poverty by Sex and Age in Olive Branch
According to the poverty statistics in Olive Branch, males aged under 5 years and females aged 25 to 34 years are the age groups that are most secure financially, with 100.0% of males and 100.0% of females in these age groups living above the poverty line.
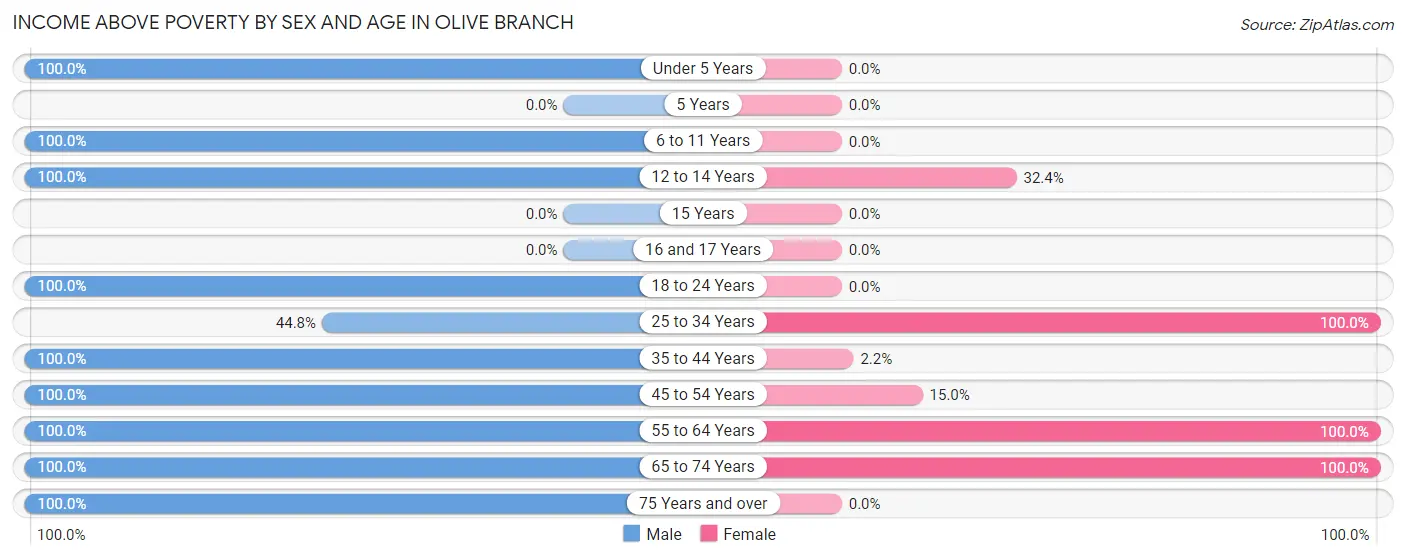
| Age Bracket | Male | Female |
| Under 5 Years | 19 (100.0%) | 0 (0.0%) |
| 5 Years | 0 (0.0%) | 0 (0.0%) |
| 6 to 11 Years | 30 (100.0%) | 0 (0.0%) |
| 12 to 14 Years | 23 (100.0%) | 24 (32.4%) |
| 15 Years | 0 (0.0%) | 0 (0.0%) |
| 16 and 17 Years | 0 (0.0%) | 0 (0.0%) |
| 18 to 24 Years | 4 (100.0%) | 0 (0.0%) |
| 25 to 34 Years | 13 (44.8%) | 32 (100.0%) |
| 35 to 44 Years | 20 (100.0%) | 1 (2.2%) |
| 45 to 54 Years | 18 (100.0%) | 3 (15.0%) |
| 55 to 64 Years | 118 (100.0%) | 28 (100.0%) |
| 65 to 74 Years | 17 (100.0%) | 54 (100.0%) |
| 75 Years and over | 21 (100.0%) | 0 (0.0%) |
| Total | 283 (94.7%) | 142 (50.9%) |
Income Below Poverty Among Married-Couple Families in Olive Branch
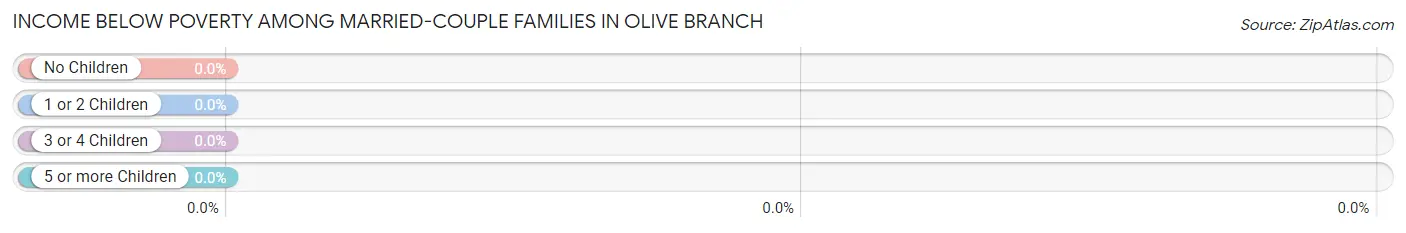
| Children | Above Poverty | Below Poverty |
| No Children | 77 (100.0%) | 0 (0.0%) |
| 1 or 2 Children | 8 (100.0%) | 0 (0.0%) |
| 3 or 4 Children | 15 (100.0%) | 0 (0.0%) |
| 5 or more Children | 0 (0.0%) | 0 (0.0%) |
| Total | 100 (100.0%) | 0 (0.0%) |
Income Below Poverty Among Single-Parent Households in Olive Branch
According to the poverty data in Olive Branch, 100.0% or 16 single-father households and 68.0% or 17 single-mother households are living below the poverty line. Among single-father households, those with 1 or 2 children have the highest poverty rate, with 16 households (100.0%) experiencing poverty. Likewise, among single-mother households, those with 1 or 2 children have the highest poverty rate, with 17 households (68.0%) falling below the poverty line.
| Children | Single Father | Single Mother |
| No Children | 0 (0.0%) | 0 (0.0%) |
| 1 or 2 Children | 16 (100.0%) | 17 (68.0%) |
| 3 or 4 Children | 0 (0.0%) | 0 (0.0%) |
| 5 or more Children | 0 (0.0%) | 0 (0.0%) |
| Total | 16 (100.0%) | 17 (68.0%) |
Income Below Poverty Among Married-Couple vs Single-Parent Households in Olive Branch
| Children | Married-Couple Families | Single-Parent Households |
| No Children | 0 (0.0%) | 0 (0.0%) |
| 1 or 2 Children | 0 (0.0%) | 33 (80.5%) |
| 3 or 4 Children | 0 (0.0%) | 0 (0.0%) |
| 5 or more Children | 0 (0.0%) | 0 (0.0%) |
| Total | 0 (0.0%) | 33 (80.5%) |
Race in Olive Branch
The most populous races in Olive Branch are White / Caucasian (577 | 99.8%), and Two or more Races (1 | 0.2%).
| Race | # Population | % Population |
| Asian | 0 | 0.0% |
| Black / African American | 0 | 0.0% |
| Hawaiian / Pacific | 0 | 0.0% |
| Hispanic or Latino | 0 | 0.0% |
| Native / Alaskan | 0 | 0.0% |
| White / Caucasian | 577 | 99.8% |
| Two or more Races | 1 | 0.2% |
| Some other Race | 0 | 0.0% |
| Total | 578 | 100.0% |
Ancestry in Olive Branch
The most populous ancestries reported in Olive Branch are German (127 | 22.0%), English (59 | 10.2%), Irish (25 | 4.3%), American (16 | 2.8%), and European (9 | 1.6%), together accounting for 40.8% of all Olive Branch residents.
| Ancestry | # Population | % Population |
| American | 16 | 2.8% |
| Blackfeet | 1 | 0.2% |
| Cherokee | 1 | 0.2% |
| English | 59 | 10.2% |
| European | 9 | 1.6% |
| French | 5 | 0.9% |
| German | 127 | 22.0% |
| Irish | 25 | 4.3% |
| Welsh | 5 | 0.9% | View All 9 Rows |
Immigrants in Olive Branch

| Immigration Origin | # Population | % Population | View All 0 Rows |
Sex and Age in Olive Branch
Sex and Age in Olive Branch
The most populous age groups in Olive Branch are 60 to 64 Years (113 | 37.8%) for men and 10 to 14 Years (74 | 26.5%) for women.
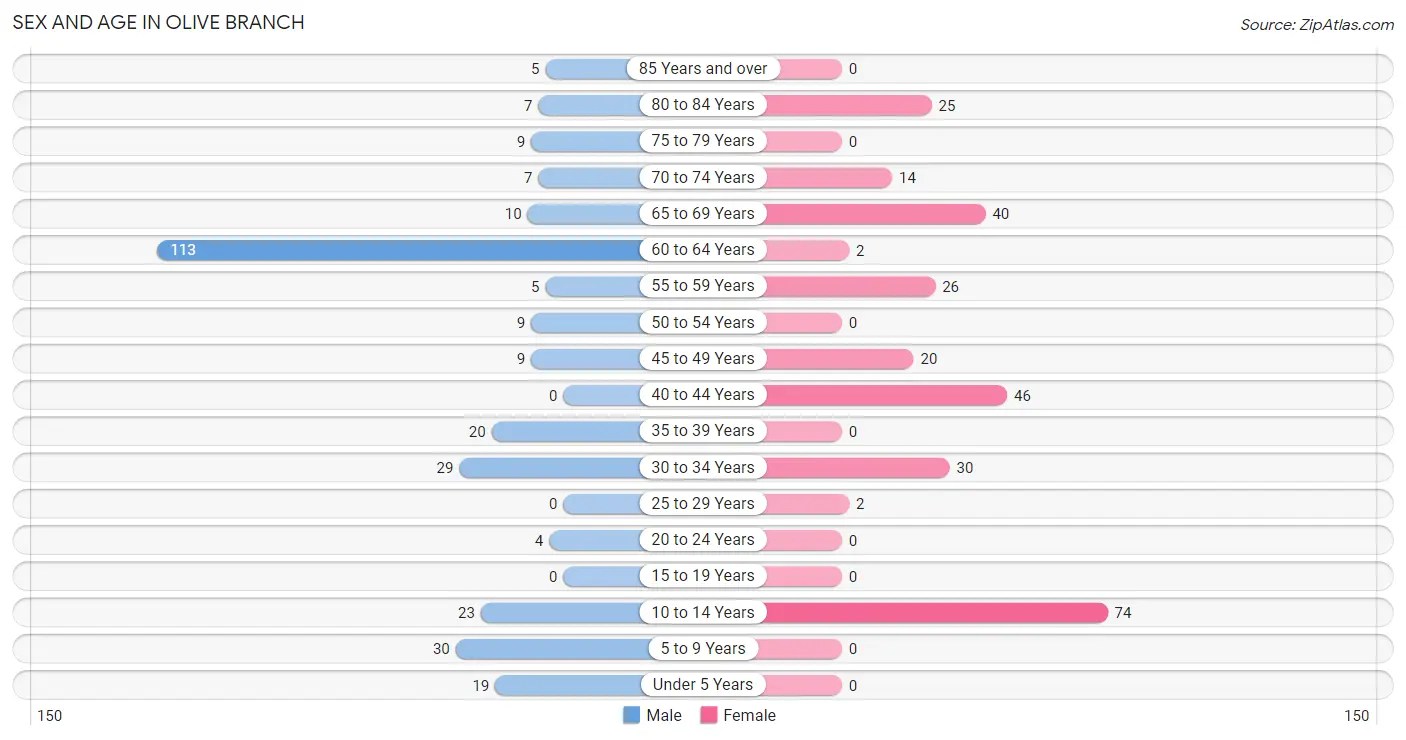
| Age Bracket | Male | Female |
| Under 5 Years | 19 (6.4%) | 0 (0.0%) |
| 5 to 9 Years | 30 (10.0%) | 0 (0.0%) |
| 10 to 14 Years | 23 (7.7%) | 74 (26.5%) |
| 15 to 19 Years | 0 (0.0%) | 0 (0.0%) |
| 20 to 24 Years | 4 (1.3%) | 0 (0.0%) |
| 25 to 29 Years | 0 (0.0%) | 2 (0.7%) |
| 30 to 34 Years | 29 (9.7%) | 30 (10.7%) |
| 35 to 39 Years | 20 (6.7%) | 0 (0.0%) |
| 40 to 44 Years | 0 (0.0%) | 46 (16.5%) |
| 45 to 49 Years | 9 (3.0%) | 20 (7.2%) |
| 50 to 54 Years | 9 (3.0%) | 0 (0.0%) |
| 55 to 59 Years | 5 (1.7%) | 26 (9.3%) |
| 60 to 64 Years | 113 (37.8%) | 2 (0.7%) |
| 65 to 69 Years | 10 (3.3%) | 40 (14.3%) |
| 70 to 74 Years | 7 (2.3%) | 14 (5.0%) |
| 75 to 79 Years | 9 (3.0%) | 0 (0.0%) |
| 80 to 84 Years | 7 (2.3%) | 25 (9.0%) |
| 85 Years and over | 5 (1.7%) | 0 (0.0%) |
| Total | 299 (100.0%) | 279 (100.0%) |
Families and Households in Olive Branch
Median Family Size in Olive Branch
The median family size in Olive Branch is 3.67 persons per family, with single female/mother families (25 | 17.7%) accounting for the largest median family size of 7.12 persons per family. On the other hand, single male/father families (16 | 11.4%) represent the smallest median family size with 2.63 persons per family.
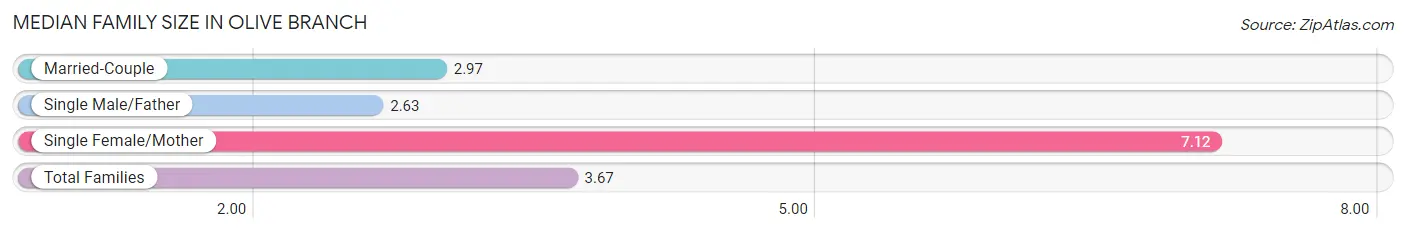
| Family Type | # Families | Family Size |
| Married-Couple | 100 (70.9%) | 2.97 |
| Single Male/Father | 16 (11.4%) | 2.63 |
| Single Female/Mother | 25 (17.7%) | 7.12 |
| Total Families | 141 (100.0%) | 3.67 |
Median Household Size in Olive Branch
The median household size in Olive Branch is 2.89 persons per household, with single female/mother households (25 | 12.5%) accounting for the largest median household size of 7.12 persons per household. non-family households (59 | 29.5%) represent the smallest median household size with 1.03 persons per household.
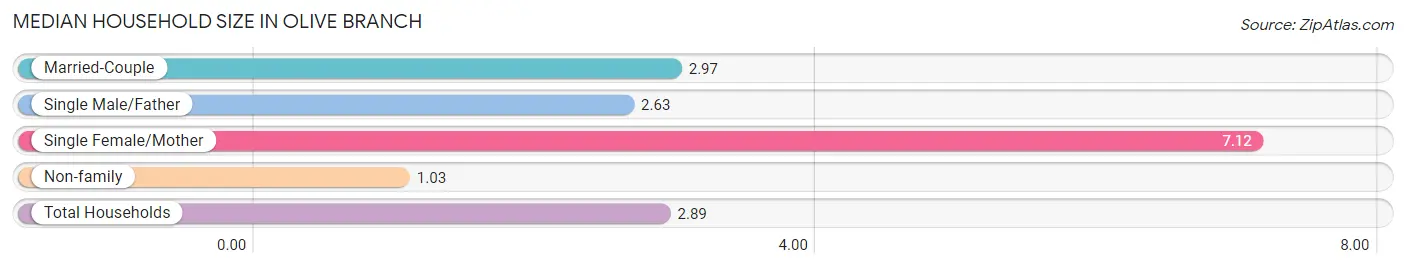
| Household Type | # Households | Household Size |
| Married-Couple | 100 (50.0%) | 2.97 |
| Single Male/Father | 16 (8.0%) | 2.63 |
| Single Female/Mother | 25 (12.5%) | 7.12 |
| Non-family | 59 (29.5%) | 1.03 |
| Total Households | 200 (100.0%) | 2.89 |
Household Size by Marriage Status in Olive Branch
Out of a total of 200 households in Olive Branch, 141 (70.5%) are family households, while 59 (29.5%) are nonfamily households. The most numerous type of family households are 2-person households, comprising 90, and the most common type of nonfamily households are 1-person households, comprising 58.
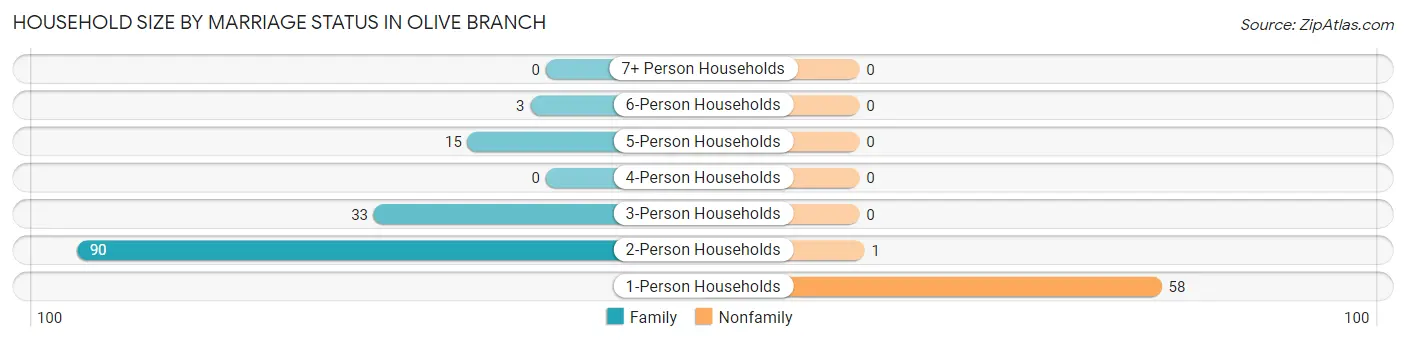
| Household Size | Family Households | Nonfamily Households |
| 1-Person Households | - | 58 (29.0%) |
| 2-Person Households | 90 (45.0%) | 1 (0.5%) |
| 3-Person Households | 33 (16.5%) | 0 (0.0%) |
| 4-Person Households | 0 (0.0%) | 0 (0.0%) |
| 5-Person Households | 15 (7.5%) | 0 (0.0%) |
| 6-Person Households | 3 (1.5%) | 0 (0.0%) |
| 7+ Person Households | 0 (0.0%) | 0 (0.0%) |
| Total | 141 (70.5%) | 59 (29.5%) |
Female Fertility in Olive Branch
Fertility by Age in Olive Branch
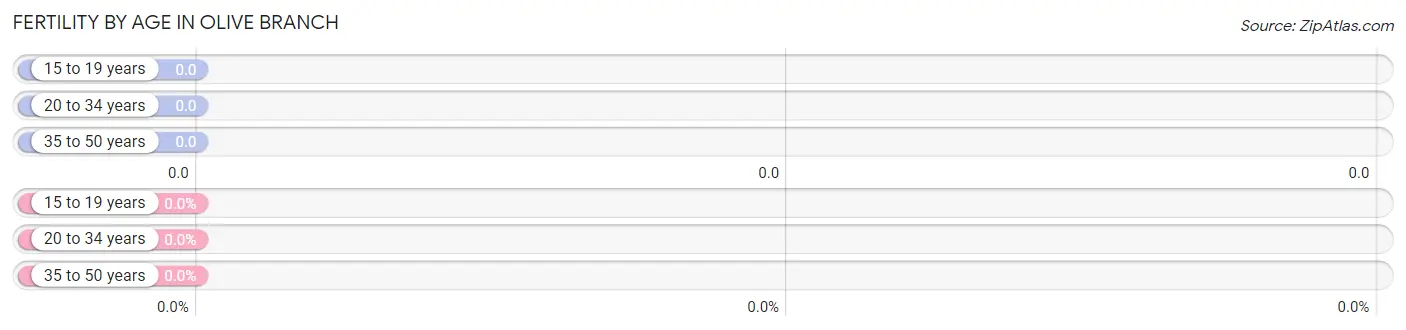
| Age Bracket | Women with Births | Births / 1,000 Women |
| 15 to 19 years | 0 (0.0%) | 0.0 |
| 20 to 34 years | 0 (0.0%) | 0.0 |
| 35 to 50 years | 0 (0.0%) | 0.0 |
| Total | 0 (0.0%) | 0.0 |
Fertility by Age by Marriage Status in Olive Branch
| Age Bracket | Married | Unmarried |
| 15 to 19 years | 0 (0.0%) | 0 (0.0%) |
| 20 to 34 years | 0 (0.0%) | 0 (0.0%) |
| 35 to 50 years | 0 (0.0%) | 0 (0.0%) |
| Total | 0 (0.0%) | 0 (0.0%) |
Fertility by Education in Olive Branch
| Educational Attainment | Women with Births | Births / 1,000 Women |
| Less than High School | 0 (0.0%) | 0.0 |
| High School Diploma | 0 (0.0%) | 0.0 |
| College or Associate's Degree | 0 (0.0%) | 0.0 |
| Bachelor's Degree | 0 (0.0%) | 0.0 |
| Graduate Degree | 0 (0.0%) | 0.0 |
| Total | 0 (0.0%) | 0.0 |
Fertility by Education by Marriage Status in Olive Branch
| Educational Attainment | Married | Unmarried |
| Less than High School | 0 (0.0%) | 0 (0.0%) |
| High School Diploma | 0 (0.0%) | 0 (0.0%) |
| College or Associate's Degree | 0 (0.0%) | 0 (0.0%) |
| Bachelor's Degree | 0 (0.0%) | 0 (0.0%) |
| Graduate Degree | 0 (0.0%) | 0 (0.0%) |
| Total | 0 (0.0%) | 0 (0.0%) |
Employment Characteristics in Olive Branch
Employment by Class of Employer in Olive Branch
Among the 233 employed individuals in Olive Branch, private company employees (153 | 65.7%), self-employed (incorporated) (29 | 12.4%), and local government employees (18 | 7.7%) make up the most common classes of employment.
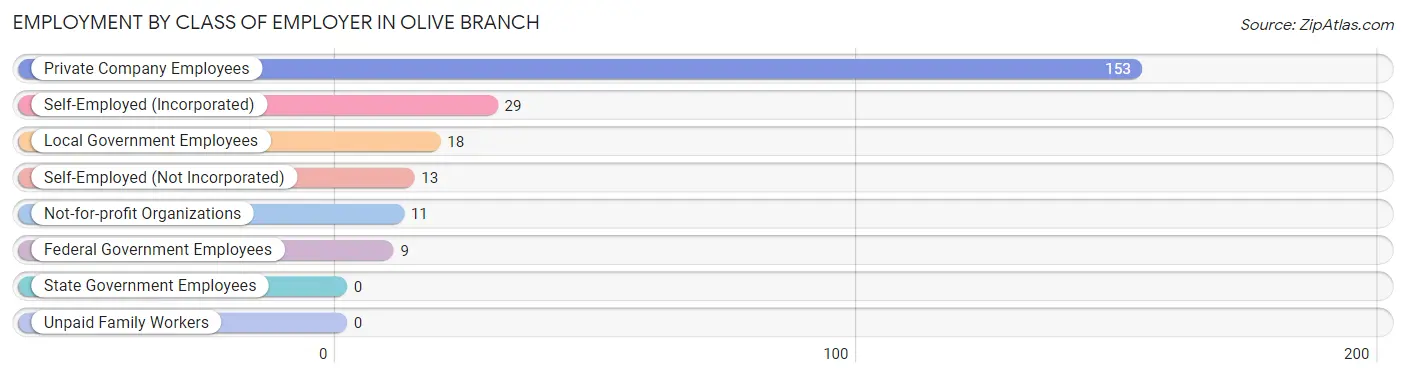
| Employer Class | # Employees | % Employees |
| Private Company Employees | 153 | 65.7% |
| Self-Employed (Incorporated) | 29 | 12.4% |
| Self-Employed (Not Incorporated) | 13 | 5.6% |
| Not-for-profit Organizations | 11 | 4.7% |
| Local Government Employees | 18 | 7.7% |
| State Government Employees | 0 | 0.0% |
| Federal Government Employees | 9 | 3.9% |
| Unpaid Family Workers | 0 | 0.0% |
| Total | 233 | 100.0% |
Employment Status by Age in Olive Branch
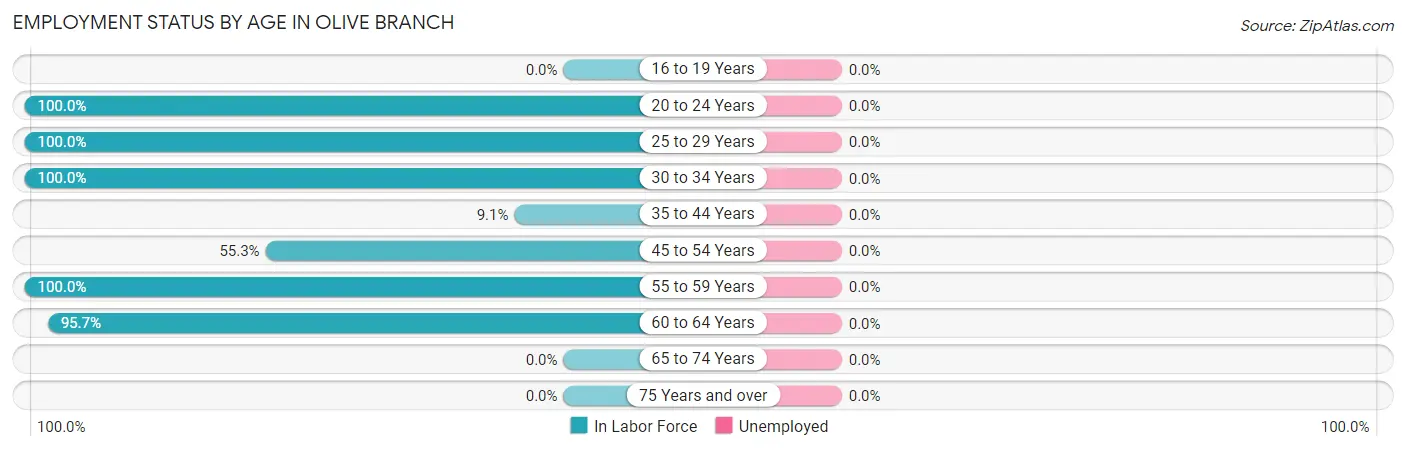
| Age Bracket | In Labor Force | Unemployed |
| 16 to 19 Years | 0 (0.0%) | 0 (0.0%) |
| 20 to 24 Years | 4 (100.0%) | 0 (0.0%) |
| 25 to 29 Years | 2 (100.0%) | 0 (0.0%) |
| 30 to 34 Years | 59 (100.0%) | 0 (0.0%) |
| 35 to 44 Years | 6 (9.1%) | 0 (0.0%) |
| 45 to 54 Years | 21 (55.3%) | 0 (0.0%) |
| 55 to 59 Years | 31 (100.0%) | 0 (0.0%) |
| 60 to 64 Years | 110 (95.7%) | 0 (0.0%) |
| 65 to 74 Years | 0 (0.0%) | 0 (0.0%) |
| 75 Years and over | 0 (0.0%) | 0 (0.0%) |
| Total | 233 (53.9%) | 0 (0.0%) |
Employment Status by Educational Attainment in Olive Branch
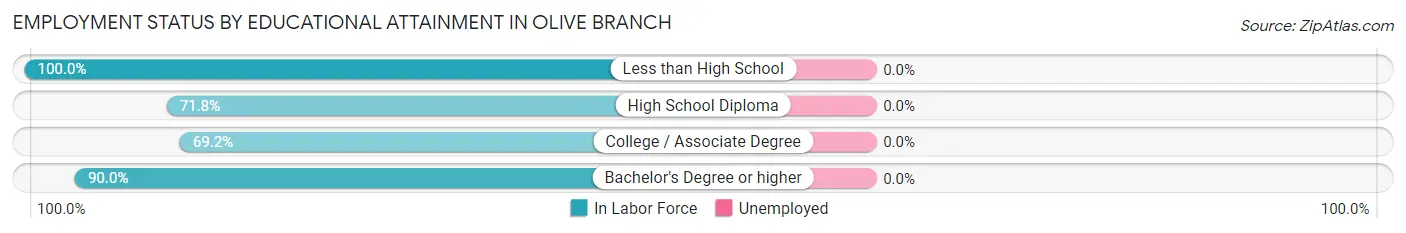
| Educational Attainment | In Labor Force | Unemployed |
| Less than High School | 17 (100.0%) | 0 (0.0%) |
| High School Diploma | 122 (71.8%) | 0 (0.0%) |
| College / Associate Degree | 72 (69.2%) | 0 (0.0%) |
| Bachelor's Degree or higher | 18 (90.0%) | 0 (0.0%) |
| Total | 229 (73.6%) | 0 (0.0%) |
Employment Occupations by Sex in Olive Branch
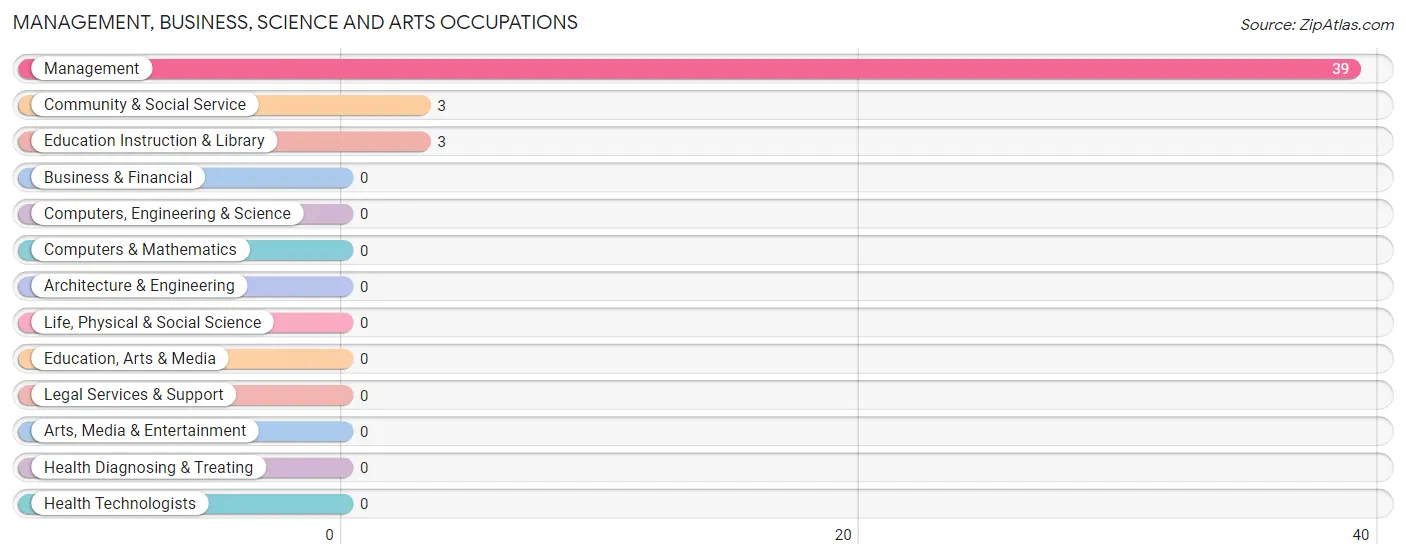
Management, Business, Science and Arts Occupations
The most common Management, Business, Science and Arts occupations in Olive Branch are Management (39 | 16.7%), Community & Social Service (3 | 1.3%), and Education Instruction & Library (3 | 1.3%).
Management, Business, Science and Arts Occupations by Sex
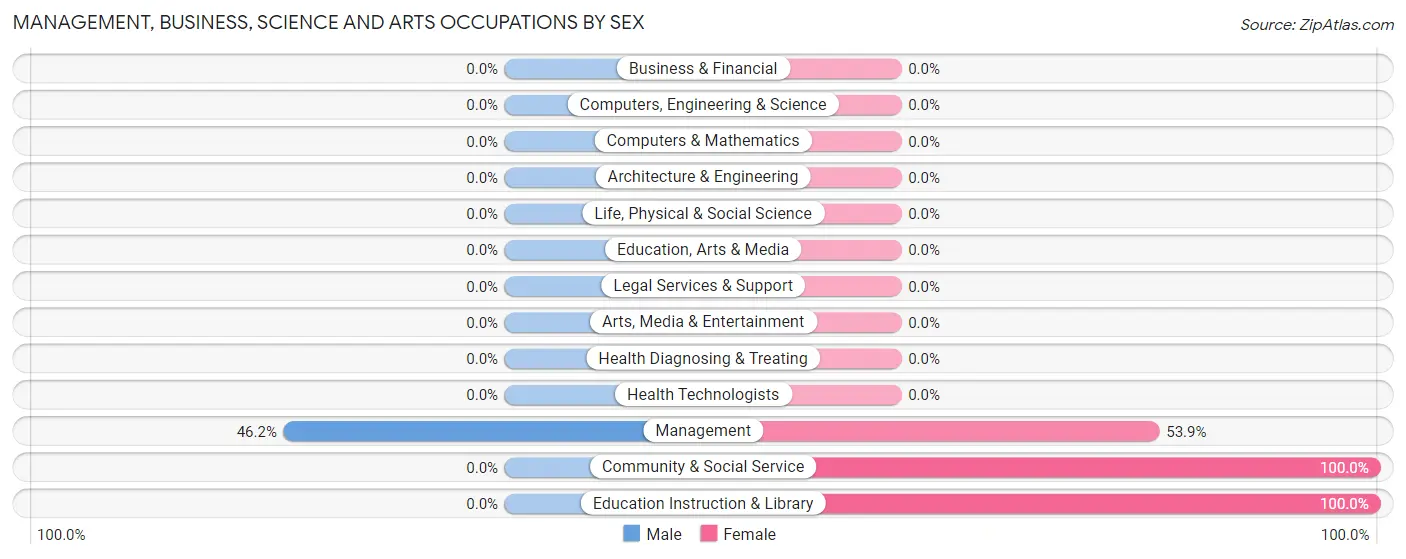
| Occupation | Male | Female |
| Management | 18 (46.2%) | 21 (53.8%) |
| Business & Financial | 0 (0.0%) | 0 (0.0%) |
| Computers, Engineering & Science | 0 (0.0%) | 0 (0.0%) |
| Computers & Mathematics | 0 (0.0%) | 0 (0.0%) |
| Architecture & Engineering | 0 (0.0%) | 0 (0.0%) |
| Life, Physical & Social Science | 0 (0.0%) | 0 (0.0%) |
| Community & Social Service | 0 (0.0%) | 3 (100.0%) |
| Education, Arts & Media | 0 (0.0%) | 0 (0.0%) |
| Legal Services & Support | 0 (0.0%) | 0 (0.0%) |
| Education Instruction & Library | 0 (0.0%) | 3 (100.0%) |
| Arts, Media & Entertainment | 0 (0.0%) | 0 (0.0%) |
| Health Diagnosing & Treating | 0 (0.0%) | 0 (0.0%) |
| Health Technologists | 0 (0.0%) | 0 (0.0%) |
| Total (Category) | 18 (42.9%) | 24 (57.1%) |
| Total (Overall) | 171 (73.4%) | 62 (26.6%) |
Services Occupations
The most common Services occupations in Olive Branch are Food Preparation & Serving (17 | 7.3%), and Healthcare Support (7 | 3.0%).
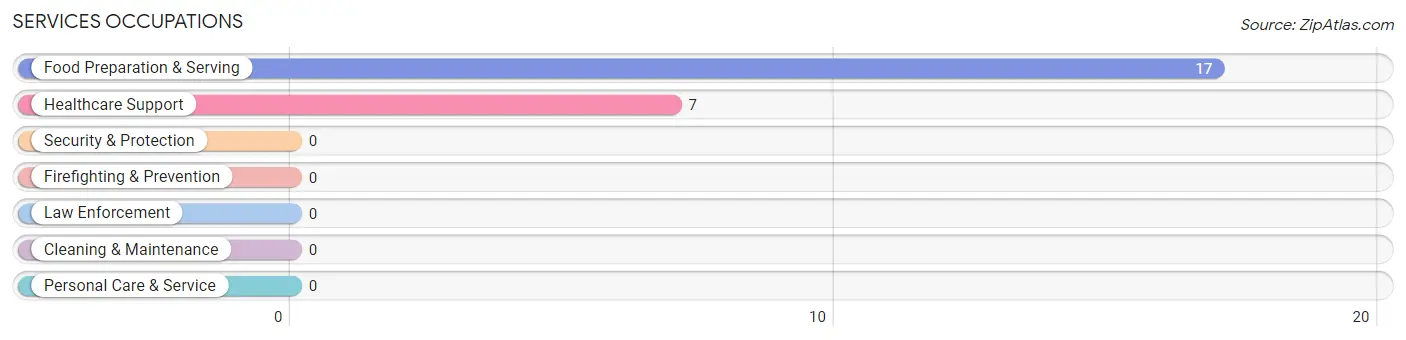
Services Occupations by Sex
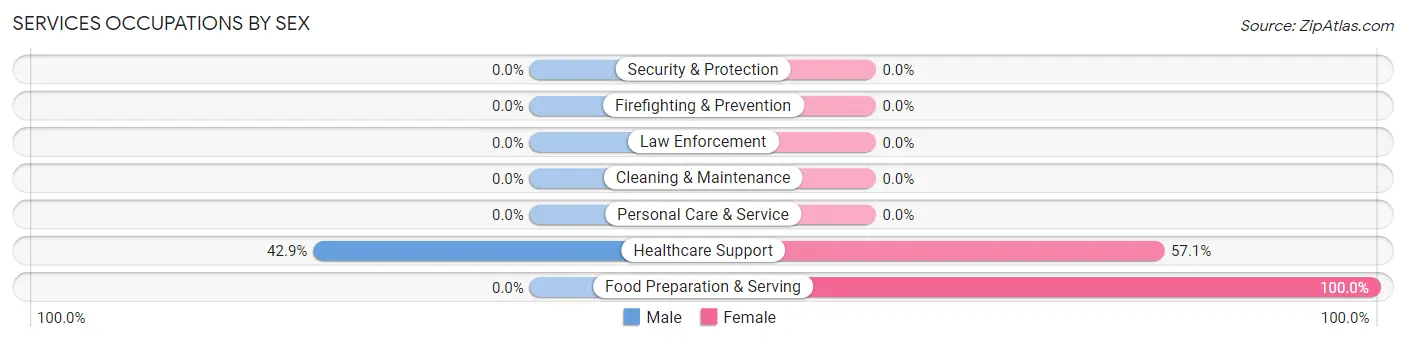
| Occupation | Male | Female |
| Healthcare Support | 3 (42.9%) | 4 (57.1%) |
| Security & Protection | 0 (0.0%) | 0 (0.0%) |
| Firefighting & Prevention | 0 (0.0%) | 0 (0.0%) |
| Law Enforcement | 0 (0.0%) | 0 (0.0%) |
| Food Preparation & Serving | 0 (0.0%) | 17 (100.0%) |
| Cleaning & Maintenance | 0 (0.0%) | 0 (0.0%) |
| Personal Care & Service | 0 (0.0%) | 0 (0.0%) |
| Total (Category) | 3 (12.5%) | 21 (87.5%) |
| Total (Overall) | 171 (73.4%) | 62 (26.6%) |
Sales and Office Occupations
The most common Sales and Office occupations in Olive Branch are Office & Administration (4 | 1.7%), and Sales & Related (1 | 0.4%).

Sales and Office Occupations by Sex

| Occupation | Male | Female |
| Sales & Related | 1 (100.0%) | 0 (0.0%) |
| Office & Administration | 3 (75.0%) | 1 (25.0%) |
| Total (Category) | 4 (80.0%) | 1 (20.0%) |
| Total (Overall) | 171 (73.4%) | 62 (26.6%) |
Natural Resources, Construction and Maintenance Occupations
The most common Natural Resources, Construction and Maintenance occupations in Olive Branch are , and Construction & Extraction (6 | 2.6%).
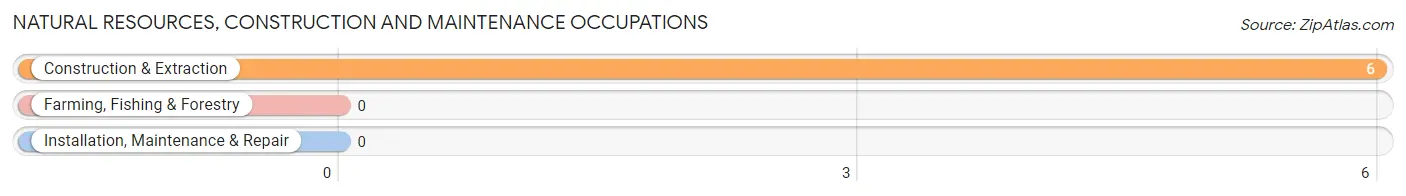
Natural Resources, Construction and Maintenance Occupations by Sex
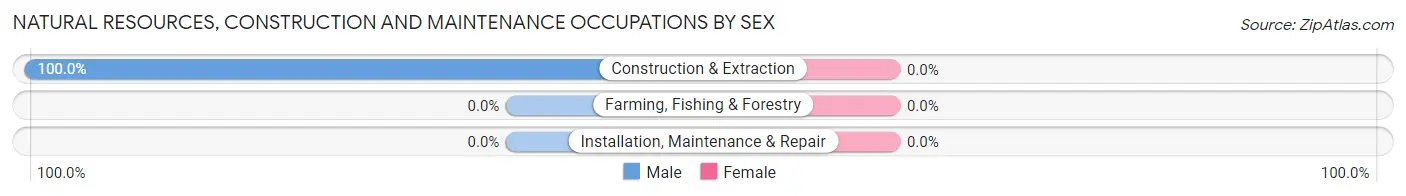
| Occupation | Male | Female |
| Farming, Fishing & Forestry | 0 (0.0%) | 0 (0.0%) |
| Construction & Extraction | 6 (100.0%) | 0 (0.0%) |
| Installation, Maintenance & Repair | 0 (0.0%) | 0 (0.0%) |
| Total (Category) | 6 (100.0%) | 0 (0.0%) |
| Total (Overall) | 171 (73.4%) | 62 (26.6%) |
Production, Transportation and Moving Occupations
The most common Production, Transportation and Moving occupations in Olive Branch are Material Moving (86 | 36.9%), Transportation (38 | 16.3%), and Production (32 | 13.7%).
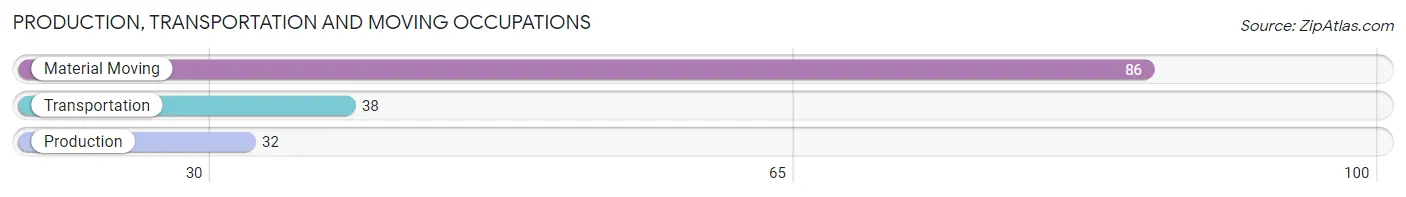
Production, Transportation and Moving Occupations by Sex
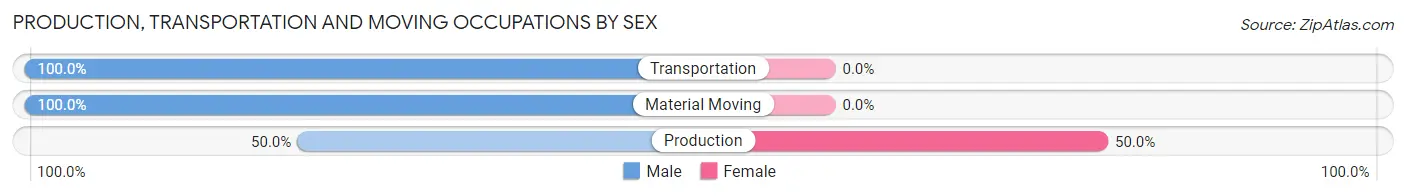
| Occupation | Male | Female |
| Production | 16 (50.0%) | 16 (50.0%) |
| Transportation | 38 (100.0%) | 0 (0.0%) |
| Material Moving | 86 (100.0%) | 0 (0.0%) |
| Total (Category) | 140 (89.7%) | 16 (10.3%) |
| Total (Overall) | 171 (73.4%) | 62 (26.6%) |
Employment Industries by Sex in Olive Branch
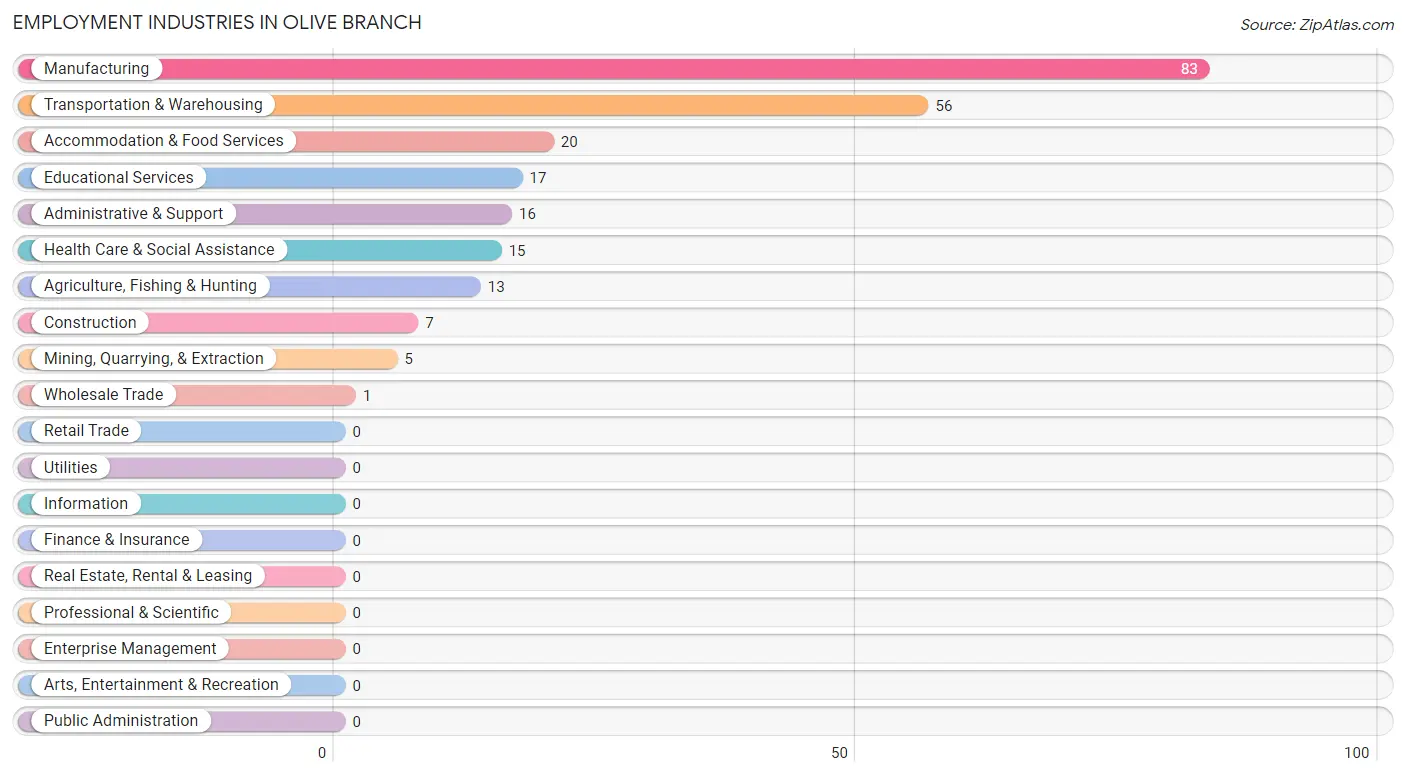
Employment Industries in Olive Branch
The major employment industries in Olive Branch include Manufacturing (83 | 35.6%), Transportation & Warehousing (56 | 24.0%), Accommodation & Food Services (20 | 8.6%), Educational Services (17 | 7.3%), and Administrative & Support (16 | 6.9%).
Employment Industries by Sex in Olive Branch
The Olive Branch industries that see more men than women are Agriculture, Fishing & Hunting (100.0%), Mining, Quarrying, & Extraction (100.0%), and Wholesale Trade (100.0%), whereas the industries that tend to have a higher number of women are Accommodation & Food Services (100.0%), Health Care & Social Assistance (80.0%), and Educational Services (70.6%).
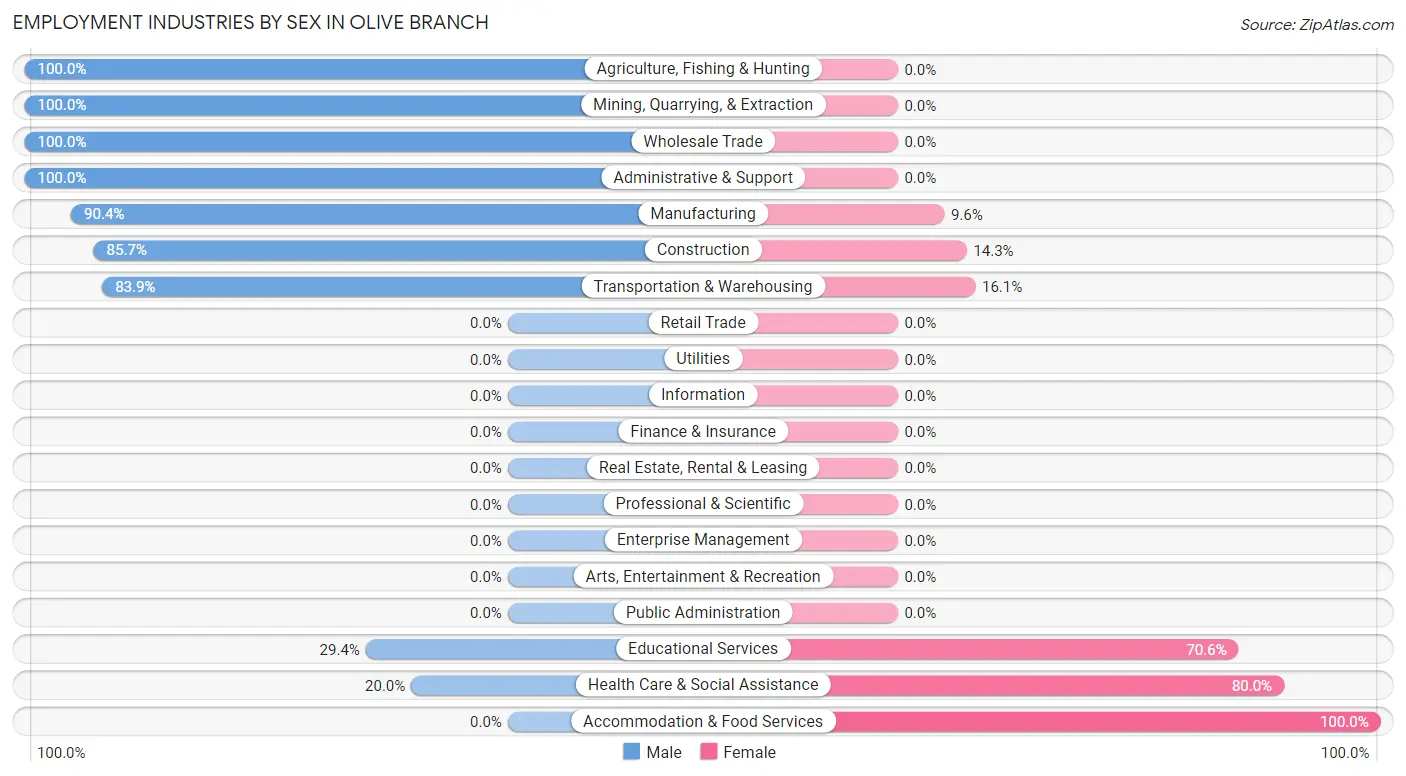
| Industry | Male | Female |
| Agriculture, Fishing & Hunting | 13 (100.0%) | 0 (0.0%) |
| Mining, Quarrying, & Extraction | 5 (100.0%) | 0 (0.0%) |
| Construction | 6 (85.7%) | 1 (14.3%) |
| Manufacturing | 75 (90.4%) | 8 (9.6%) |
| Wholesale Trade | 1 (100.0%) | 0 (0.0%) |
| Retail Trade | 0 (0.0%) | 0 (0.0%) |
| Transportation & Warehousing | 47 (83.9%) | 9 (16.1%) |
| Utilities | 0 (0.0%) | 0 (0.0%) |
| Information | 0 (0.0%) | 0 (0.0%) |
| Finance & Insurance | 0 (0.0%) | 0 (0.0%) |
| Real Estate, Rental & Leasing | 0 (0.0%) | 0 (0.0%) |
| Professional & Scientific | 0 (0.0%) | 0 (0.0%) |
| Enterprise Management | 0 (0.0%) | 0 (0.0%) |
| Administrative & Support | 16 (100.0%) | 0 (0.0%) |
| Educational Services | 5 (29.4%) | 12 (70.6%) |
| Health Care & Social Assistance | 3 (20.0%) | 12 (80.0%) |
| Arts, Entertainment & Recreation | 0 (0.0%) | 0 (0.0%) |
| Accommodation & Food Services | 0 (0.0%) | 20 (100.0%) |
| Public Administration | 0 (0.0%) | 0 (0.0%) |
| Total | 171 (73.4%) | 62 (26.6%) |
Education in Olive Branch
School Enrollment in Olive Branch
The most common levels of schooling among the 134 students in Olive Branch are middle school (97 | 72.4%), elementary school (23 | 17.2%), and kindergarten (7 | 5.2%).
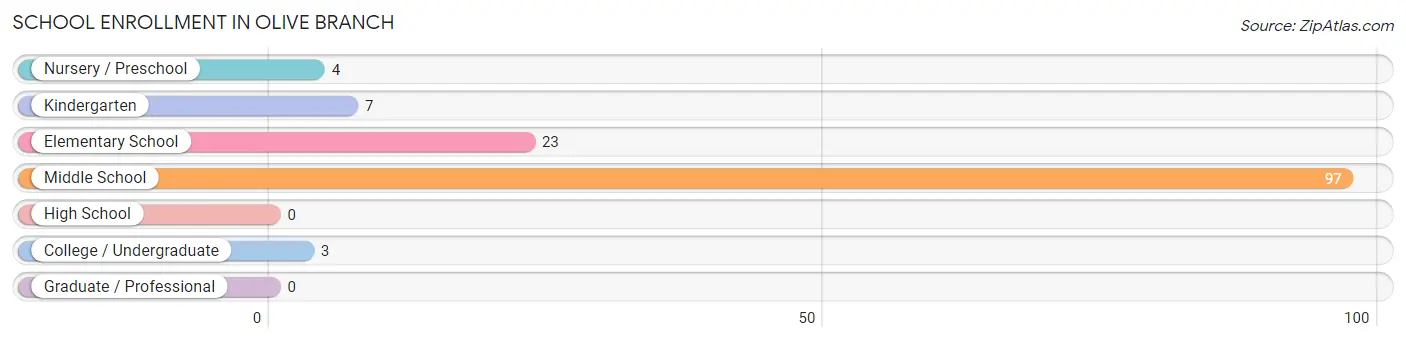
| School Level | # Students | % Students |
| Nursery / Preschool | 4 | 3.0% |
| Kindergarten | 7 | 5.2% |
| Elementary School | 23 | 17.2% |
| Middle School | 97 | 72.4% |
| High School | 0 | 0.0% |
| College / Undergraduate | 3 | 2.2% |
| Graduate / Professional | 0 | 0.0% |
| Total | 134 | 100.0% |
School Enrollment by Age by Funding Source in Olive Branch
Out of a total of 134 students who are enrolled in schools in Olive Branch, 3 (2.2%) attend a private institution, while the remaining 131 (97.8%) are enrolled in public schools. The age group of 20 to 24 year olds has the highest likelihood of being enrolled in private schools, with 3 (100.0% in the age bracket) enrolled. Conversely, the age group of 3 to 4 year olds has the lowest likelihood of being enrolled in a private school, with 4 (100.0% in the age bracket) attending a public institution.
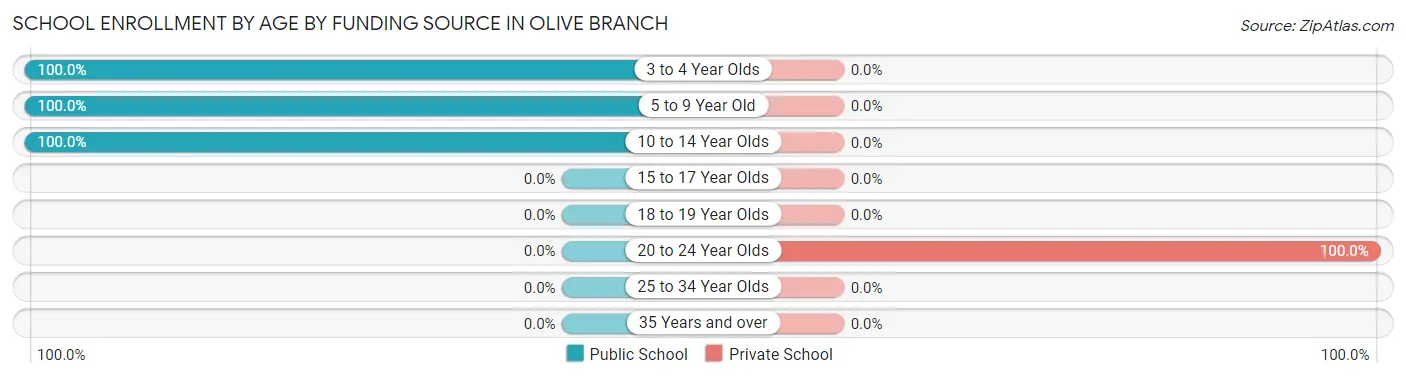
| Age Bracket | Public School | Private School |
| 3 to 4 Year Olds | 4 (100.0%) | 0 (0.0%) |
| 5 to 9 Year Old | 30 (100.0%) | 0 (0.0%) |
| 10 to 14 Year Olds | 97 (100.0%) | 0 (0.0%) |
| 15 to 17 Year Olds | 0 (0.0%) | 0 (0.0%) |
| 18 to 19 Year Olds | 0 (0.0%) | 0 (0.0%) |
| 20 to 24 Year Olds | 0 (0.0%) | 3 (100.0%) |
| 25 to 34 Year Olds | 0 (0.0%) | 0 (0.0%) |
| 35 Years and over | 0 (0.0%) | 0 (0.0%) |
| Total | 131 (97.8%) | 3 (2.2%) |
Educational Attainment by Field of Study in Olive Branch
Arts & humanities (12 | 40.0%), social sciences (5 | 16.7%), science & technology (5 | 16.7%), education (5 | 16.7%), and business (2 | 6.7%) are the most common fields of study among 30 individuals in Olive Branch who have obtained a bachelor's degree or higher.
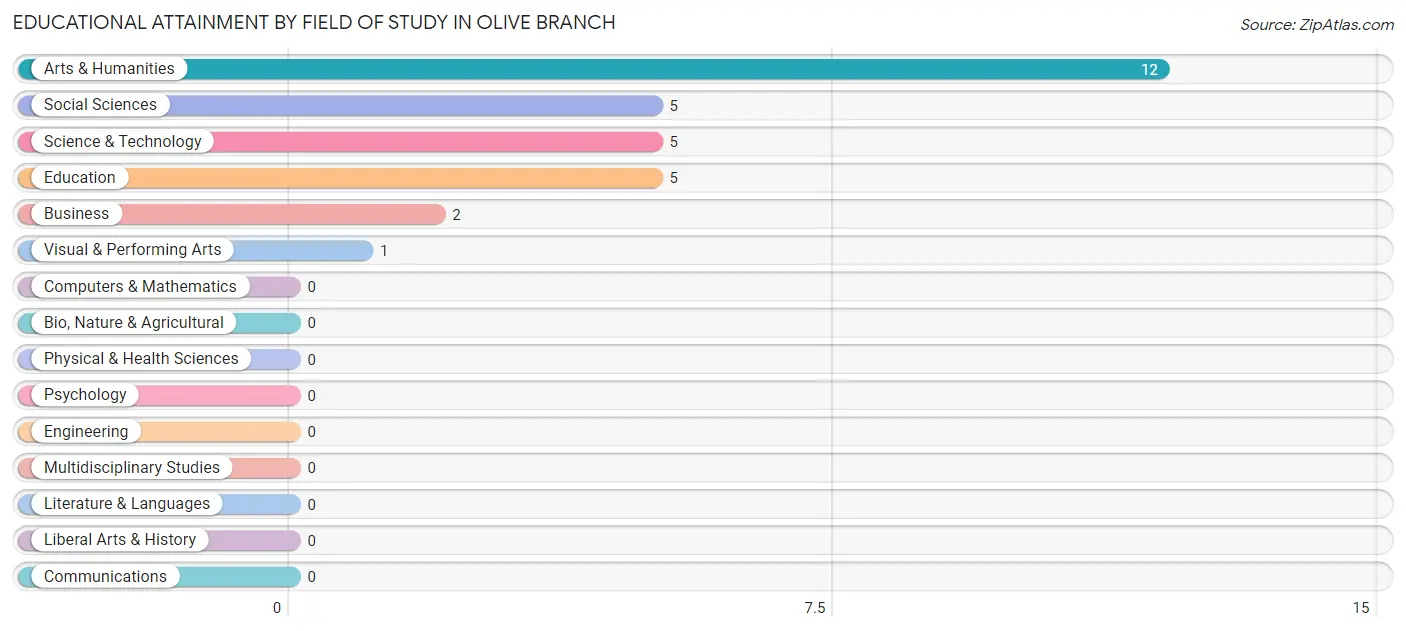
| Field of Study | # Graduates | % Graduates |
| Computers & Mathematics | 0 | 0.0% |
| Bio, Nature & Agricultural | 0 | 0.0% |
| Physical & Health Sciences | 0 | 0.0% |
| Psychology | 0 | 0.0% |
| Social Sciences | 5 | 16.7% |
| Engineering | 0 | 0.0% |
| Multidisciplinary Studies | 0 | 0.0% |
| Science & Technology | 5 | 16.7% |
| Business | 2 | 6.7% |
| Education | 5 | 16.7% |
| Literature & Languages | 0 | 0.0% |
| Liberal Arts & History | 0 | 0.0% |
| Visual & Performing Arts | 1 | 3.3% |
| Communications | 0 | 0.0% |
| Arts & Humanities | 12 | 40.0% |
| Total | 30 | 100.0% |
Transportation & Commute in Olive Branch
Vehicle Availability by Sex in Olive Branch
The most prevalent vehicle ownership categories in Olive Branch are males with 2 vehicles (112, accounting for 65.5%) and females with 2 vehicles (21, making up 180.6%).
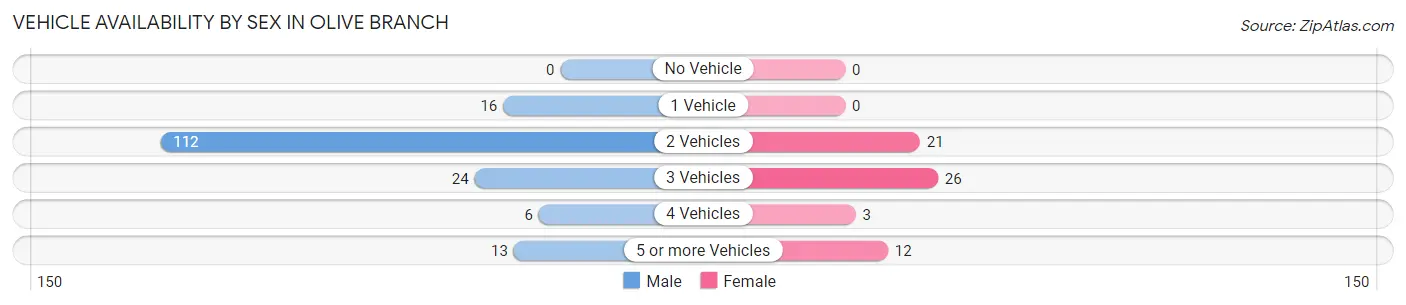
| Vehicles Available | Male | Female |
| No Vehicle | 0 (0.0%) | 0 (0.0%) |
| 1 Vehicle | 16 (9.4%) | 0 (0.0%) |
| 2 Vehicles | 112 (65.5%) | 21 (33.9%) |
| 3 Vehicles | 24 (14.0%) | 26 (41.9%) |
| 4 Vehicles | 6 (3.5%) | 3 (4.8%) |
| 5 or more Vehicles | 13 (7.6%) | 12 (19.4%) |
| Total | 171 (100.0%) | 62 (100.0%) |
Commute Time in Olive Branch
The most frequently occuring commute durations in Olive Branch are 35 to 39 minutes (72 commuters, 30.9%), 30 to 34 minutes (49 commuters, 21.0%), and 45 to 59 minutes (24 commuters, 10.3%).
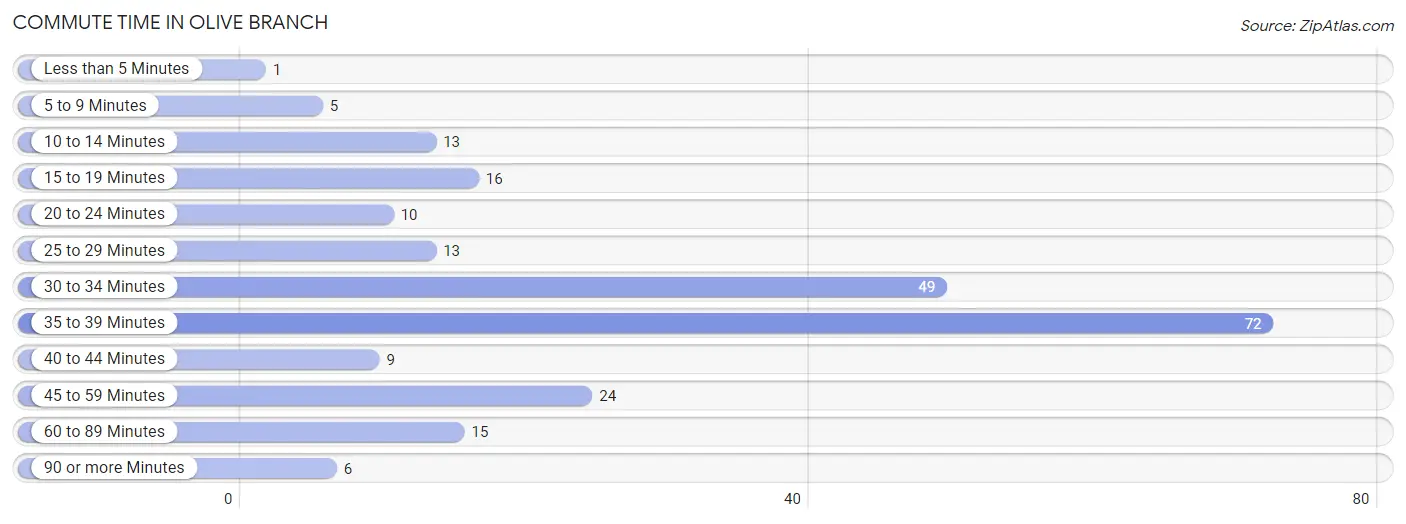
| Commute Time | # Commuters | % Commuters |
| Less than 5 Minutes | 1 | 0.4% |
| 5 to 9 Minutes | 5 | 2.1% |
| 10 to 14 Minutes | 13 | 5.6% |
| 15 to 19 Minutes | 16 | 6.9% |
| 20 to 24 Minutes | 10 | 4.3% |
| 25 to 29 Minutes | 13 | 5.6% |
| 30 to 34 Minutes | 49 | 21.0% |
| 35 to 39 Minutes | 72 | 30.9% |
| 40 to 44 Minutes | 9 | 3.9% |
| 45 to 59 Minutes | 24 | 10.3% |
| 60 to 89 Minutes | 15 | 6.4% |
| 90 or more Minutes | 6 | 2.6% |
Commute Time by Sex in Olive Branch
The most common commute times in Olive Branch are 35 to 39 minutes (72 commuters, 42.1%) for males and 30 to 34 minutes (20 commuters, 32.3%) for females.
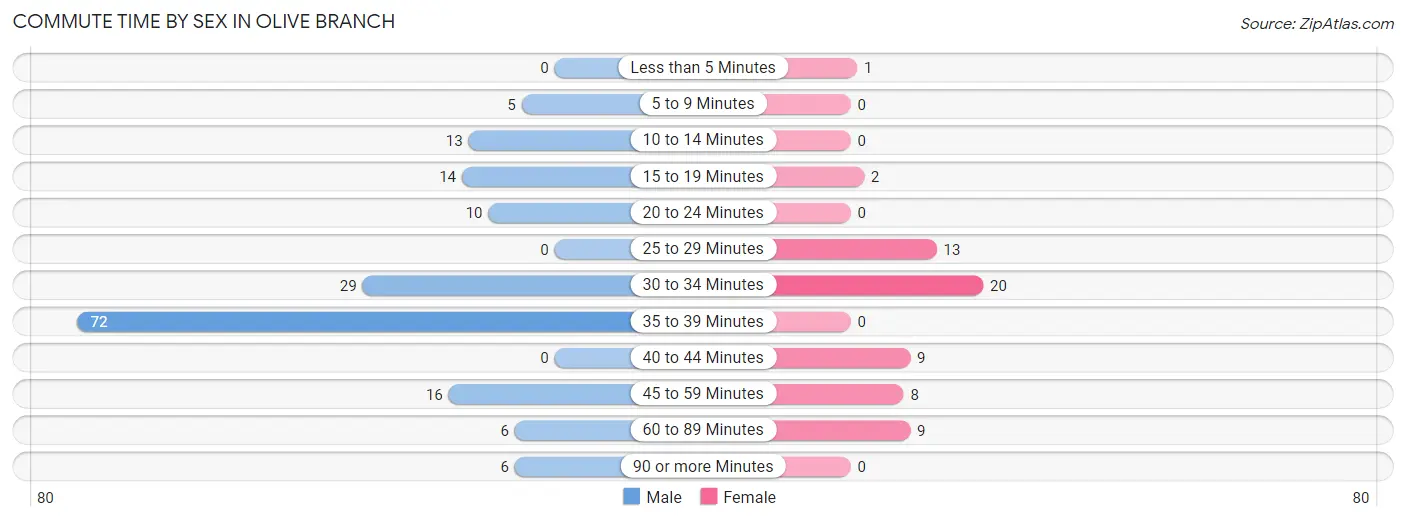
| Commute Time | Male | Female |
| Less than 5 Minutes | 0 (0.0%) | 1 (1.6%) |
| 5 to 9 Minutes | 5 (2.9%) | 0 (0.0%) |
| 10 to 14 Minutes | 13 (7.6%) | 0 (0.0%) |
| 15 to 19 Minutes | 14 (8.2%) | 2 (3.2%) |
| 20 to 24 Minutes | 10 (5.9%) | 0 (0.0%) |
| 25 to 29 Minutes | 0 (0.0%) | 13 (21.0%) |
| 30 to 34 Minutes | 29 (17.0%) | 20 (32.3%) |
| 35 to 39 Minutes | 72 (42.1%) | 0 (0.0%) |
| 40 to 44 Minutes | 0 (0.0%) | 9 (14.5%) |
| 45 to 59 Minutes | 16 (9.4%) | 8 (12.9%) |
| 60 to 89 Minutes | 6 (3.5%) | 9 (14.5%) |
| 90 or more Minutes | 6 (3.5%) | 0 (0.0%) |
Time of Departure to Work by Sex in Olive Branch
The most frequent times of departure to work in Olive Branch are 8:00 AM to 8:29 AM (114, 66.7%) for males and 8:30 AM to 8:59 AM (12, 19.4%) for females.
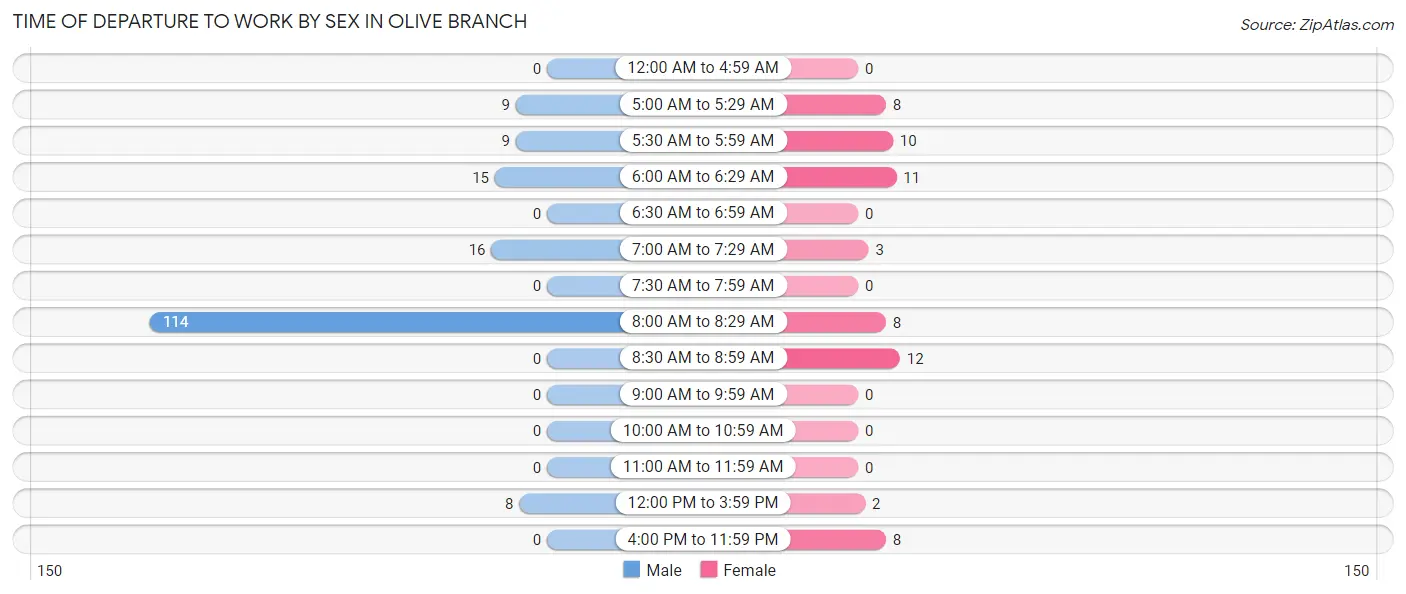
| Time of Departure | Male | Female |
| 12:00 AM to 4:59 AM | 0 (0.0%) | 0 (0.0%) |
| 5:00 AM to 5:29 AM | 9 (5.3%) | 8 (12.9%) |
| 5:30 AM to 5:59 AM | 9 (5.3%) | 10 (16.1%) |
| 6:00 AM to 6:29 AM | 15 (8.8%) | 11 (17.7%) |
| 6:30 AM to 6:59 AM | 0 (0.0%) | 0 (0.0%) |
| 7:00 AM to 7:29 AM | 16 (9.4%) | 3 (4.8%) |
| 7:30 AM to 7:59 AM | 0 (0.0%) | 0 (0.0%) |
| 8:00 AM to 8:29 AM | 114 (66.7%) | 8 (12.9%) |
| 8:30 AM to 8:59 AM | 0 (0.0%) | 12 (19.4%) |
| 9:00 AM to 9:59 AM | 0 (0.0%) | 0 (0.0%) |
| 10:00 AM to 10:59 AM | 0 (0.0%) | 0 (0.0%) |
| 11:00 AM to 11:59 AM | 0 (0.0%) | 0 (0.0%) |
| 12:00 PM to 3:59 PM | 8 (4.7%) | 2 (3.2%) |
| 4:00 PM to 11:59 PM | 0 (0.0%) | 8 (12.9%) |
| Total | 171 (100.0%) | 62 (100.0%) |
Housing Occupancy in Olive Branch
Occupancy by Ownership in Olive Branch
Of the total 200 dwellings in Olive Branch, owner-occupied units account for 178 (89.0%), while renter-occupied units make up 22 (11.0%).
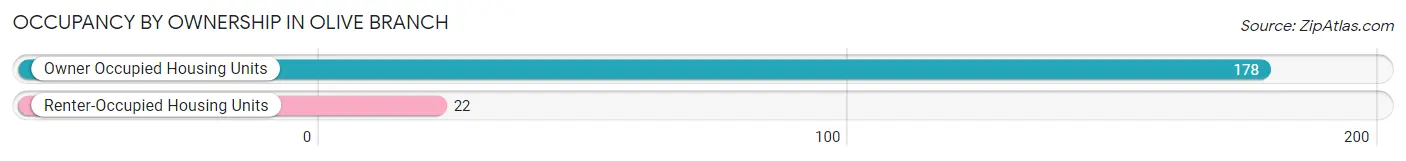
| Occupancy | # Housing Units | % Housing Units |
| Owner Occupied Housing Units | 178 | 89.0% |
| Renter-Occupied Housing Units | 22 | 11.0% |
| Total Occupied Housing Units | 200 | 100.0% |
Occupancy by Household Size in Olive Branch
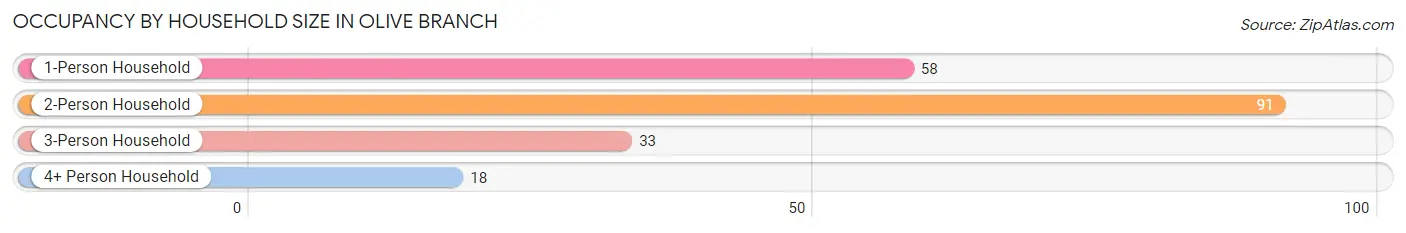
| Household Size | # Housing Units | % Housing Units |
| 1-Person Household | 58 | 29.0% |
| 2-Person Household | 91 | 45.5% |
| 3-Person Household | 33 | 16.5% |
| 4+ Person Household | 18 | 9.0% |
| Total Housing Units | 200 | 100.0% |
Occupancy by Ownership by Household Size in Olive Branch
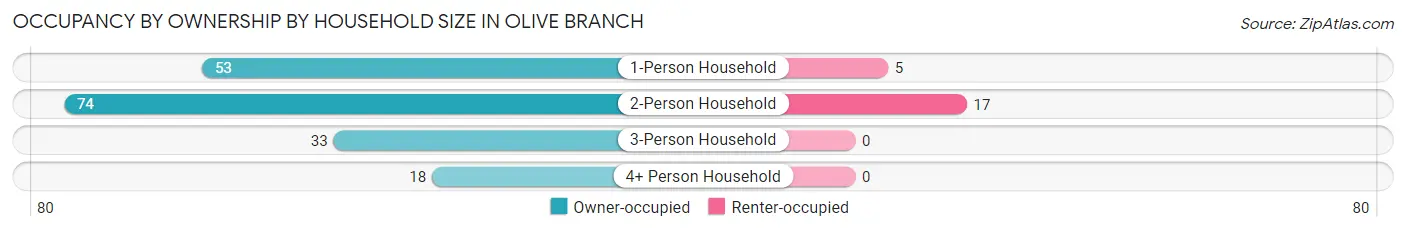
| Household Size | Owner-occupied | Renter-occupied |
| 1-Person Household | 53 (91.4%) | 5 (8.6%) |
| 2-Person Household | 74 (81.3%) | 17 (18.7%) |
| 3-Person Household | 33 (100.0%) | 0 (0.0%) |
| 4+ Person Household | 18 (100.0%) | 0 (0.0%) |
| Total Housing Units | 178 (89.0%) | 22 (11.0%) |
Occupancy by Educational Attainment in Olive Branch
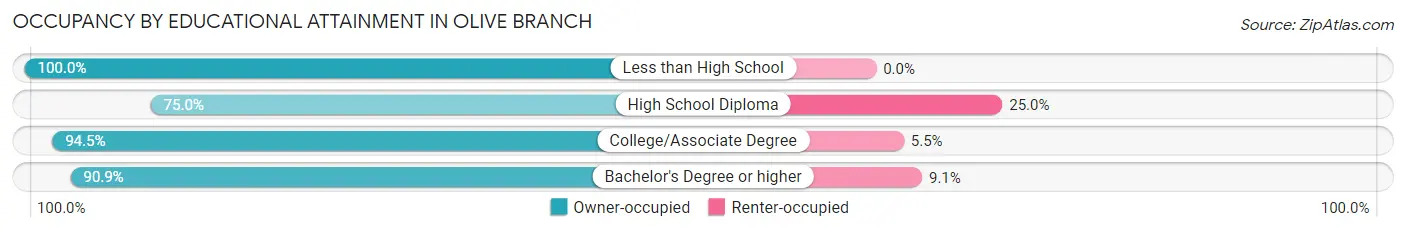
| Household Size | Owner-occupied | Renter-occupied |
| Less than High School | 34 (100.0%) | 0 (0.0%) |
| High School Diploma | 48 (75.0%) | 16 (25.0%) |
| College/Associate Degree | 86 (94.5%) | 5 (5.5%) |
| Bachelor's Degree or higher | 10 (90.9%) | 1 (9.1%) |
Occupancy by Age of Householder in Olive Branch
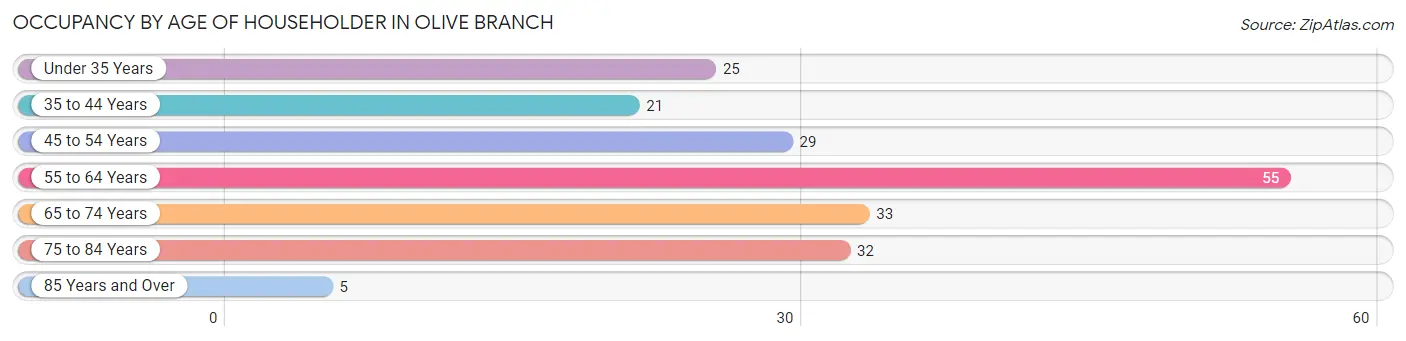
| Age Bracket | # Households | % Households |
| Under 35 Years | 25 | 12.5% |
| 35 to 44 Years | 21 | 10.5% |
| 45 to 54 Years | 29 | 14.5% |
| 55 to 64 Years | 55 | 27.5% |
| 65 to 74 Years | 33 | 16.5% |
| 75 to 84 Years | 32 | 16.0% |
| 85 Years and Over | 5 | 2.5% |
| Total | 200 | 100.0% |
Housing Finances in Olive Branch
Median Income by Occupancy in Olive Branch
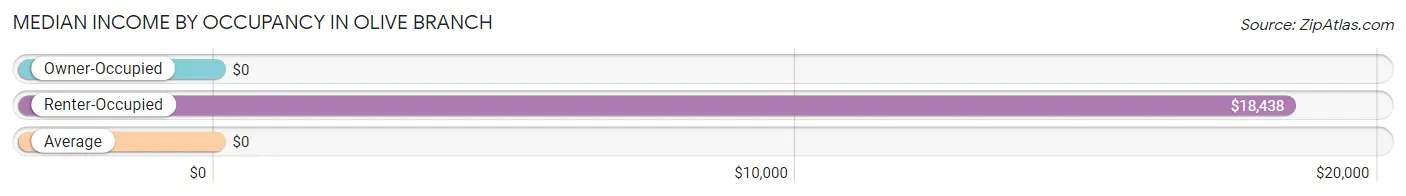
| Occupancy Type | # Households | Median Income |
| Owner-Occupied | 178 (89.0%) | $0 |
| Renter-Occupied | 22 (11.0%) | $18,438 |
| Average | 200 (100.0%) | $0 |
Occupancy by Householder Income Bracket in Olive Branch
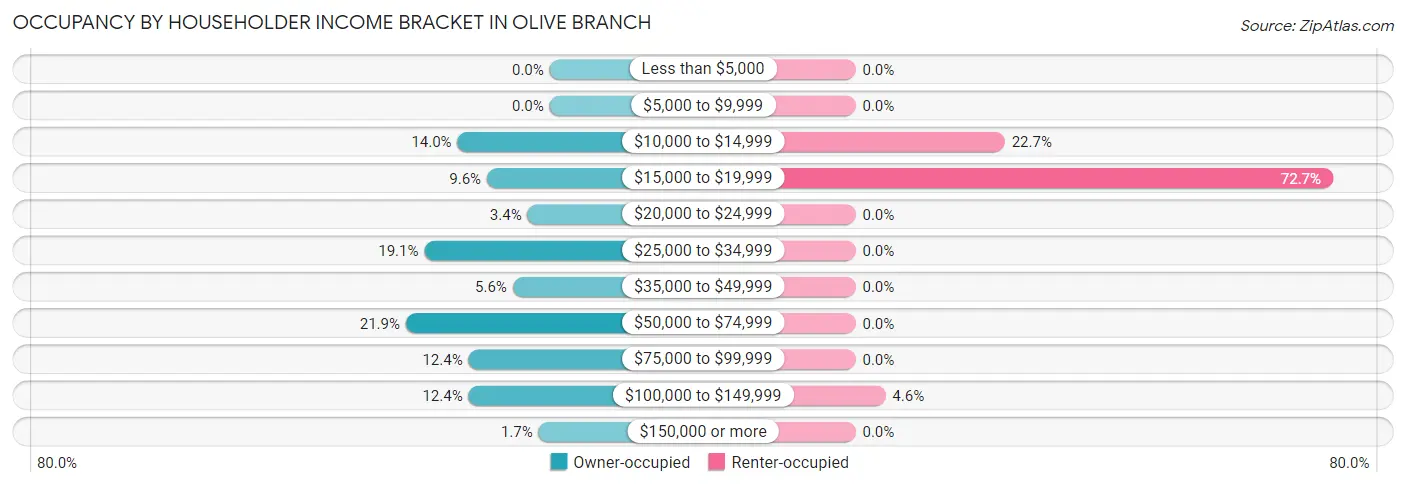
| Income Bracket | Owner-occupied | Renter-occupied |
| Less than $5,000 | 0 (0.0%) | 0 (0.0%) |
| $5,000 to $9,999 | 0 (0.0%) | 0 (0.0%) |
| $10,000 to $14,999 | 25 (14.0%) | 5 (22.7%) |
| $15,000 to $19,999 | 17 (9.6%) | 16 (72.7%) |
| $20,000 to $24,999 | 6 (3.4%) | 0 (0.0%) |
| $25,000 to $34,999 | 34 (19.1%) | 0 (0.0%) |
| $35,000 to $49,999 | 10 (5.6%) | 0 (0.0%) |
| $50,000 to $74,999 | 39 (21.9%) | 0 (0.0%) |
| $75,000 to $99,999 | 22 (12.4%) | 0 (0.0%) |
| $100,000 to $149,999 | 22 (12.4%) | 1 (4.5%) |
| $150,000 or more | 3 (1.7%) | 0 (0.0%) |
| Total | 178 (100.0%) | 22 (100.0%) |
Monthly Housing Cost Tiers in Olive Branch
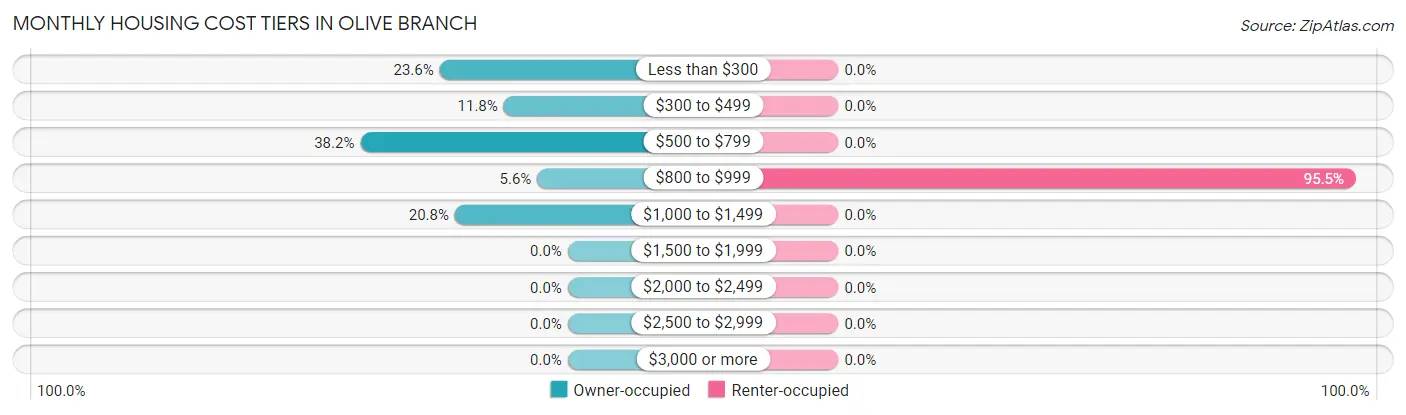
| Monthly Cost | Owner-occupied | Renter-occupied |
| Less than $300 | 42 (23.6%) | 0 (0.0%) |
| $300 to $499 | 21 (11.8%) | 0 (0.0%) |
| $500 to $799 | 68 (38.2%) | 0 (0.0%) |
| $800 to $999 | 10 (5.6%) | 21 (95.5%) |
| $1,000 to $1,499 | 37 (20.8%) | 0 (0.0%) |
| $1,500 to $1,999 | 0 (0.0%) | 0 (0.0%) |
| $2,000 to $2,499 | 0 (0.0%) | 0 (0.0%) |
| $2,500 to $2,999 | 0 (0.0%) | 0 (0.0%) |
| $3,000 or more | 0 (0.0%) | 0 (0.0%) |
| Total | 178 (100.0%) | 22 (100.0%) |
Physical Housing Characteristics in Olive Branch
Housing Structures in Olive Branch
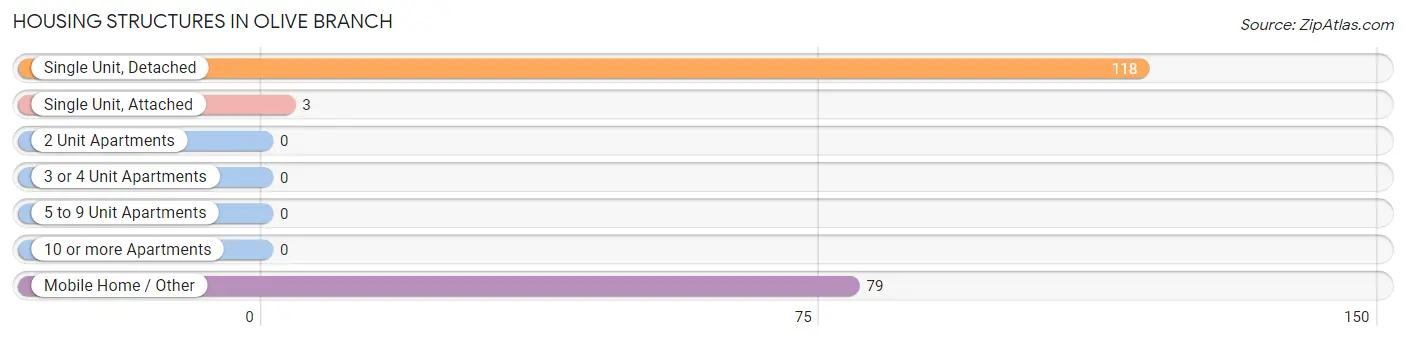
| Structure Type | # Housing Units | % Housing Units |
| Single Unit, Detached | 118 | 59.0% |
| Single Unit, Attached | 3 | 1.5% |
| 2 Unit Apartments | 0 | 0.0% |
| 3 or 4 Unit Apartments | 0 | 0.0% |
| 5 to 9 Unit Apartments | 0 | 0.0% |
| 10 or more Apartments | 0 | 0.0% |
| Mobile Home / Other | 79 | 39.5% |
| Total | 200 | 100.0% |
Housing Structures by Occupancy in Olive Branch
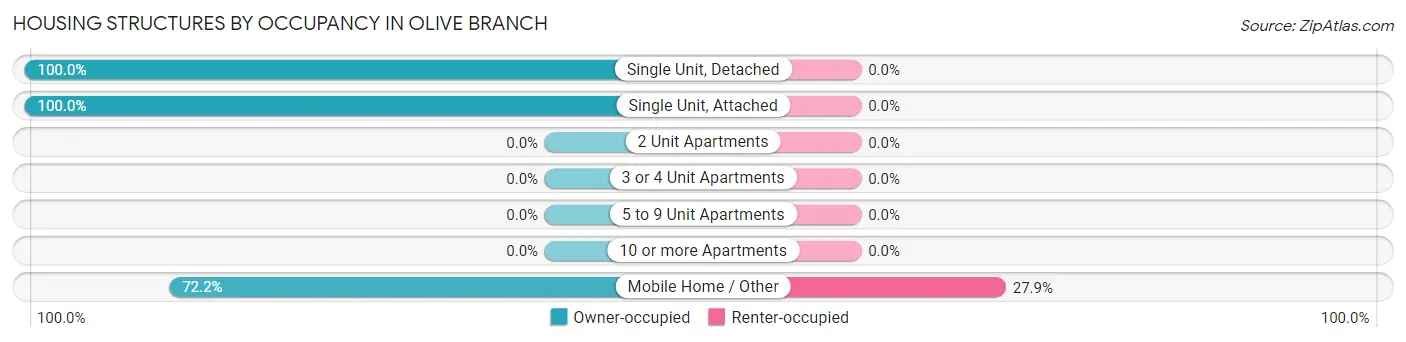
| Structure Type | Owner-occupied | Renter-occupied |
| Single Unit, Detached | 118 (100.0%) | 0 (0.0%) |
| Single Unit, Attached | 3 (100.0%) | 0 (0.0%) |
| 2 Unit Apartments | 0 (0.0%) | 0 (0.0%) |
| 3 or 4 Unit Apartments | 0 (0.0%) | 0 (0.0%) |
| 5 to 9 Unit Apartments | 0 (0.0%) | 0 (0.0%) |
| 10 or more Apartments | 0 (0.0%) | 0 (0.0%) |
| Mobile Home / Other | 57 (72.2%) | 22 (27.9%) |
| Total | 178 (89.0%) | 22 (11.0%) |
Housing Structures by Number of Rooms in Olive Branch
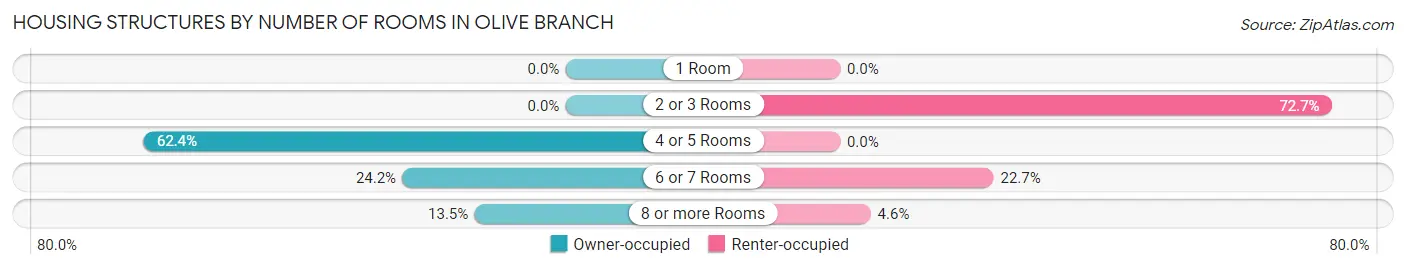
| Number of Rooms | Owner-occupied | Renter-occupied |
| 1 Room | 0 (0.0%) | 0 (0.0%) |
| 2 or 3 Rooms | 0 (0.0%) | 16 (72.7%) |
| 4 or 5 Rooms | 111 (62.4%) | 0 (0.0%) |
| 6 or 7 Rooms | 43 (24.2%) | 5 (22.7%) |
| 8 or more Rooms | 24 (13.5%) | 1 (4.5%) |
| Total | 178 (100.0%) | 22 (100.0%) |
Housing Structure by Heating Type in Olive Branch
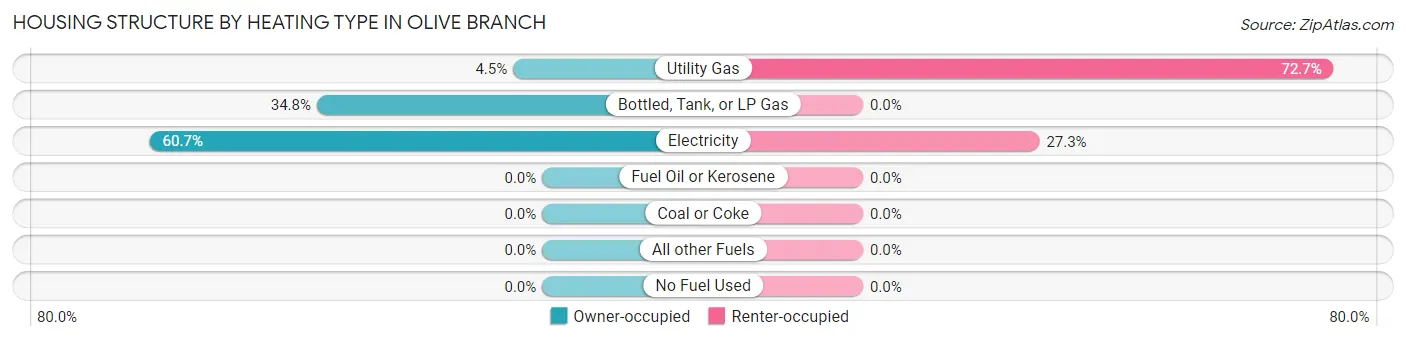
| Heating Type | Owner-occupied | Renter-occupied |
| Utility Gas | 8 (4.5%) | 16 (72.7%) |
| Bottled, Tank, or LP Gas | 62 (34.8%) | 0 (0.0%) |
| Electricity | 108 (60.7%) | 6 (27.3%) |
| Fuel Oil or Kerosene | 0 (0.0%) | 0 (0.0%) |
| Coal or Coke | 0 (0.0%) | 0 (0.0%) |
| All other Fuels | 0 (0.0%) | 0 (0.0%) |
| No Fuel Used | 0 (0.0%) | 0 (0.0%) |
| Total | 178 (100.0%) | 22 (100.0%) |
Household Vehicle Usage in Olive Branch
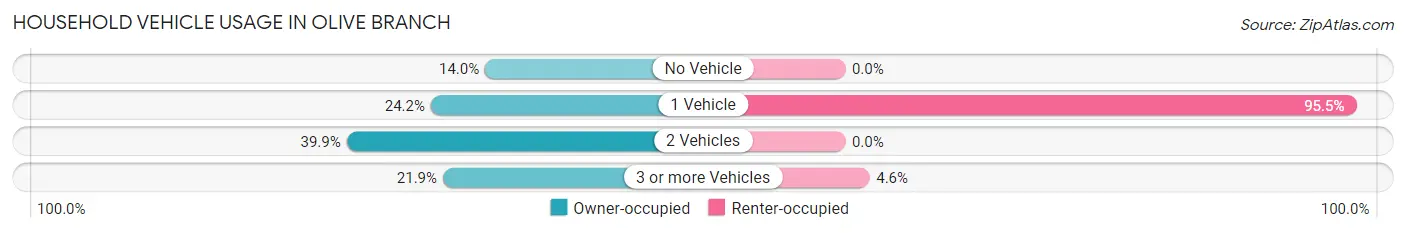
| Vehicles per Household | Owner-occupied | Renter-occupied |
| No Vehicle | 25 (14.0%) | 0 (0.0%) |
| 1 Vehicle | 43 (24.2%) | 21 (95.5%) |
| 2 Vehicles | 71 (39.9%) | 0 (0.0%) |
| 3 or more Vehicles | 39 (21.9%) | 1 (4.5%) |
| Total | 178 (100.0%) | 22 (100.0%) |
Real Estate & Mortgages in Olive Branch
Real Estate and Mortgage Overview in Olive Branch
| Characteristic | Without Mortgage | With Mortgage |
| Housing Units | 135 | 43 |
| Median Property Value | $50,400 | $92,800 |
| Median Household Income | $33,750 | $0 |
| Monthly Housing Costs | $659 | $0 |
| Real Estate Taxes | - | - |
Property Value by Mortgage Status in Olive Branch
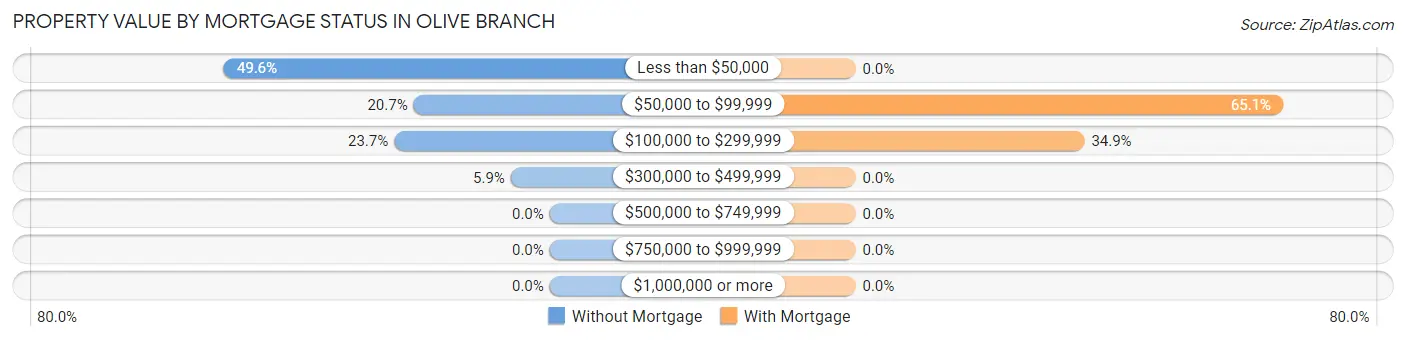
| Property Value | Without Mortgage | With Mortgage |
| Less than $50,000 | 67 (49.6%) | 0 (0.0%) |
| $50,000 to $99,999 | 28 (20.7%) | 28 (65.1%) |
| $100,000 to $299,999 | 32 (23.7%) | 15 (34.9%) |
| $300,000 to $499,999 | 8 (5.9%) | 0 (0.0%) |
| $500,000 to $749,999 | 0 (0.0%) | 0 (0.0%) |
| $750,000 to $999,999 | 0 (0.0%) | 0 (0.0%) |
| $1,000,000 or more | 0 (0.0%) | 0 (0.0%) |
| Total | 135 (100.0%) | 43 (100.0%) |
Household Income by Mortgage Status in Olive Branch
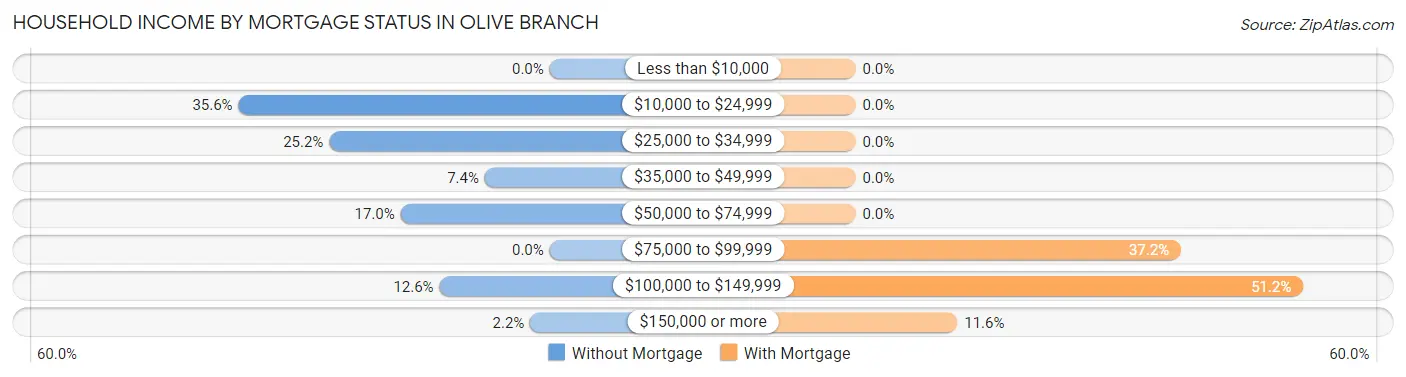
| Household Income | Without Mortgage | With Mortgage |
| Less than $10,000 | 0 (0.0%) | 0 (0.0%) |
| $10,000 to $24,999 | 48 (35.6%) | 0 (0.0%) |
| $25,000 to $34,999 | 34 (25.2%) | 0 (0.0%) |
| $35,000 to $49,999 | 10 (7.4%) | 0 (0.0%) |
| $50,000 to $74,999 | 23 (17.0%) | 0 (0.0%) |
| $75,000 to $99,999 | 0 (0.0%) | 16 (37.2%) |
| $100,000 to $149,999 | 17 (12.6%) | 22 (51.2%) |
| $150,000 or more | 3 (2.2%) | 5 (11.6%) |
| Total | 135 (100.0%) | 43 (100.0%) |
Property Value to Household Income Ratio in Olive Branch
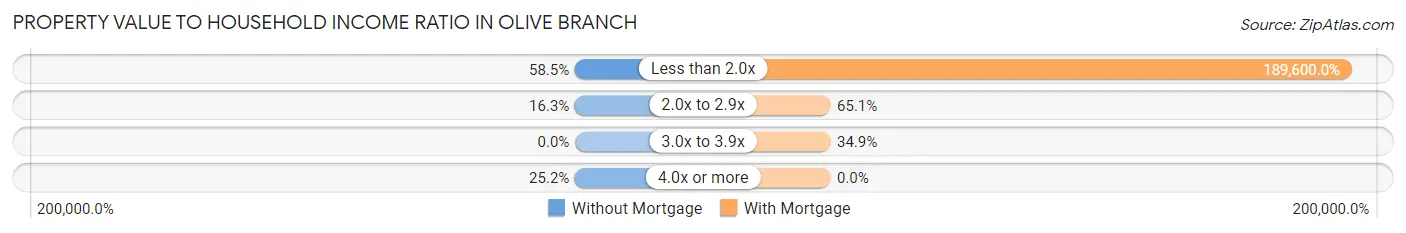
| Value-to-Income Ratio | Without Mortgage | With Mortgage |
| Less than 2.0x | 79 (58.5%) | 81,528 (189,600.0%) |
| 2.0x to 2.9x | 22 (16.3%) | 28 (65.1%) |
| 3.0x to 3.9x | 0 (0.0%) | 15 (34.9%) |
| 4.0x or more | 34 (25.2%) | 0 (0.0%) |
| Total | 135 (100.0%) | 43 (100.0%) |
Real Estate Taxes by Mortgage Status in Olive Branch
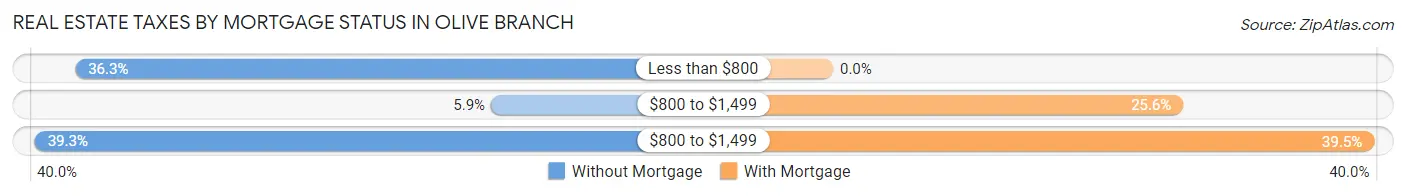
| Property Taxes | Without Mortgage | With Mortgage |
| Less than $800 | 49 (36.3%) | 0 (0.0%) |
| $800 to $1,499 | 8 (5.9%) | 11 (25.6%) |
| $800 to $1,499 | 53 (39.3%) | 17 (39.5%) |
| Total | 135 (100.0%) | 43 (100.0%) |
Health & Disability in Olive Branch
Health Insurance Coverage by Age in Olive Branch
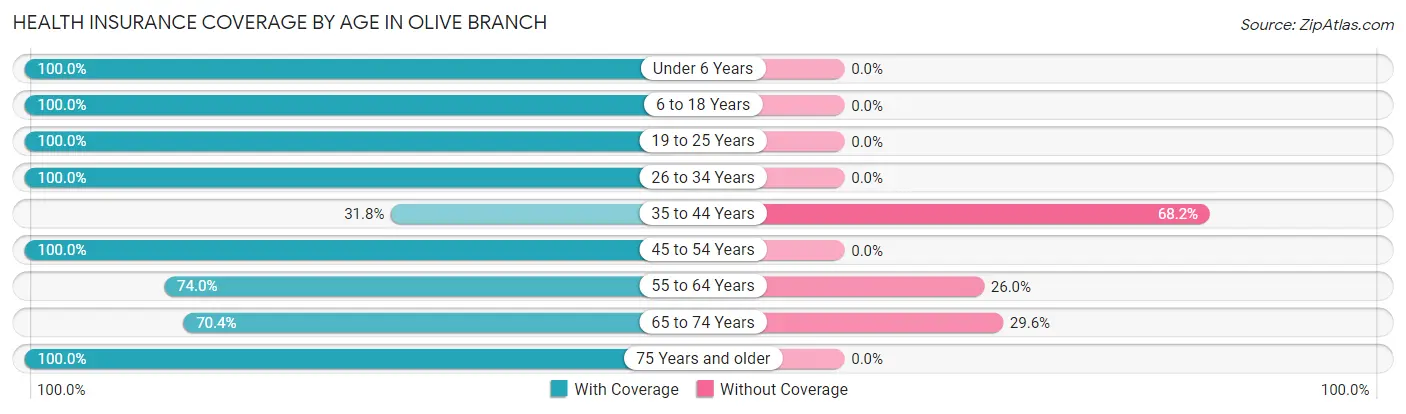
| Age Bracket | With Coverage | Without Coverage |
| Under 6 Years | 19 (100.0%) | 0 (0.0%) |
| 6 to 18 Years | 127 (100.0%) | 0 (0.0%) |
| 19 to 25 Years | 6 (100.0%) | 0 (0.0%) |
| 26 to 34 Years | 59 (100.0%) | 0 (0.0%) |
| 35 to 44 Years | 21 (31.8%) | 45 (68.2%) |
| 45 to 54 Years | 38 (100.0%) | 0 (0.0%) |
| 55 to 64 Years | 108 (74.0%) | 38 (26.0%) |
| 65 to 74 Years | 50 (70.4%) | 21 (29.6%) |
| 75 Years and older | 46 (100.0%) | 0 (0.0%) |
| Total | 474 (82.0%) | 104 (18.0%) |
Health Insurance Coverage by Citizenship Status in Olive Branch
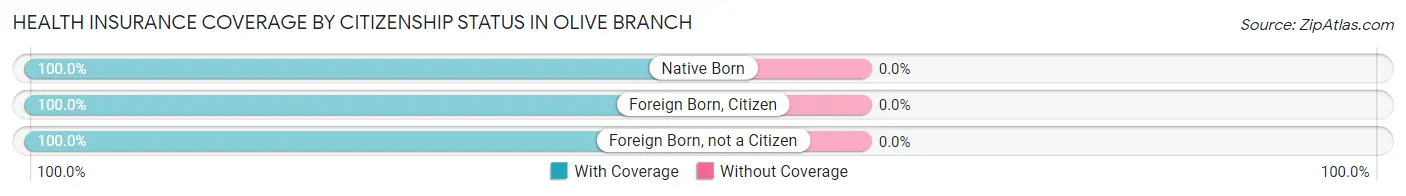
| Citizenship Status | With Coverage | Without Coverage |
| Native Born | 19 (100.0%) | 0 (0.0%) |
| Foreign Born, Citizen | 127 (100.0%) | 0 (0.0%) |
| Foreign Born, not a Citizen | 6 (100.0%) | 0 (0.0%) |
Health Insurance Coverage by Household Income in Olive Branch
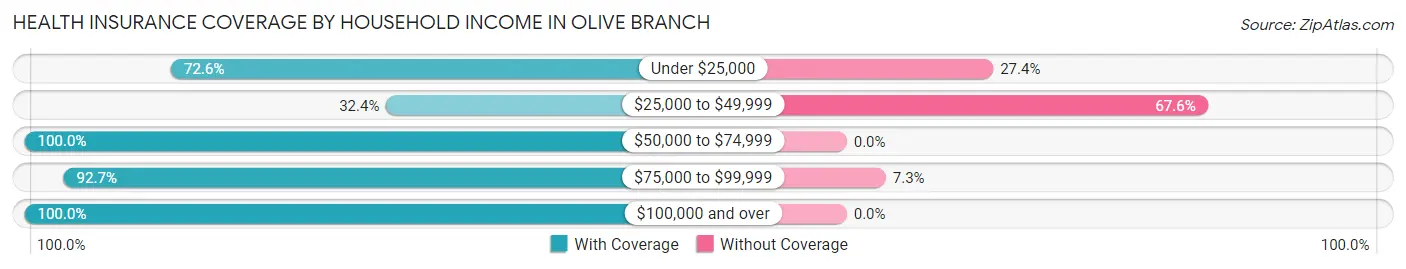
| Household Income | With Coverage | Without Coverage |
| Under $25,000 | 119 (72.6%) | 45 (27.4%) |
| $25,000 to $49,999 | 24 (32.4%) | 50 (67.6%) |
| $50,000 to $74,999 | 136 (100.0%) | 0 (0.0%) |
| $75,000 to $99,999 | 114 (92.7%) | 9 (7.3%) |
| $100,000 and over | 81 (100.0%) | 0 (0.0%) |
Public vs Private Health Insurance Coverage by Age in Olive Branch
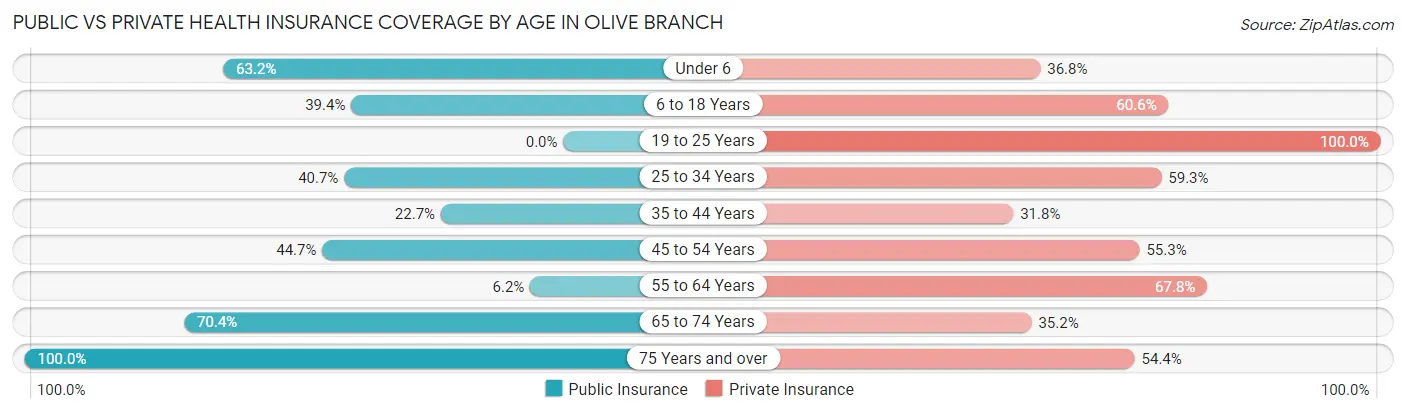
| Age Bracket | Public Insurance | Private Insurance |
| Under 6 | 12 (63.2%) | 7 (36.8%) |
| 6 to 18 Years | 50 (39.4%) | 77 (60.6%) |
| 19 to 25 Years | 0 (0.0%) | 6 (100.0%) |
| 25 to 34 Years | 24 (40.7%) | 35 (59.3%) |
| 35 to 44 Years | 15 (22.7%) | 21 (31.8%) |
| 45 to 54 Years | 17 (44.7%) | 21 (55.3%) |
| 55 to 64 Years | 9 (6.2%) | 99 (67.8%) |
| 65 to 74 Years | 50 (70.4%) | 25 (35.2%) |
| 75 Years and over | 46 (100.0%) | 25 (54.3%) |
| Total | 223 (38.6%) | 316 (54.7%) |
Disability Status by Sex by Age in Olive Branch
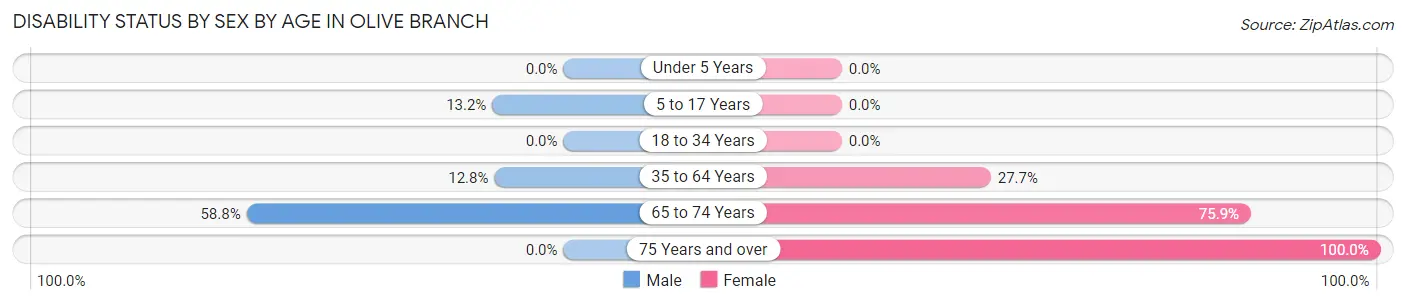
| Age Bracket | Male | Female |
| Under 5 Years | 0 (0.0%) | 0 (0.0%) |
| 5 to 17 Years | 7 (13.2%) | 0 (0.0%) |
| 18 to 34 Years | 0 (0.0%) | 0 (0.0%) |
| 35 to 64 Years | 20 (12.8%) | 26 (27.7%) |
| 65 to 74 Years | 10 (58.8%) | 41 (75.9%) |
| 75 Years and over | 0 (0.0%) | 25 (100.0%) |
Disability Class by Sex by Age in Olive Branch
Disability Class: Hearing Difficulty
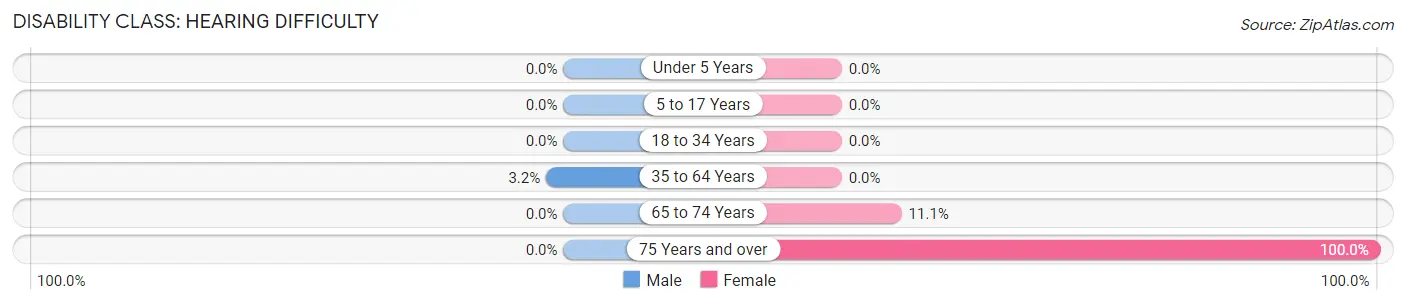
| Age Bracket | Male | Female |
| Under 5 Years | 0 (0.0%) | 0 (0.0%) |
| 5 to 17 Years | 0 (0.0%) | 0 (0.0%) |
| 18 to 34 Years | 0 (0.0%) | 0 (0.0%) |
| 35 to 64 Years | 5 (3.2%) | 0 (0.0%) |
| 65 to 74 Years | 0 (0.0%) | 6 (11.1%) |
| 75 Years and over | 0 (0.0%) | 25 (100.0%) |
Disability Class: Vision Difficulty
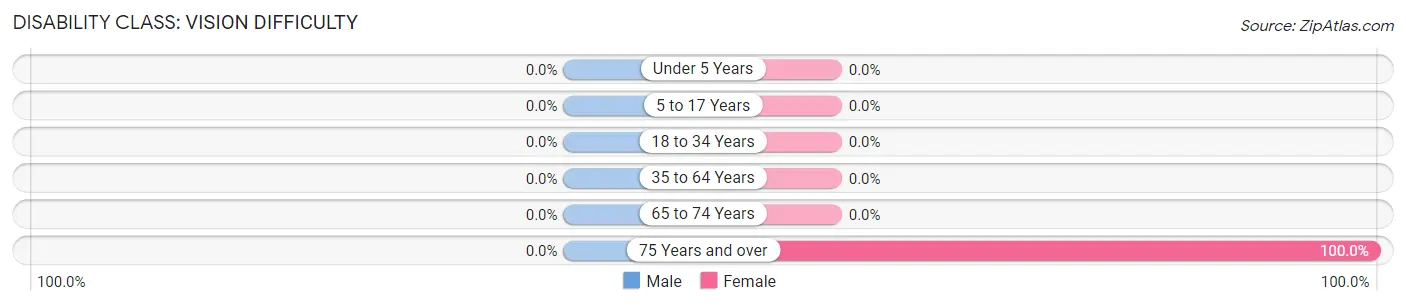
| Age Bracket | Male | Female |
| Under 5 Years | 0 (0.0%) | 0 (0.0%) |
| 5 to 17 Years | 0 (0.0%) | 0 (0.0%) |
| 18 to 34 Years | 0 (0.0%) | 0 (0.0%) |
| 35 to 64 Years | 0 (0.0%) | 0 (0.0%) |
| 65 to 74 Years | 0 (0.0%) | 0 (0.0%) |
| 75 Years and over | 0 (0.0%) | 25 (100.0%) |
Disability Class: Cognitive Difficulty
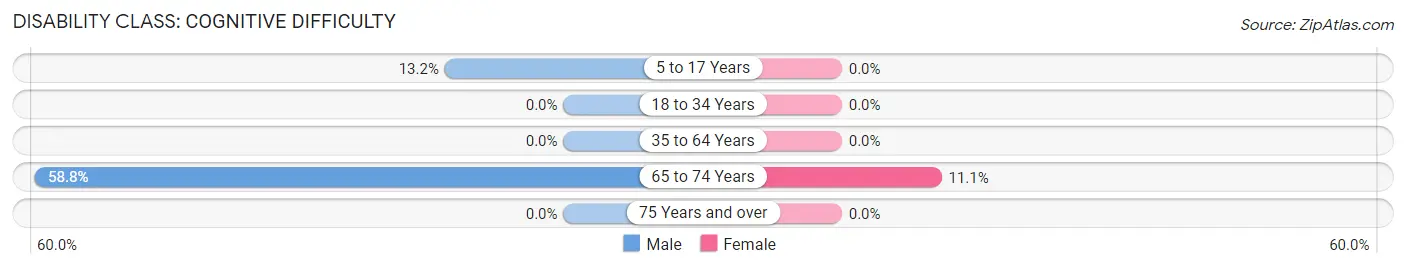
| Age Bracket | Male | Female |
| 5 to 17 Years | 7 (13.2%) | 0 (0.0%) |
| 18 to 34 Years | 0 (0.0%) | 0 (0.0%) |
| 35 to 64 Years | 0 (0.0%) | 0 (0.0%) |
| 65 to 74 Years | 10 (58.8%) | 6 (11.1%) |
| 75 Years and over | 0 (0.0%) | 0 (0.0%) |
Disability Class: Ambulatory Difficulty
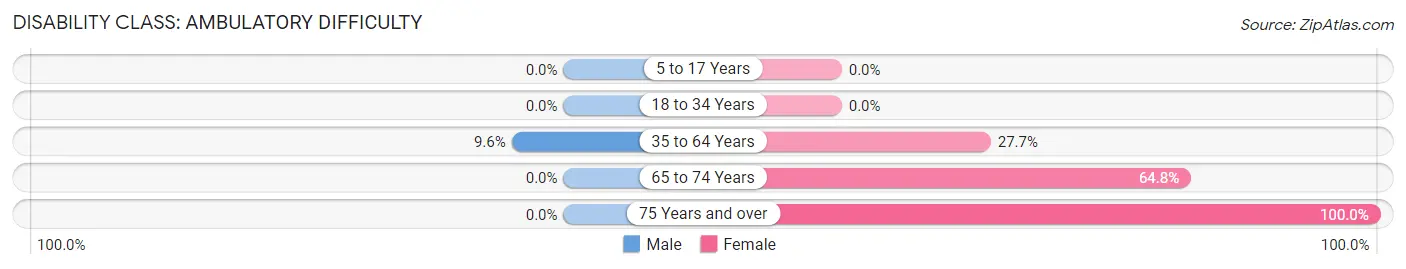
| Age Bracket | Male | Female |
| 5 to 17 Years | 0 (0.0%) | 0 (0.0%) |
| 18 to 34 Years | 0 (0.0%) | 0 (0.0%) |
| 35 to 64 Years | 15 (9.6%) | 26 (27.7%) |
| 65 to 74 Years | 0 (0.0%) | 35 (64.8%) |
| 75 Years and over | 0 (0.0%) | 25 (100.0%) |
Disability Class: Self-Care Difficulty
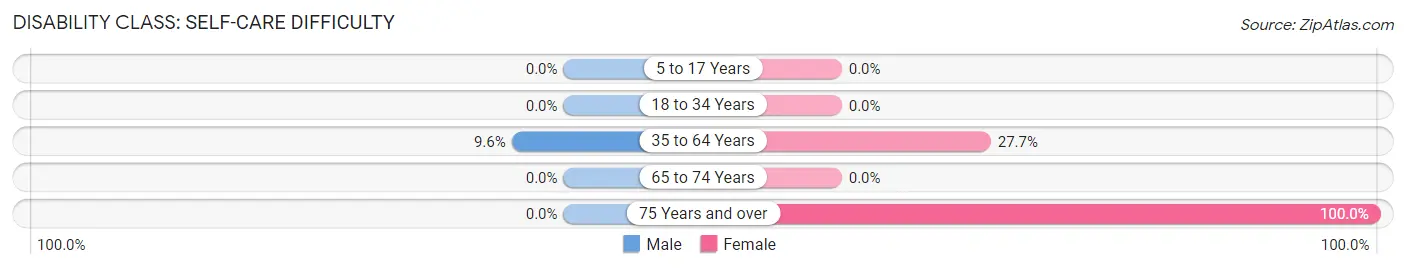
| Age Bracket | Male | Female |
| 5 to 17 Years | 0 (0.0%) | 0 (0.0%) |
| 18 to 34 Years | 0 (0.0%) | 0 (0.0%) |
| 35 to 64 Years | 15 (9.6%) | 26 (27.7%) |
| 65 to 74 Years | 0 (0.0%) | 0 (0.0%) |
| 75 Years and over | 0 (0.0%) | 25 (100.0%) |
Technology Access in Olive Branch
Computing Device Access in Olive Branch
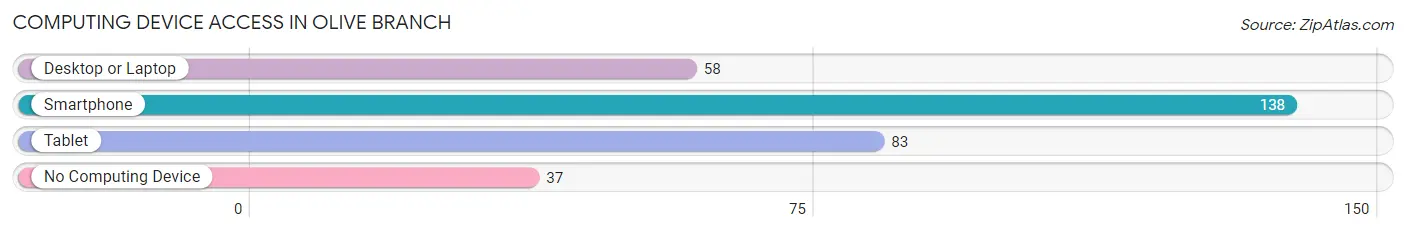
| Device Type | # Households | % Households |
| Desktop or Laptop | 58 | 29.0% |
| Smartphone | 138 | 69.0% |
| Tablet | 83 | 41.5% |
| No Computing Device | 37 | 18.5% |
| Total | 200 | 100.0% |
Internet Access in Olive Branch
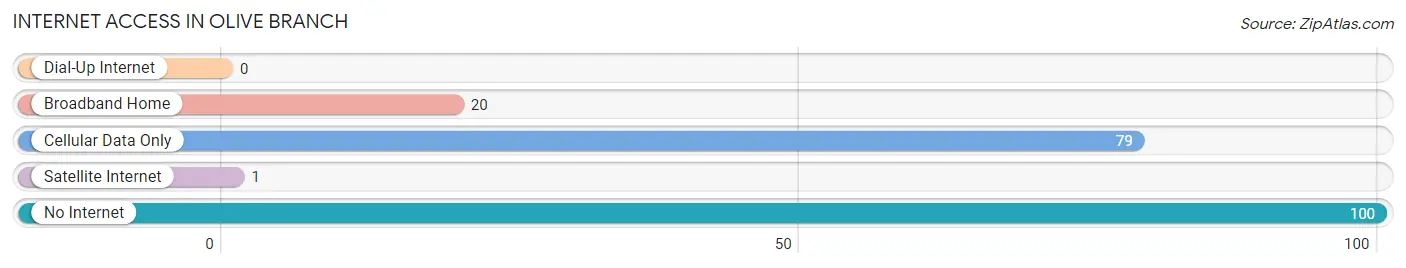
| Internet Type | # Households | % Households |
| Dial-Up Internet | 0 | 0.0% |
| Broadband Home | 20 | 10.0% |
| Cellular Data Only | 79 | 39.5% |
| Satellite Internet | 1 | 0.5% |
| No Internet | 100 | 50.0% |
| Total | 200 | 100.0% |
Olive Branch Summary
Olive Branch is a small village located in the southern part of Illinois, in the United States. It is situated in the county of Williamson, and is part of the Marion-Carbondale Metropolitan Statistical Area. The village has a population of around 1,000 people, and is located about 25 miles south of Carbondale.
History
Olive Branch was founded in 1854 by a group of settlers from the nearby town of Marion. The settlers were looking for a place to settle and farm, and chose the area due to its fertile soil and abundant water supply. The village was named after the olive tree, which was a symbol of peace and prosperity.
The village grew slowly over the years, and by the early 1900s, it had become a thriving agricultural community. The village was home to several businesses, including a general store, a blacksmith shop, and a post office. The village also had a school, which was attended by the children of the local farmers.
In the late 1950s, the village began to experience a period of growth and development. The population increased, and new businesses began to open. The village also saw the construction of a new school, which was built to accommodate the growing population.
Geography
Olive Branch is located in the southern part of Illinois, in the county of Williamson. It is situated in the Marion-Carbondale Metropolitan Statistical Area. The village is located about 25 miles south of Carbondale, and is bordered by the towns of Marion, Herrin, and Johnston City.
The village is situated on the banks of the Big Muddy River, which flows through the area. The village is surrounded by rolling hills and farmland, and is home to several small lakes and ponds. The climate in the area is generally mild, with hot summers and cold winters.
Economy
The economy of Olive Branch is largely based on agriculture. The village is home to several farms, which produce a variety of crops, including corn, soybeans, and wheat. The village also has several small businesses, including a general store, a blacksmith shop, and a post office.
The village is also home to several manufacturing companies, which produce a variety of products, including furniture, clothing, and automotive parts. The village is also home to several restaurants, which serve a variety of local and international cuisine.
Demographics
As of the 2010 census, the population of Olive Branch was 1,000 people. The village is predominantly white, with a small African American population. The median household income in the village is $37,000, and the median age is 40 years. The village has a low unemployment rate, and the majority of the population is employed in the agricultural and manufacturing industries.
Common Questions
What is Per Capita Income in Olive Branch?
Per Capita income in Olive Branch is $27,663.
What is Income or Wage Gap in Olive Branch?
Income or Wage Gap in Olive Branch is 40.9%.
Women in Olive Branch earn 59.1 cents for every dollar earned by a man.
What is Inequality or Gini Index in Olive Branch?
Inequality or Gini Index in Olive Branch is 0.41.
What is the Total Population of Olive Branch?
Total Population of Olive Branch is 578.
What is the Total Male Population of Olive Branch?
Total Male Population of Olive Branch is 299.
What is the Total Female Population of Olive Branch?
Total Female Population of Olive Branch is 279.
What is the Ratio of Males per 100 Females in Olive Branch?
There are 107.17 Males per 100 Females in Olive Branch.
What is the Ratio of Females per 100 Males in Olive Branch?
There are 93.31 Females per 100 Males in Olive Branch.
What is the Median Population Age in Olive Branch?
Median Population Age in Olive Branch is 49.2 Years.
What is the Average Family Size in Olive Branch
Average Family Size in Olive Branch is 3.7 People.
What is the Average Household Size in Olive Branch
Average Household Size in Olive Branch is 2.9 People.
How Large is the Labor Force in Olive Branch?
There are 233 People in the Labor Forcein in Olive Branch.
What is the Percentage of People in the Labor Force in Olive Branch?
53.9% of People are in the Labor Force in Olive Branch.