Gillespie, IL Map & Demographics
Gillespie Map
Gillespie Overview
$32,553
PER CAPITA INCOME
$73,092
AVG FAMILY INCOME
$60,924
AVG HOUSEHOLD INCOME
58.1%
WAGE / INCOME GAP [ % ]
41.9¢/ $1
WAGE / INCOME GAP [ $ ]
0.41
INEQUALITY / GINI INDEX
3,193
TOTAL POPULATION
1,601
MALE POPULATION
1,592
FEMALE POPULATION
100.57
MALES / 100 FEMALES
99.44
FEMALES / 100 MALES
41.8
MEDIAN AGE
3.1
AVG FAMILY SIZE
2.4
AVG HOUSEHOLD SIZE
1,515
LABOR FORCE [ PEOPLE ]
61.7%
PERCENT IN LABOR FORCE
5.1%
UNEMPLOYMENT RATE
Gillespie Zip Codes
Income in Gillespie
Income Overview in Gillespie
Per Capita Income in Gillespie is $32,553, while median incomes of families and households are $73,092 and $60,924 respectively.
| Characteristic | Number | Measure |
| Per Capita Income | 3,193 | $32,553 |
| Median Family Income | 788 | $73,092 |
| Mean Family Income | 788 | $78,560 |
| Median Household Income | 1,321 | $60,924 |
| Mean Household Income | 1,321 | $72,957 |
| Income Deficit | 788 | $0 |
| Wage / Income Gap (%) | 3,193 | 58.11% |
| Wage / Income Gap ($) | 3,193 | 41.89¢ per $1 |
| Gini / Inequality Index | 3,193 | 0.41 |
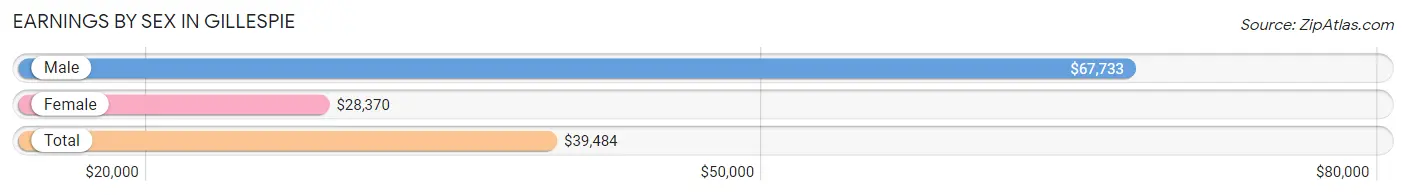
Earnings by Sex in Gillespie
Average Earnings in Gillespie are $39,484, $67,733 for men and $28,370 for women, a difference of 58.1%.
| Sex | Number | Average Earnings |
| Male | 834 (52.3%) | $67,733 |
| Female | 760 (47.7%) | $28,370 |
| Total | 1,594 (100.0%) | $39,484 |
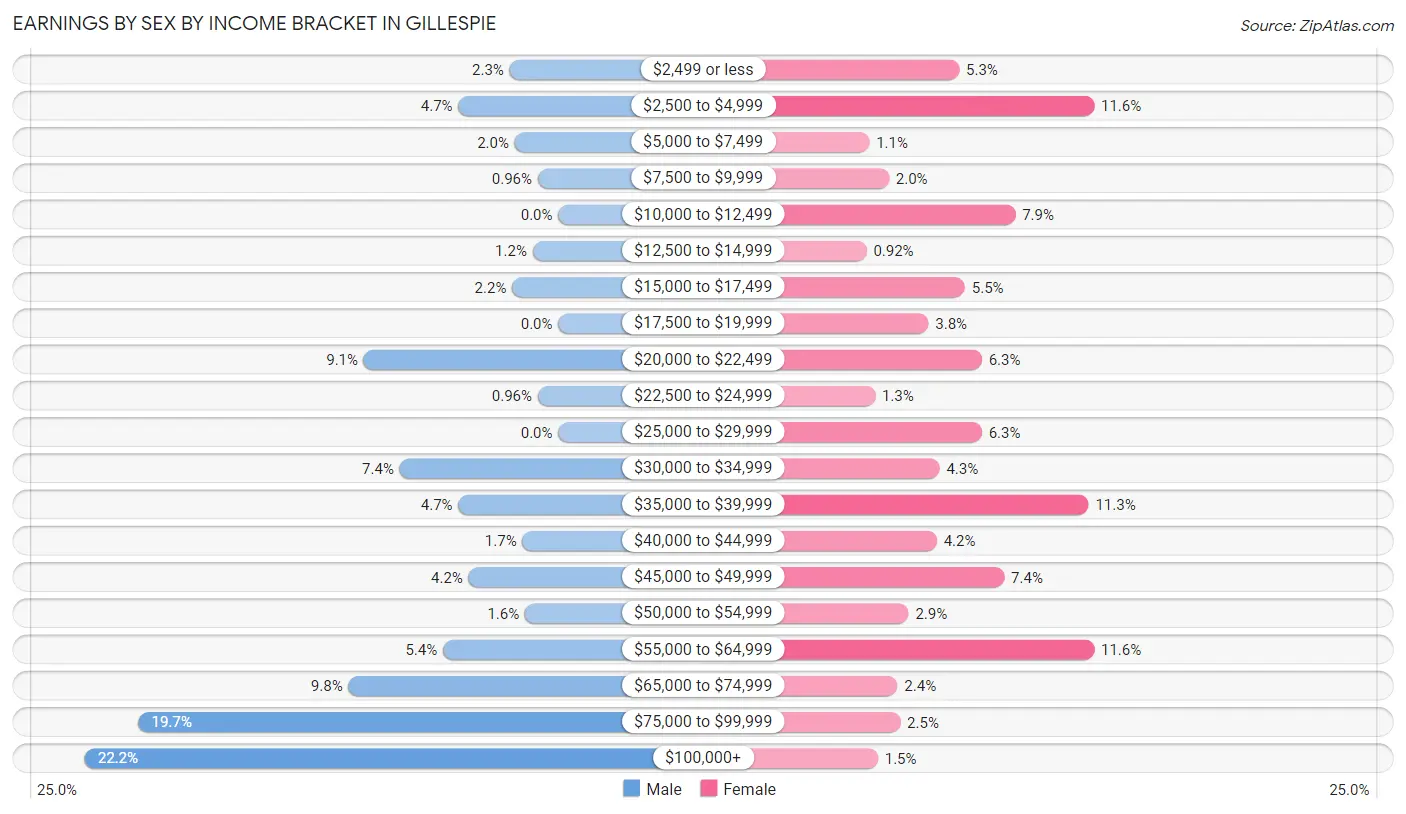
Earnings by Sex by Income Bracket in Gillespie
The most common earnings brackets in Gillespie are $100,000+ for men (185 | 22.2%) and $2,500 to $4,999 for women (88 | 11.6%).
| Income | Male | Female |
| $2,499 or less | 19 (2.3%) | 40 (5.3%) |
| $2,500 to $4,999 | 39 (4.7%) | 88 (11.6%) |
| $5,000 to $7,499 | 17 (2.0%) | 8 (1.1%) |
| $7,500 to $9,999 | 8 (1.0%) | 15 (2.0%) |
| $10,000 to $12,499 | 0 (0.0%) | 60 (7.9%) |
| $12,500 to $14,999 | 10 (1.2%) | 7 (0.9%) |
| $15,000 to $17,499 | 18 (2.2%) | 42 (5.5%) |
| $17,500 to $19,999 | 0 (0.0%) | 29 (3.8%) |
| $20,000 to $22,499 | 76 (9.1%) | 48 (6.3%) |
| $22,500 to $24,999 | 8 (1.0%) | 10 (1.3%) |
| $25,000 to $29,999 | 0 (0.0%) | 48 (6.3%) |
| $30,000 to $34,999 | 62 (7.4%) | 33 (4.3%) |
| $35,000 to $39,999 | 39 (4.7%) | 86 (11.3%) |
| $40,000 to $44,999 | 14 (1.7%) | 32 (4.2%) |
| $45,000 to $49,999 | 35 (4.2%) | 56 (7.4%) |
| $50,000 to $54,999 | 13 (1.6%) | 22 (2.9%) |
| $55,000 to $64,999 | 45 (5.4%) | 88 (11.6%) |
| $65,000 to $74,999 | 82 (9.8%) | 18 (2.4%) |
| $75,000 to $99,999 | 164 (19.7%) | 19 (2.5%) |
| $100,000+ | 185 (22.2%) | 11 (1.5%) |
| Total | 834 (100.0%) | 760 (100.0%) |
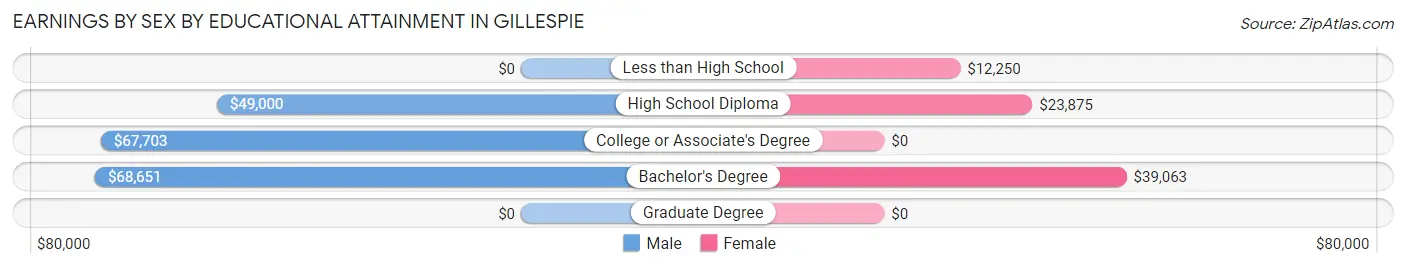
Earnings by Sex by Educational Attainment in Gillespie
Average earnings in Gillespie are $68,900 for men and $32,826 for women, a difference of 52.4%. Men with an educational attainment of bachelor's degree enjoy the highest average annual earnings of $68,651, while those with high school diploma education earn the least with $49,000. Women with an educational attainment of bachelor's degree earn the most with the average annual earnings of $39,063, while those with less than high school education have the smallest earnings of $12,250.
| Educational Attainment | Male Income | Female Income |
| Less than High School | - | - |
| High School Diploma | $49,000 | $23,875 |
| College or Associate's Degree | $67,703 | $0 |
| Bachelor's Degree | $68,651 | $39,063 |
| Graduate Degree | - | - |
| Total | $68,900 | $32,826 |
Family Income in Gillespie
Family Income Brackets in Gillespie
According to the Gillespie family income data, there are 141 families falling into the $100,000 to $149,999 income range, which is the most common income bracket and makes up 17.9% of all families. Conversely, the $10,000 to $14,999 income bracket is the least frequent group with only 10 families (1.3%) belonging to this category.
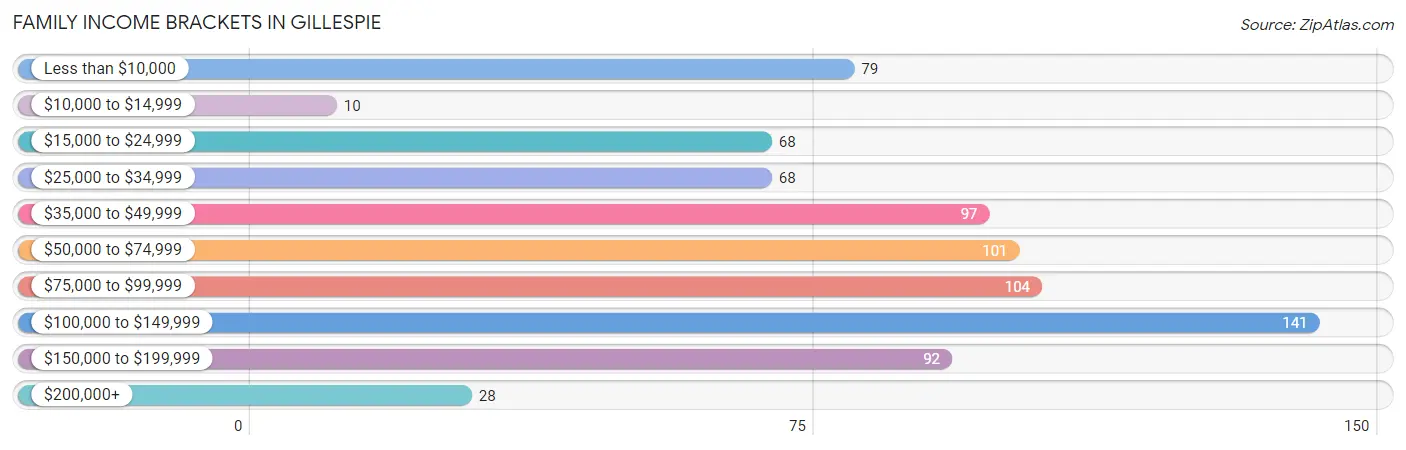
| Income Bracket | # Families | % Families |
| Less than $10,000 | 79 | 10.0% |
| $10,000 to $14,999 | 10 | 1.3% |
| $15,000 to $24,999 | 68 | 8.6% |
| $25,000 to $34,999 | 68 | 8.6% |
| $35,000 to $49,999 | 97 | 12.3% |
| $50,000 to $74,999 | 101 | 12.8% |
| $75,000 to $99,999 | 104 | 13.2% |
| $100,000 to $149,999 | 141 | 17.9% |
| $150,000 to $199,999 | 92 | 11.7% |
| $200,000+ | 28 | 3.6% |
Family Income by Famaliy Size in Gillespie
4-person families (150 | 19.0%) account for the highest median family income in Gillespie with $84,643 per family, while 2-person families (465 | 59.0%) have the highest median income of $30,244 per family member.
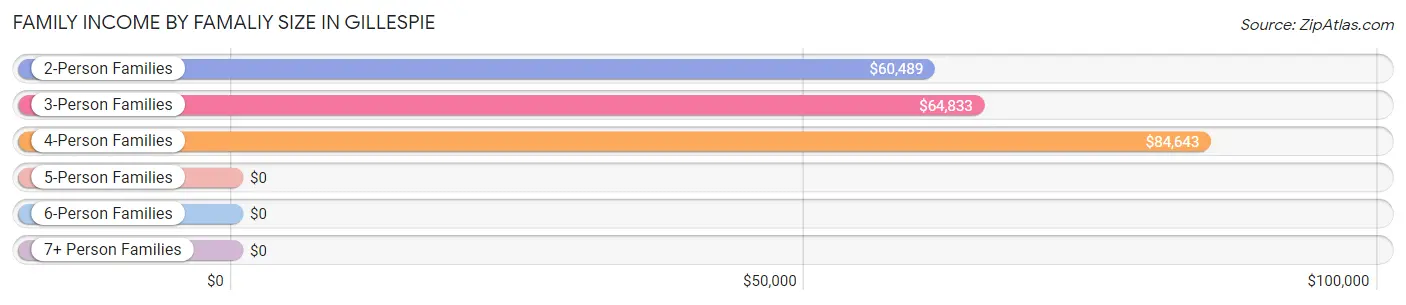
| Income Bracket | # Families | Median Income |
| 2-Person Families | 465 (59.0%) | $60,489 |
| 3-Person Families | 86 (10.9%) | $64,833 |
| 4-Person Families | 150 (19.0%) | $84,643 |
| 5-Person Families | 80 (10.2%) | $0 |
| 6-Person Families | 7 (0.9%) | $0 |
| 7+ Person Families | 0 (0.0%) | $0 |
| Total | 788 (100.0%) | $73,092 |
Family Income by Number of Earners in Gillespie
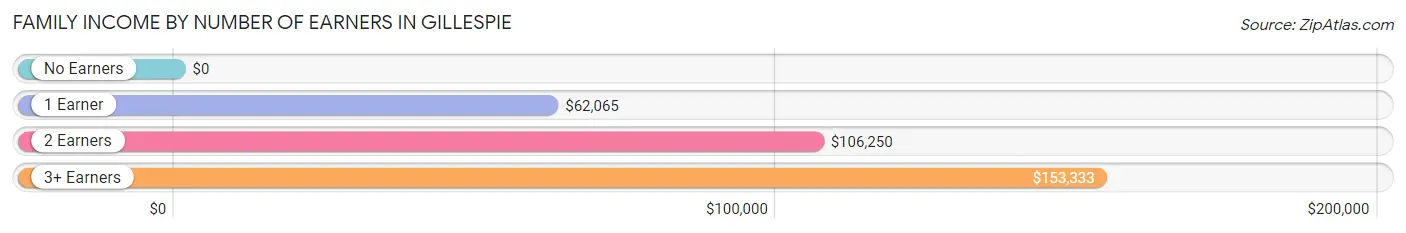
| Number of Earners | # Families | Median Income |
| No Earners | 201 (25.5%) | $0 |
| 1 Earner | 232 (29.4%) | $62,065 |
| 2 Earners | 317 (40.2%) | $106,250 |
| 3+ Earners | 38 (4.8%) | $153,333 |
| Total | 788 (100.0%) | $73,092 |
Household Income in Gillespie
Household Income Brackets in Gillespie
With 266 households falling in the category, the $100,000 to $149,999 income range is the most frequent in Gillespie, accounting for 20.1% of all households. In contrast, only 40 households (3.0%) fall into the $200,000+ income bracket, making it the least populous group.
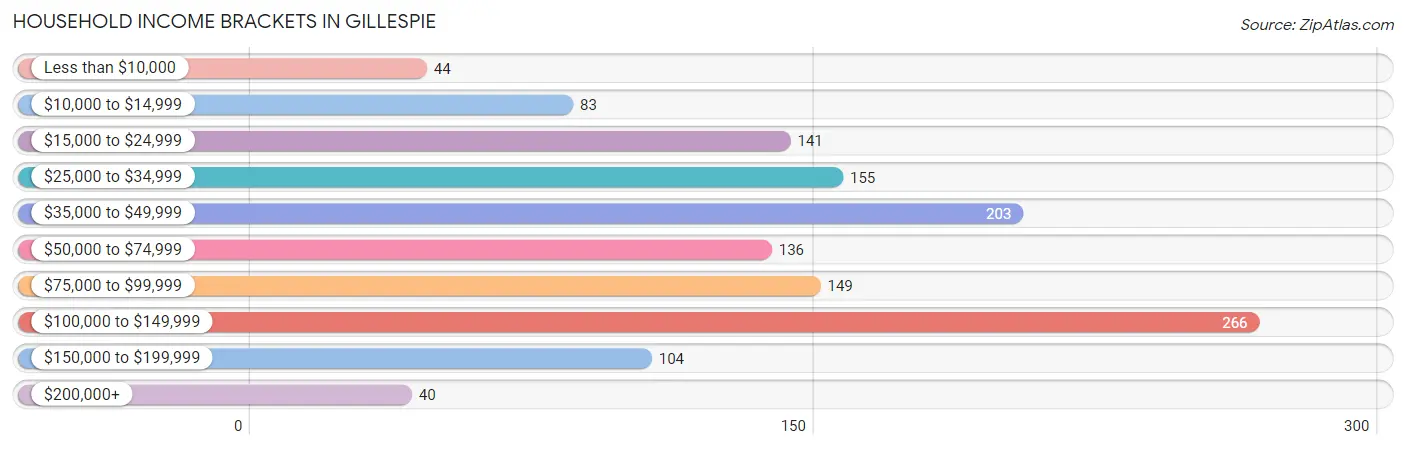
| Income Bracket | # Households | % Households |
| Less than $10,000 | 44 | 3.3% |
| $10,000 to $14,999 | 83 | 6.3% |
| $15,000 to $24,999 | 141 | 10.7% |
| $25,000 to $34,999 | 155 | 11.7% |
| $35,000 to $49,999 | 203 | 15.4% |
| $50,000 to $74,999 | 136 | 10.3% |
| $75,000 to $99,999 | 149 | 11.3% |
| $100,000 to $149,999 | 266 | 20.1% |
| $150,000 to $199,999 | 104 | 7.9% |
| $200,000+ | 40 | 3.0% |
Household Income by Householder Age in Gillespie
The median household income in Gillespie is $60,924, with the highest median household income of $81,875 found in the 45 to 64 years age bracket for the primary householder. A total of 506 households (38.3%) fall into this category. Meanwhile, the 15 to 24 years age bracket for the primary householder has the lowest median household income of $0, with 23 households (1.7%) in this group.
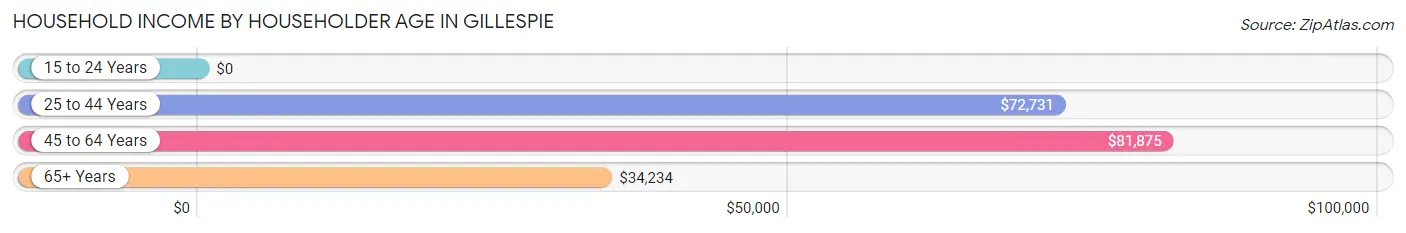
| Income Bracket | # Households | Median Income |
| 15 to 24 Years | 23 (1.7%) | $0 |
| 25 to 44 Years | 412 (31.2%) | $72,731 |
| 45 to 64 Years | 506 (38.3%) | $81,875 |
| 65+ Years | 380 (28.8%) | $34,234 |
| Total | 1,321 (100.0%) | $60,924 |
Poverty in Gillespie
Income Below Poverty by Sex and Age in Gillespie
With 12.7% poverty level for males and 19.6% for females among the residents of Gillespie, 6 to 11 year old males and 6 to 11 year old females are the most vulnerable to poverty, with 82 males (38.9%) and 60 females (47.2%) in their respective age groups living below the poverty level.
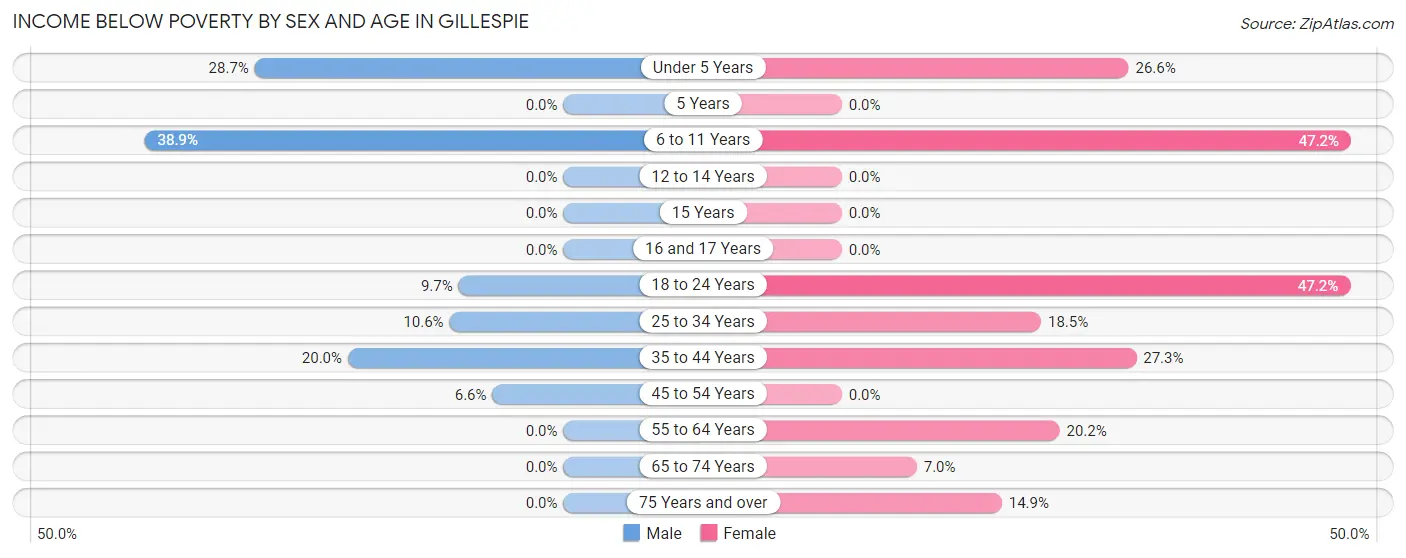
| Age Bracket | Male | Female |
| Under 5 Years | 51 (28.6%) | 33 (26.6%) |
| 5 Years | 0 (0.0%) | 0 (0.0%) |
| 6 to 11 Years | 82 (38.9%) | 60 (47.2%) |
| 12 to 14 Years | 0 (0.0%) | 0 (0.0%) |
| 15 Years | 0 (0.0%) | 0 (0.0%) |
| 16 and 17 Years | 0 (0.0%) | 0 (0.0%) |
| 18 to 24 Years | 11 (9.7%) | 50 (47.2%) |
| 25 to 34 Years | 24 (10.6%) | 44 (18.5%) |
| 35 to 44 Years | 18 (20.0%) | 41 (27.3%) |
| 45 to 54 Years | 18 (6.6%) | 0 (0.0%) |
| 55 to 64 Years | 0 (0.0%) | 39 (20.2%) |
| 65 to 74 Years | 0 (0.0%) | 11 (7.0%) |
| 75 Years and over | 0 (0.0%) | 34 (14.8%) |
| Total | 204 (12.7%) | 312 (19.6%) |
Income Above Poverty by Sex and Age in Gillespie
According to the poverty statistics in Gillespie, males aged 12 to 14 years and females aged 12 to 14 years are the age groups that are most secure financially, with 100.0% of males and 100.0% of females in these age groups living above the poverty line.
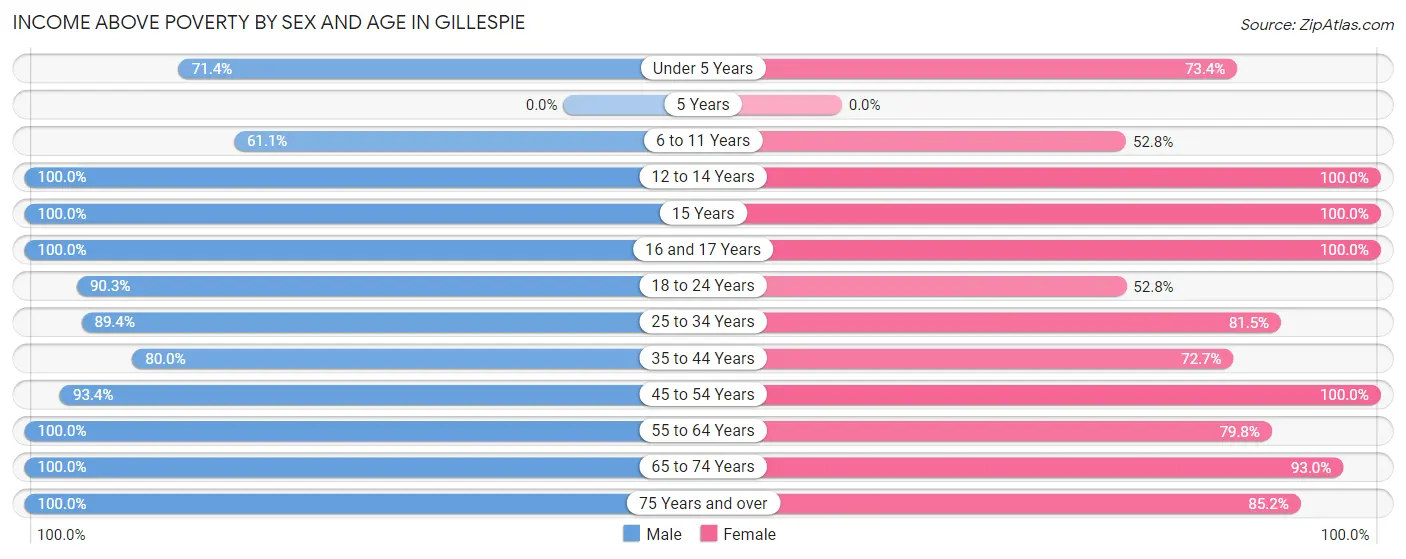
| Age Bracket | Male | Female |
| Under 5 Years | 127 (71.4%) | 91 (73.4%) |
| 5 Years | 0 (0.0%) | 0 (0.0%) |
| 6 to 11 Years | 129 (61.1%) | 67 (52.8%) |
| 12 to 14 Years | 38 (100.0%) | 22 (100.0%) |
| 15 Years | 36 (100.0%) | 1 (100.0%) |
| 16 and 17 Years | 18 (100.0%) | 3 (100.0%) |
| 18 to 24 Years | 102 (90.3%) | 56 (52.8%) |
| 25 to 34 Years | 203 (89.4%) | 194 (81.5%) |
| 35 to 44 Years | 72 (80.0%) | 109 (72.7%) |
| 45 to 54 Years | 255 (93.4%) | 241 (100.0%) |
| 55 to 64 Years | 213 (100.0%) | 154 (79.8%) |
| 65 to 74 Years | 143 (100.0%) | 147 (93.0%) |
| 75 Years and over | 61 (100.0%) | 195 (85.2%) |
| Total | 1,397 (87.3%) | 1,280 (80.4%) |
Income Below Poverty Among Married-Couple Families in Gillespie
The poverty statistics for married-couple families in Gillespie show that 3.1% or 15 of the total 486 families live below the poverty line. Families with 1 or 2 children have the highest poverty rate of 9.3%, comprising of 15 families. On the other hand, families with no children have the lowest poverty rate of 0.0%, which includes 0 families.
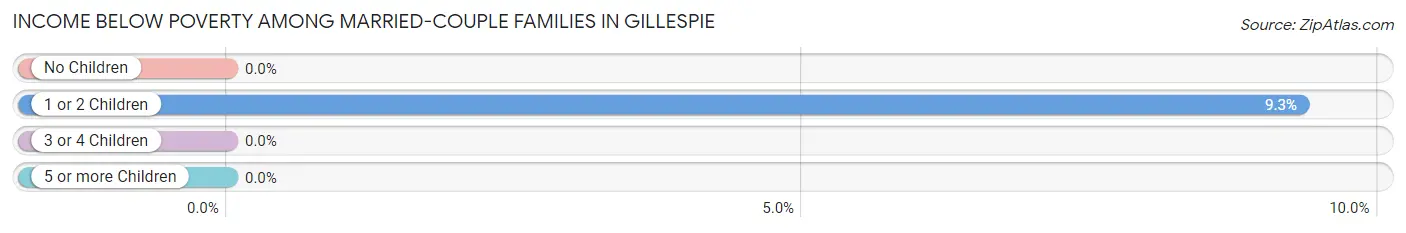
| Children | Above Poverty | Below Poverty |
| No Children | 293 (100.0%) | 0 (0.0%) |
| 1 or 2 Children | 146 (90.7%) | 15 (9.3%) |
| 3 or 4 Children | 32 (100.0%) | 0 (0.0%) |
| 5 or more Children | 0 (0.0%) | 0 (0.0%) |
| Total | 471 (96.9%) | 15 (3.1%) |
Income Below Poverty Among Single-Parent Households in Gillespie
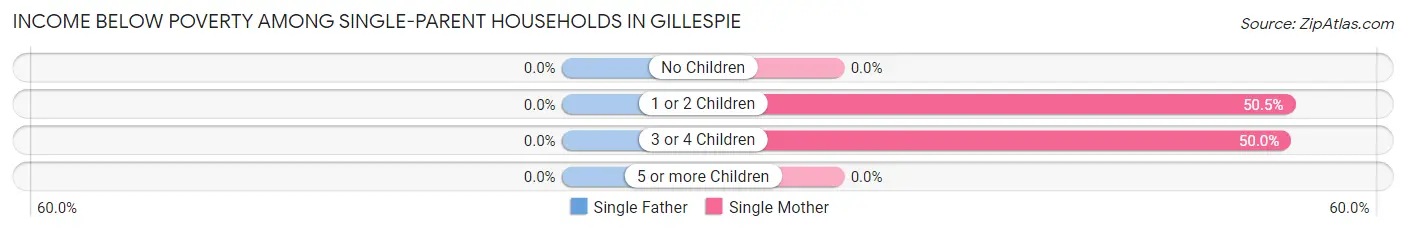
| Children | Single Father | Single Mother |
| No Children | 0 (0.0%) | 0 (0.0%) |
| 1 or 2 Children | 0 (0.0%) | 55 (50.5%) |
| 3 or 4 Children | 0 (0.0%) | 27 (50.0%) |
| 5 or more Children | 0 (0.0%) | 0 (0.0%) |
| Total | 0 (0.0%) | 82 (34.3%) |
Income Below Poverty Among Married-Couple vs Single-Parent Households in Gillespie
The poverty data for Gillespie shows that 15 of the married-couple family households (3.1%) and 82 of the single-parent households (27.2%) are living below the poverty level. Within the married-couple family households, those with 1 or 2 children have the highest poverty rate, with 15 households (9.3%) falling below the poverty line. Among the single-parent households, those with 3 or 4 children have the highest poverty rate, with 27 household (50.0%) living below poverty.
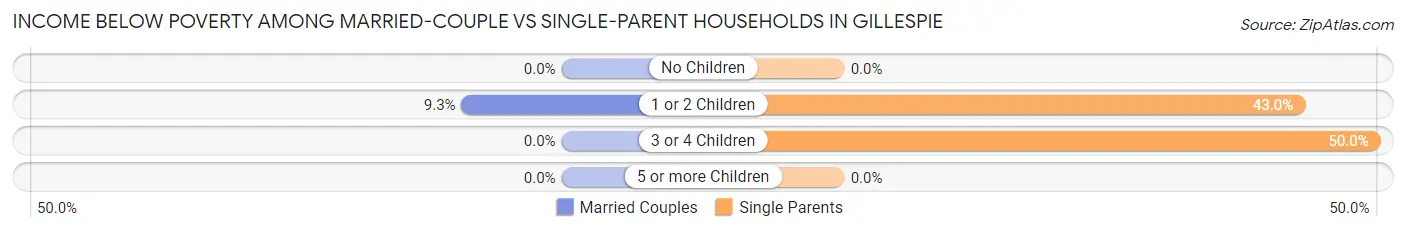
| Children | Married-Couple Families | Single-Parent Households |
| No Children | 0 (0.0%) | 0 (0.0%) |
| 1 or 2 Children | 15 (9.3%) | 55 (43.0%) |
| 3 or 4 Children | 0 (0.0%) | 27 (50.0%) |
| 5 or more Children | 0 (0.0%) | 0 (0.0%) |
| Total | 15 (3.1%) | 82 (27.2%) |
Race in Gillespie
The most populous races in Gillespie are White / Caucasian (3,080 | 96.5%), Two or more Races (105 | 3.3%), and Hispanic or Latino (24 | 0.7%).
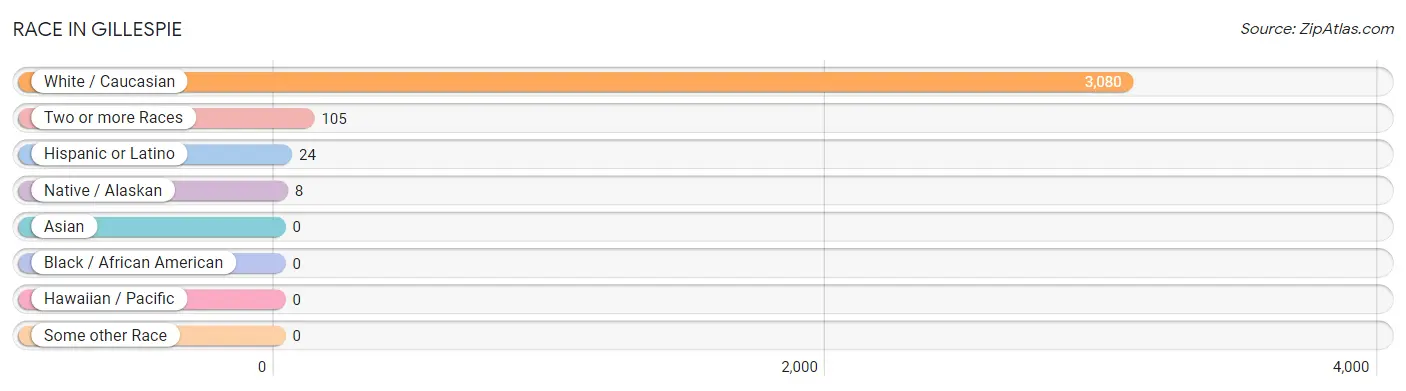
| Race | # Population | % Population |
| Asian | 0 | 0.0% |
| Black / African American | 0 | 0.0% |
| Hawaiian / Pacific | 0 | 0.0% |
| Hispanic or Latino | 24 | 0.7% |
| Native / Alaskan | 8 | 0.3% |
| White / Caucasian | 3,080 | 96.5% |
| Two or more Races | 105 | 3.3% |
| Some other Race | 0 | 0.0% |
| Total | 3,193 | 100.0% |
Ancestry in Gillespie
The most populous ancestries reported in Gillespie are German (933 | 29.2%), Irish (524 | 16.4%), English (330 | 10.3%), Italian (286 | 9.0%), and American (214 | 6.7%), together accounting for 71.6% of all Gillespie residents.
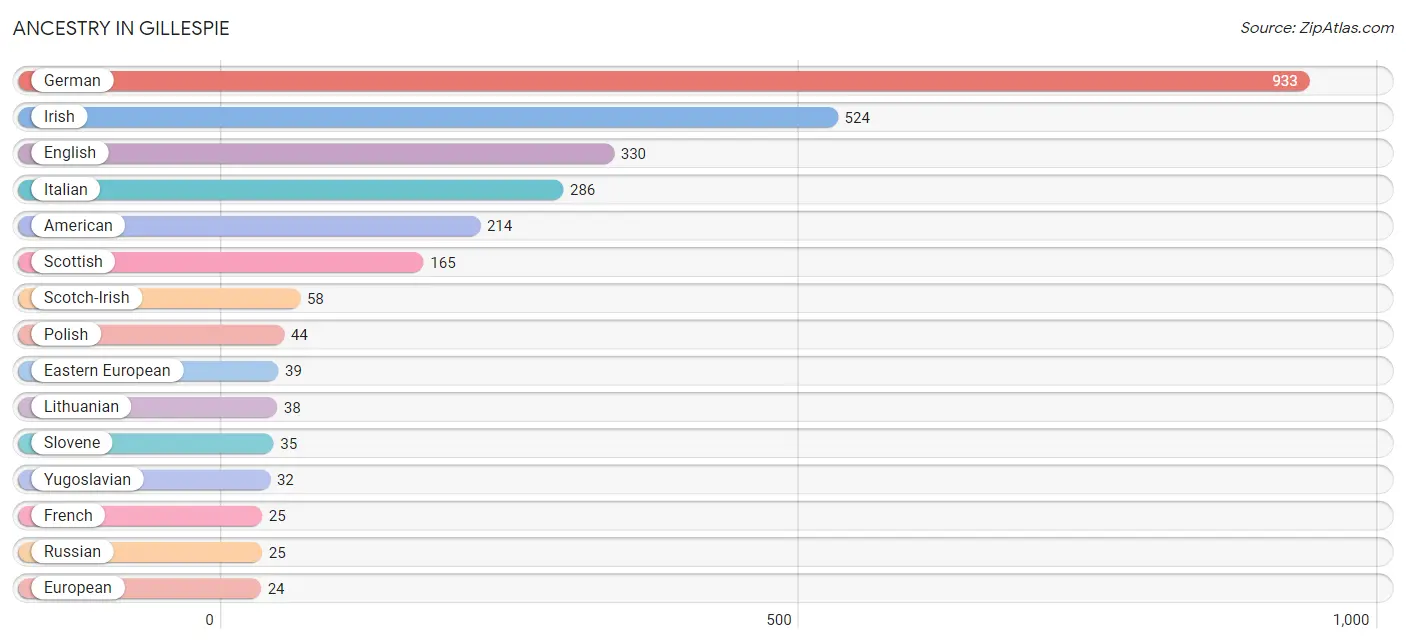
| Ancestry | # Population | % Population |
| American | 214 | 6.7% |
| Austrian | 15 | 0.5% |
| Blackfeet | 9 | 0.3% |
| British | 17 | 0.5% |
| Cherokee | 12 | 0.4% |
| Chippewa | 12 | 0.4% |
| Croatian | 10 | 0.3% |
| Czech | 10 | 0.3% |
| Eastern European | 39 | 1.2% |
| English | 330 | 10.3% |
| European | 24 | 0.7% |
| French | 25 | 0.8% |
| German | 933 | 29.2% |
| Irish | 524 | 16.4% |
| Italian | 286 | 9.0% |
| Lithuanian | 38 | 1.2% |
| Mexican | 24 | 0.7% |
| Polish | 44 | 1.4% |
| Russian | 25 | 0.8% |
| Scotch-Irish | 58 | 1.8% |
| Scottish | 165 | 5.2% |
| Slovene | 35 | 1.1% |
| Welsh | 20 | 0.6% |
| Yugoslavian | 32 | 1.0% | View All 24 Rows |
Immigrants in Gillespie
The most numerous immigrant groups reported in Gillespie came from Europe (10 | 0.3%), Germany (10 | 0.3%), and Western Europe (10 | 0.3%), together accounting for 0.9% of all Gillespie residents.
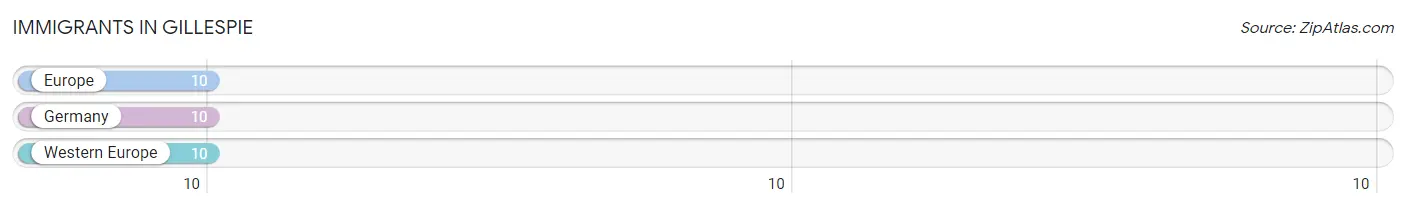
| Immigration Origin | # Population | % Population |
| Europe | 10 | 0.3% |
| Germany | 10 | 0.3% |
| Western Europe | 10 | 0.3% | View All 3 Rows |
Sex and Age in Gillespie
Sex and Age in Gillespie
The most populous age groups in Gillespie are 50 to 54 Years (203 | 12.7%) for men and 50 to 54 Years (173 | 10.9%) for women.
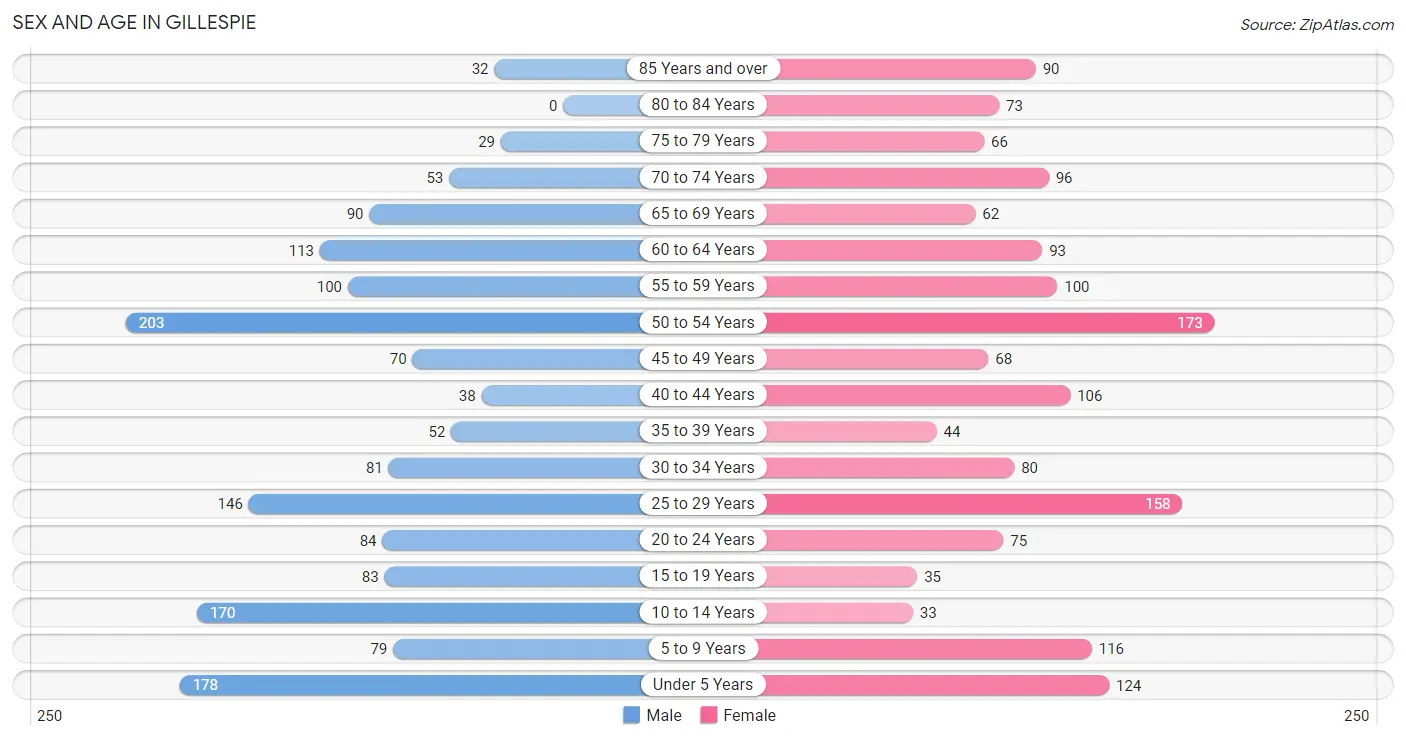
| Age Bracket | Male | Female |
| Under 5 Years | 178 (11.1%) | 124 (7.8%) |
| 5 to 9 Years | 79 (4.9%) | 116 (7.3%) |
| 10 to 14 Years | 170 (10.6%) | 33 (2.1%) |
| 15 to 19 Years | 83 (5.2%) | 35 (2.2%) |
| 20 to 24 Years | 84 (5.2%) | 75 (4.7%) |
| 25 to 29 Years | 146 (9.1%) | 158 (9.9%) |
| 30 to 34 Years | 81 (5.1%) | 80 (5.0%) |
| 35 to 39 Years | 52 (3.3%) | 44 (2.8%) |
| 40 to 44 Years | 38 (2.4%) | 106 (6.7%) |
| 45 to 49 Years | 70 (4.4%) | 68 (4.3%) |
| 50 to 54 Years | 203 (12.7%) | 173 (10.9%) |
| 55 to 59 Years | 100 (6.2%) | 100 (6.3%) |
| 60 to 64 Years | 113 (7.1%) | 93 (5.8%) |
| 65 to 69 Years | 90 (5.6%) | 62 (3.9%) |
| 70 to 74 Years | 53 (3.3%) | 96 (6.0%) |
| 75 to 79 Years | 29 (1.8%) | 66 (4.2%) |
| 80 to 84 Years | 0 (0.0%) | 73 (4.6%) |
| 85 Years and over | 32 (2.0%) | 90 (5.7%) |
| Total | 1,601 (100.0%) | 1,592 (100.0%) |
Families and Households in Gillespie
Median Family Size in Gillespie
The median family size in Gillespie is 3.09 persons per family, with married-couple families (486 | 61.7%) accounting for the largest median family size of 3.34 persons per family. On the other hand, single male/father families (63 | 8.0%) represent the smallest median family size with 1.98 persons per family.
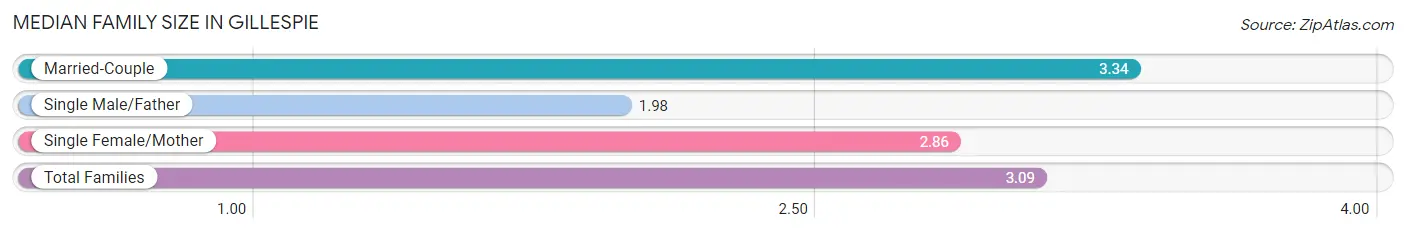
| Family Type | # Families | Family Size |
| Married-Couple | 486 (61.7%) | 3.34 |
| Single Male/Father | 63 (8.0%) | 1.98 |
| Single Female/Mother | 239 (30.3%) | 2.86 |
| Total Families | 788 (100.0%) | 3.09 |
Median Household Size in Gillespie
The median household size in Gillespie is 2.42 persons per household, with married-couple households (486 | 36.8%) accounting for the largest median household size of 3.42 persons per household. non-family households (533 | 40.4%) represent the smallest median household size with 1.10 persons per household.
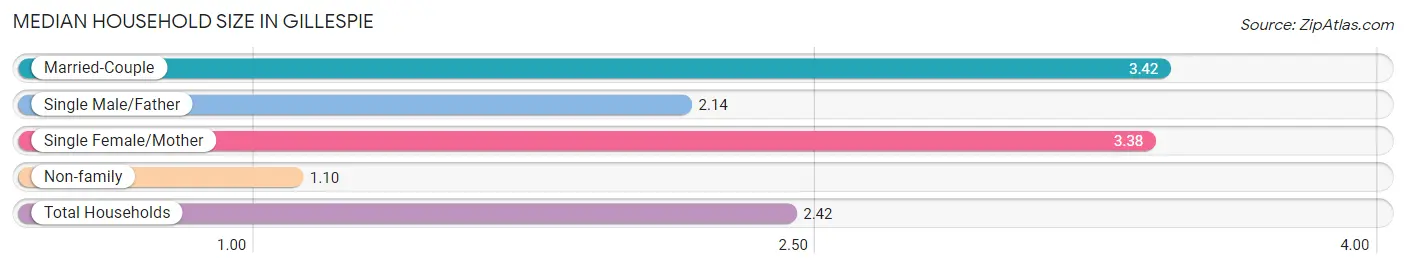
| Household Type | # Households | Household Size |
| Married-Couple | 486 (36.8%) | 3.42 |
| Single Male/Father | 63 (4.8%) | 2.14 |
| Single Female/Mother | 239 (18.1%) | 3.38 |
| Non-family | 533 (40.4%) | 1.10 |
| Total Households | 1,321 (100.0%) | 2.42 |
Household Size by Marriage Status in Gillespie
Out of a total of 1,321 households in Gillespie, 788 (59.7%) are family households, while 533 (40.4%) are nonfamily households. The most numerous type of family households are 2-person households, comprising 382, and the most common type of nonfamily households are 1-person households, comprising 485.
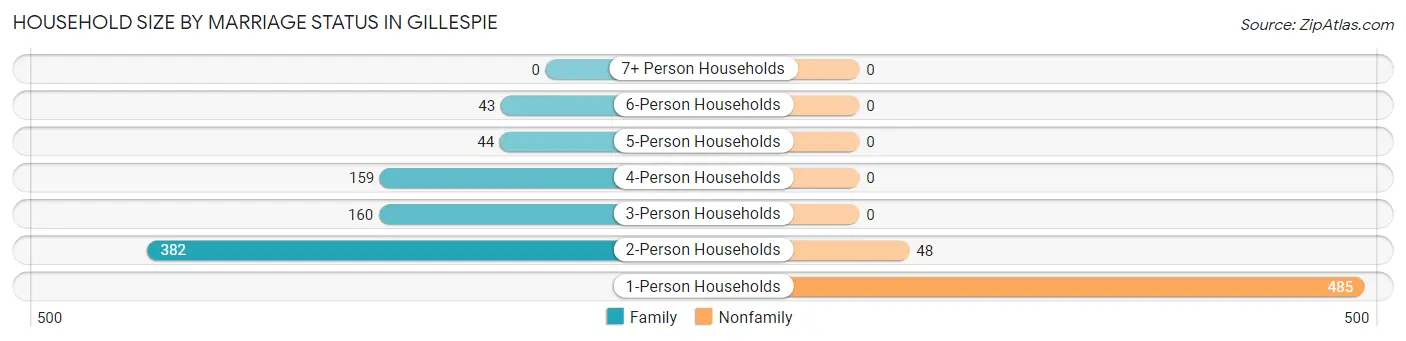
| Household Size | Family Households | Nonfamily Households |
| 1-Person Households | - | 485 (36.7%) |
| 2-Person Households | 382 (28.9%) | 48 (3.6%) |
| 3-Person Households | 160 (12.1%) | 0 (0.0%) |
| 4-Person Households | 159 (12.0%) | 0 (0.0%) |
| 5-Person Households | 44 (3.3%) | 0 (0.0%) |
| 6-Person Households | 43 (3.3%) | 0 (0.0%) |
| 7+ Person Households | 0 (0.0%) | 0 (0.0%) |
| Total | 788 (59.7%) | 533 (40.4%) |
Female Fertility in Gillespie
Fertility by Age in Gillespie
Average fertility rate in Gillespie is 97.0 births per 1,000 women. Women in the age bracket of 20 to 34 years have the highest fertility rate with 185.0 births per 1,000 women. Women in the age bracket of 20 to 34 years acount for 100.0% of all women with births.
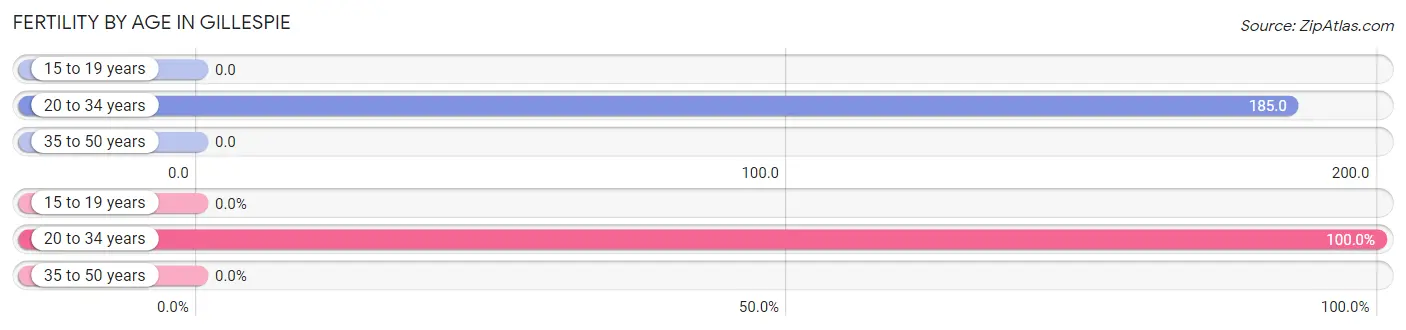
| Age Bracket | Women with Births | Births / 1,000 Women |
| 15 to 19 years | 0 (0.0%) | 0.0 |
| 20 to 34 years | 58 (100.0%) | 185.0 |
| 35 to 50 years | 0 (0.0%) | 0.0 |
| Total | 58 (100.0%) | 97.0 |
Fertility by Age by Marriage Status in Gillespie
53.4% of women with births (58) in Gillespie are married. The highest percentage of unmarried women with births falls into 20 to 34 years age bracket with 46.6% of them unmarried at the time of birth, while the lowest percentage of unmarried women with births belong to 20 to 34 years age bracket with 46.6% of them unmarried.
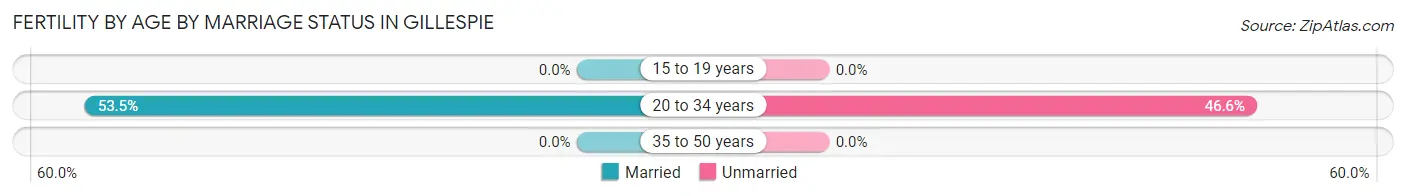
| Age Bracket | Married | Unmarried |
| 15 to 19 years | 0 (0.0%) | 0 (0.0%) |
| 20 to 34 years | 31 (53.4%) | 27 (46.6%) |
| 35 to 50 years | 0 (0.0%) | 0 (0.0%) |
| Total | 31 (53.4%) | 27 (46.6%) |
Fertility by Education in Gillespie
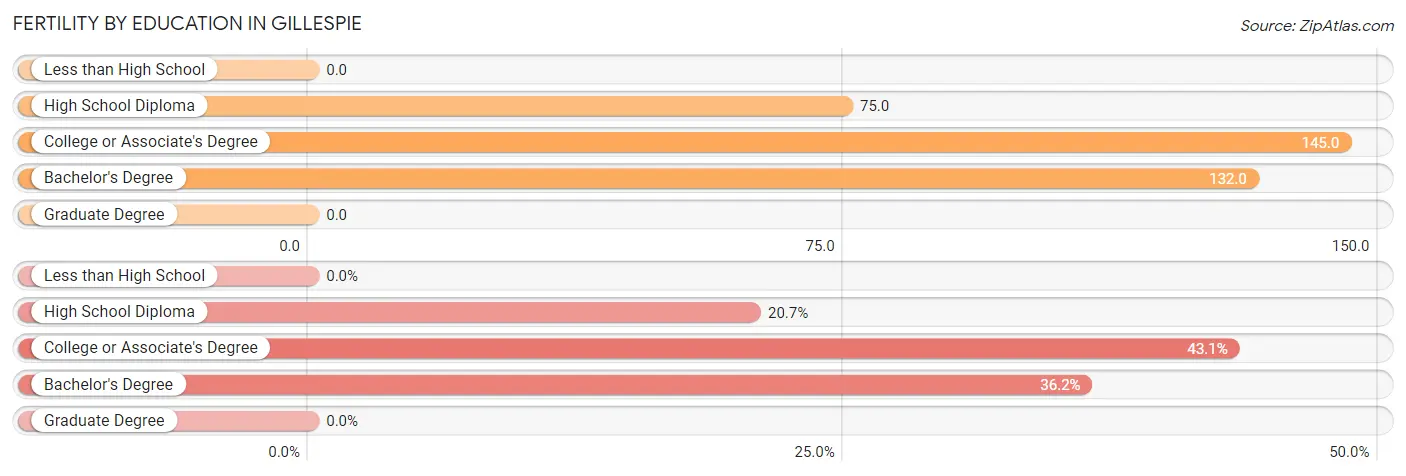
| Educational Attainment | Women with Births | Births / 1,000 Women |
| Less than High School | 0 (0.0%) | 0.0 |
| High School Diploma | 12 (20.7%) | 75.0 |
| College or Associate's Degree | 25 (43.1%) | 145.0 |
| Bachelor's Degree | 21 (36.2%) | 132.0 |
| Graduate Degree | 0 (0.0%) | 0.0 |
| Total | 58 (100.0%) | 97.0 |
Fertility by Education by Marriage Status in Gillespie
46.6% of women with births in Gillespie are unmarried. Women with the educational attainment of bachelor's degree are most likely to be married with 100.0% of them married at childbirth, while women with the educational attainment of high school diploma are least likely to be married with 100.0% of them unmarried at childbirth.
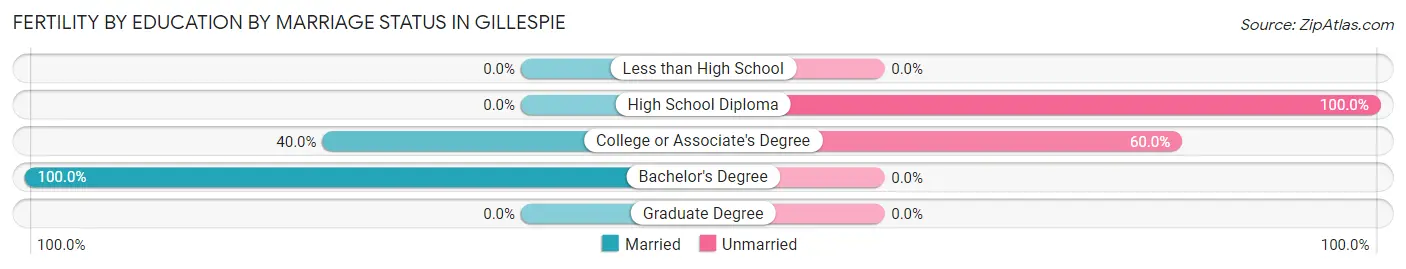
| Educational Attainment | Married | Unmarried |
| Less than High School | 0 (0.0%) | 0 (0.0%) |
| High School Diploma | 0 (0.0%) | 12 (100.0%) |
| College or Associate's Degree | 10 (40.0%) | 15 (60.0%) |
| Bachelor's Degree | 21 (100.0%) | 0 (0.0%) |
| Graduate Degree | 0 (0.0%) | 0 (0.0%) |
| Total | 31 (53.4%) | 27 (46.6%) |
Employment Characteristics in Gillespie
Employment by Class of Employer in Gillespie
Among the 1,392 employed individuals in Gillespie, private company employees (995 | 71.5%), state government employees (201 | 14.4%), and local government employees (112 | 8.1%) make up the most common classes of employment.
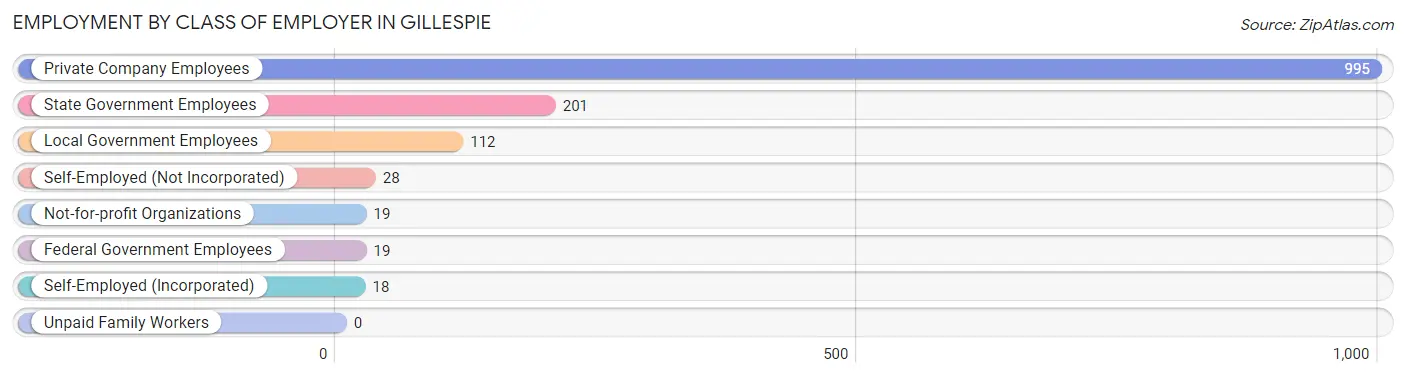
| Employer Class | # Employees | % Employees |
| Private Company Employees | 995 | 71.5% |
| Self-Employed (Incorporated) | 18 | 1.3% |
| Self-Employed (Not Incorporated) | 28 | 2.0% |
| Not-for-profit Organizations | 19 | 1.4% |
| Local Government Employees | 112 | 8.1% |
| State Government Employees | 201 | 14.4% |
| Federal Government Employees | 19 | 1.4% |
| Unpaid Family Workers | 0 | 0.0% |
| Total | 1,392 | 100.0% |
Employment Status by Age in Gillespie
According to the labor force statistics for Gillespie, out of the total population over 16 years of age (2,456), 61.7% or 1,515 individuals are in the labor force, with 5.1% or 77 of them unemployed. The age group with the highest labor force participation rate is 45 to 54 years, with 88.7% or 456 individuals in the labor force. Within the labor force, the 30 to 34 years age range has the highest percentage of unemployed individuals, with 25.2% or 26 of them being unemployed.
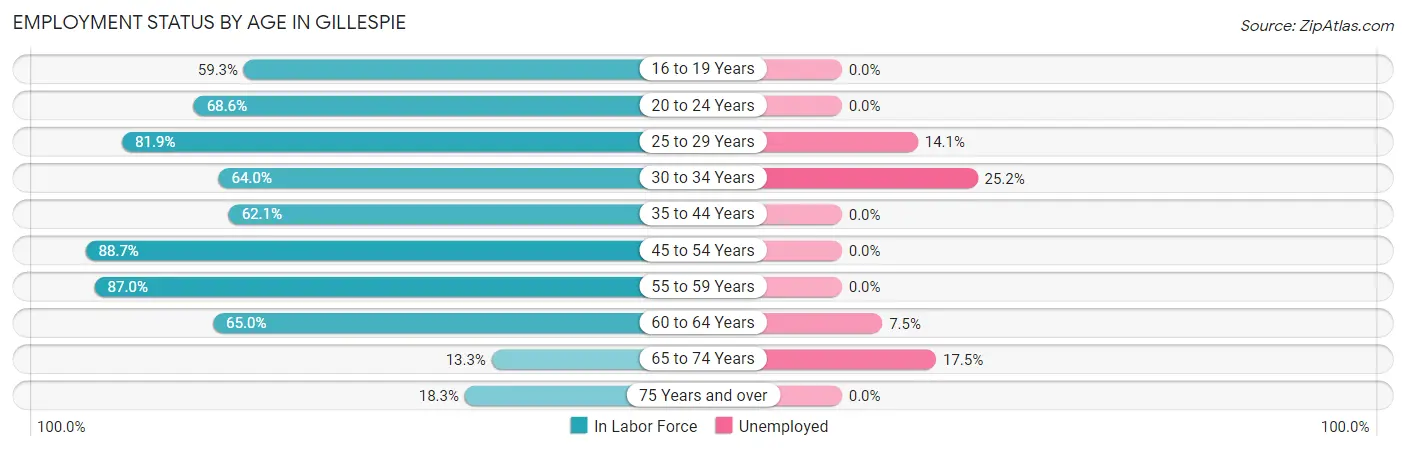
| Age Bracket | In Labor Force | Unemployed |
| 16 to 19 Years | 48 (59.3%) | 0 (0.0%) |
| 20 to 24 Years | 109 (68.6%) | 0 (0.0%) |
| 25 to 29 Years | 249 (81.9%) | 35 (14.1%) |
| 30 to 34 Years | 103 (64.0%) | 26 (25.2%) |
| 35 to 44 Years | 149 (62.1%) | 0 (0.0%) |
| 45 to 54 Years | 456 (88.7%) | 0 (0.0%) |
| 55 to 59 Years | 174 (87.0%) | 0 (0.0%) |
| 60 to 64 Years | 134 (65.0%) | 10 (7.5%) |
| 65 to 74 Years | 40 (13.3%) | 7 (17.5%) |
| 75 Years and over | 53 (18.3%) | 0 (0.0%) |
| Total | 1,515 (61.7%) | 77 (5.1%) |
Employment Status by Educational Attainment in Gillespie
According to labor force statistics for Gillespie, 77.8% of individuals (1,264) out of the total population between 25 and 64 years of age (1,625) are in the labor force, with 5.6% or 71 of them being unemployed. The group with the highest labor force participation rate are those with the educational attainment of bachelor's degree or higher, with 88.2% or 328 individuals in the labor force. Within the labor force, individuals with bachelor's degree or higher education have the highest percentage of unemployment, with 10.7% or 35 of them being unemployed.
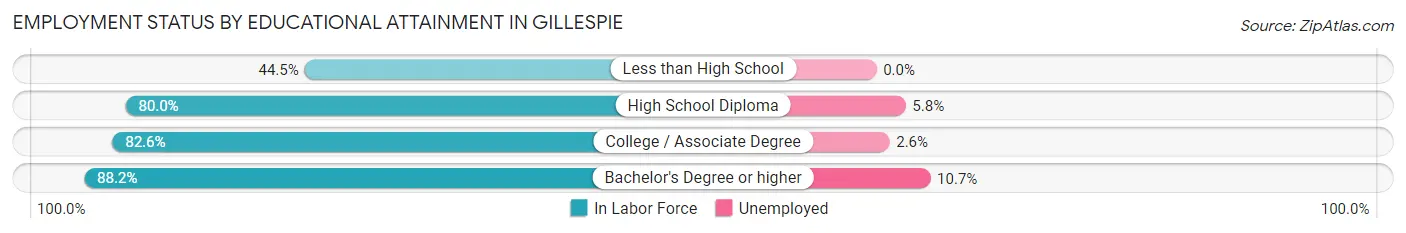
| Educational Attainment | In Labor Force | Unemployed |
| Less than High School | 97 (44.5%) | 0 (0.0%) |
| High School Diploma | 451 (80.0%) | 33 (5.8%) |
| College / Associate Degree | 389 (82.6%) | 12 (2.6%) |
| Bachelor's Degree or higher | 328 (88.2%) | 40 (10.7%) |
| Total | 1,264 (77.8%) | 91 (5.6%) |
Employment Occupations by Sex in Gillespie
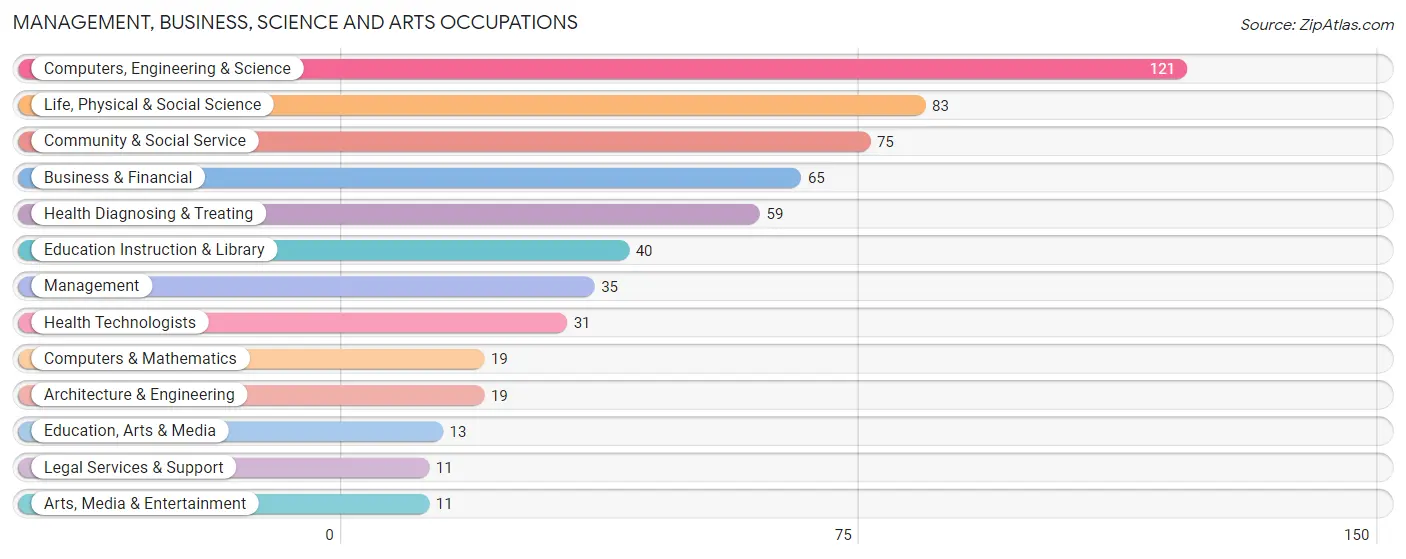
Management, Business, Science and Arts Occupations
The most common Management, Business, Science and Arts occupations in Gillespie are Computers, Engineering & Science (121 | 8.4%), Life, Physical & Social Science (83 | 5.8%), Community & Social Service (75 | 5.2%), Business & Financial (65 | 4.5%), and Health Diagnosing & Treating (59 | 4.1%).
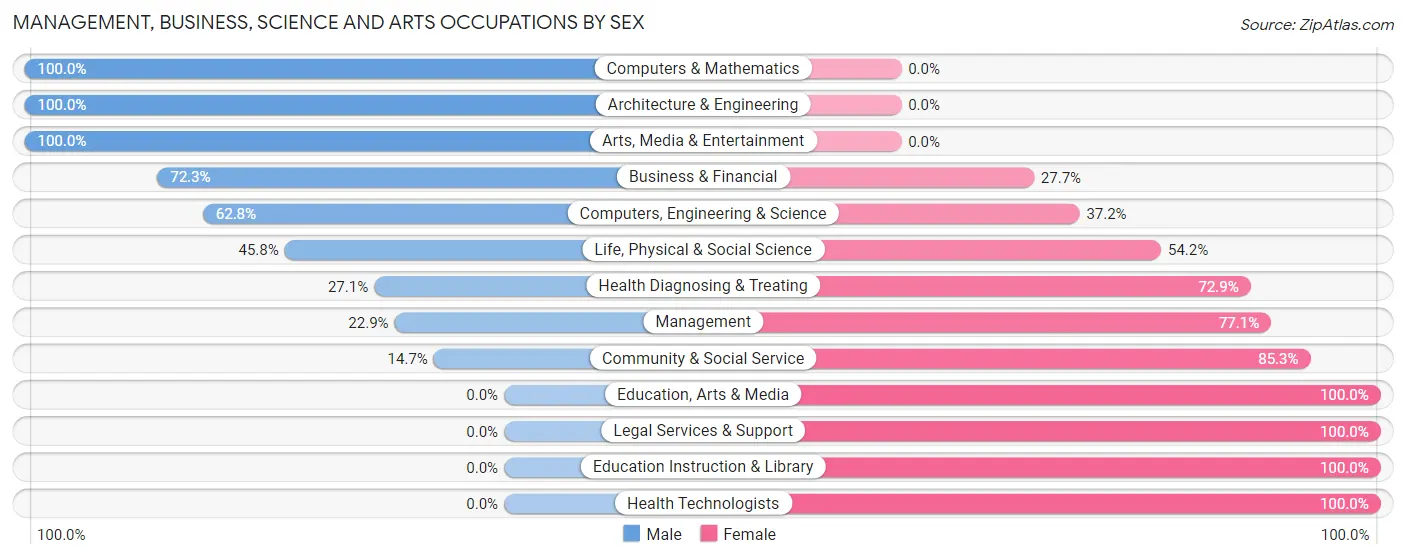
Management, Business, Science and Arts Occupations by Sex
Within the Management, Business, Science and Arts occupations in Gillespie, the most male-oriented occupations are Computers & Mathematics (100.0%), Architecture & Engineering (100.0%), and Arts, Media & Entertainment (100.0%), while the most female-oriented occupations are Education, Arts & Media (100.0%), Legal Services & Support (100.0%), and Education Instruction & Library (100.0%).
| Occupation | Male | Female |
| Management | 8 (22.9%) | 27 (77.1%) |
| Business & Financial | 47 (72.3%) | 18 (27.7%) |
| Computers, Engineering & Science | 76 (62.8%) | 45 (37.2%) |
| Computers & Mathematics | 19 (100.0%) | 0 (0.0%) |
| Architecture & Engineering | 19 (100.0%) | 0 (0.0%) |
| Life, Physical & Social Science | 38 (45.8%) | 45 (54.2%) |
| Community & Social Service | 11 (14.7%) | 64 (85.3%) |
| Education, Arts & Media | 0 (0.0%) | 13 (100.0%) |
| Legal Services & Support | 0 (0.0%) | 11 (100.0%) |
| Education Instruction & Library | 0 (0.0%) | 40 (100.0%) |
| Arts, Media & Entertainment | 11 (100.0%) | 0 (0.0%) |
| Health Diagnosing & Treating | 16 (27.1%) | 43 (72.9%) |
| Health Technologists | 0 (0.0%) | 31 (100.0%) |
| Total (Category) | 158 (44.5%) | 197 (55.5%) |
| Total (Overall) | 804 (55.9%) | 633 (44.1%) |
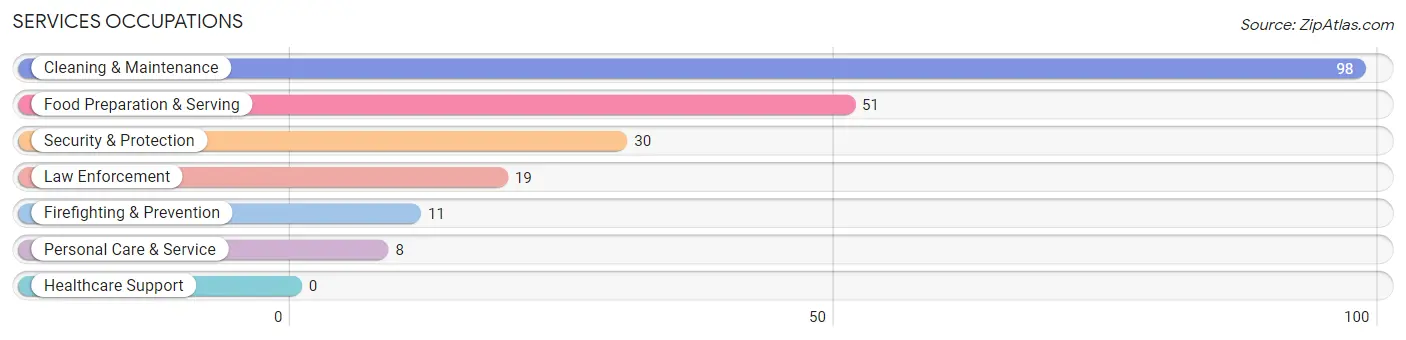
Services Occupations
The most common Services occupations in Gillespie are Cleaning & Maintenance (98 | 6.8%), Food Preparation & Serving (51 | 3.5%), Security & Protection (30 | 2.1%), Law Enforcement (19 | 1.3%), and Firefighting & Prevention (11 | 0.8%).
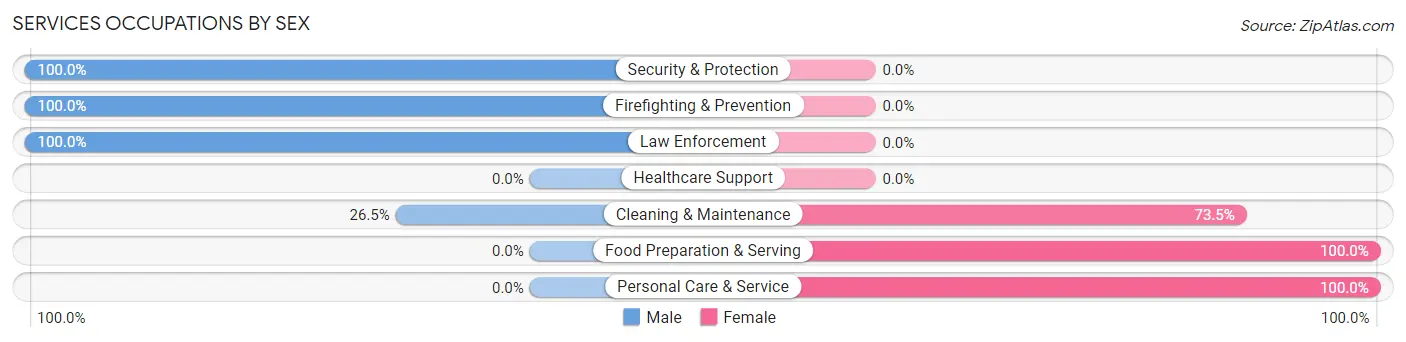
Services Occupations by Sex
Within the Services occupations in Gillespie, the most male-oriented occupations are Security & Protection (100.0%), Firefighting & Prevention (100.0%), and Law Enforcement (100.0%), while the most female-oriented occupations are Food Preparation & Serving (100.0%), Personal Care & Service (100.0%), and Cleaning & Maintenance (73.5%).
| Occupation | Male | Female |
| Healthcare Support | 0 (0.0%) | 0 (0.0%) |
| Security & Protection | 30 (100.0%) | 0 (0.0%) |
| Firefighting & Prevention | 11 (100.0%) | 0 (0.0%) |
| Law Enforcement | 19 (100.0%) | 0 (0.0%) |
| Food Preparation & Serving | 0 (0.0%) | 51 (100.0%) |
| Cleaning & Maintenance | 26 (26.5%) | 72 (73.5%) |
| Personal Care & Service | 0 (0.0%) | 8 (100.0%) |
| Total (Category) | 56 (29.9%) | 131 (70.1%) |
| Total (Overall) | 804 (55.9%) | 633 (44.1%) |
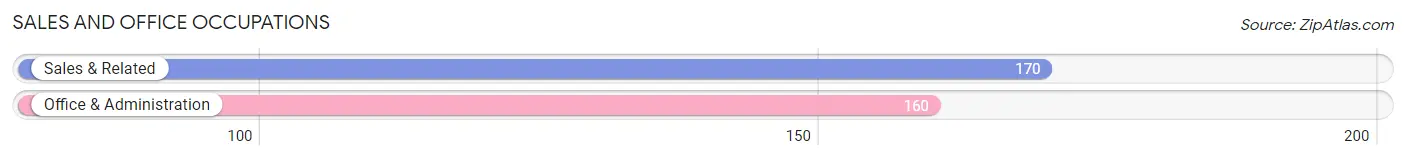
Sales and Office Occupations
The most common Sales and Office occupations in Gillespie are Sales & Related (170 | 11.8%), and Office & Administration (160 | 11.1%).
Sales and Office Occupations by Sex
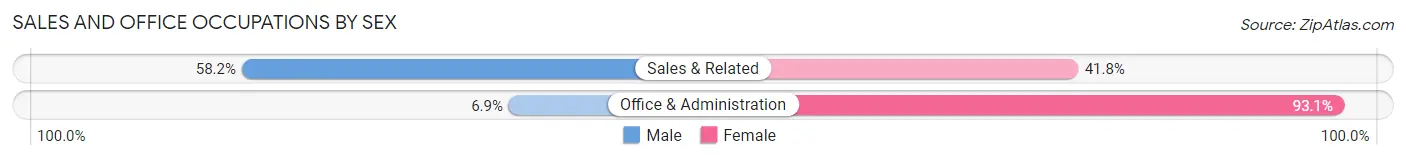
| Occupation | Male | Female |
| Sales & Related | 99 (58.2%) | 71 (41.8%) |
| Office & Administration | 11 (6.9%) | 149 (93.1%) |
| Total (Category) | 110 (33.3%) | 220 (66.7%) |
| Total (Overall) | 804 (55.9%) | 633 (44.1%) |
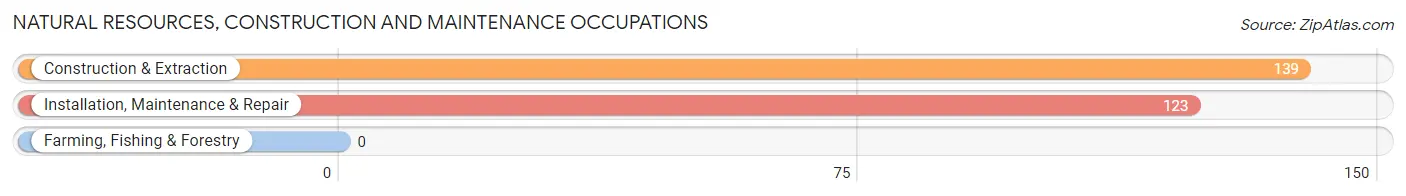
Natural Resources, Construction and Maintenance Occupations
The most common Natural Resources, Construction and Maintenance occupations in Gillespie are Construction & Extraction (139 | 9.7%), and Installation, Maintenance & Repair (123 | 8.6%).
Natural Resources, Construction and Maintenance Occupations by Sex
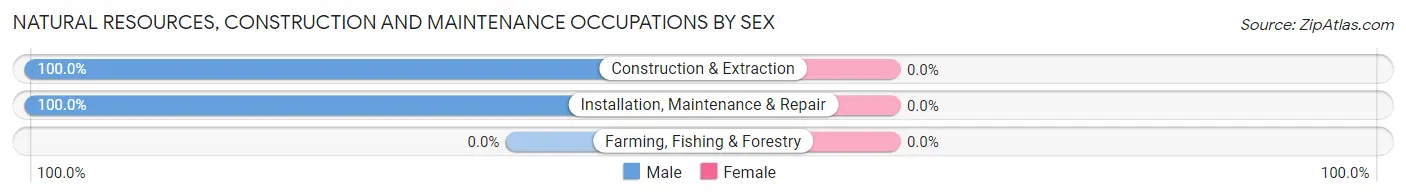
| Occupation | Male | Female |
| Farming, Fishing & Forestry | 0 (0.0%) | 0 (0.0%) |
| Construction & Extraction | 139 (100.0%) | 0 (0.0%) |
| Installation, Maintenance & Repair | 123 (100.0%) | 0 (0.0%) |
| Total (Category) | 262 (100.0%) | 0 (0.0%) |
| Total (Overall) | 804 (55.9%) | 633 (44.1%) |
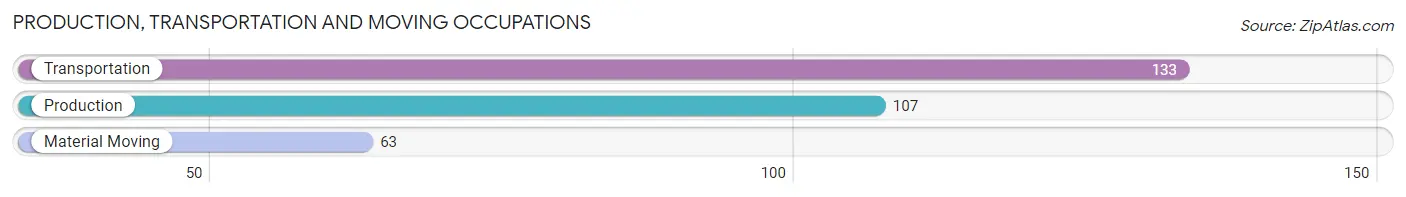
Production, Transportation and Moving Occupations
The most common Production, Transportation and Moving occupations in Gillespie are Transportation (133 | 9.3%), Production (107 | 7.4%), and Material Moving (63 | 4.4%).
Production, Transportation and Moving Occupations by Sex
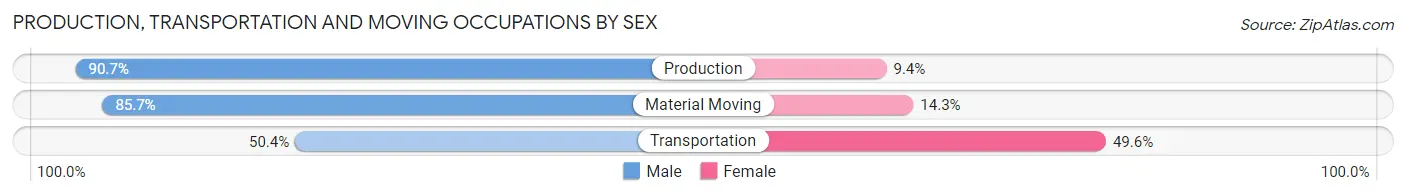
| Occupation | Male | Female |
| Production | 97 (90.6%) | 10 (9.3%) |
| Transportation | 67 (50.4%) | 66 (49.6%) |
| Material Moving | 54 (85.7%) | 9 (14.3%) |
| Total (Category) | 218 (72.0%) | 85 (28.1%) |
| Total (Overall) | 804 (55.9%) | 633 (44.1%) |
Employment Industries by Sex in Gillespie
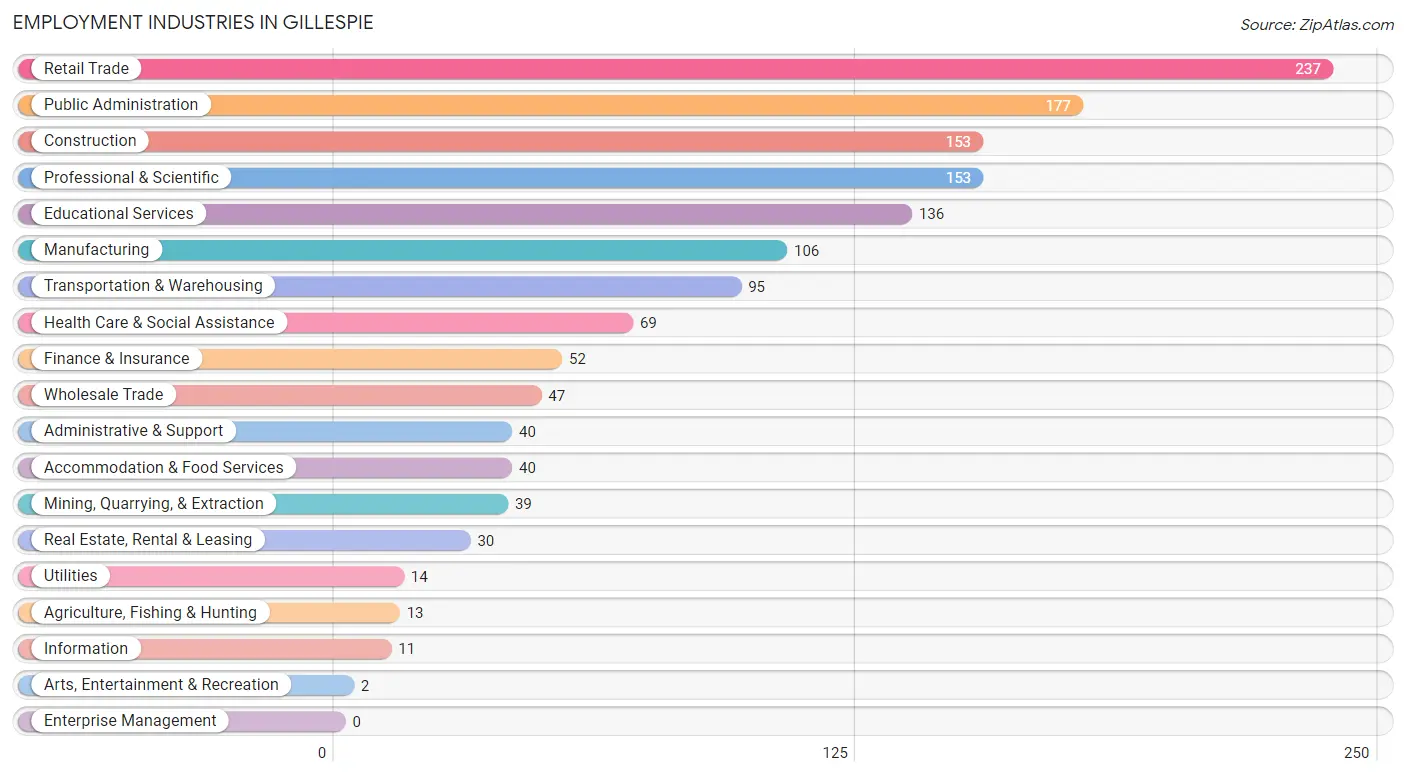
Employment Industries in Gillespie
The major employment industries in Gillespie include Retail Trade (237 | 16.5%), Public Administration (177 | 12.3%), Construction (153 | 10.6%), Professional & Scientific (153 | 10.6%), and Educational Services (136 | 9.5%).
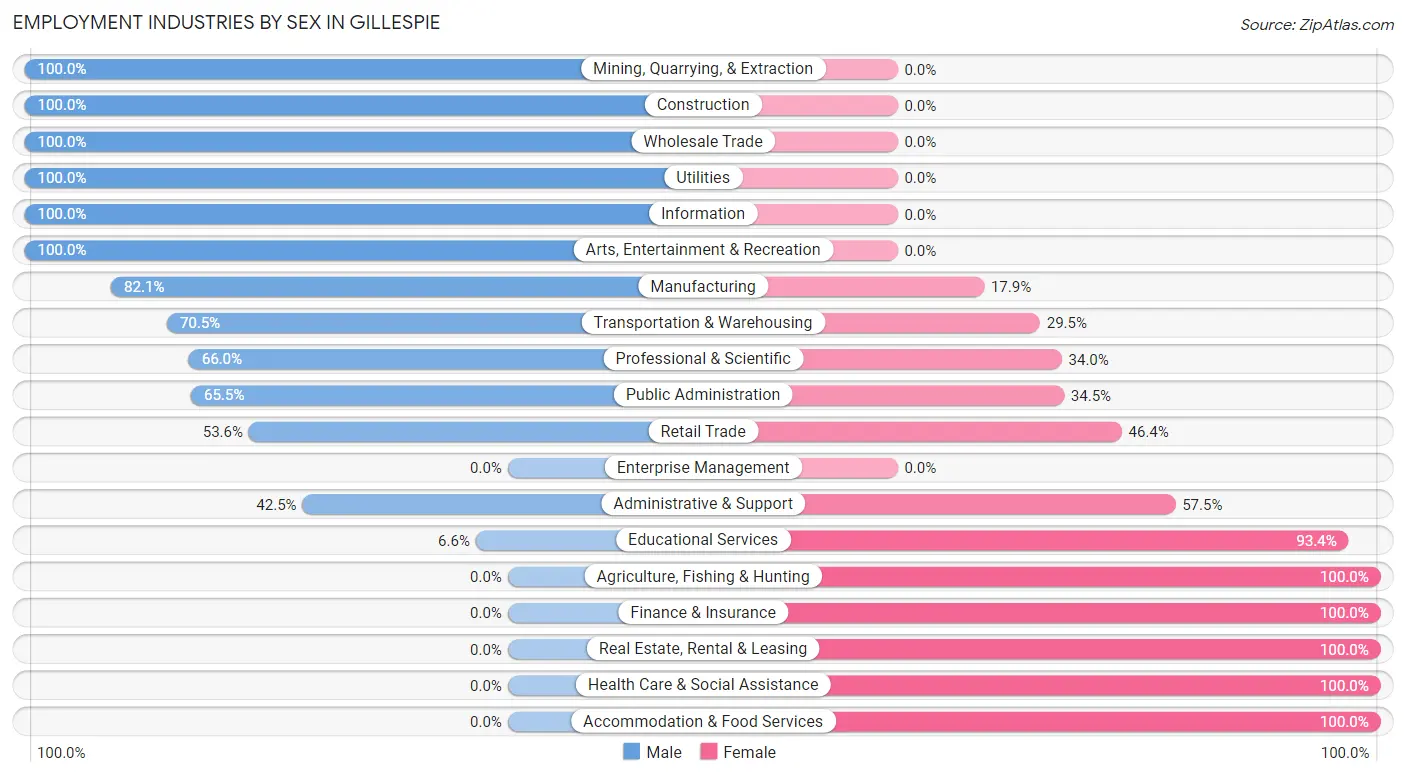
Employment Industries by Sex in Gillespie
The Gillespie industries that see more men than women are Mining, Quarrying, & Extraction (100.0%), Construction (100.0%), and Wholesale Trade (100.0%), whereas the industries that tend to have a higher number of women are Agriculture, Fishing & Hunting (100.0%), Finance & Insurance (100.0%), and Real Estate, Rental & Leasing (100.0%).
| Industry | Male | Female |
| Agriculture, Fishing & Hunting | 0 (0.0%) | 13 (100.0%) |
| Mining, Quarrying, & Extraction | 39 (100.0%) | 0 (0.0%) |
| Construction | 153 (100.0%) | 0 (0.0%) |
| Manufacturing | 87 (82.1%) | 19 (17.9%) |
| Wholesale Trade | 47 (100.0%) | 0 (0.0%) |
| Retail Trade | 127 (53.6%) | 110 (46.4%) |
| Transportation & Warehousing | 67 (70.5%) | 28 (29.5%) |
| Utilities | 14 (100.0%) | 0 (0.0%) |
| Information | 11 (100.0%) | 0 (0.0%) |
| Finance & Insurance | 0 (0.0%) | 52 (100.0%) |
| Real Estate, Rental & Leasing | 0 (0.0%) | 30 (100.0%) |
| Professional & Scientific | 101 (66.0%) | 52 (34.0%) |
| Enterprise Management | 0 (0.0%) | 0 (0.0%) |
| Administrative & Support | 17 (42.5%) | 23 (57.5%) |
| Educational Services | 9 (6.6%) | 127 (93.4%) |
| Health Care & Social Assistance | 0 (0.0%) | 69 (100.0%) |
| Arts, Entertainment & Recreation | 2 (100.0%) | 0 (0.0%) |
| Accommodation & Food Services | 0 (0.0%) | 40 (100.0%) |
| Public Administration | 116 (65.5%) | 61 (34.5%) |
| Total | 804 (55.9%) | 633 (44.1%) |
Education in Gillespie
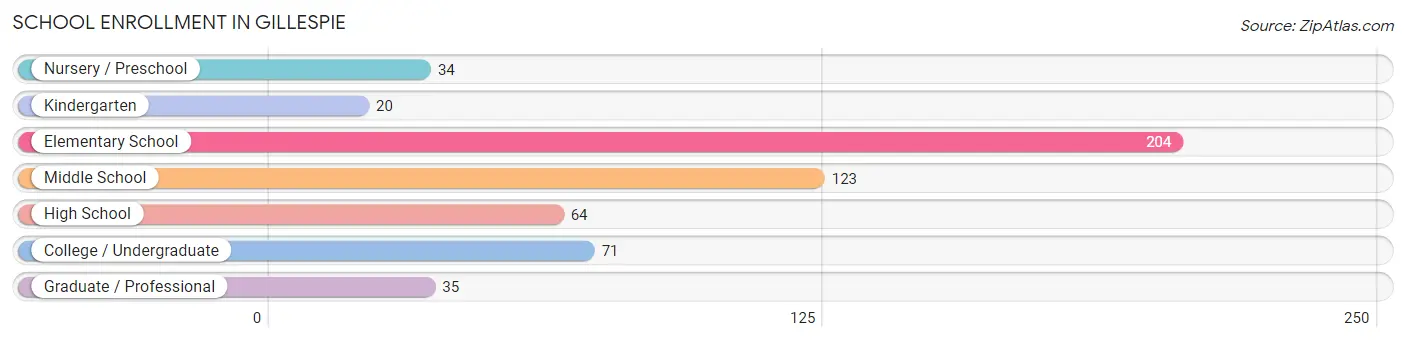
School Enrollment in Gillespie
The most common levels of schooling among the 551 students in Gillespie are elementary school (204 | 37.0%), middle school (123 | 22.3%), and college / undergraduate (71 | 12.9%).
| School Level | # Students | % Students |
| Nursery / Preschool | 34 | 6.2% |
| Kindergarten | 20 | 3.6% |
| Elementary School | 204 | 37.0% |
| Middle School | 123 | 22.3% |
| High School | 64 | 11.6% |
| College / Undergraduate | 71 | 12.9% |
| Graduate / Professional | 35 | 6.4% |
| Total | 551 | 100.0% |
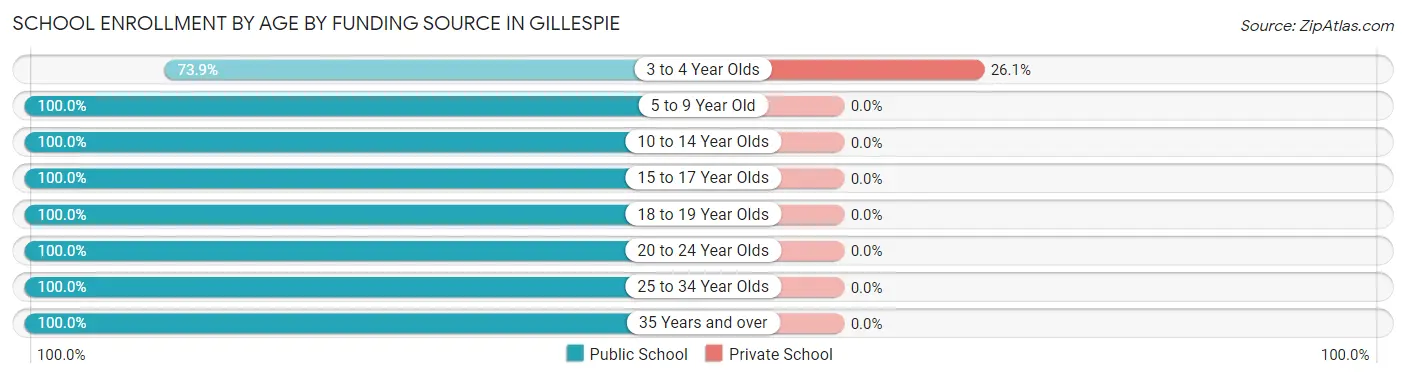
School Enrollment by Age by Funding Source in Gillespie
Out of a total of 551 students who are enrolled in schools in Gillespie, 12 (2.2%) attend a private institution, while the remaining 539 (97.8%) are enrolled in public schools. The age group of 3 to 4 year olds has the highest likelihood of being enrolled in private schools, with 12 (26.1% in the age bracket) enrolled. Conversely, the age group of 5 to 9 year old has the lowest likelihood of being enrolled in a private school, with 157 (100.0% in the age bracket) attending a public institution.
| Age Bracket | Public School | Private School |
| 3 to 4 Year Olds | 34 (73.9%) | 12 (26.1%) |
| 5 to 9 Year Old | 157 (100.0%) | 0 (0.0%) |
| 10 to 14 Year Olds | 182 (100.0%) | 0 (0.0%) |
| 15 to 17 Year Olds | 47 (100.0%) | 0 (0.0%) |
| 18 to 19 Year Olds | 31 (100.0%) | 0 (0.0%) |
| 20 to 24 Year Olds | 28 (100.0%) | 0 (0.0%) |
| 25 to 34 Year Olds | 45 (100.0%) | 0 (0.0%) |
| 35 Years and over | 15 (100.0%) | 0 (0.0%) |
| Total | 539 (97.8%) | 12 (2.2%) |
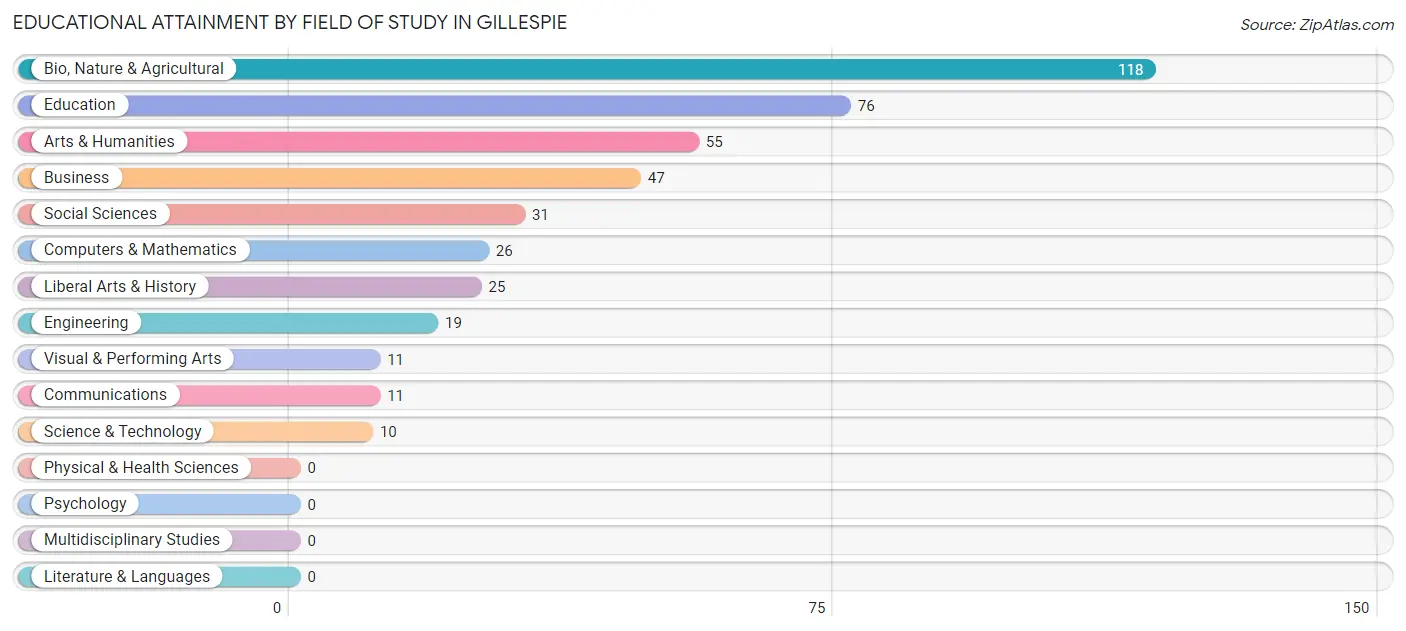
Educational Attainment by Field of Study in Gillespie
Bio, nature & agricultural (118 | 27.5%), education (76 | 17.7%), arts & humanities (55 | 12.8%), business (47 | 11.0%), and social sciences (31 | 7.2%) are the most common fields of study among 429 individuals in Gillespie who have obtained a bachelor's degree or higher.
| Field of Study | # Graduates | % Graduates |
| Computers & Mathematics | 26 | 6.1% |
| Bio, Nature & Agricultural | 118 | 27.5% |
| Physical & Health Sciences | 0 | 0.0% |
| Psychology | 0 | 0.0% |
| Social Sciences | 31 | 7.2% |
| Engineering | 19 | 4.4% |
| Multidisciplinary Studies | 0 | 0.0% |
| Science & Technology | 10 | 2.3% |
| Business | 47 | 11.0% |
| Education | 76 | 17.7% |
| Literature & Languages | 0 | 0.0% |
| Liberal Arts & History | 25 | 5.8% |
| Visual & Performing Arts | 11 | 2.6% |
| Communications | 11 | 2.6% |
| Arts & Humanities | 55 | 12.8% |
| Total | 429 | 100.0% |
Transportation & Commute in Gillespie
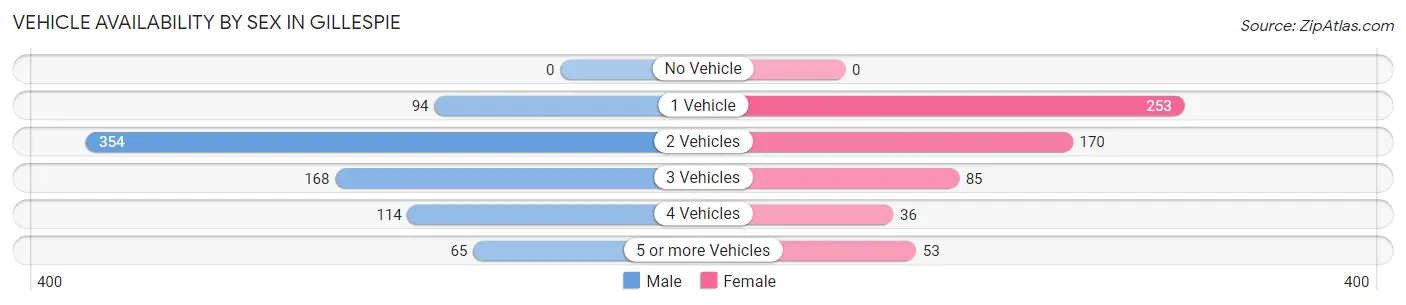
Vehicle Availability by Sex in Gillespie
The most prevalent vehicle ownership categories in Gillespie are males with 2 vehicles (354, accounting for 44.5%) and females with 2 vehicles (170, making up 59.3%).
| Vehicles Available | Male | Female |
| No Vehicle | 0 (0.0%) | 0 (0.0%) |
| 1 Vehicle | 94 (11.8%) | 253 (42.4%) |
| 2 Vehicles | 354 (44.5%) | 170 (28.5%) |
| 3 Vehicles | 168 (21.1%) | 85 (14.2%) |
| 4 Vehicles | 114 (14.3%) | 36 (6.0%) |
| 5 or more Vehicles | 65 (8.2%) | 53 (8.9%) |
| Total | 795 (100.0%) | 597 (100.0%) |
Commute Time in Gillespie
The most frequently occuring commute durations in Gillespie are 45 to 59 minutes (240 commuters, 19.9%), 5 to 9 minutes (178 commuters, 14.7%), and 10 to 14 minutes (170 commuters, 14.1%).
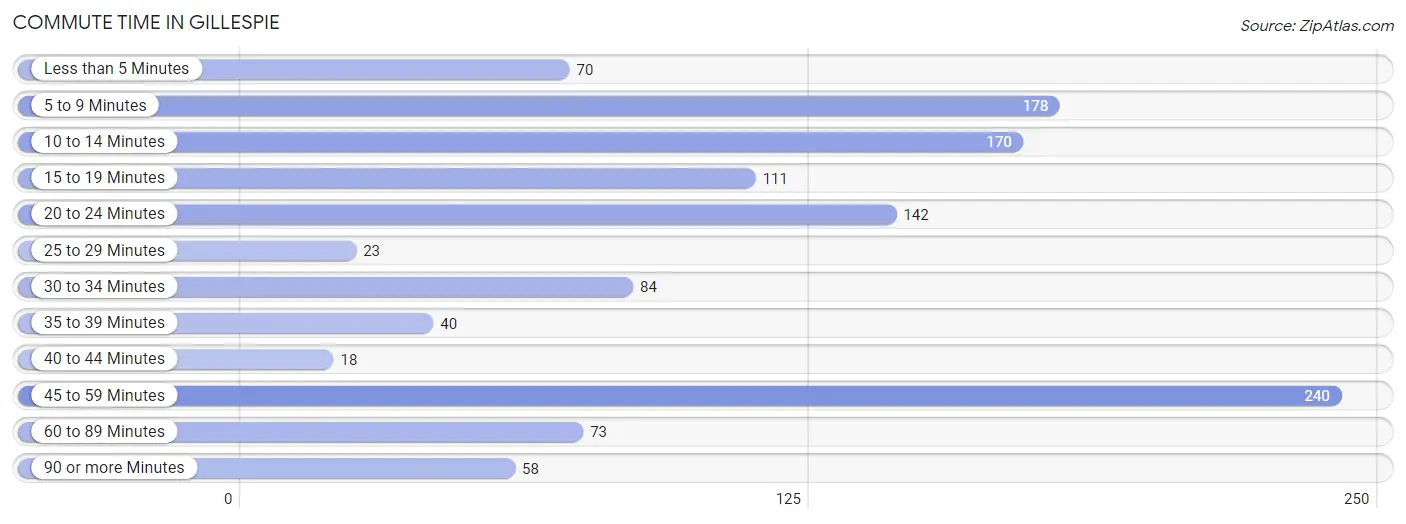
| Commute Time | # Commuters | % Commuters |
| Less than 5 Minutes | 70 | 5.8% |
| 5 to 9 Minutes | 178 | 14.7% |
| 10 to 14 Minutes | 170 | 14.1% |
| 15 to 19 Minutes | 111 | 9.2% |
| 20 to 24 Minutes | 142 | 11.8% |
| 25 to 29 Minutes | 23 | 1.9% |
| 30 to 34 Minutes | 84 | 7.0% |
| 35 to 39 Minutes | 40 | 3.3% |
| 40 to 44 Minutes | 18 | 1.5% |
| 45 to 59 Minutes | 240 | 19.9% |
| 60 to 89 Minutes | 73 | 6.0% |
| 90 or more Minutes | 58 | 4.8% |
Commute Time by Sex in Gillespie
The most common commute times in Gillespie are 45 to 59 minutes (190 commuters, 27.1%) for males and 5 to 9 minutes (113 commuters, 22.3%) for females.
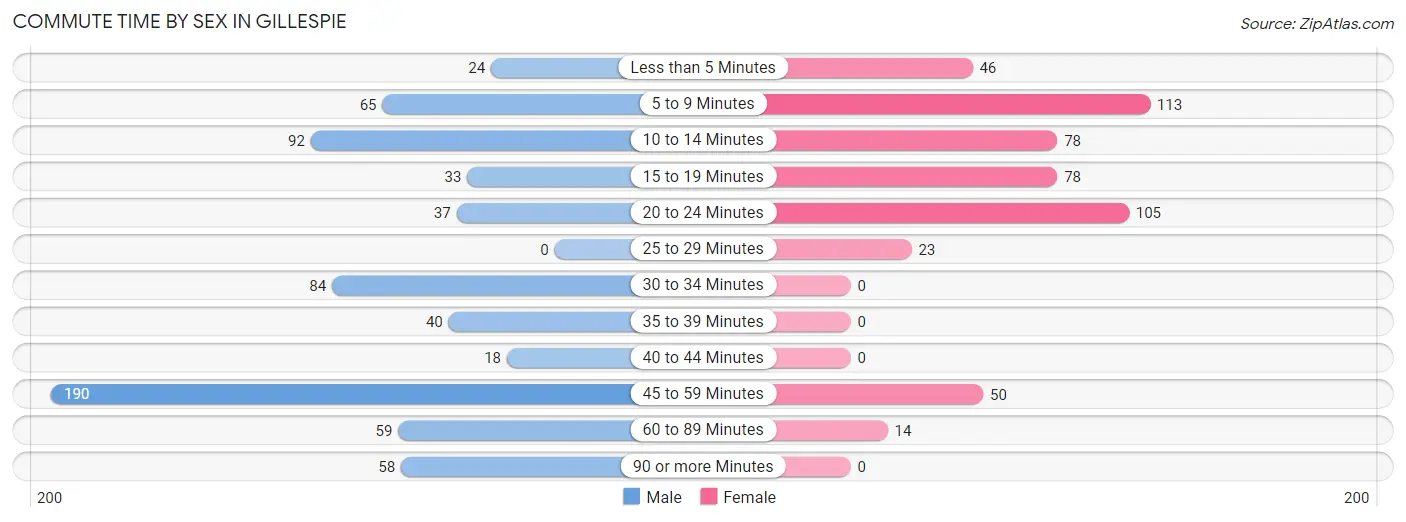
| Commute Time | Male | Female |
| Less than 5 Minutes | 24 (3.4%) | 46 (9.1%) |
| 5 to 9 Minutes | 65 (9.3%) | 113 (22.3%) |
| 10 to 14 Minutes | 92 (13.1%) | 78 (15.4%) |
| 15 to 19 Minutes | 33 (4.7%) | 78 (15.4%) |
| 20 to 24 Minutes | 37 (5.3%) | 105 (20.7%) |
| 25 to 29 Minutes | 0 (0.0%) | 23 (4.5%) |
| 30 to 34 Minutes | 84 (12.0%) | 0 (0.0%) |
| 35 to 39 Minutes | 40 (5.7%) | 0 (0.0%) |
| 40 to 44 Minutes | 18 (2.6%) | 0 (0.0%) |
| 45 to 59 Minutes | 190 (27.1%) | 50 (9.9%) |
| 60 to 89 Minutes | 59 (8.4%) | 14 (2.8%) |
| 90 or more Minutes | 58 (8.3%) | 0 (0.0%) |
Time of Departure to Work by Sex in Gillespie
The most frequent times of departure to work in Gillespie are 5:30 AM to 5:59 AM (108, 15.4%) for males and 7:00 AM to 7:29 AM (134, 26.4%) for females.
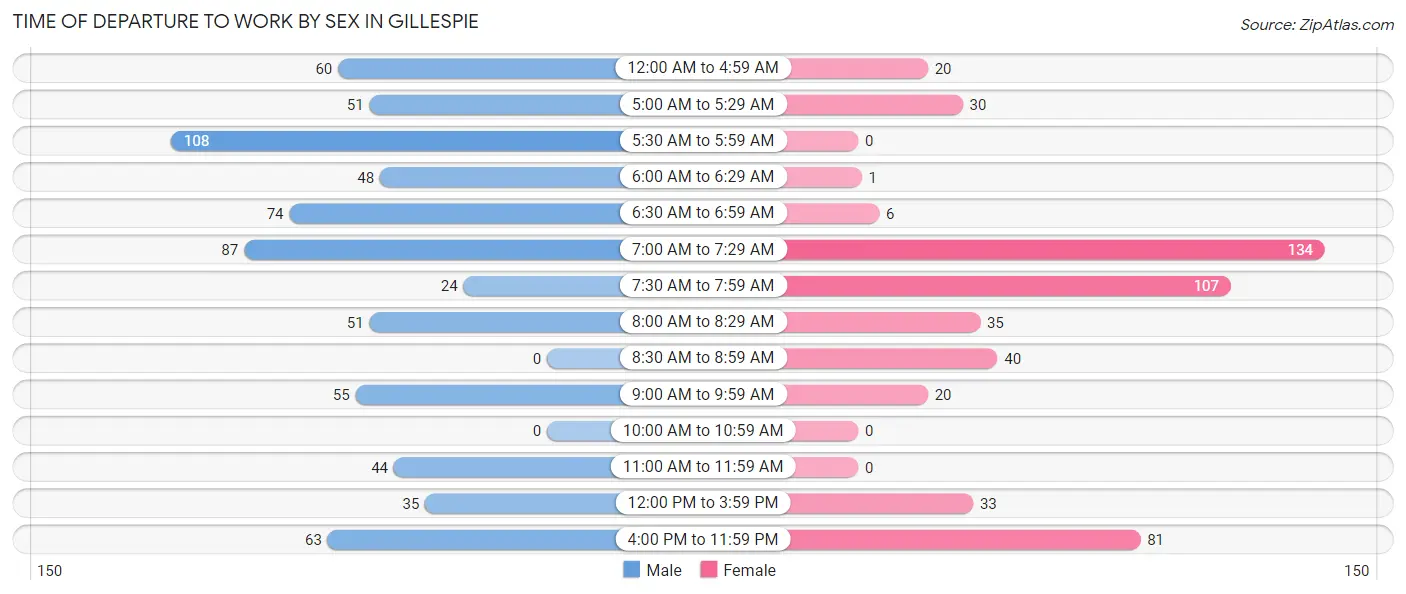
| Time of Departure | Male | Female |
| 12:00 AM to 4:59 AM | 60 (8.6%) | 20 (3.9%) |
| 5:00 AM to 5:29 AM | 51 (7.3%) | 30 (5.9%) |
| 5:30 AM to 5:59 AM | 108 (15.4%) | 0 (0.0%) |
| 6:00 AM to 6:29 AM | 48 (6.9%) | 1 (0.2%) |
| 6:30 AM to 6:59 AM | 74 (10.6%) | 6 (1.2%) |
| 7:00 AM to 7:29 AM | 87 (12.4%) | 134 (26.4%) |
| 7:30 AM to 7:59 AM | 24 (3.4%) | 107 (21.1%) |
| 8:00 AM to 8:29 AM | 51 (7.3%) | 35 (6.9%) |
| 8:30 AM to 8:59 AM | 0 (0.0%) | 40 (7.9%) |
| 9:00 AM to 9:59 AM | 55 (7.9%) | 20 (3.9%) |
| 10:00 AM to 10:59 AM | 0 (0.0%) | 0 (0.0%) |
| 11:00 AM to 11:59 AM | 44 (6.3%) | 0 (0.0%) |
| 12:00 PM to 3:59 PM | 35 (5.0%) | 33 (6.5%) |
| 4:00 PM to 11:59 PM | 63 (9.0%) | 81 (16.0%) |
| Total | 700 (100.0%) | 507 (100.0%) |
Housing Occupancy in Gillespie
Occupancy by Ownership in Gillespie
Of the total 1,321 dwellings in Gillespie, owner-occupied units account for 889 (67.3%), while renter-occupied units make up 432 (32.7%).
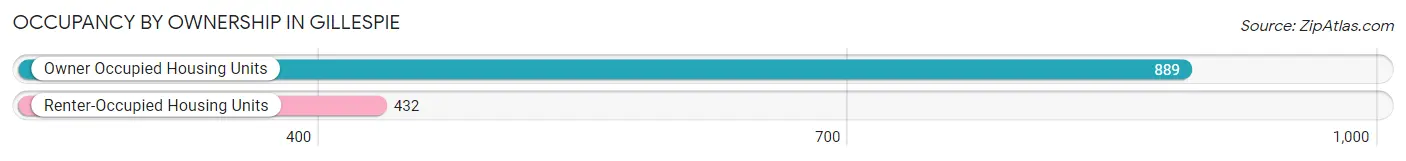
| Occupancy | # Housing Units | % Housing Units |
| Owner Occupied Housing Units | 889 | 67.3% |
| Renter-Occupied Housing Units | 432 | 32.7% |
| Total Occupied Housing Units | 1,321 | 100.0% |
Occupancy by Household Size in Gillespie
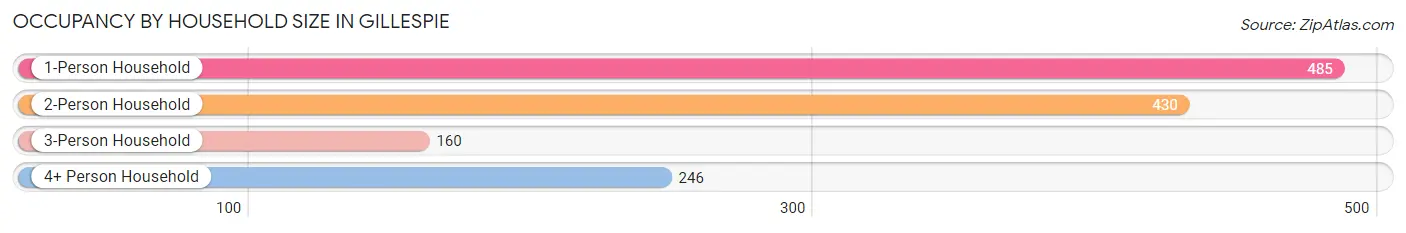
| Household Size | # Housing Units | % Housing Units |
| 1-Person Household | 485 | 36.7% |
| 2-Person Household | 430 | 32.6% |
| 3-Person Household | 160 | 12.1% |
| 4+ Person Household | 246 | 18.6% |
| Total Housing Units | 1,321 | 100.0% |
Occupancy by Ownership by Household Size in Gillespie
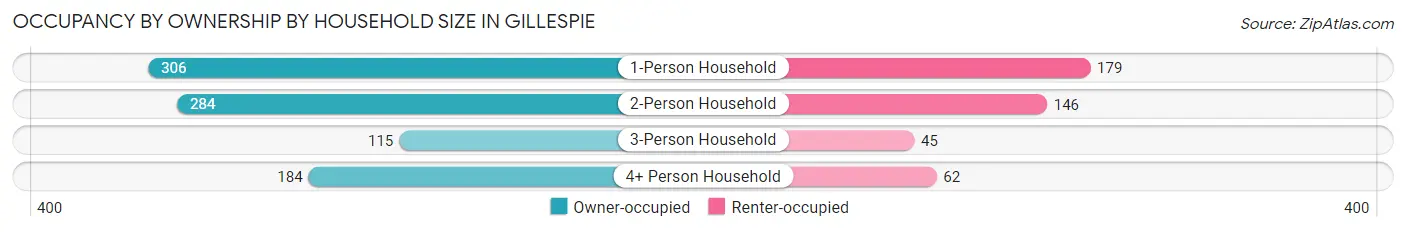
| Household Size | Owner-occupied | Renter-occupied |
| 1-Person Household | 306 (63.1%) | 179 (36.9%) |
| 2-Person Household | 284 (66.0%) | 146 (34.0%) |
| 3-Person Household | 115 (71.9%) | 45 (28.1%) |
| 4+ Person Household | 184 (74.8%) | 62 (25.2%) |
| Total Housing Units | 889 (67.3%) | 432 (32.7%) |
Occupancy by Educational Attainment in Gillespie
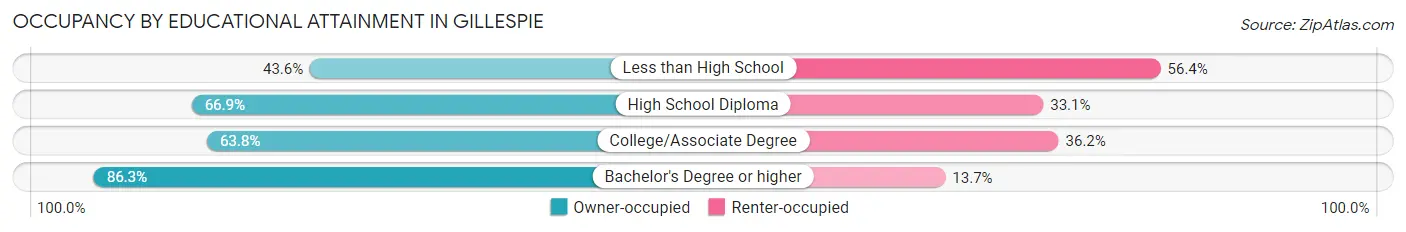
| Household Size | Owner-occupied | Renter-occupied |
| Less than High School | 58 (43.6%) | 75 (56.4%) |
| High School Diploma | 341 (66.9%) | 169 (33.1%) |
| College/Associate Degree | 270 (63.8%) | 153 (36.2%) |
| Bachelor's Degree or higher | 220 (86.3%) | 35 (13.7%) |
Occupancy by Age of Householder in Gillespie
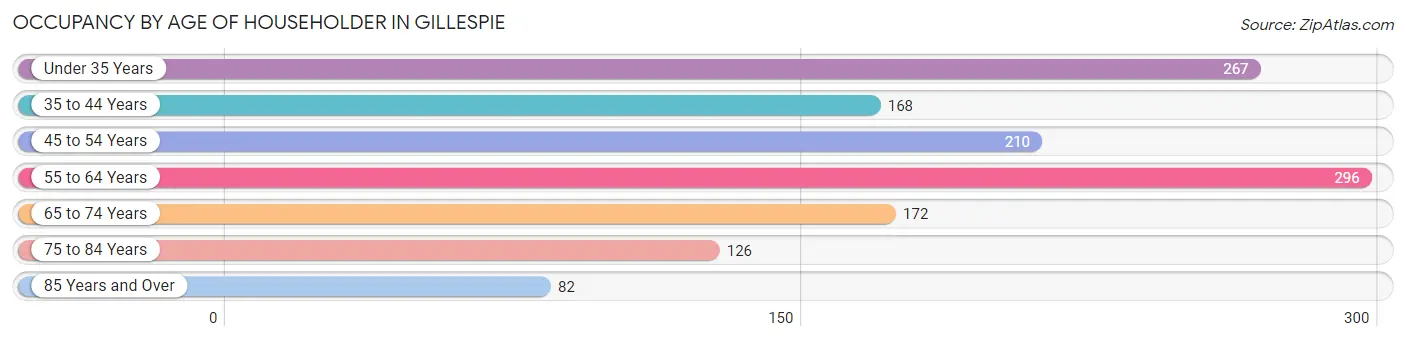
| Age Bracket | # Households | % Households |
| Under 35 Years | 267 | 20.2% |
| 35 to 44 Years | 168 | 12.7% |
| 45 to 54 Years | 210 | 15.9% |
| 55 to 64 Years | 296 | 22.4% |
| 65 to 74 Years | 172 | 13.0% |
| 75 to 84 Years | 126 | 9.5% |
| 85 Years and Over | 82 | 6.2% |
| Total | 1,321 | 100.0% |
Housing Finances in Gillespie
Median Income by Occupancy in Gillespie
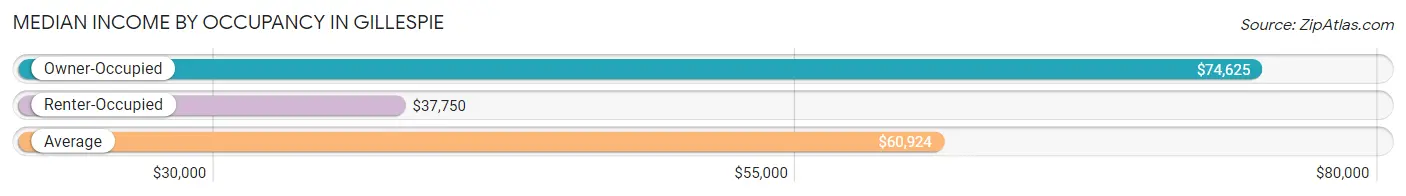
| Occupancy Type | # Households | Median Income |
| Owner-Occupied | 889 (67.3%) | $74,625 |
| Renter-Occupied | 432 (32.7%) | $37,750 |
| Average | 1,321 (100.0%) | $60,924 |
Occupancy by Householder Income Bracket in Gillespie
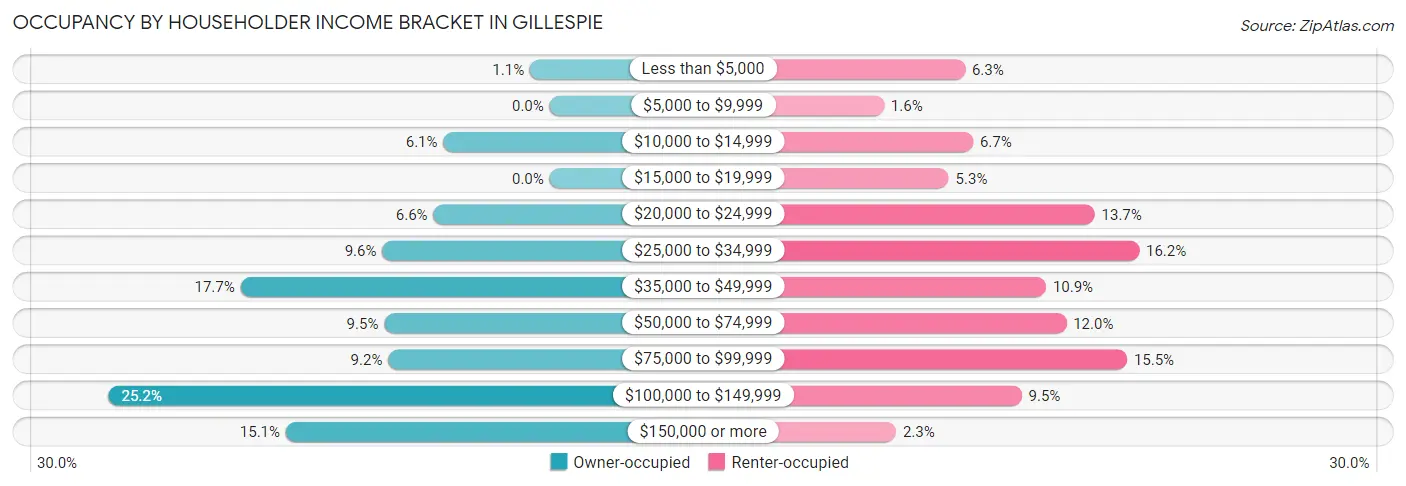
| Income Bracket | Owner-occupied | Renter-occupied |
| Less than $5,000 | 10 (1.1%) | 27 (6.2%) |
| $5,000 to $9,999 | 0 (0.0%) | 7 (1.6%) |
| $10,000 to $14,999 | 54 (6.1%) | 29 (6.7%) |
| $15,000 to $19,999 | 0 (0.0%) | 23 (5.3%) |
| $20,000 to $24,999 | 59 (6.6%) | 59 (13.7%) |
| $25,000 to $34,999 | 85 (9.6%) | 70 (16.2%) |
| $35,000 to $49,999 | 157 (17.7%) | 47 (10.9%) |
| $50,000 to $74,999 | 84 (9.5%) | 52 (12.0%) |
| $75,000 to $99,999 | 82 (9.2%) | 67 (15.5%) |
| $100,000 to $149,999 | 224 (25.2%) | 41 (9.5%) |
| $150,000 or more | 134 (15.1%) | 10 (2.3%) |
| Total | 889 (100.0%) | 432 (100.0%) |
Monthly Housing Cost Tiers in Gillespie
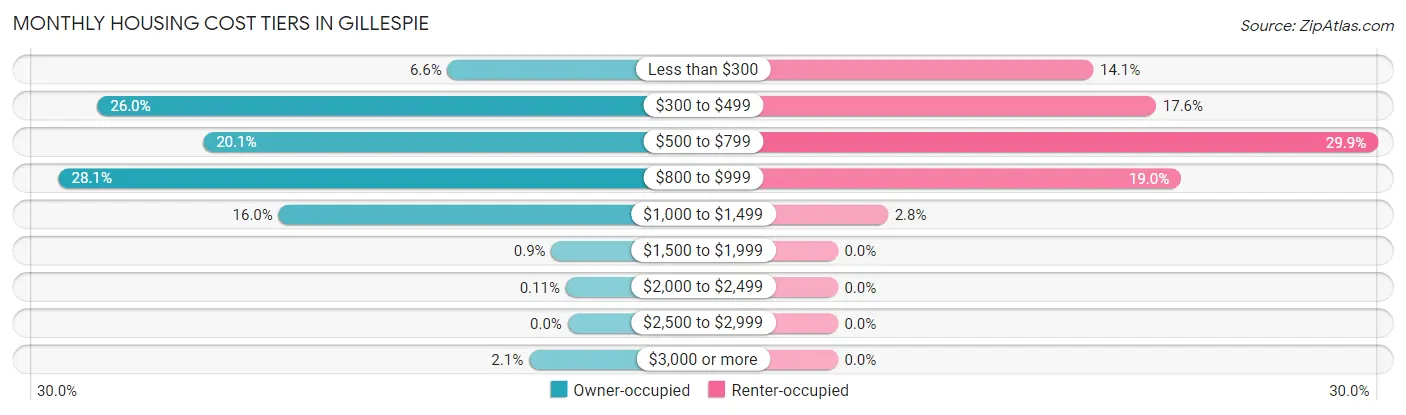
| Monthly Cost | Owner-occupied | Renter-occupied |
| Less than $300 | 59 (6.6%) | 61 (14.1%) |
| $300 to $499 | 231 (26.0%) | 76 (17.6%) |
| $500 to $799 | 179 (20.1%) | 129 (29.9%) |
| $800 to $999 | 250 (28.1%) | 82 (19.0%) |
| $1,000 to $1,499 | 142 (16.0%) | 12 (2.8%) |
| $1,500 to $1,999 | 8 (0.9%) | 0 (0.0%) |
| $2,000 to $2,499 | 1 (0.1%) | 0 (0.0%) |
| $2,500 to $2,999 | 0 (0.0%) | 0 (0.0%) |
| $3,000 or more | 19 (2.1%) | 0 (0.0%) |
| Total | 889 (100.0%) | 432 (100.0%) |
Physical Housing Characteristics in Gillespie
Housing Structures in Gillespie
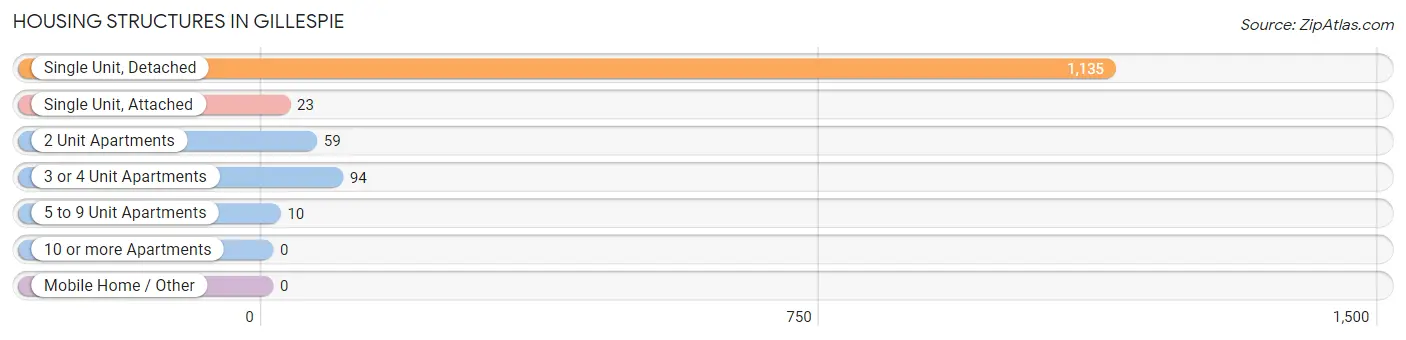
| Structure Type | # Housing Units | % Housing Units |
| Single Unit, Detached | 1,135 | 85.9% |
| Single Unit, Attached | 23 | 1.7% |
| 2 Unit Apartments | 59 | 4.5% |
| 3 or 4 Unit Apartments | 94 | 7.1% |
| 5 to 9 Unit Apartments | 10 | 0.8% |
| 10 or more Apartments | 0 | 0.0% |
| Mobile Home / Other | 0 | 0.0% |
| Total | 1,321 | 100.0% |
Housing Structures by Occupancy in Gillespie
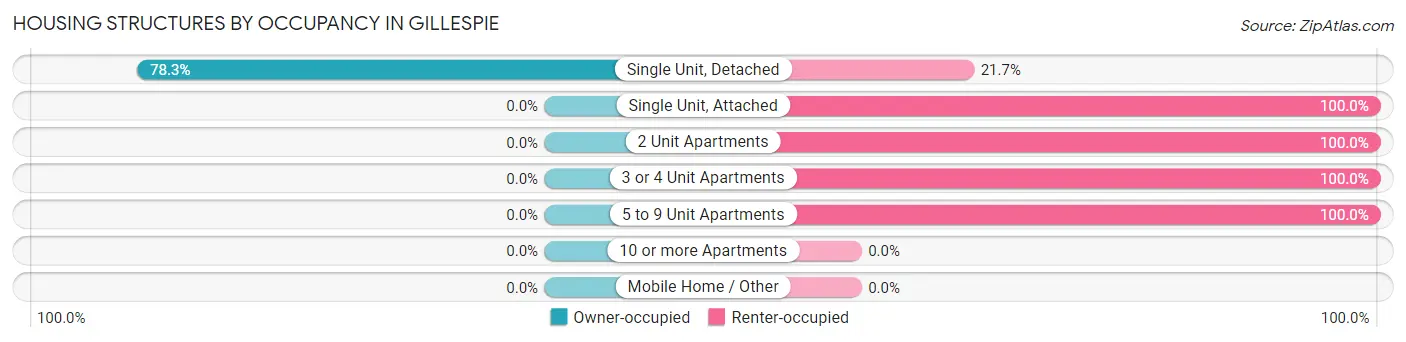
| Structure Type | Owner-occupied | Renter-occupied |
| Single Unit, Detached | 889 (78.3%) | 246 (21.7%) |
| Single Unit, Attached | 0 (0.0%) | 23 (100.0%) |
| 2 Unit Apartments | 0 (0.0%) | 59 (100.0%) |
| 3 or 4 Unit Apartments | 0 (0.0%) | 94 (100.0%) |
| 5 to 9 Unit Apartments | 0 (0.0%) | 10 (100.0%) |
| 10 or more Apartments | 0 (0.0%) | 0 (0.0%) |
| Mobile Home / Other | 0 (0.0%) | 0 (0.0%) |
| Total | 889 (67.3%) | 432 (32.7%) |
Housing Structures by Number of Rooms in Gillespie
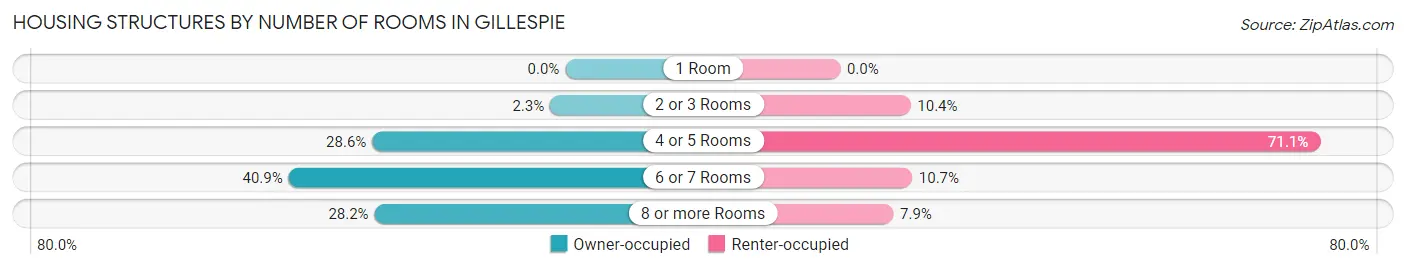
| Number of Rooms | Owner-occupied | Renter-occupied |
| 1 Room | 0 (0.0%) | 0 (0.0%) |
| 2 or 3 Rooms | 20 (2.2%) | 45 (10.4%) |
| 4 or 5 Rooms | 254 (28.6%) | 307 (71.1%) |
| 6 or 7 Rooms | 364 (40.9%) | 46 (10.6%) |
| 8 or more Rooms | 251 (28.2%) | 34 (7.9%) |
| Total | 889 (100.0%) | 432 (100.0%) |
Housing Structure by Heating Type in Gillespie
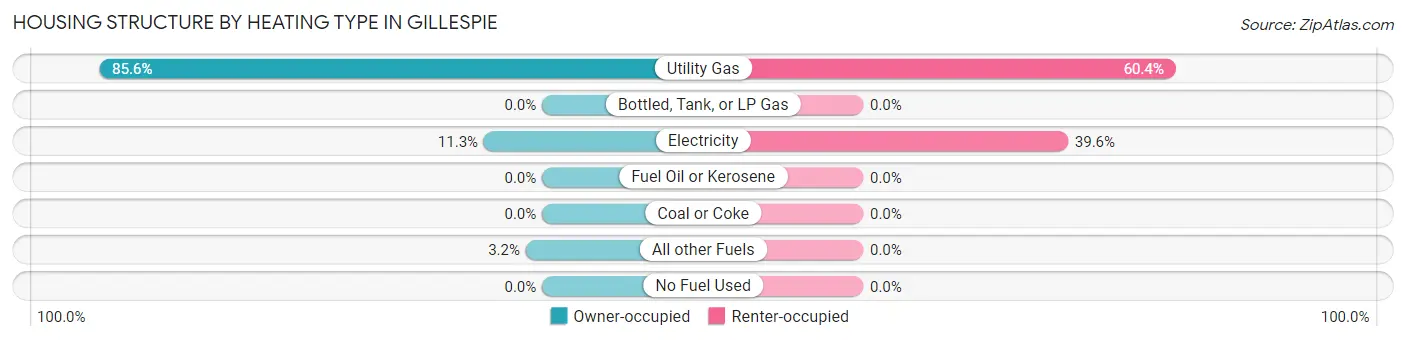
| Heating Type | Owner-occupied | Renter-occupied |
| Utility Gas | 761 (85.6%) | 261 (60.4%) |
| Bottled, Tank, or LP Gas | 0 (0.0%) | 0 (0.0%) |
| Electricity | 100 (11.3%) | 171 (39.6%) |
| Fuel Oil or Kerosene | 0 (0.0%) | 0 (0.0%) |
| Coal or Coke | 0 (0.0%) | 0 (0.0%) |
| All other Fuels | 28 (3.2%) | 0 (0.0%) |
| No Fuel Used | 0 (0.0%) | 0 (0.0%) |
| Total | 889 (100.0%) | 432 (100.0%) |
Household Vehicle Usage in Gillespie
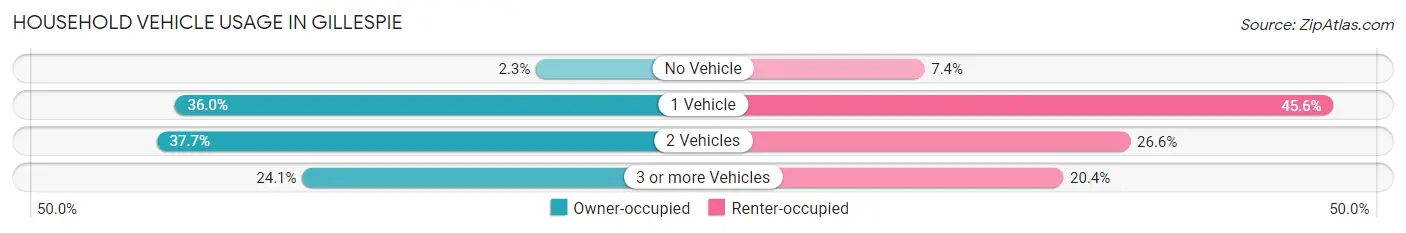
| Vehicles per Household | Owner-occupied | Renter-occupied |
| No Vehicle | 20 (2.2%) | 32 (7.4%) |
| 1 Vehicle | 320 (36.0%) | 197 (45.6%) |
| 2 Vehicles | 335 (37.7%) | 115 (26.6%) |
| 3 or more Vehicles | 214 (24.1%) | 88 (20.4%) |
| Total | 889 (100.0%) | 432 (100.0%) |
Real Estate & Mortgages in Gillespie
Real Estate and Mortgage Overview in Gillespie
| Characteristic | Without Mortgage | With Mortgage |
| Housing Units | 387 | 502 |
| Median Property Value | $100,500 | $86,600 |
| Median Household Income | $43,935 | $93 |
| Monthly Housing Costs | $428 | $19 |
| Real Estate Taxes | $1,367 | $28 |
Property Value by Mortgage Status in Gillespie
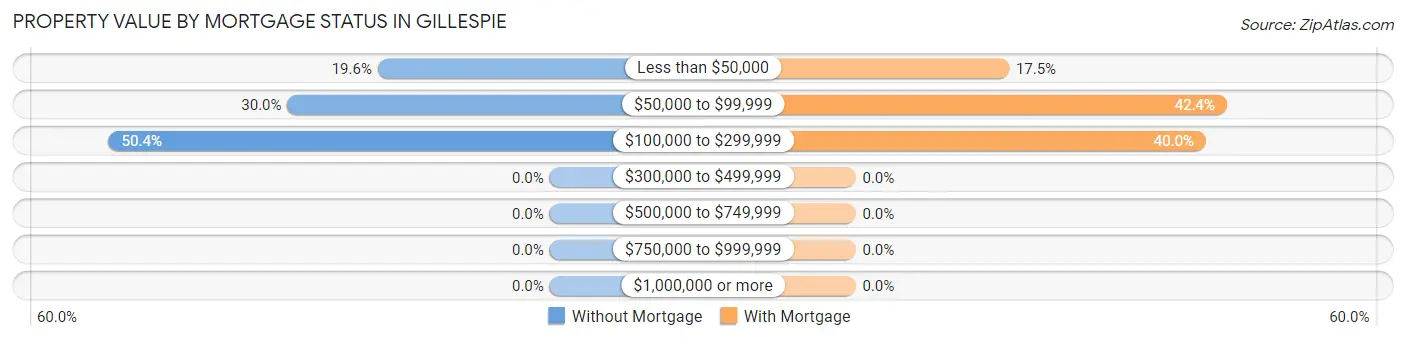
| Property Value | Without Mortgage | With Mortgage |
| Less than $50,000 | 76 (19.6%) | 88 (17.5%) |
| $50,000 to $99,999 | 116 (30.0%) | 213 (42.4%) |
| $100,000 to $299,999 | 195 (50.4%) | 201 (40.0%) |
| $300,000 to $499,999 | 0 (0.0%) | 0 (0.0%) |
| $500,000 to $749,999 | 0 (0.0%) | 0 (0.0%) |
| $750,000 to $999,999 | 0 (0.0%) | 0 (0.0%) |
| $1,000,000 or more | 0 (0.0%) | 0 (0.0%) |
| Total | 387 (100.0%) | 502 (100.0%) |
Household Income by Mortgage Status in Gillespie
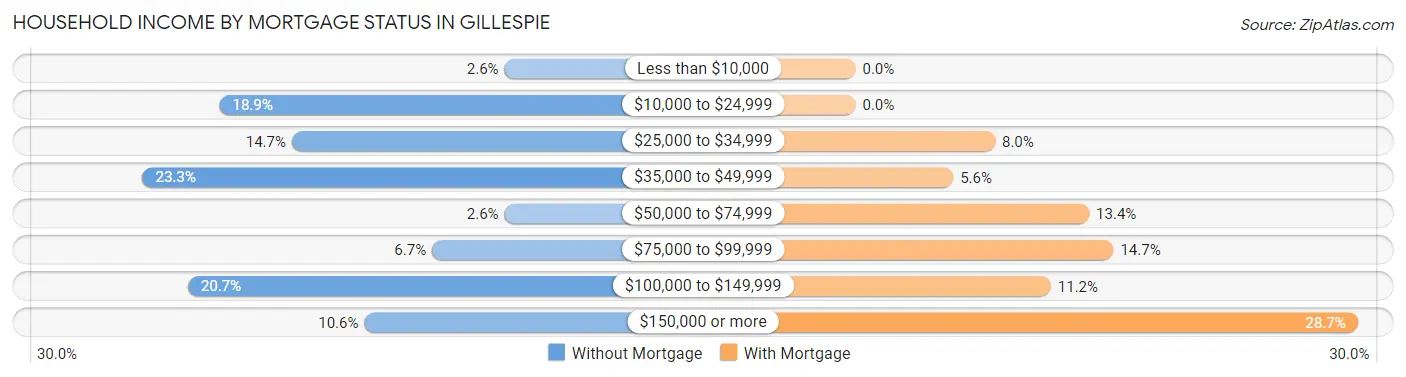
| Household Income | Without Mortgage | With Mortgage |
| Less than $10,000 | 10 (2.6%) | 0 (0.0%) |
| $10,000 to $24,999 | 73 (18.9%) | 0 (0.0%) |
| $25,000 to $34,999 | 57 (14.7%) | 40 (8.0%) |
| $35,000 to $49,999 | 90 (23.3%) | 28 (5.6%) |
| $50,000 to $74,999 | 10 (2.6%) | 67 (13.4%) |
| $75,000 to $99,999 | 26 (6.7%) | 74 (14.7%) |
| $100,000 to $149,999 | 80 (20.7%) | 56 (11.2%) |
| $150,000 or more | 41 (10.6%) | 144 (28.7%) |
| Total | 387 (100.0%) | 502 (100.0%) |
Property Value to Household Income Ratio in Gillespie
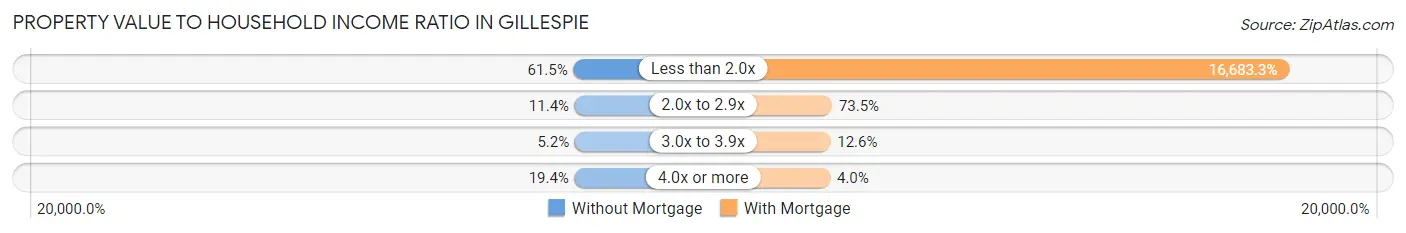
| Value-to-Income Ratio | Without Mortgage | With Mortgage |
| Less than 2.0x | 238 (61.5%) | 83,750 (16,683.3%) |
| 2.0x to 2.9x | 44 (11.4%) | 369 (73.5%) |
| 3.0x to 3.9x | 20 (5.2%) | 63 (12.6%) |
| 4.0x or more | 75 (19.4%) | 20 (4.0%) |
| Total | 387 (100.0%) | 502 (100.0%) |
Real Estate Taxes by Mortgage Status in Gillespie
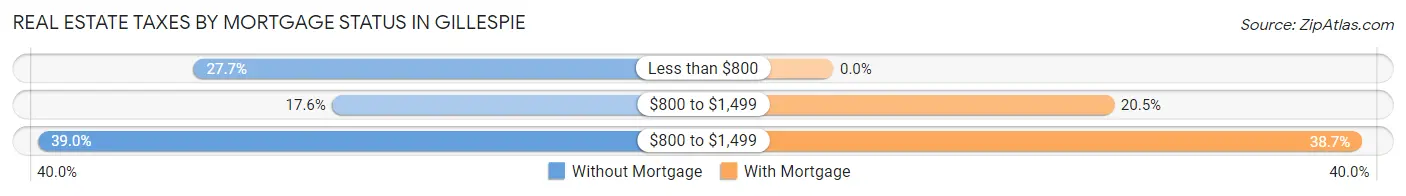
| Property Taxes | Without Mortgage | With Mortgage |
| Less than $800 | 107 (27.7%) | 0 (0.0%) |
| $800 to $1,499 | 68 (17.6%) | 103 (20.5%) |
| $800 to $1,499 | 151 (39.0%) | 194 (38.7%) |
| Total | 387 (100.0%) | 502 (100.0%) |
Health & Disability in Gillespie
Health Insurance Coverage by Age in Gillespie
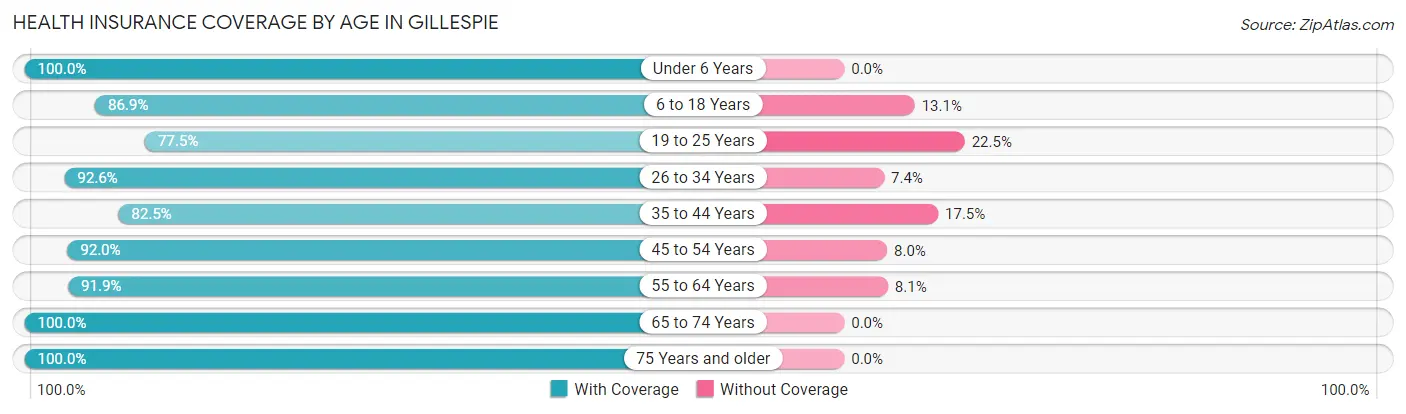
| Age Bracket | With Coverage | Without Coverage |
| Under 6 Years | 302 (100.0%) | 0 (0.0%) |
| 6 to 18 Years | 423 (86.9%) | 64 (13.1%) |
| 19 to 25 Years | 183 (77.5%) | 53 (22.5%) |
| 26 to 34 Years | 386 (92.6%) | 31 (7.4%) |
| 35 to 44 Years | 198 (82.5%) | 42 (17.5%) |
| 45 to 54 Years | 473 (92.0%) | 41 (8.0%) |
| 55 to 64 Years | 373 (91.9%) | 33 (8.1%) |
| 65 to 74 Years | 301 (100.0%) | 0 (0.0%) |
| 75 Years and older | 290 (100.0%) | 0 (0.0%) |
| Total | 2,929 (91.7%) | 264 (8.3%) |
Health Insurance Coverage by Citizenship Status in Gillespie
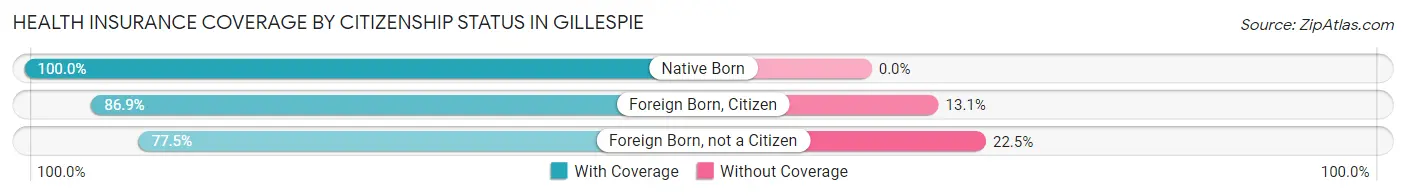
| Citizenship Status | With Coverage | Without Coverage |
| Native Born | 302 (100.0%) | 0 (0.0%) |
| Foreign Born, Citizen | 423 (86.9%) | 64 (13.1%) |
| Foreign Born, not a Citizen | 183 (77.5%) | 53 (22.5%) |
Health Insurance Coverage by Household Income in Gillespie
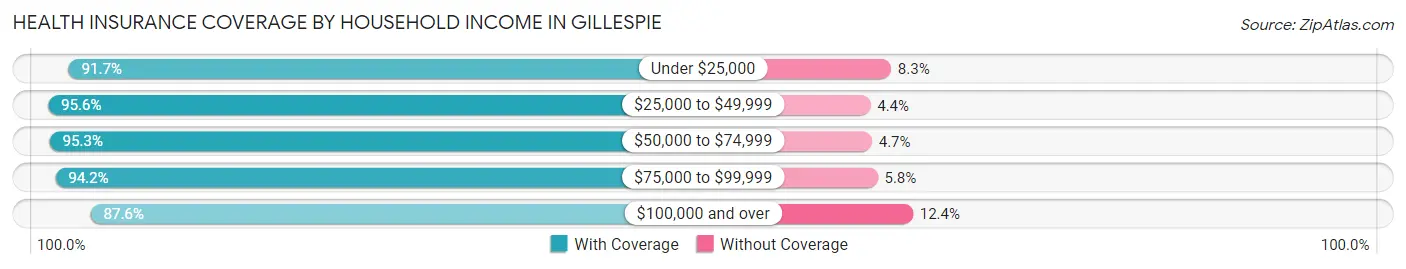
| Household Income | With Coverage | Without Coverage |
| Under $25,000 | 444 (91.7%) | 40 (8.3%) |
| $25,000 to $49,999 | 673 (95.6%) | 31 (4.4%) |
| $50,000 to $74,999 | 326 (95.3%) | 16 (4.7%) |
| $75,000 to $99,999 | 409 (94.2%) | 25 (5.8%) |
| $100,000 and over | 1,077 (87.6%) | 152 (12.4%) |
Public vs Private Health Insurance Coverage by Age in Gillespie
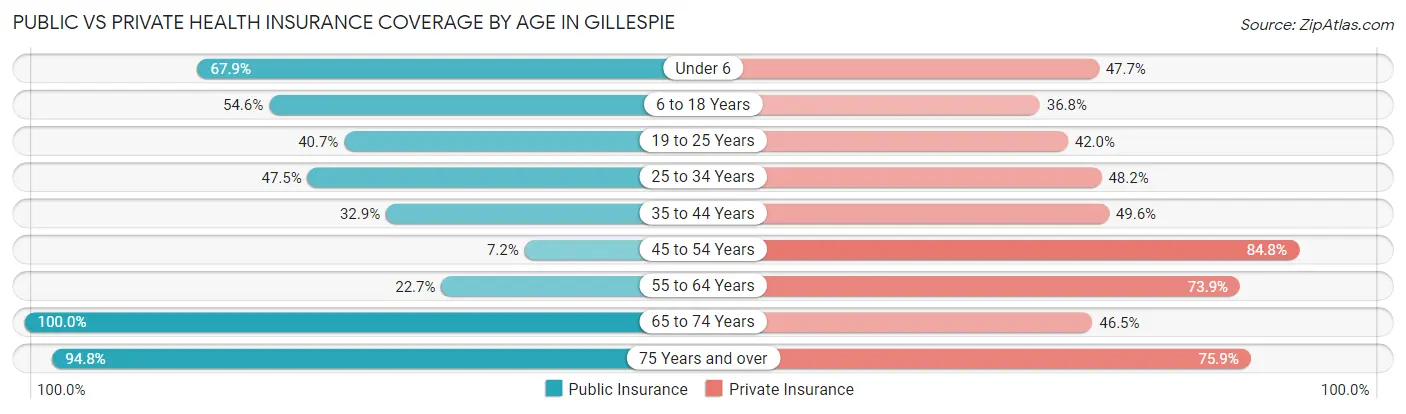
| Age Bracket | Public Insurance | Private Insurance |
| Under 6 | 205 (67.9%) | 144 (47.7%) |
| 6 to 18 Years | 266 (54.6%) | 179 (36.8%) |
| 19 to 25 Years | 96 (40.7%) | 99 (41.9%) |
| 25 to 34 Years | 198 (47.5%) | 201 (48.2%) |
| 35 to 44 Years | 79 (32.9%) | 119 (49.6%) |
| 45 to 54 Years | 37 (7.2%) | 436 (84.8%) |
| 55 to 64 Years | 92 (22.7%) | 300 (73.9%) |
| 65 to 74 Years | 301 (100.0%) | 140 (46.5%) |
| 75 Years and over | 275 (94.8%) | 220 (75.9%) |
| Total | 1,549 (48.5%) | 1,838 (57.6%) |
Disability Status by Sex by Age in Gillespie
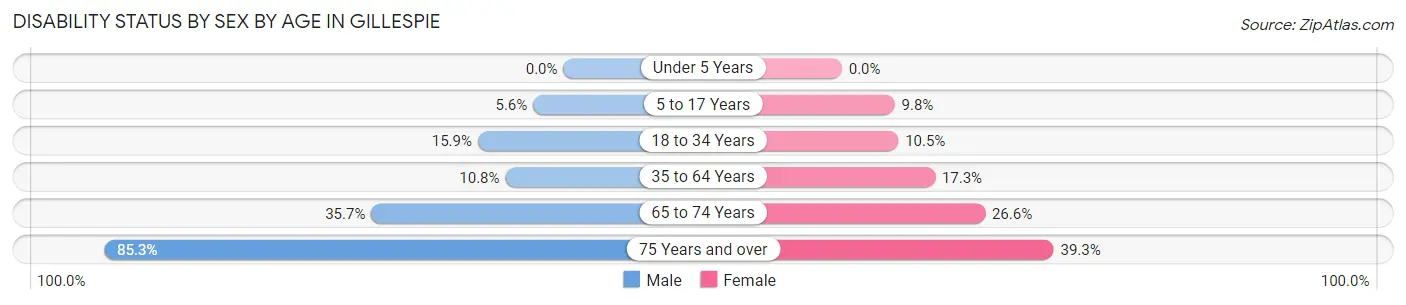
| Age Bracket | Male | Female |
| Under 5 Years | 0 (0.0%) | 0 (0.0%) |
| 5 to 17 Years | 17 (5.6%) | 15 (9.8%) |
| 18 to 34 Years | 54 (15.9%) | 36 (10.5%) |
| 35 to 64 Years | 62 (10.8%) | 101 (17.3%) |
| 65 to 74 Years | 51 (35.7%) | 42 (26.6%) |
| 75 Years and over | 52 (85.3%) | 90 (39.3%) |
Disability Class by Sex by Age in Gillespie
Disability Class: Hearing Difficulty
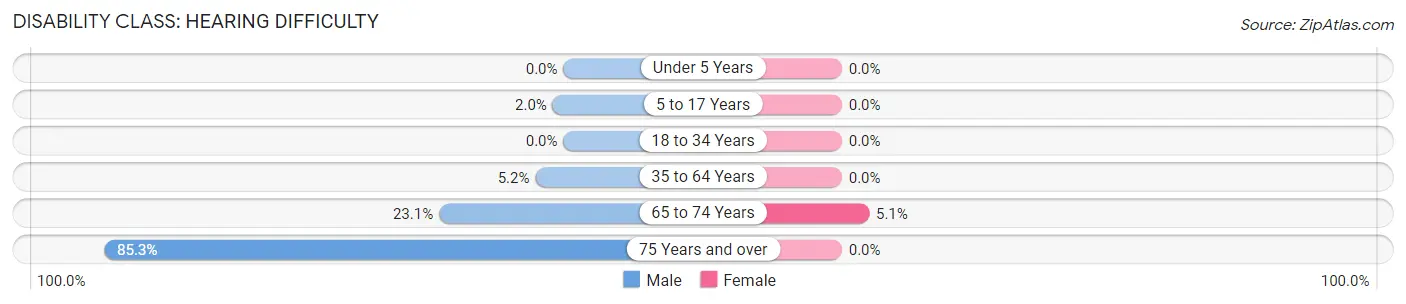
| Age Bracket | Male | Female |
| Under 5 Years | 0 (0.0%) | 0 (0.0%) |
| 5 to 17 Years | 6 (2.0%) | 0 (0.0%) |
| 18 to 34 Years | 0 (0.0%) | 0 (0.0%) |
| 35 to 64 Years | 30 (5.2%) | 0 (0.0%) |
| 65 to 74 Years | 33 (23.1%) | 8 (5.1%) |
| 75 Years and over | 52 (85.3%) | 0 (0.0%) |
Disability Class: Vision Difficulty
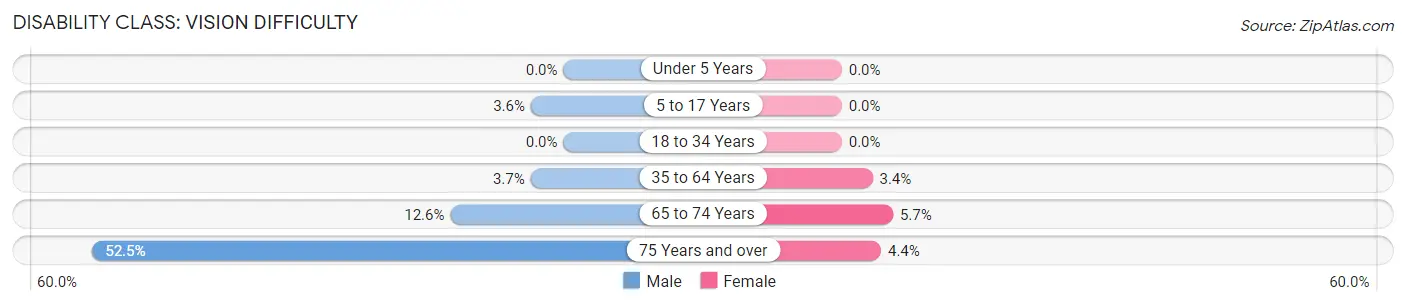
| Age Bracket | Male | Female |
| Under 5 Years | 0 (0.0%) | 0 (0.0%) |
| 5 to 17 Years | 11 (3.6%) | 0 (0.0%) |
| 18 to 34 Years | 0 (0.0%) | 0 (0.0%) |
| 35 to 64 Years | 21 (3.6%) | 20 (3.4%) |
| 65 to 74 Years | 18 (12.6%) | 9 (5.7%) |
| 75 Years and over | 32 (52.5%) | 10 (4.4%) |
Disability Class: Cognitive Difficulty
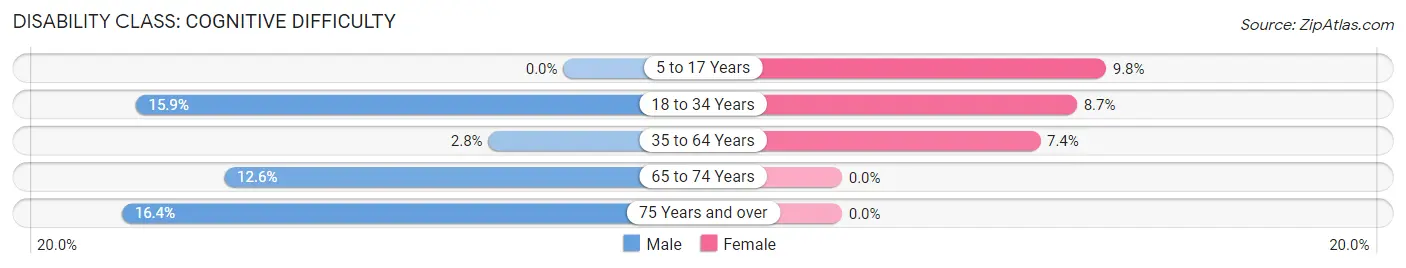
| Age Bracket | Male | Female |
| 5 to 17 Years | 0 (0.0%) | 15 (9.8%) |
| 18 to 34 Years | 54 (15.9%) | 30 (8.7%) |
| 35 to 64 Years | 16 (2.8%) | 43 (7.4%) |
| 65 to 74 Years | 18 (12.6%) | 0 (0.0%) |
| 75 Years and over | 10 (16.4%) | 0 (0.0%) |
Disability Class: Ambulatory Difficulty
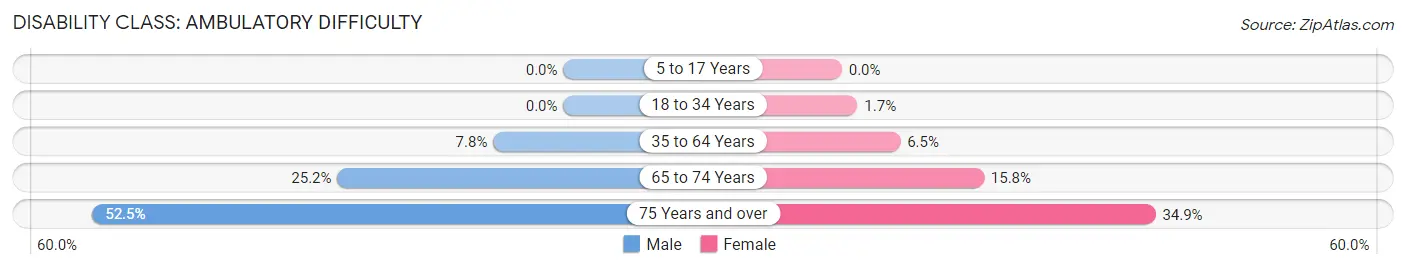
| Age Bracket | Male | Female |
| 5 to 17 Years | 0 (0.0%) | 0 (0.0%) |
| 18 to 34 Years | 0 (0.0%) | 6 (1.7%) |
| 35 to 64 Years | 45 (7.8%) | 38 (6.5%) |
| 65 to 74 Years | 36 (25.2%) | 25 (15.8%) |
| 75 Years and over | 32 (52.5%) | 80 (34.9%) |
Disability Class: Self-Care Difficulty
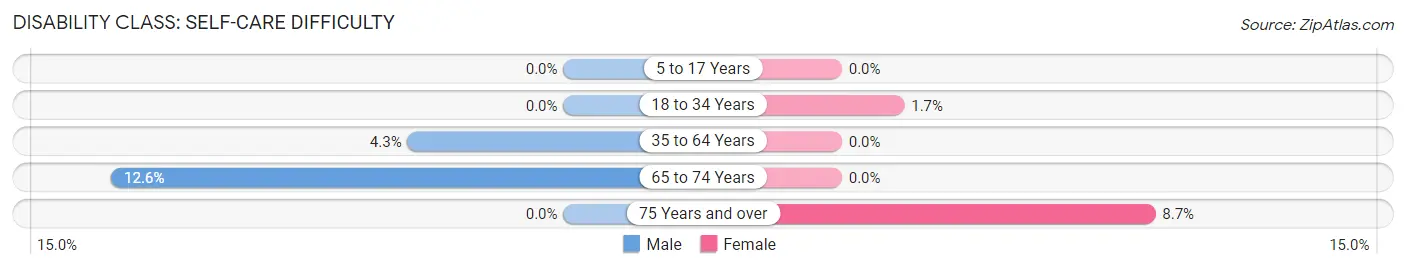
| Age Bracket | Male | Female |
| 5 to 17 Years | 0 (0.0%) | 0 (0.0%) |
| 18 to 34 Years | 0 (0.0%) | 6 (1.7%) |
| 35 to 64 Years | 25 (4.3%) | 0 (0.0%) |
| 65 to 74 Years | 18 (12.6%) | 0 (0.0%) |
| 75 Years and over | 0 (0.0%) | 20 (8.7%) |
Technology Access in Gillespie
Computing Device Access in Gillespie
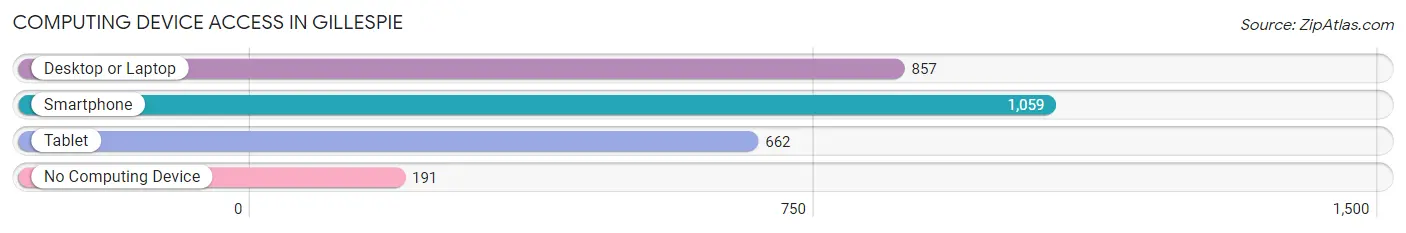
| Device Type | # Households | % Households |
| Desktop or Laptop | 857 | 64.9% |
| Smartphone | 1,059 | 80.2% |
| Tablet | 662 | 50.1% |
| No Computing Device | 191 | 14.5% |
| Total | 1,321 | 100.0% |
Internet Access in Gillespie
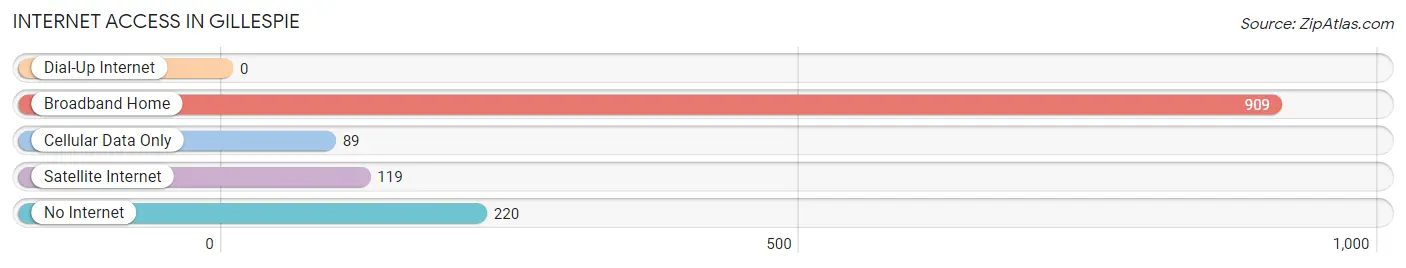
| Internet Type | # Households | % Households |
| Dial-Up Internet | 0 | 0.0% |
| Broadband Home | 909 | 68.8% |
| Cellular Data Only | 89 | 6.7% |
| Satellite Internet | 119 | 9.0% |
| No Internet | 220 | 16.7% |
| Total | 1,321 | 100.0% |
Gillespie Summary
Gillespie is a small city located in Macoupin County, Illinois. It is situated in the southwestern part of the state, about 25 miles northeast of St. Louis, Missouri. The city has a population of 4,719 people, according to the 2010 census.
History
Gillespie was founded in 1854 by William Gillespie, a former soldier in the Black Hawk War. He named the city after himself and it was incorporated in 1858. The city was originally a farming community, but it soon developed into a coal mining town. The coal industry was the main source of employment for the city until the 1950s, when the mines began to close.
Geography
Gillespie is located in the southwestern part of Illinois, about 25 miles northeast of St. Louis, Missouri. The city is situated in the Macoupin County, which is part of the Metro-East region of the state. The city is located on the banks of the Macoupin Creek, which flows through the city. The city has a total area of 2.2 square miles, all of which is land.
Economy
Gillespie’s economy is largely based on agriculture and manufacturing. The city is home to several manufacturing companies, including a plastics plant, a metal fabrication plant, and a food processing plant. The city also has a number of small businesses, including restaurants, retail stores, and service providers.
Demographics
According to the 2010 census, Gillespie has a population of 4,719 people. The racial makeup of the city is 97.2% White, 0.7% African American, 0.3% Native American, 0.3% Asian, 0.1% Pacific Islander, 0.5% from other races, and 1.0% from two or more races. The median household income in Gillespie is $41,944, and the median age is 40.3 years.
Conclusion
Gillespie is a small city located in Macoupin County, Illinois. It was founded in 1854 and was originally a farming community, but it soon developed into a coal mining town. The city’s economy is largely based on agriculture and manufacturing, and it has a population of 4,719 people, according to the 2010 census. Gillespie is a diverse city with a median household income of $41,944 and a median age of 40.3 years.
Common Questions
What is Per Capita Income in Gillespie?
Per Capita income in Gillespie is $32,553.
What is the Median Family Income in Gillespie?
Median Family Income in Gillespie is $73,092.
What is the Median Household income in Gillespie?
Median Household Income in Gillespie is $60,924.
What is Income or Wage Gap in Gillespie?
Income or Wage Gap in Gillespie is 58.1%.
Women in Gillespie earn 41.9 cents for every dollar earned by a man.
What is Inequality or Gini Index in Gillespie?
Inequality or Gini Index in Gillespie is 0.41.
What is the Total Population of Gillespie?
Total Population of Gillespie is 3,193.
What is the Total Male Population of Gillespie?
Total Male Population of Gillespie is 1,601.
What is the Total Female Population of Gillespie?
Total Female Population of Gillespie is 1,592.
What is the Ratio of Males per 100 Females in Gillespie?
There are 100.57 Males per 100 Females in Gillespie.
What is the Ratio of Females per 100 Males in Gillespie?
There are 99.44 Females per 100 Males in Gillespie.
What is the Median Population Age in Gillespie?
Median Population Age in Gillespie is 41.8 Years.
What is the Average Family Size in Gillespie
Average Family Size in Gillespie is 3.1 People.
What is the Average Household Size in Gillespie
Average Household Size in Gillespie is 2.4 People.
How Large is the Labor Force in Gillespie?
There are 1,515 People in the Labor Forcein in Gillespie.
What is the Percentage of People in the Labor Force in Gillespie?
61.7% of People are in the Labor Force in Gillespie.
What is the Unemployment Rate in Gillespie?
Unemployment Rate in Gillespie is 5.1%.