Cities with the Highest Percentage of Blackfeet Population in Washington
RELATED REPORTS & OPTIONS
Blackfeet
Washington
Compare Cities
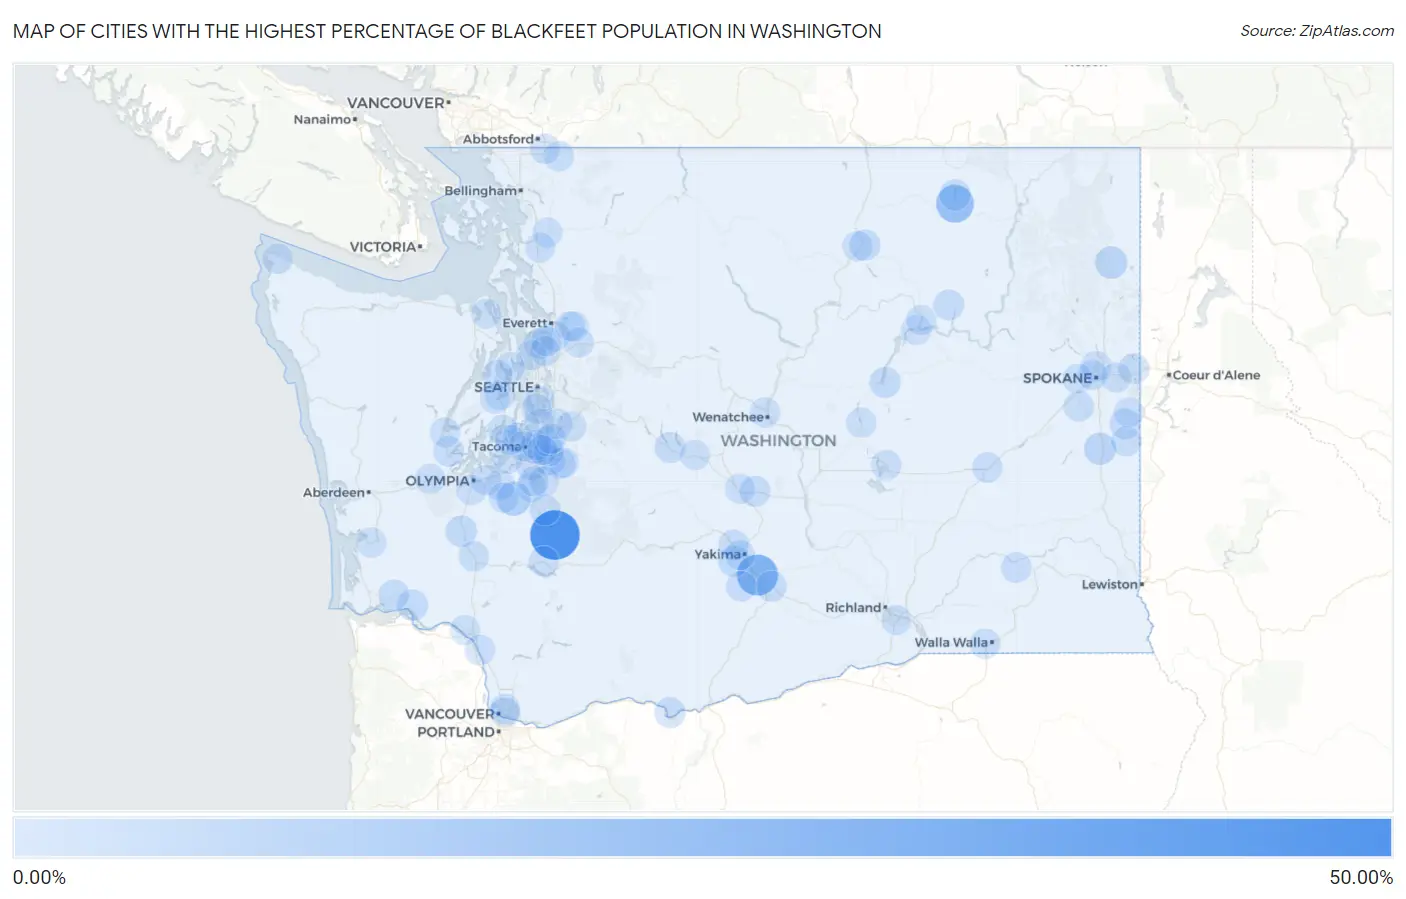
Map of Cities with the Highest Percentage of Blackfeet Population in Washington
0.00%
50.00%
Cities with the Highest Percentage of Blackfeet Population in Washington
| City | Blackfeet | vs State | vs National | |
| 1. | Mineral | 43.48% | 0.17%(+43.3)#1 | 0.062%(+43.4)#11 |
| 2. | Donald | 23.81% | 0.17%(+23.6)#2 | 0.062%(+23.7)#17 |
| 3. | Torboy | 16.74% | 0.17%(+16.6)#3 | 0.062%(+16.7)#23 |
| 4. | Mckenna | 8.30% | 0.17%(+8.14)#4 | 0.062%(+8.24)#49 |
| 5. | Cusick | 4.86% | 0.17%(+4.70)#5 | 0.062%(+4.80)#88 |
| 6. | Rosalia | 4.34% | 0.17%(+4.17)#6 | 0.062%(+4.28)#99 |
| 7. | Fords Prairie | 3.03% | 0.17%(+2.86)#7 | 0.062%(+2.96)#143 |
| 8. | Curlew Lake | 2.56% | 0.17%(+2.40)#8 | 0.062%(+2.50)#165 |
| 9. | Skamokawa Valley | 2.43% | 0.17%(+2.26)#9 | 0.062%(+2.37)#176 |
| 10. | Banks Lake South | 2.03% | 0.17%(+1.86)#10 | 0.062%(+1.97)#220 |
| 11. | Ahtanum | 2.03% | 0.17%(+1.86)#11 | 0.062%(+1.97)#221 |
| 12. | North Omak | 2.03% | 0.17%(+1.86)#12 | 0.062%(+1.96)#222 |
| 13. | Fairfield | 1.95% | 0.17%(+1.79)#13 | 0.062%(+1.89)#231 |
| 14. | Kittitas | 1.95% | 0.17%(+1.79)#14 | 0.062%(+1.89)#232 |
| 15. | Easton | 1.83% | 0.17%(+1.66)#15 | 0.062%(+1.77)#252 |
| 16. | Zillah | 1.78% | 0.17%(+1.61)#16 | 0.062%(+1.71)#261 |
| 17. | Keller | 1.56% | 0.17%(+1.40)#17 | 0.062%(+1.50)#306 |
| 18. | Grays River | 1.56% | 0.17%(+1.39)#18 | 0.062%(+1.49)#311 |
| 19. | Dallesport | 1.54% | 0.17%(+1.38)#19 | 0.062%(+1.48)#314 |
| 20. | Otis Orchards East Farms | 1.53% | 0.17%(+1.36)#20 | 0.062%(+1.47)#320 |
| 21. | Gleed | 1.42% | 0.17%(+1.26)#21 | 0.062%(+1.36)#349 |
| 22. | Eatonville | 1.41% | 0.17%(+1.24)#22 | 0.062%(+1.34)#354 |
| 23. | Shelton | 1.30% | 0.17%(+1.13)#23 | 0.062%(+1.24)#385 |
| 24. | Town And Country | 1.01% | 0.17%(+0.845)#24 | 0.062%(+0.949)#478 |
| 25. | Starbuck | 1.00% | 0.17%(+0.834)#25 | 0.062%(+0.938)#486 |
| 26. | Rosedale | 0.94% | 0.17%(+0.770)#26 | 0.062%(+0.875)#517 |
| 27. | Prairie Ridge | 0.91% | 0.17%(+0.742)#27 | 0.062%(+0.846)#545 |
| 28. | Alderton | 0.89% | 0.17%(+0.727)#28 | 0.062%(+0.832)#559 |
| 29. | Kalama | 0.88% | 0.17%(+0.715)#29 | 0.062%(+0.819)#567 |
| 30. | Neah Bay | 0.83% | 0.17%(+0.666)#30 | 0.062%(+0.771)#597 |
| 31. | Clover Creek | 0.80% | 0.17%(+0.636)#31 | 0.062%(+0.741)#615 |
| 32. | Harrah | 0.78% | 0.17%(+0.615)#32 | 0.062%(+0.720)#634 |
| 33. | Peaceful Valley | 0.74% | 0.17%(+0.570)#33 | 0.062%(+0.675)#673 |
| 34. | Napavine | 0.71% | 0.17%(+0.540)#34 | 0.062%(+0.644)#704 |
| 35. | Prairie Heights | 0.68% | 0.17%(+0.515)#35 | 0.062%(+0.620)#722 |
| 36. | Nisqually Indian Community | 0.67% | 0.17%(+0.508)#36 | 0.062%(+0.613)#730 |
| 37. | Fife | 0.64% | 0.17%(+0.477)#37 | 0.062%(+0.581)#763 |
| 38. | Tanglewilde | 0.64% | 0.17%(+0.474)#38 | 0.062%(+0.578)#768 |
| 39. | Cheney | 0.63% | 0.17%(+0.464)#39 | 0.062%(+0.569)#780 |
| 40. | Latah | 0.60% | 0.17%(+0.429)#40 | 0.062%(+0.534)#820 |
| 41. | Ritzville | 0.58% | 0.17%(+0.411)#41 | 0.062%(+0.515)#841 |
| 42. | Fife Heights | 0.57% | 0.17%(+0.406)#42 | 0.062%(+0.511)#849 |
| 43. | Meadowdale | 0.57% | 0.17%(+0.401)#43 | 0.062%(+0.506)#854 |
| 44. | Cle Elum | 0.57% | 0.17%(+0.401)#44 | 0.062%(+0.506)#855 |
| 45. | Omak | 0.55% | 0.17%(+0.387)#45 | 0.062%(+0.492)#871 |
| 46. | Moses Lake | 0.55% | 0.17%(+0.382)#46 | 0.062%(+0.487)#878 |
| 47. | Woodway | 0.54% | 0.17%(+0.371)#47 | 0.062%(+0.475)#890 |
| 48. | Morton | 0.53% | 0.17%(+0.359)#48 | 0.062%(+0.464)#914 |
| 49. | Steilacoom | 0.51% | 0.17%(+0.343)#49 | 0.062%(+0.447)#935 |
| 50. | Soap Lake | 0.51% | 0.17%(+0.342)#50 | 0.062%(+0.446)#937 |
| 51. | Boulevard Park | 0.50% | 0.17%(+0.333)#51 | 0.062%(+0.437)#957 |
| 52. | Eastmont | 0.49% | 0.17%(+0.326)#52 | 0.062%(+0.430)#972 |
| 53. | Garrett | 0.48% | 0.17%(+0.314)#53 | 0.062%(+0.419)#992 |
| 54. | Ruston | 0.47% | 0.17%(+0.306)#54 | 0.062%(+0.411)#1,002 |
| 55. | South Creek | 0.47% | 0.17%(+0.303)#55 | 0.062%(+0.407)#1,005 |
| 56. | Silverdale | 0.45% | 0.17%(+0.284)#56 | 0.062%(+0.389)#1,032 |
| 57. | Des Moines | 0.45% | 0.17%(+0.284)#57 | 0.062%(+0.388)#1,033 |
| 58. | Crescent Bar | 0.44% | 0.17%(+0.278)#58 | 0.062%(+0.383)#1,044 |
| 59. | Graham | 0.44% | 0.17%(+0.277)#59 | 0.062%(+0.381)#1,048 |
| 60. | Longview | 0.43% | 0.17%(+0.266)#60 | 0.062%(+0.371)#1,072 |
| 61. | Suncrest | 0.43% | 0.17%(+0.264)#61 | 0.062%(+0.369)#1,078 |
| 62. | South Bend | 0.43% | 0.17%(+0.264)#62 | 0.062%(+0.369)#1,079 |
| 63. | Tacoma | 0.43% | 0.17%(+0.263)#63 | 0.062%(+0.368)#1,081 |
| 64. | Alderwood Manor | 0.41% | 0.17%(+0.242)#64 | 0.062%(+0.347)#1,120 |
| 65. | Port Hadlock Irondale | 0.39% | 0.17%(+0.225)#65 | 0.062%(+0.329)#1,157 |
| 66. | Grand Coulee | 0.39% | 0.17%(+0.221)#66 | 0.062%(+0.325)#1,162 |
| 67. | Spokane Valley | 0.38% | 0.17%(+0.213)#67 | 0.062%(+0.317)#1,186 |
| 68. | Yakima | 0.38% | 0.17%(+0.209)#68 | 0.062%(+0.314)#1,197 |
| 69. | Mccleary | 0.37% | 0.17%(+0.205)#69 | 0.062%(+0.309)#1,204 |
| 70. | Elmer City | 0.36% | 0.17%(+0.196)#70 | 0.062%(+0.301)#1,221 |
| 71. | Sumner | 0.36% | 0.17%(+0.193)#71 | 0.062%(+0.297)#1,228 |
| 72. | Sumas | 0.36% | 0.17%(+0.192)#72 | 0.062%(+0.296)#1,234 |
| 73. | Navy Yard City | 0.34% | 0.17%(+0.174)#73 | 0.062%(+0.279)#1,294 |
| 74. | Wenatchee | 0.34% | 0.17%(+0.173)#74 | 0.062%(+0.278)#1,297 |
| 75. | Snohomish | 0.33% | 0.17%(+0.159)#75 | 0.062%(+0.264)#1,342 |
| 76. | Airway Heights | 0.32% | 0.17%(+0.155)#76 | 0.062%(+0.260)#1,359 |
| 77. | Elk Plain | 0.32% | 0.17%(+0.150)#77 | 0.062%(+0.255)#1,376 |
| 78. | Skokomish | 0.31% | 0.17%(+0.144)#78 | 0.062%(+0.249)#1,393 |
| 79. | Algona | 0.31% | 0.17%(+0.140)#79 | 0.062%(+0.245)#1,412 |
| 80. | Sedro Woolley | 0.30% | 0.17%(+0.131)#80 | 0.062%(+0.235)#1,450 |
| 81. | Lake Stickney | 0.29% | 0.17%(+0.120)#81 | 0.062%(+0.225)#1,484 |
| 82. | Tumwater | 0.28% | 0.17%(+0.111)#82 | 0.062%(+0.216)#1,510 |
| 83. | Everett | 0.27% | 0.17%(+0.108)#83 | 0.062%(+0.213)#1,517 |
| 84. | Burien | 0.27% | 0.17%(+0.106)#84 | 0.062%(+0.210)#1,524 |
| 85. | Mount Vernon | 0.26% | 0.17%(+0.099)#85 | 0.062%(+0.203)#1,554 |
| 86. | Suquamish | 0.25% | 0.17%(+0.088)#86 | 0.062%(+0.193)#1,595 |
| 87. | Kent | 0.25% | 0.17%(+0.088)#87 | 0.062%(+0.192)#1,596 |
| 88. | Ellensburg | 0.25% | 0.17%(+0.086)#88 | 0.062%(+0.191)#1,603 |
| 89. | Yelm | 0.25% | 0.17%(+0.083)#89 | 0.062%(+0.188)#1,622 |
| 90. | Spokane | 0.25% | 0.17%(+0.080)#90 | 0.062%(+0.185)#1,638 |
| 91. | Edgewood | 0.23% | 0.17%(+0.068)#91 | 0.062%(+0.172)#1,679 |
| 92. | Wollochet | 0.23% | 0.17%(+0.067)#92 | 0.062%(+0.172)#1,680 |
| 93. | Minnehaha | 0.23% | 0.17%(+0.067)#93 | 0.062%(+0.172)#1,682 |
| 94. | Rockford | 0.23% | 0.17%(+0.066)#94 | 0.062%(+0.171)#1,684 |
| 95. | Kennewick | 0.23% | 0.17%(+0.064)#95 | 0.062%(+0.169)#1,693 |
| 96. | Auburn | 0.23% | 0.17%(+0.059)#96 | 0.062%(+0.164)#1,716 |
| 97. | Maple Valley | 0.22% | 0.17%(+0.053)#97 | 0.062%(+0.157)#1,747 |
| 98. | Monroe | 0.21% | 0.17%(+0.048)#98 | 0.062%(+0.152)#1,761 |
| 99. | Vancouver | 0.21% | 0.17%(+0.045)#99 | 0.062%(+0.150)#1,774 |
| 100. | Bremerton | 0.21% | 0.17%(+0.043)#100 | 0.062%(+0.148)#1,786 |
Common Questions
What are the Top 10 Cities with the Highest Percentage of Blackfeet Population in Washington?
Top 10 Cities with the Highest Percentage of Blackfeet Population in Washington are:
#1
43.48%
#2
23.81%
#3
16.74%
#4
8.30%
#5
4.86%
#6
4.34%
#7
3.03%
#8
2.56%
#9
2.43%
#10
2.03%
What city has the Highest Percentage of Blackfeet Population in Washington?
Mineral has the Highest Percentage of Blackfeet Population in Washington with 43.48%.
What is the Percentage of Blackfeet Population in the State of Washington?
Percentage of Blackfeet Population in Washington is 0.17%.
What is the Percentage of Blackfeet Population in the United States?
Percentage of Blackfeet Population in the United States is 0.062%.