Kane, IL Map & Demographics
Kane Map
Kane Overview
$23,411
PER CAPITA INCOME
$47,917
AVG FAMILY INCOME
$48,125
AVG HOUSEHOLD INCOME
31.9%
WAGE / INCOME GAP [ % ]
68.1¢/ $1
WAGE / INCOME GAP [ $ ]
0.41
INEQUALITY / GINI INDEX
227
TOTAL POPULATION
115
MALE POPULATION
112
FEMALE POPULATION
102.68
MALES / 100 FEMALES
97.39
FEMALES / 100 MALES
42.3
MEDIAN AGE
3.2
AVG FAMILY SIZE
2.7
AVG HOUSEHOLD SIZE
102
LABOR FORCE [ PEOPLE ]
50.2%
PERCENT IN LABOR FORCE
5.9%
UNEMPLOYMENT RATE
Kane Zip Codes
Kane Area Codes
Income in Kane
Income Overview in Kane
Per Capita Income in Kane is $23,411, while median incomes of families and households are $47,917 and $48,125 respectively.
| Characteristic | Number | Measure |
| Per Capita Income | 227 | $23,411 |
| Median Family Income | 46 | $47,917 |
| Mean Family Income | 46 | $51,304 |
| Median Household Income | 83 | $48,125 |
| Mean Household Income | 83 | $54,994 |
| Income Deficit | 46 | $0 |
| Wage / Income Gap (%) | 227 | 31.86% |
| Wage / Income Gap ($) | 227 | 68.14¢ per $1 |
| Gini / Inequality Index | 227 | 0.41 |
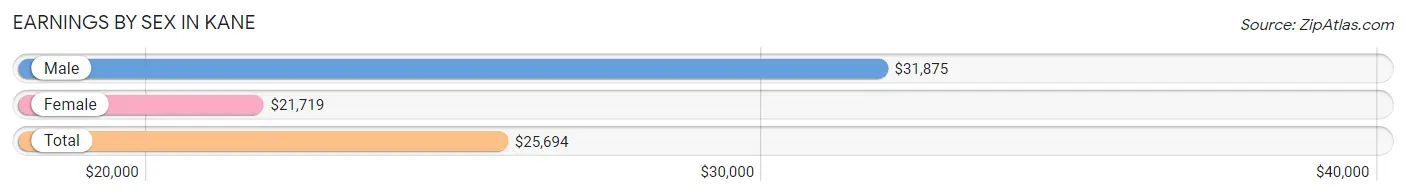
Earnings by Sex in Kane
Average Earnings in Kane are $25,694, $31,875 for men and $21,719 for women, a difference of 31.9%.
| Sex | Number | Average Earnings |
| Male | 48 (46.6%) | $31,875 |
| Female | 55 (53.4%) | $21,719 |
| Total | 103 (100.0%) | $25,694 |
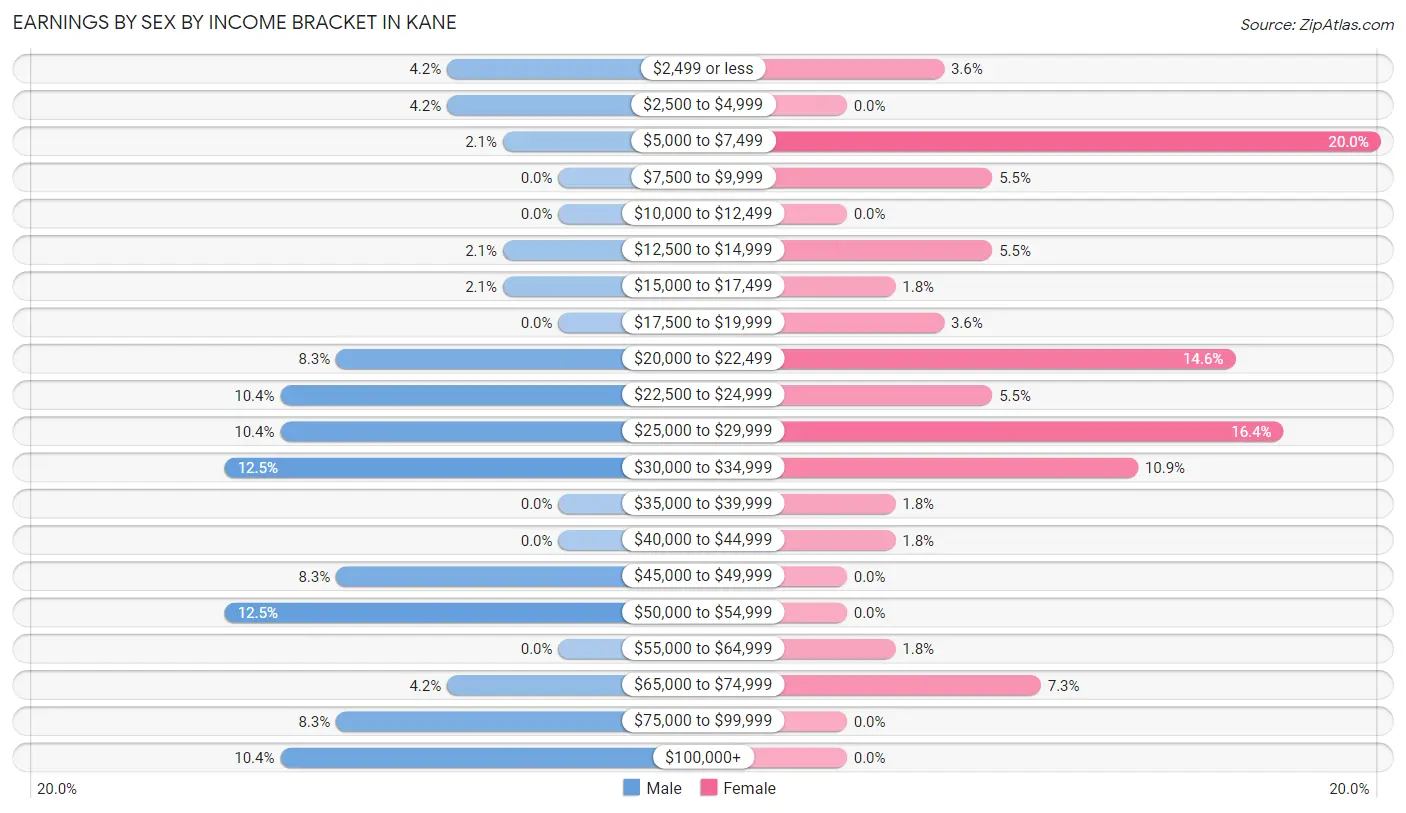
Earnings by Sex by Income Bracket in Kane
The most common earnings brackets in Kane are $30,000 to $34,999 for men (6 | 12.5%) and $5,000 to $7,499 for women (11 | 20.0%).
| Income | Male | Female |
| $2,499 or less | 2 (4.2%) | 2 (3.6%) |
| $2,500 to $4,999 | 2 (4.2%) | 0 (0.0%) |
| $5,000 to $7,499 | 1 (2.1%) | 11 (20.0%) |
| $7,500 to $9,999 | 0 (0.0%) | 3 (5.4%) |
| $10,000 to $12,499 | 0 (0.0%) | 0 (0.0%) |
| $12,500 to $14,999 | 1 (2.1%) | 3 (5.4%) |
| $15,000 to $17,499 | 1 (2.1%) | 1 (1.8%) |
| $17,500 to $19,999 | 0 (0.0%) | 2 (3.6%) |
| $20,000 to $22,499 | 4 (8.3%) | 8 (14.5%) |
| $22,500 to $24,999 | 5 (10.4%) | 3 (5.4%) |
| $25,000 to $29,999 | 5 (10.4%) | 9 (16.4%) |
| $30,000 to $34,999 | 6 (12.5%) | 6 (10.9%) |
| $35,000 to $39,999 | 0 (0.0%) | 1 (1.8%) |
| $40,000 to $44,999 | 0 (0.0%) | 1 (1.8%) |
| $45,000 to $49,999 | 4 (8.3%) | 0 (0.0%) |
| $50,000 to $54,999 | 6 (12.5%) | 0 (0.0%) |
| $55,000 to $64,999 | 0 (0.0%) | 1 (1.8%) |
| $65,000 to $74,999 | 2 (4.2%) | 4 (7.3%) |
| $75,000 to $99,999 | 4 (8.3%) | 0 (0.0%) |
| $100,000+ | 5 (10.4%) | 0 (0.0%) |
| Total | 48 (100.0%) | 55 (100.0%) |
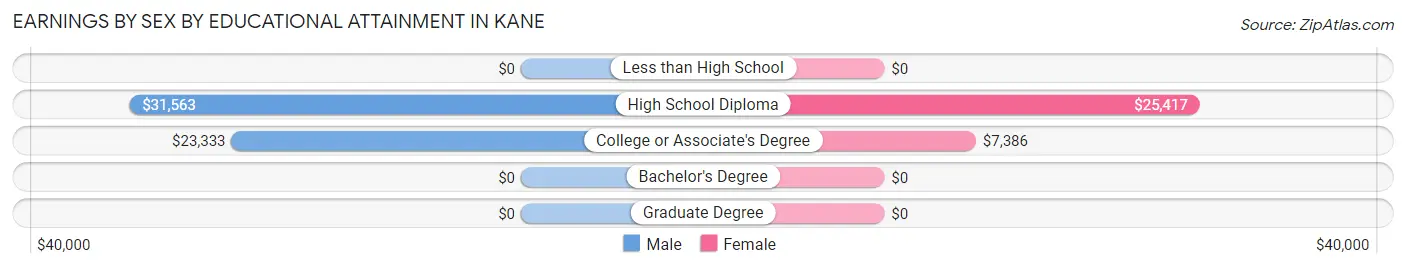
Earnings by Sex by Educational Attainment in Kane
Average earnings in Kane are $31,875 for men and $21,563 for women, a difference of 32.4%. Men with an educational attainment of high school diploma enjoy the highest average annual earnings of $31,563, while those with college or associate's degree education earn the least with $23,333. Women with an educational attainment of high school diploma earn the most with the average annual earnings of $25,417, while those with college or associate's degree education have the smallest earnings of $7,386.
| Educational Attainment | Male Income | Female Income |
| Less than High School | - | - |
| High School Diploma | $31,563 | $25,417 |
| College or Associate's Degree | $23,333 | $7,386 |
| Bachelor's Degree | - | - |
| Graduate Degree | - | - |
| Total | $31,875 | $21,563 |
Family Income in Kane
Family Income Brackets in Kane
According to the Kane family income data, there are 12 families falling into the $50,000 to $74,999 income range, which is the most common income bracket and makes up 26.1% of all families.
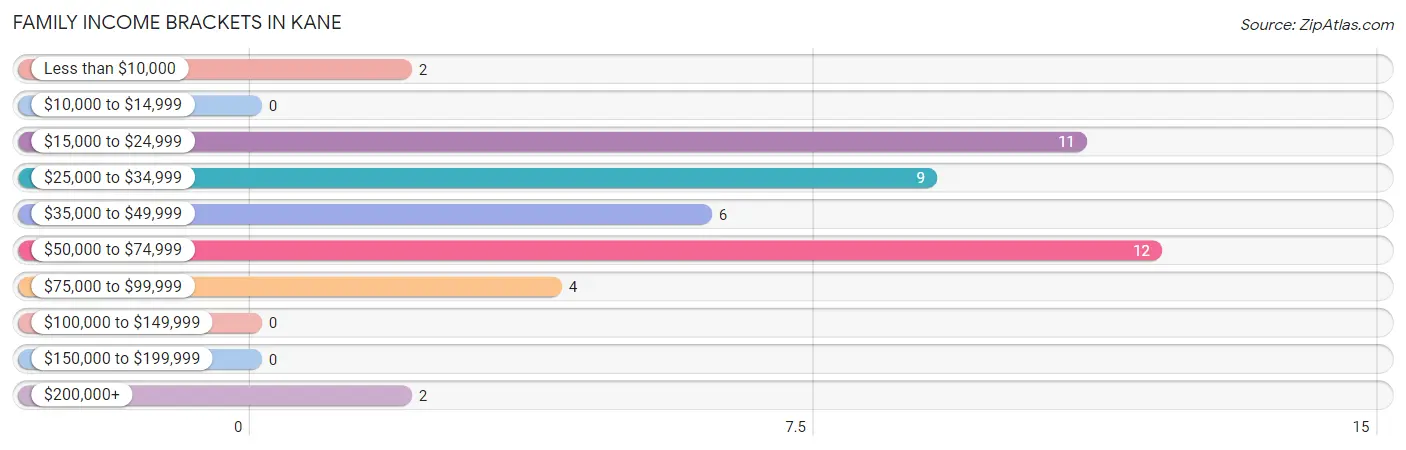
| Income Bracket | # Families | % Families |
| Less than $10,000 | 2 | 4.3% |
| $10,000 to $14,999 | 0 | 0.0% |
| $15,000 to $24,999 | 11 | 23.9% |
| $25,000 to $34,999 | 9 | 19.6% |
| $35,000 to $49,999 | 6 | 13.0% |
| $50,000 to $74,999 | 12 | 26.1% |
| $75,000 to $99,999 | 4 | 8.7% |
| $100,000 to $149,999 | 0 | 0.0% |
| $150,000 to $199,999 | 0 | 0.0% |
| $200,000+ | 2 | 4.3% |
Family Income by Famaliy Size in Kane
2-person families (29 | 63.0%) account for the highest median family income in Kane with $47,813 per family, while 2-person families (29 | 63.0%) have the highest median income of $23,906 per family member.
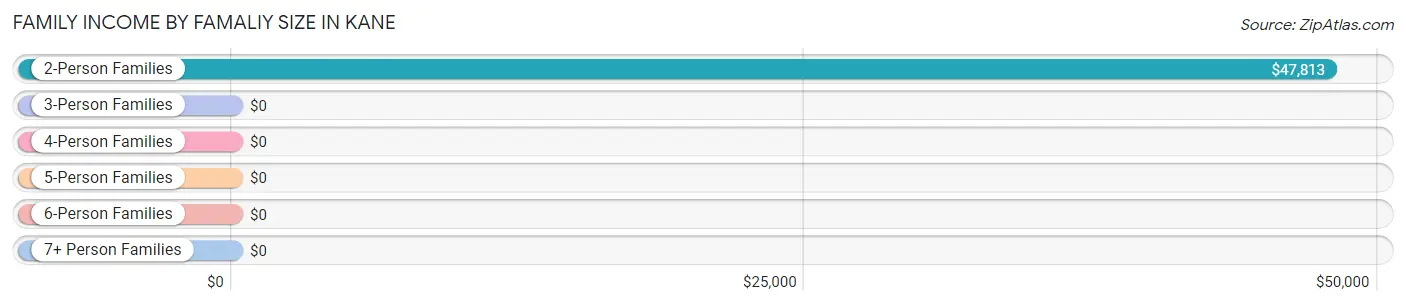
| Income Bracket | # Families | Median Income |
| 2-Person Families | 29 (63.0%) | $47,813 |
| 3-Person Families | 7 (15.2%) | $0 |
| 4-Person Families | 8 (17.4%) | $0 |
| 5-Person Families | 2 (4.3%) | $0 |
| 6-Person Families | 0 (0.0%) | $0 |
| 7+ Person Families | 0 (0.0%) | $0 |
| Total | 46 (100.0%) | $47,917 |
Family Income by Number of Earners in Kane
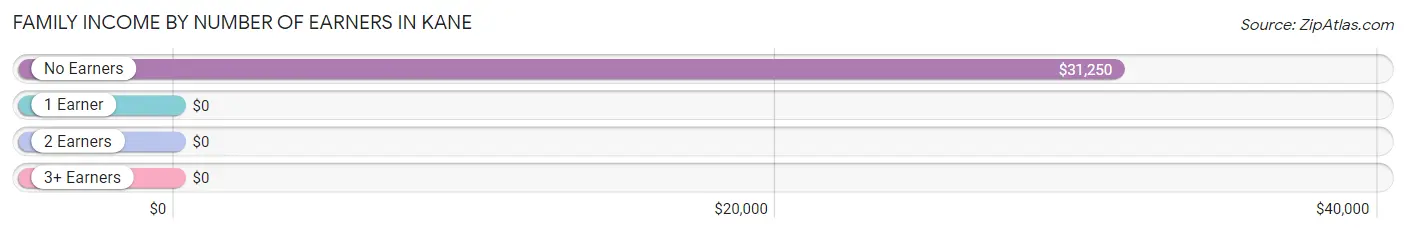
| Number of Earners | # Families | Median Income |
| No Earners | 16 (34.8%) | $31,250 |
| 1 Earner | 16 (34.8%) | $0 |
| 2 Earners | 12 (26.1%) | $0 |
| 3+ Earners | 2 (4.3%) | $0 |
| Total | 46 (100.0%) | $47,917 |
Household Income in Kane
Household Income Brackets in Kane
With 27 households falling in the category, the $50,000 to $74,999 income range is the most frequent in Kane, accounting for 32.5% of all households.
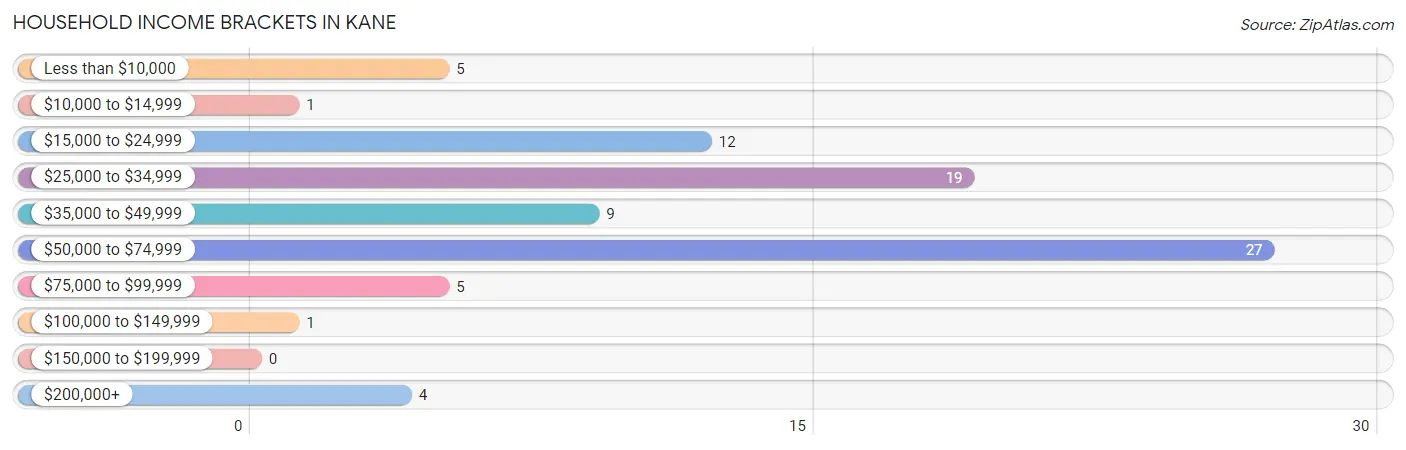
| Income Bracket | # Households | % Households |
| Less than $10,000 | 5 | 6.0% |
| $10,000 to $14,999 | 1 | 1.2% |
| $15,000 to $24,999 | 12 | 14.5% |
| $25,000 to $34,999 | 19 | 22.9% |
| $35,000 to $49,999 | 9 | 10.8% |
| $50,000 to $74,999 | 27 | 32.5% |
| $75,000 to $99,999 | 5 | 6.0% |
| $100,000 to $149,999 | 1 | 1.2% |
| $150,000 to $199,999 | 0 | 0.0% |
| $200,000+ | 4 | 4.8% |
Household Income by Householder Age in Kane
The median household income in Kane is $48,125, with the highest median household income of $56,023 found in the 45 to 64 years age bracket for the primary householder. A total of 37 households (44.6%) fall into this category. Meanwhile, the 15 to 24 years age bracket for the primary householder has the lowest median household income of $0, with 5 households (6.0%) in this group.
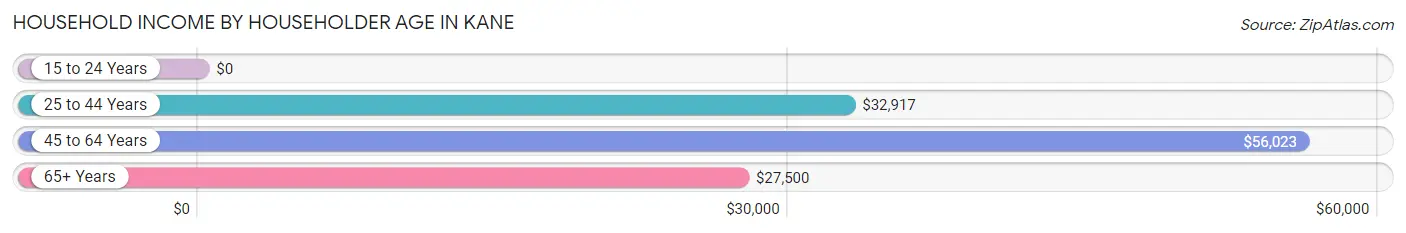
| Income Bracket | # Households | Median Income |
| 15 to 24 Years | 5 (6.0%) | $0 |
| 25 to 44 Years | 21 (25.3%) | $32,917 |
| 45 to 64 Years | 37 (44.6%) | $56,023 |
| 65+ Years | 20 (24.1%) | $27,500 |
| Total | 83 (100.0%) | $48,125 |
Poverty in Kane
Income Below Poverty by Sex and Age in Kane
With 14.8% poverty level for males and 29.1% for females among the residents of Kane, under 5 year old males and 45 to 54 year old females are the most vulnerable to poverty, with 4 males (100.0%) and 11 females (64.7%) in their respective age groups living below the poverty level.
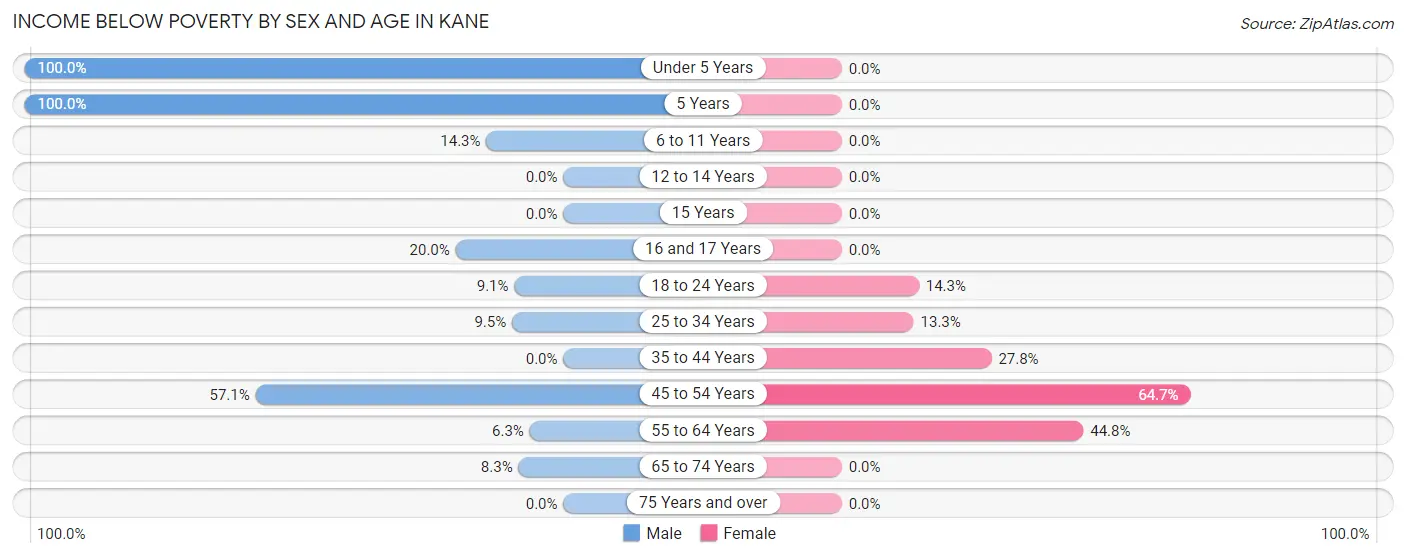
| Age Bracket | Male | Female |
| Under 5 Years | 4 (100.0%) | 0 (0.0%) |
| 5 Years | 2 (100.0%) | 0 (0.0%) |
| 6 to 11 Years | 1 (14.3%) | 0 (0.0%) |
| 12 to 14 Years | 0 (0.0%) | 0 (0.0%) |
| 15 Years | 0 (0.0%) | 0 (0.0%) |
| 16 and 17 Years | 1 (20.0%) | 0 (0.0%) |
| 18 to 24 Years | 1 (9.1%) | 1 (14.3%) |
| 25 to 34 Years | 2 (9.5%) | 2 (13.3%) |
| 35 to 44 Years | 0 (0.0%) | 5 (27.8%) |
| 45 to 54 Years | 4 (57.1%) | 11 (64.7%) |
| 55 to 64 Years | 1 (6.2%) | 13 (44.8%) |
| 65 to 74 Years | 1 (8.3%) | 0 (0.0%) |
| 75 Years and over | 0 (0.0%) | 0 (0.0%) |
| Total | 17 (14.8%) | 32 (29.1%) |
Income Above Poverty by Sex and Age in Kane
According to the poverty statistics in Kane, males aged 12 to 14 years and females aged 6 to 11 years are the age groups that are most secure financially, with 100.0% of males and 100.0% of females in these age groups living above the poverty line.
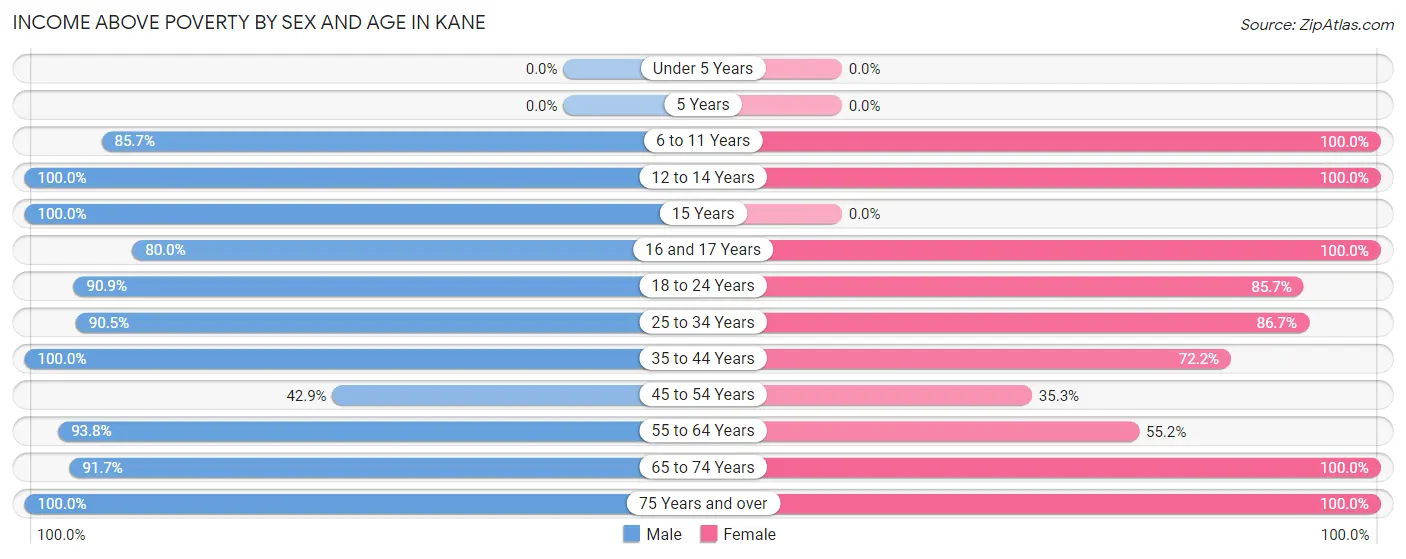
| Age Bracket | Male | Female |
| Under 5 Years | 0 (0.0%) | 0 (0.0%) |
| 5 Years | 0 (0.0%) | 0 (0.0%) |
| 6 to 11 Years | 6 (85.7%) | 2 (100.0%) |
| 12 to 14 Years | 2 (100.0%) | 2 (100.0%) |
| 15 Years | 3 (100.0%) | 0 (0.0%) |
| 16 and 17 Years | 4 (80.0%) | 4 (100.0%) |
| 18 to 24 Years | 10 (90.9%) | 6 (85.7%) |
| 25 to 34 Years | 19 (90.5%) | 13 (86.7%) |
| 35 to 44 Years | 15 (100.0%) | 13 (72.2%) |
| 45 to 54 Years | 3 (42.9%) | 6 (35.3%) |
| 55 to 64 Years | 15 (93.8%) | 16 (55.2%) |
| 65 to 74 Years | 11 (91.7%) | 12 (100.0%) |
| 75 Years and over | 10 (100.0%) | 4 (100.0%) |
| Total | 98 (85.2%) | 78 (70.9%) |
Income Below Poverty Among Married-Couple Families in Kane
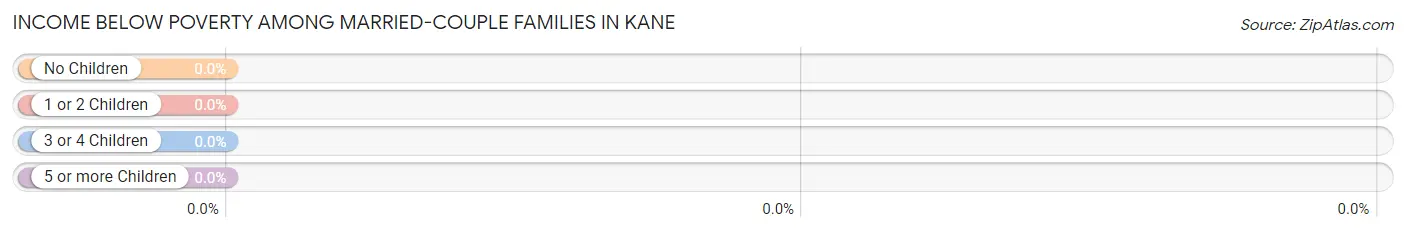
| Children | Above Poverty | Below Poverty |
| No Children | 15 (100.0%) | 0 (0.0%) |
| 1 or 2 Children | 9 (100.0%) | 0 (0.0%) |
| 3 or 4 Children | 0 (0.0%) | 0 (0.0%) |
| 5 or more Children | 0 (0.0%) | 0 (0.0%) |
| Total | 24 (100.0%) | 0 (0.0%) |
Income Below Poverty Among Single-Parent Households in Kane
According to the poverty data in Kane, 7.7% or 1 single-father households and 33.3% or 3 single-mother households are living below the poverty line. Among single-father households, those with 1 or 2 children have the highest poverty rate, with 1 households (9.1%) experiencing poverty. Likewise, among single-mother households, those with 1 or 2 children have the highest poverty rate, with 3 households (100.0%) falling below the poverty line.
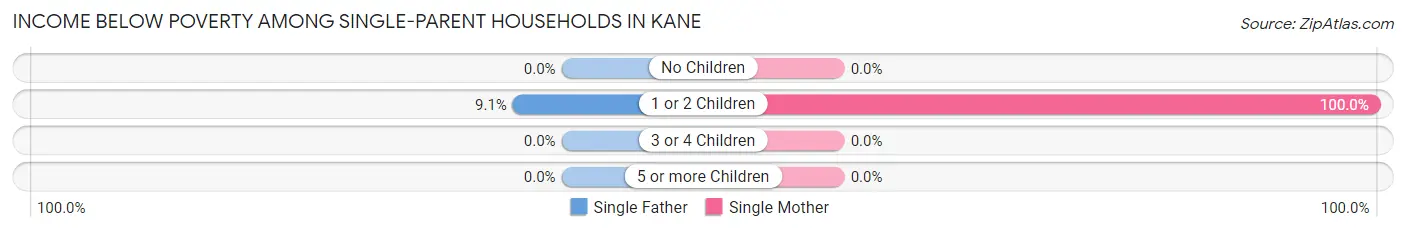
| Children | Single Father | Single Mother |
| No Children | 0 (0.0%) | 0 (0.0%) |
| 1 or 2 Children | 1 (9.1%) | 3 (100.0%) |
| 3 or 4 Children | 0 (0.0%) | 0 (0.0%) |
| 5 or more Children | 0 (0.0%) | 0 (0.0%) |
| Total | 1 (7.7%) | 3 (33.3%) |
Income Below Poverty Among Married-Couple vs Single-Parent Households in Kane
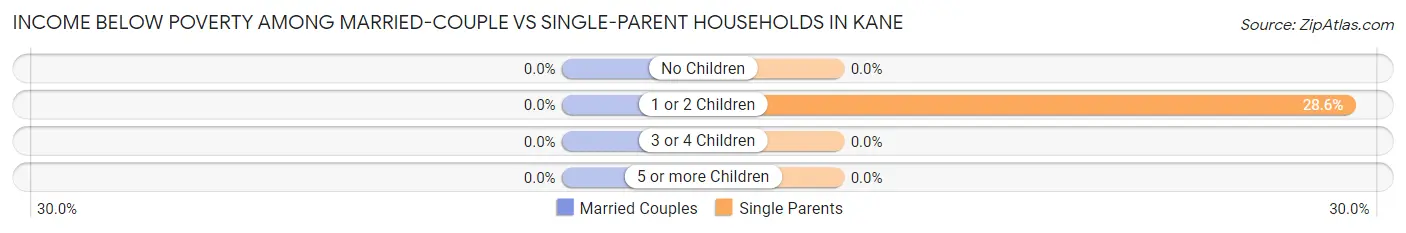
| Children | Married-Couple Families | Single-Parent Households |
| No Children | 0 (0.0%) | 0 (0.0%) |
| 1 or 2 Children | 0 (0.0%) | 4 (28.6%) |
| 3 or 4 Children | 0 (0.0%) | 0 (0.0%) |
| 5 or more Children | 0 (0.0%) | 0 (0.0%) |
| Total | 0 (0.0%) | 4 (18.2%) |
Race in Kane
The most populous races in Kane are White / Caucasian (209 | 92.1%), Two or more Races (7 | 3.1%), and Native / Alaskan (5 | 2.2%).
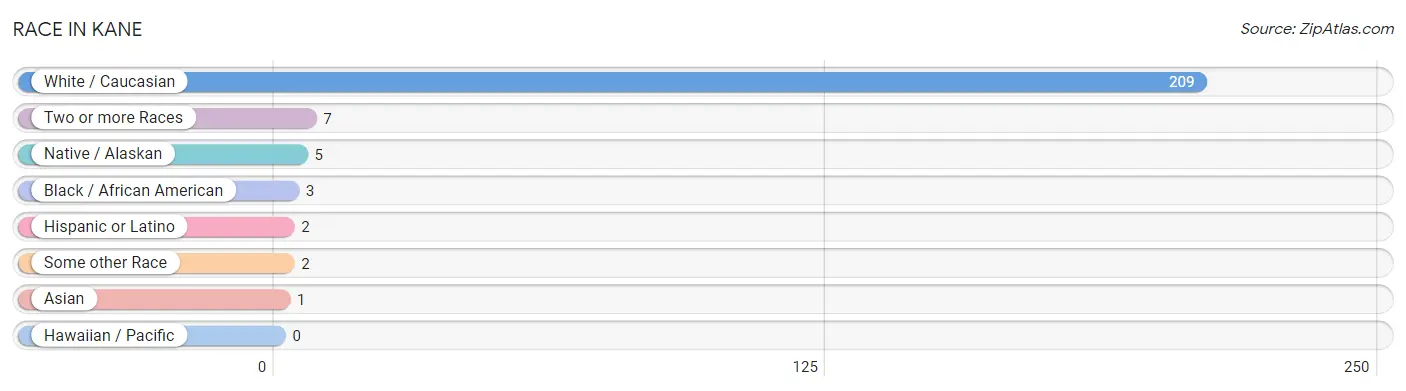
| Race | # Population | % Population |
| Asian | 1 | 0.4% |
| Black / African American | 3 | 1.3% |
| Hawaiian / Pacific | 0 | 0.0% |
| Hispanic or Latino | 2 | 0.9% |
| Native / Alaskan | 5 | 2.2% |
| White / Caucasian | 209 | 92.1% |
| Two or more Races | 7 | 3.1% |
| Some other Race | 2 | 0.9% |
| Total | 227 | 100.0% |
Ancestry in Kane
The most populous ancestries reported in Kane are German (66 | 29.1%), Irish (17 | 7.5%), American (14 | 6.2%), English (12 | 5.3%), and French (10 | 4.4%), together accounting for 52.4% of all Kane residents.
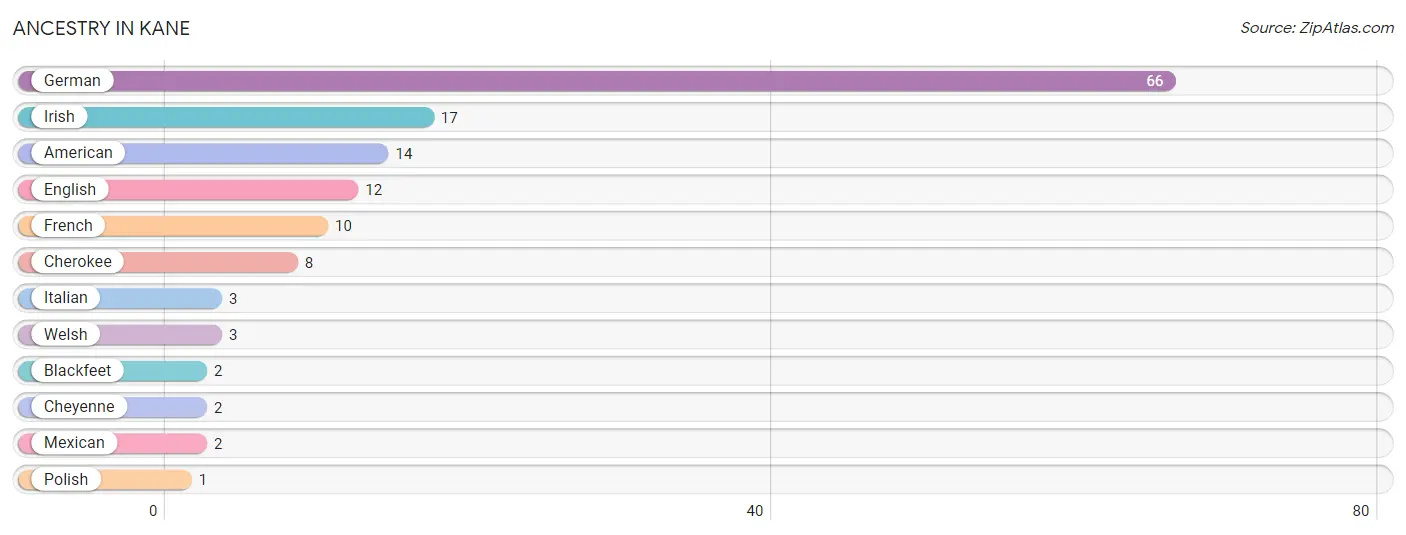
| Ancestry | # Population | % Population |
| American | 14 | 6.2% |
| Blackfeet | 2 | 0.9% |
| Cherokee | 8 | 3.5% |
| Cheyenne | 2 | 0.9% |
| English | 12 | 5.3% |
| French | 10 | 4.4% |
| German | 66 | 29.1% |
| Irish | 17 | 7.5% |
| Italian | 3 | 1.3% |
| Mexican | 2 | 0.9% |
| Polish | 1 | 0.4% |
| Welsh | 3 | 1.3% | View All 12 Rows |
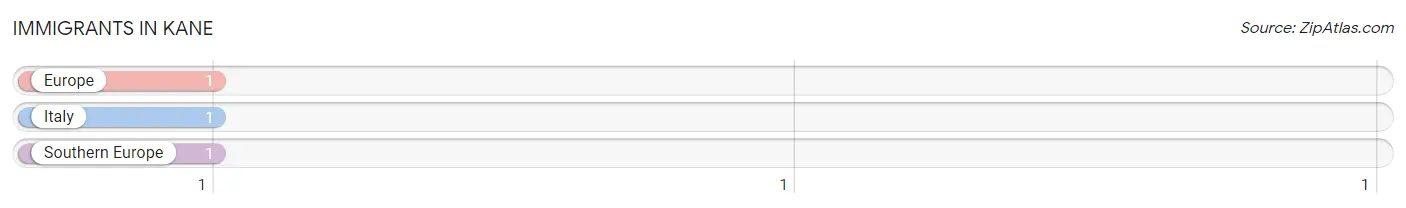
Immigrants in Kane
The most numerous immigrant groups reported in Kane came from Europe (1 | 0.4%), Italy (1 | 0.4%), and Southern Europe (1 | 0.4%), together accounting for 1.3% of all Kane residents.
| Immigration Origin | # Population | % Population |
| Europe | 1 | 0.4% |
| Italy | 1 | 0.4% |
| Southern Europe | 1 | 0.4% | View All 3 Rows |
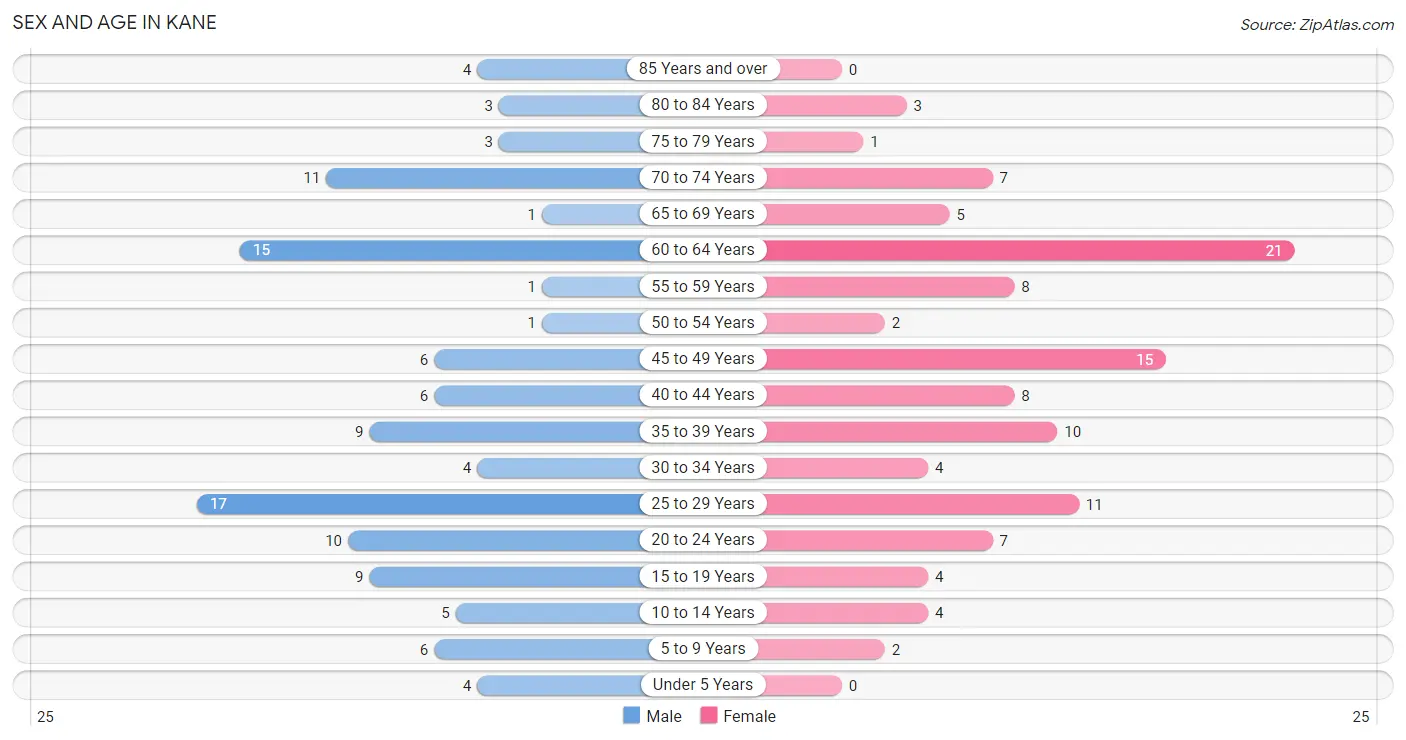
Sex and Age in Kane
Sex and Age in Kane
The most populous age groups in Kane are 25 to 29 Years (17 | 14.8%) for men and 60 to 64 Years (21 | 18.8%) for women.
| Age Bracket | Male | Female |
| Under 5 Years | 4 (3.5%) | 0 (0.0%) |
| 5 to 9 Years | 6 (5.2%) | 2 (1.8%) |
| 10 to 14 Years | 5 (4.3%) | 4 (3.6%) |
| 15 to 19 Years | 9 (7.8%) | 4 (3.6%) |
| 20 to 24 Years | 10 (8.7%) | 7 (6.2%) |
| 25 to 29 Years | 17 (14.8%) | 11 (9.8%) |
| 30 to 34 Years | 4 (3.5%) | 4 (3.6%) |
| 35 to 39 Years | 9 (7.8%) | 10 (8.9%) |
| 40 to 44 Years | 6 (5.2%) | 8 (7.1%) |
| 45 to 49 Years | 6 (5.2%) | 15 (13.4%) |
| 50 to 54 Years | 1 (0.9%) | 2 (1.8%) |
| 55 to 59 Years | 1 (0.9%) | 8 (7.1%) |
| 60 to 64 Years | 15 (13.0%) | 21 (18.8%) |
| 65 to 69 Years | 1 (0.9%) | 5 (4.5%) |
| 70 to 74 Years | 11 (9.6%) | 7 (6.2%) |
| 75 to 79 Years | 3 (2.6%) | 1 (0.9%) |
| 80 to 84 Years | 3 (2.6%) | 3 (2.7%) |
| 85 Years and over | 4 (3.5%) | 0 (0.0%) |
| Total | 115 (100.0%) | 112 (100.0%) |
Families and Households in Kane
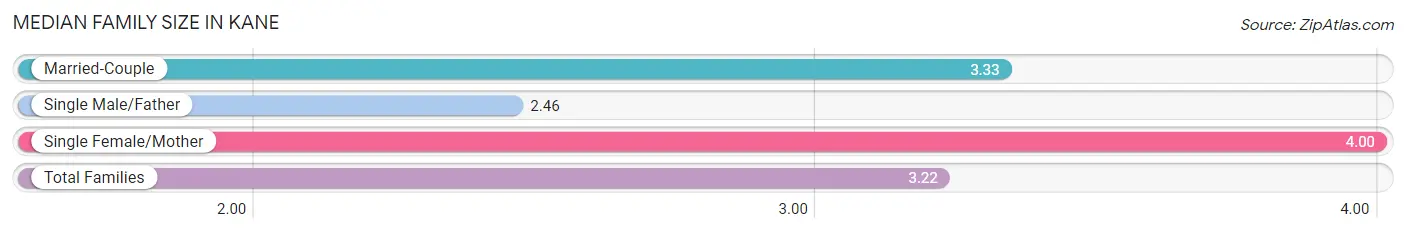
Median Family Size in Kane
The median family size in Kane is 3.22 persons per family, with single female/mother families (9 | 19.6%) accounting for the largest median family size of 4 persons per family. On the other hand, single male/father families (13 | 28.3%) represent the smallest median family size with 2.46 persons per family.
| Family Type | # Families | Family Size |
| Married-Couple | 24 (52.2%) | 3.33 |
| Single Male/Father | 13 (28.3%) | 2.46 |
| Single Female/Mother | 9 (19.6%) | 4.00 |
| Total Families | 46 (100.0%) | 3.22 |
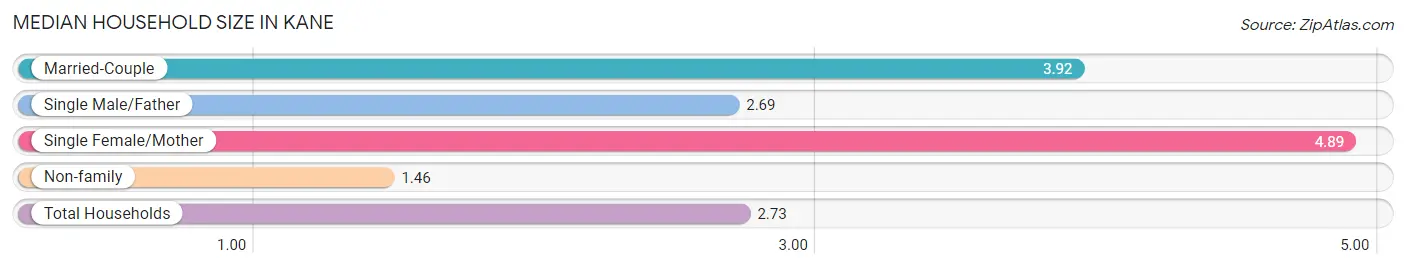
Median Household Size in Kane
The median household size in Kane is 2.73 persons per household, with single female/mother households (9 | 10.8%) accounting for the largest median household size of 4.89 persons per household. non-family households (37 | 44.6%) represent the smallest median household size with 1.46 persons per household.
| Household Type | # Households | Household Size |
| Married-Couple | 24 (28.9%) | 3.92 |
| Single Male/Father | 13 (15.7%) | 2.69 |
| Single Female/Mother | 9 (10.8%) | 4.89 |
| Non-family | 37 (44.6%) | 1.46 |
| Total Households | 83 (100.0%) | 2.73 |
Household Size by Marriage Status in Kane
Out of a total of 83 households in Kane, 46 (55.4%) are family households, while 37 (44.6%) are nonfamily households. The most numerous type of family households are 2-person households, comprising 25, and the most common type of nonfamily households are 2-person households, comprising 20.
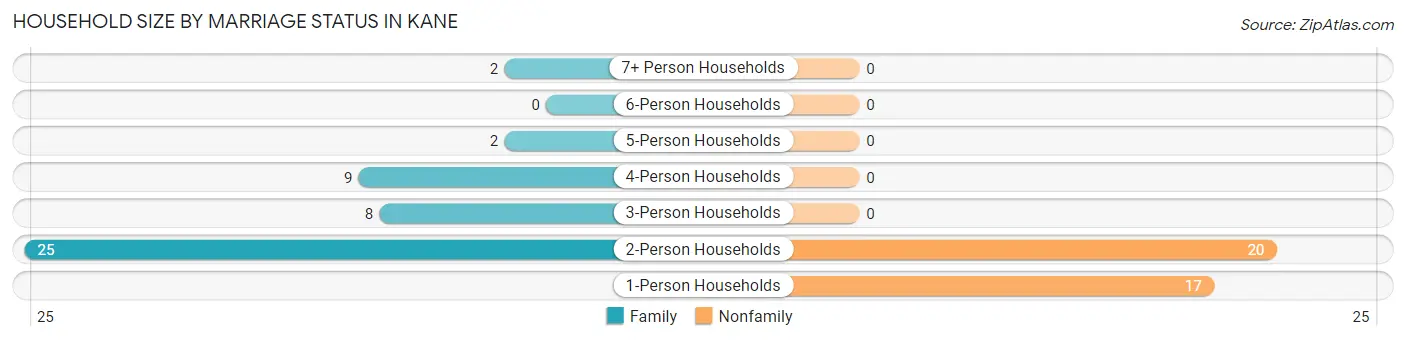
| Household Size | Family Households | Nonfamily Households |
| 1-Person Households | - | 17 (20.5%) |
| 2-Person Households | 25 (30.1%) | 20 (24.1%) |
| 3-Person Households | 8 (9.6%) | 0 (0.0%) |
| 4-Person Households | 9 (10.8%) | 0 (0.0%) |
| 5-Person Households | 2 (2.4%) | 0 (0.0%) |
| 6-Person Households | 0 (0.0%) | 0 (0.0%) |
| 7+ Person Households | 2 (2.4%) | 0 (0.0%) |
| Total | 46 (55.4%) | 37 (44.6%) |
Female Fertility in Kane
Fertility by Age in Kane
| Age Bracket | Women with Births | Births / 1,000 Women |
| 15 to 19 years | 0 (0.0%) | 0.0 |
| 20 to 34 years | 0 (0.0%) | 0.0 |
| 35 to 50 years | 0 (0.0%) | 0.0 |
| Total | 0 (0.0%) | 0.0 |
Fertility by Age by Marriage Status in Kane
| Age Bracket | Married | Unmarried |
| 15 to 19 years | 0 (0.0%) | 0 (0.0%) |
| 20 to 34 years | 0 (0.0%) | 0 (0.0%) |
| 35 to 50 years | 0 (0.0%) | 0 (0.0%) |
| Total | 0 (0.0%) | 0 (0.0%) |
Fertility by Education in Kane
| Educational Attainment | Women with Births | Births / 1,000 Women |
| Less than High School | 0 (0.0%) | 0.0 |
| High School Diploma | 0 (0.0%) | 0.0 |
| College or Associate's Degree | 0 (0.0%) | 0.0 |
| Bachelor's Degree | 0 (0.0%) | 0.0 |
| Graduate Degree | 0 (0.0%) | 0.0 |
| Total | 0 (0.0%) | 0.0 |
Fertility by Education by Marriage Status in Kane
| Educational Attainment | Married | Unmarried |
| Less than High School | 0 (0.0%) | 0 (0.0%) |
| High School Diploma | 0 (0.0%) | 0 (0.0%) |
| College or Associate's Degree | 0 (0.0%) | 0 (0.0%) |
| Bachelor's Degree | 0 (0.0%) | 0 (0.0%) |
| Graduate Degree | 0 (0.0%) | 0 (0.0%) |
| Total | 0 (0.0%) | 0 (0.0%) |
Employment Characteristics in Kane
Employment by Class of Employer in Kane
Among the 93 employed individuals in Kane, private company employees (68 | 73.1%), self-employed (not incorporated) (11 | 11.8%), and not-for-profit organizations (6 | 6.5%) make up the most common classes of employment.
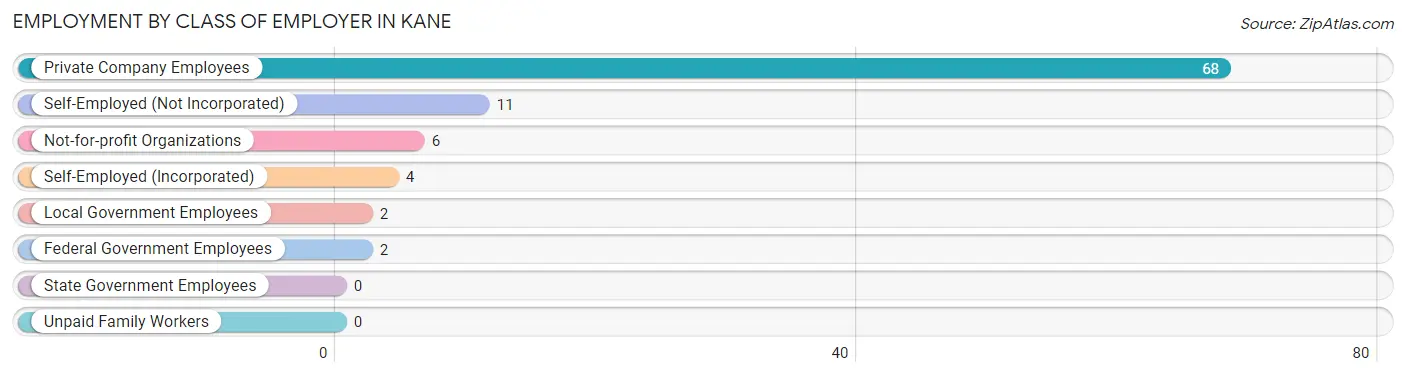
| Employer Class | # Employees | % Employees |
| Private Company Employees | 68 | 73.1% |
| Self-Employed (Incorporated) | 4 | 4.3% |
| Self-Employed (Not Incorporated) | 11 | 11.8% |
| Not-for-profit Organizations | 6 | 6.5% |
| Local Government Employees | 2 | 2.1% |
| State Government Employees | 0 | 0.0% |
| Federal Government Employees | 2 | 2.1% |
| Unpaid Family Workers | 0 | 0.0% |
| Total | 93 | 100.0% |
Employment Status by Age in Kane
According to the labor force statistics for Kane, out of the total population over 16 years of age (203), 50.2% or 102 individuals are in the labor force, with 5.9% or 6 of them unemployed. The age group with the highest labor force participation rate is 20 to 24 years, with 100.0% or 17 individuals in the labor force. Within the labor force, the 45 to 54 years age range has the highest percentage of unemployed individuals, with 18.8% or 3 of them being unemployed.
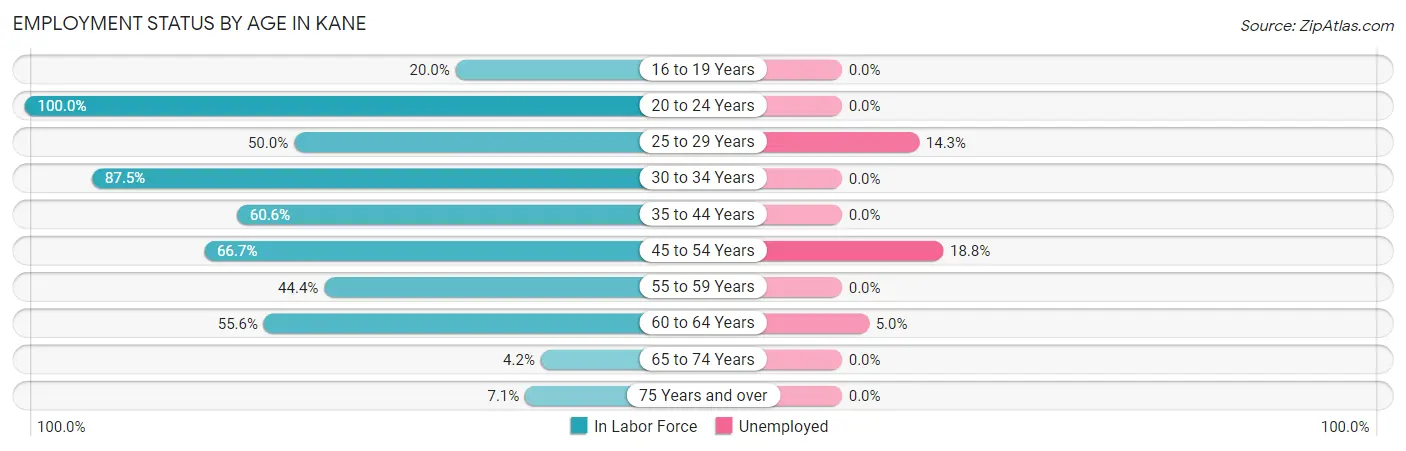
| Age Bracket | In Labor Force | Unemployed |
| 16 to 19 Years | 2 (20.0%) | 0 (0.0%) |
| 20 to 24 Years | 17 (100.0%) | 0 (0.0%) |
| 25 to 29 Years | 14 (50.0%) | 2 (14.3%) |
| 30 to 34 Years | 7 (87.5%) | 0 (0.0%) |
| 35 to 44 Years | 20 (60.6%) | 0 (0.0%) |
| 45 to 54 Years | 16 (66.7%) | 3 (18.8%) |
| 55 to 59 Years | 4 (44.4%) | 0 (0.0%) |
| 60 to 64 Years | 20 (55.6%) | 1 (5.0%) |
| 65 to 74 Years | 1 (4.2%) | 0 (0.0%) |
| 75 Years and over | 1 (7.1%) | 0 (0.0%) |
| Total | 102 (50.2%) | 6 (5.9%) |
Employment Status by Educational Attainment in Kane
According to labor force statistics for Kane, 58.7% of individuals (81) out of the total population between 25 and 64 years of age (138) are in the labor force, with 7.4% or 6 of them being unemployed. The group with the highest labor force participation rate are those with the educational attainment of college / associate degree, with 75.0% or 27 individuals in the labor force. Within the labor force, individuals with high school diploma education have the highest percentage of unemployment, with 10.4% or 5 of them being unemployed.
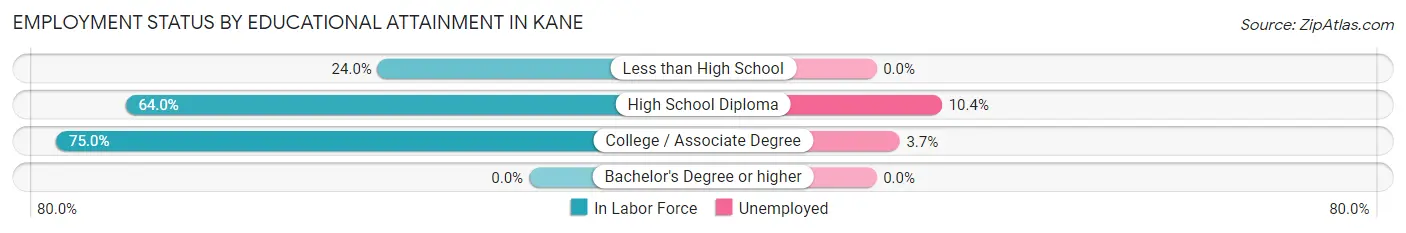
| Educational Attainment | In Labor Force | Unemployed |
| Less than High School | 6 (24.0%) | 0 (0.0%) |
| High School Diploma | 48 (64.0%) | 8 (10.4%) |
| College / Associate Degree | 27 (75.0%) | 1 (3.7%) |
| Bachelor's Degree or higher | 0 (0.0%) | 0 (0.0%) |
| Total | 81 (58.7%) | 10 (7.4%) |
Employment Occupations by Sex in Kane
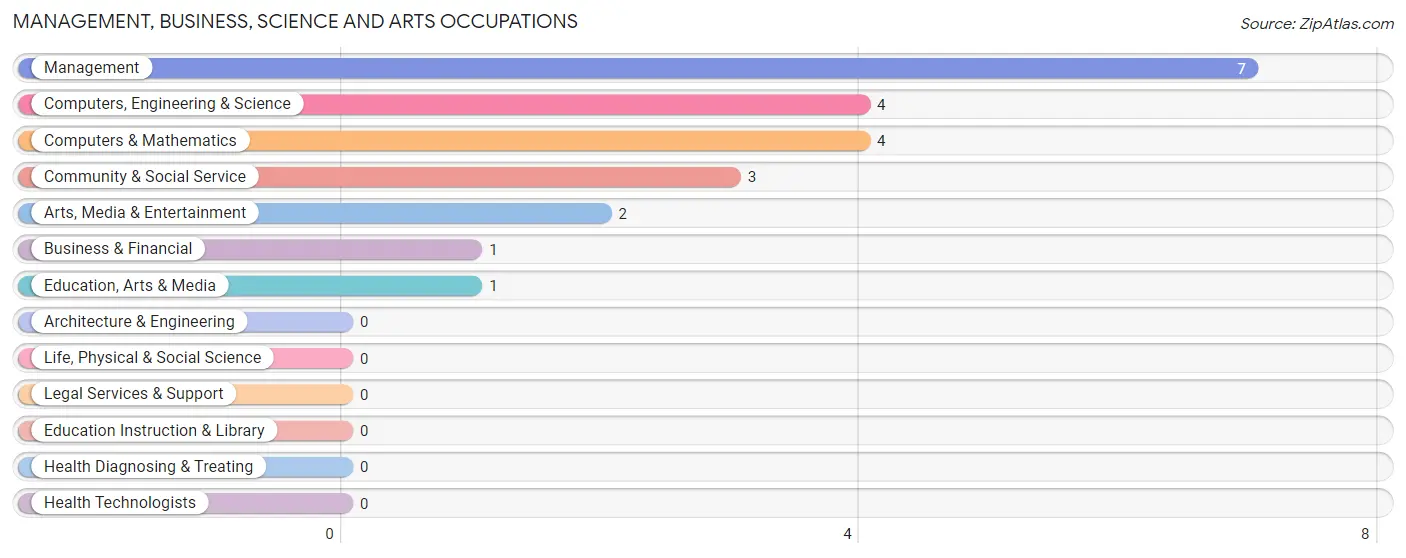
Management, Business, Science and Arts Occupations
The most common Management, Business, Science and Arts occupations in Kane are Management (7 | 7.3%), Computers, Engineering & Science (4 | 4.2%), Computers & Mathematics (4 | 4.2%), Community & Social Service (3 | 3.1%), and Arts, Media & Entertainment (2 | 2.1%).
Management, Business, Science and Arts Occupations by Sex
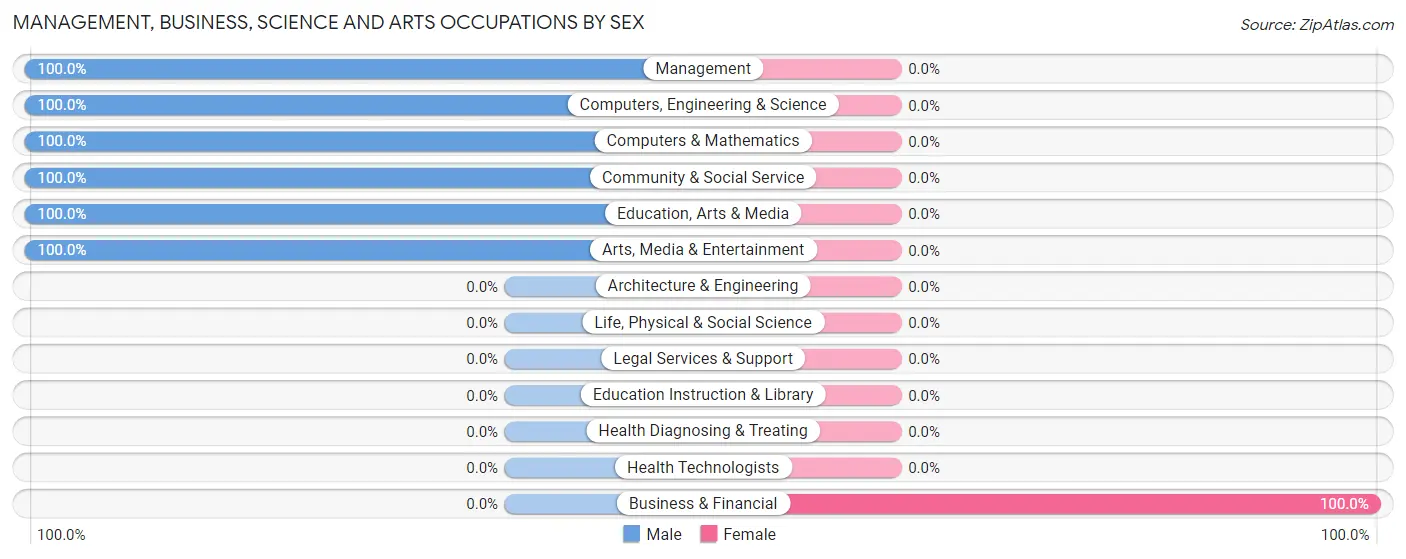
| Occupation | Male | Female |
| Management | 7 (100.0%) | 0 (0.0%) |
| Business & Financial | 0 (0.0%) | 1 (100.0%) |
| Computers, Engineering & Science | 4 (100.0%) | 0 (0.0%) |
| Computers & Mathematics | 4 (100.0%) | 0 (0.0%) |
| Architecture & Engineering | 0 (0.0%) | 0 (0.0%) |
| Life, Physical & Social Science | 0 (0.0%) | 0 (0.0%) |
| Community & Social Service | 3 (100.0%) | 0 (0.0%) |
| Education, Arts & Media | 1 (100.0%) | 0 (0.0%) |
| Legal Services & Support | 0 (0.0%) | 0 (0.0%) |
| Education Instruction & Library | 0 (0.0%) | 0 (0.0%) |
| Arts, Media & Entertainment | 2 (100.0%) | 0 (0.0%) |
| Health Diagnosing & Treating | 0 (0.0%) | 0 (0.0%) |
| Health Technologists | 0 (0.0%) | 0 (0.0%) |
| Total (Category) | 14 (93.3%) | 1 (6.7%) |
| Total (Overall) | 44 (45.8%) | 52 (54.2%) |
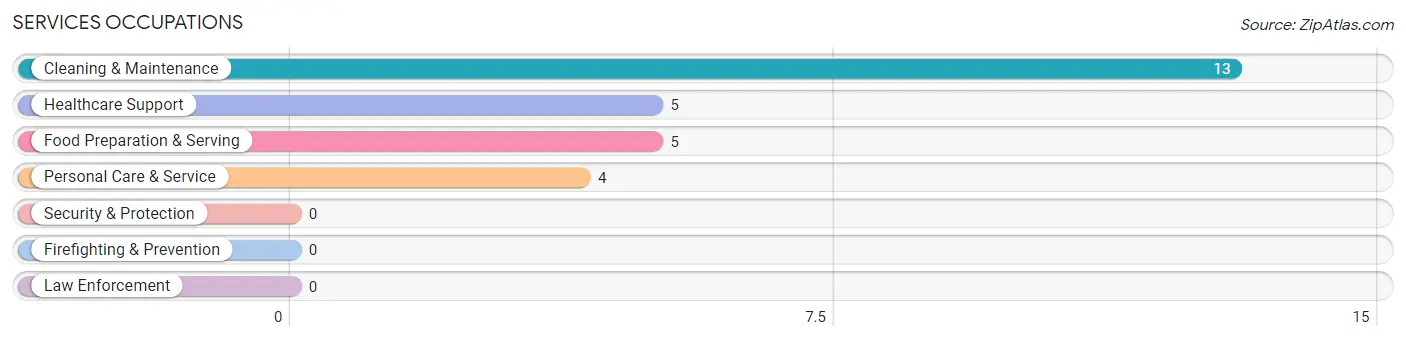
Services Occupations
The most common Services occupations in Kane are Cleaning & Maintenance (13 | 13.5%), Healthcare Support (5 | 5.2%), Food Preparation & Serving (5 | 5.2%), and Personal Care & Service (4 | 4.2%).
Services Occupations by Sex
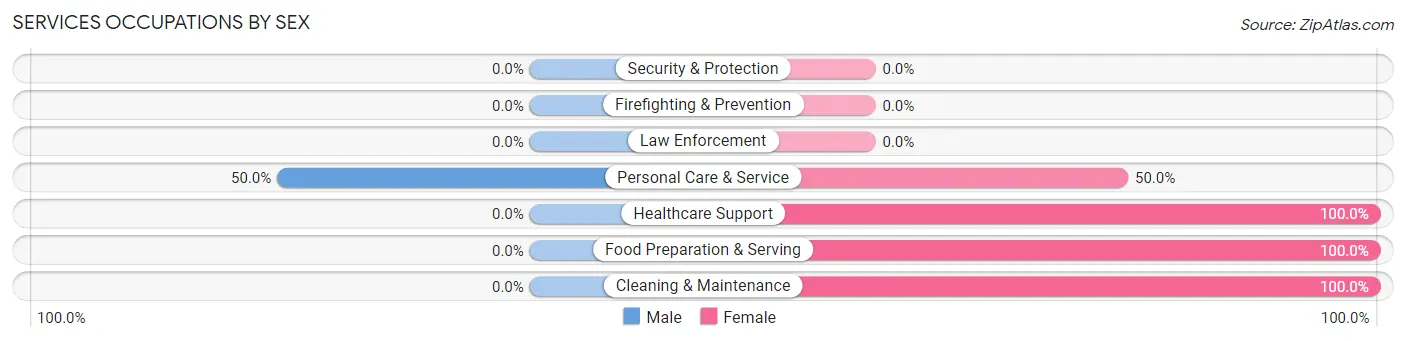
| Occupation | Male | Female |
| Healthcare Support | 0 (0.0%) | 5 (100.0%) |
| Security & Protection | 0 (0.0%) | 0 (0.0%) |
| Firefighting & Prevention | 0 (0.0%) | 0 (0.0%) |
| Law Enforcement | 0 (0.0%) | 0 (0.0%) |
| Food Preparation & Serving | 0 (0.0%) | 5 (100.0%) |
| Cleaning & Maintenance | 0 (0.0%) | 13 (100.0%) |
| Personal Care & Service | 2 (50.0%) | 2 (50.0%) |
| Total (Category) | 2 (7.4%) | 25 (92.6%) |
| Total (Overall) | 44 (45.8%) | 52 (54.2%) |
Sales and Office Occupations
The most common Sales and Office occupations in Kane are Office & Administration (16 | 16.7%), and Sales & Related (10 | 10.4%).
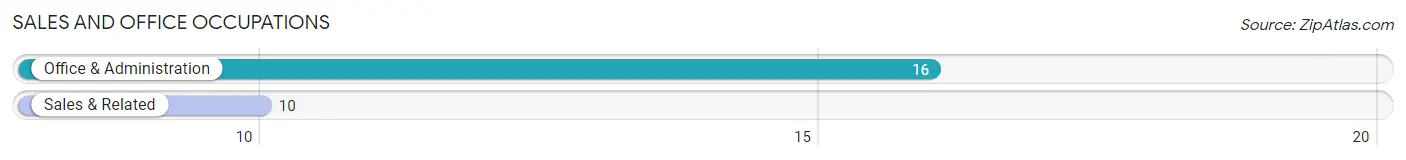
Sales and Office Occupations by Sex
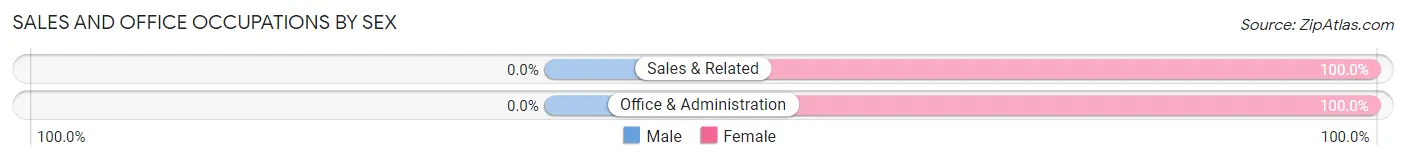
| Occupation | Male | Female |
| Sales & Related | 0 (0.0%) | 10 (100.0%) |
| Office & Administration | 0 (0.0%) | 16 (100.0%) |
| Total (Category) | 0 (0.0%) | 26 (100.0%) |
| Total (Overall) | 44 (45.8%) | 52 (54.2%) |
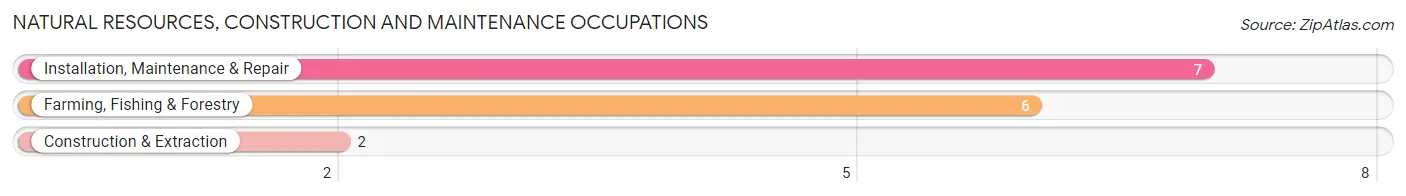
Natural Resources, Construction and Maintenance Occupations
The most common Natural Resources, Construction and Maintenance occupations in Kane are Installation, Maintenance & Repair (7 | 7.3%), Farming, Fishing & Forestry (6 | 6.2%), and Construction & Extraction (2 | 2.1%).
Natural Resources, Construction and Maintenance Occupations by Sex
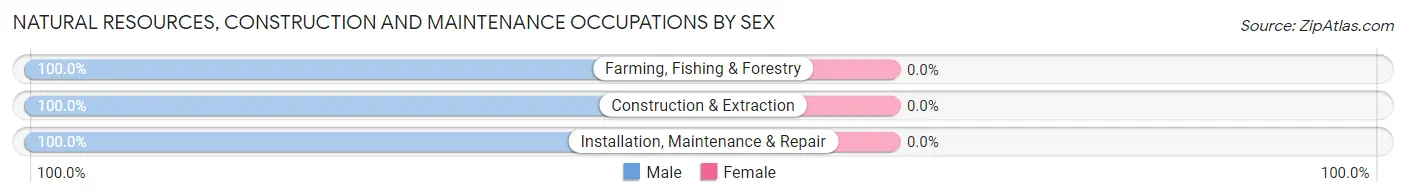
| Occupation | Male | Female |
| Farming, Fishing & Forestry | 6 (100.0%) | 0 (0.0%) |
| Construction & Extraction | 2 (100.0%) | 0 (0.0%) |
| Installation, Maintenance & Repair | 7 (100.0%) | 0 (0.0%) |
| Total (Category) | 15 (100.0%) | 0 (0.0%) |
| Total (Overall) | 44 (45.8%) | 52 (54.2%) |
Production, Transportation and Moving Occupations
The most common Production, Transportation and Moving occupations in Kane are Material Moving (10 | 10.4%), and Transportation (3 | 3.1%).
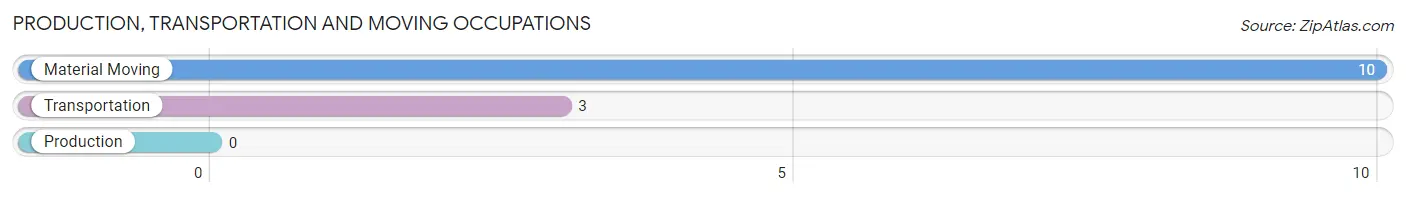
Production, Transportation and Moving Occupations by Sex
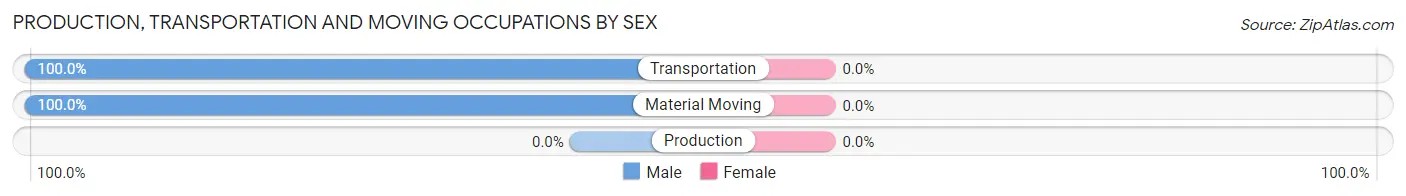
| Occupation | Male | Female |
| Production | 0 (0.0%) | 0 (0.0%) |
| Transportation | 3 (100.0%) | 0 (0.0%) |
| Material Moving | 10 (100.0%) | 0 (0.0%) |
| Total (Category) | 13 (100.0%) | 0 (0.0%) |
| Total (Overall) | 44 (45.8%) | 52 (54.2%) |
Employment Industries by Sex in Kane
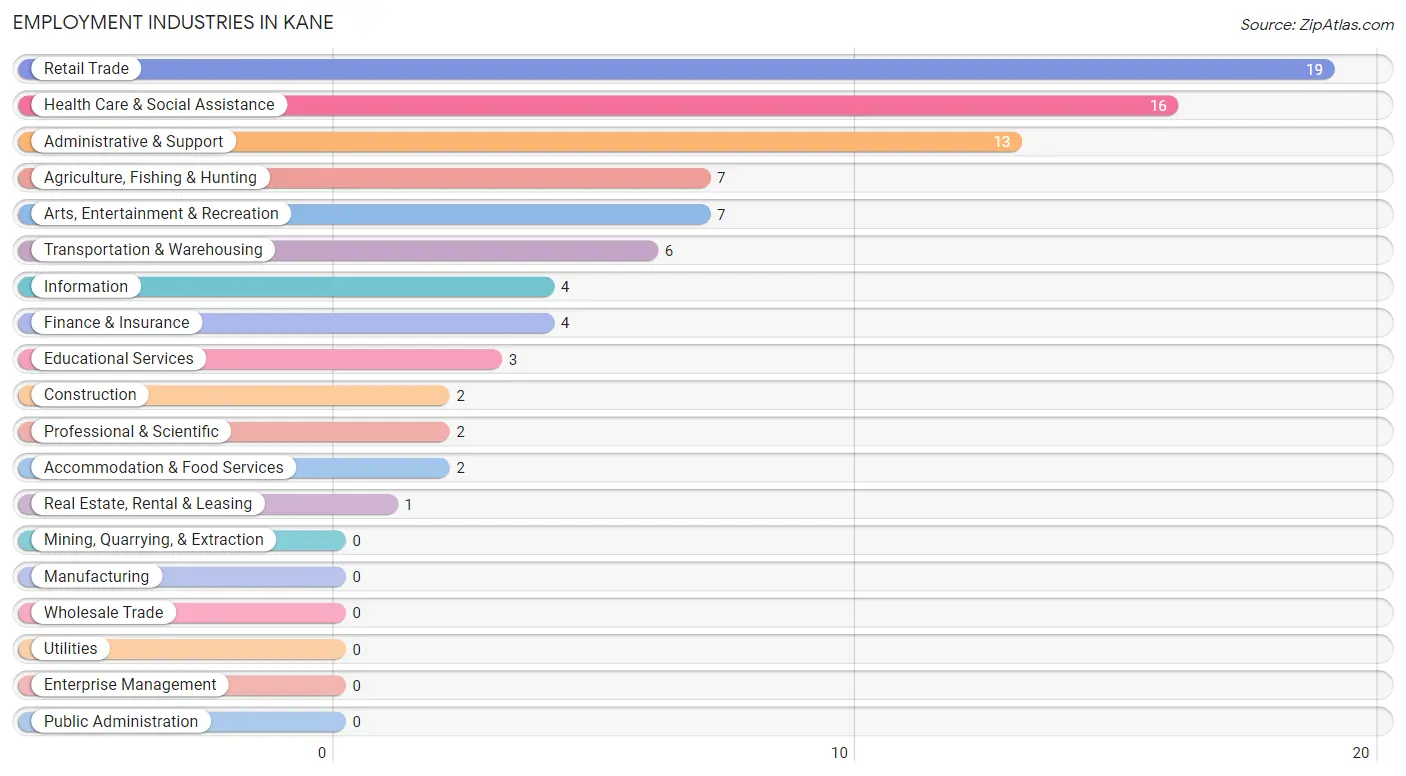
Employment Industries in Kane
The major employment industries in Kane include Retail Trade (19 | 19.8%), Health Care & Social Assistance (16 | 16.7%), Administrative & Support (13 | 13.5%), Agriculture, Fishing & Hunting (7 | 7.3%), and Arts, Entertainment & Recreation (7 | 7.3%).
Employment Industries by Sex in Kane
The Kane industries that see more men than women are Agriculture, Fishing & Hunting (100.0%), Construction (100.0%), and Transportation & Warehousing (100.0%), whereas the industries that tend to have a higher number of women are Finance & Insurance (100.0%), Administrative & Support (100.0%), and Accommodation & Food Services (100.0%).
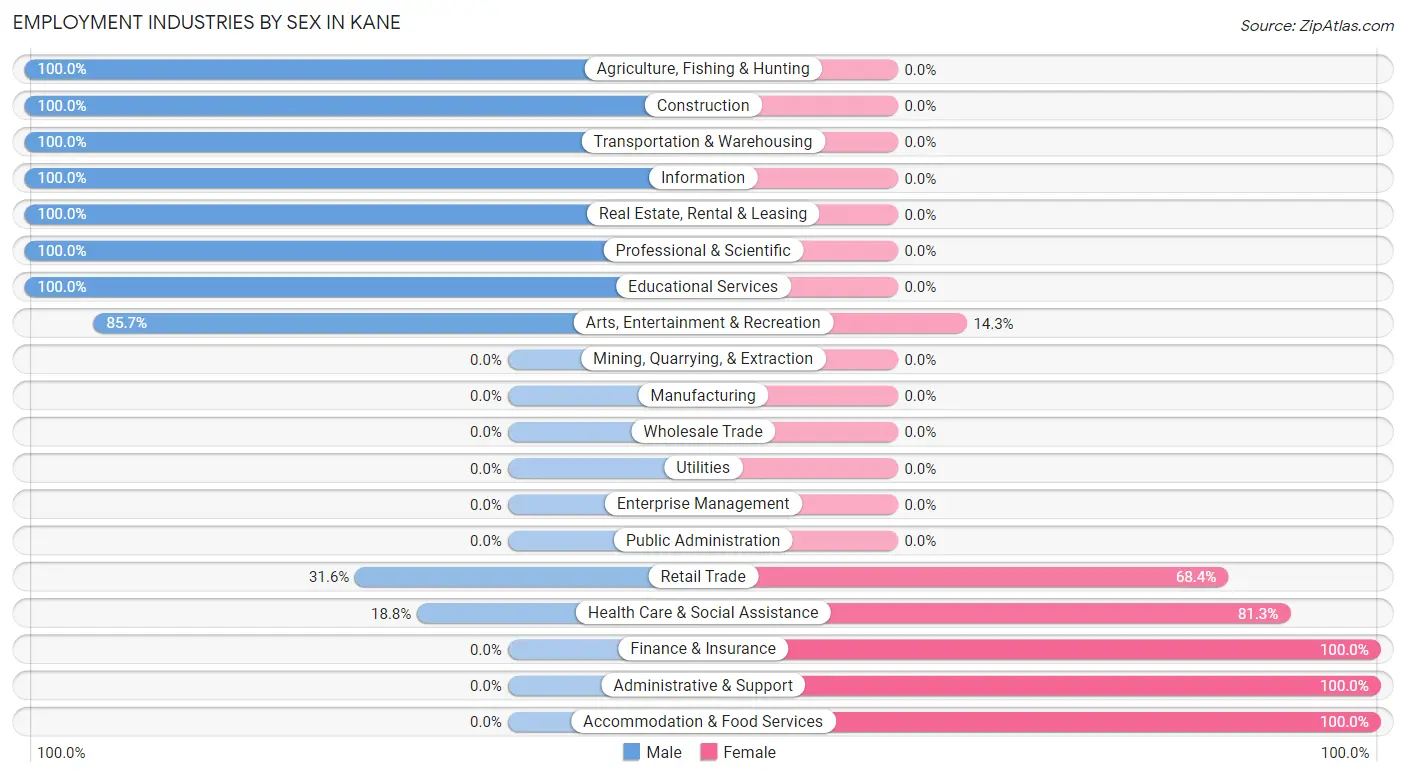
| Industry | Male | Female |
| Agriculture, Fishing & Hunting | 7 (100.0%) | 0 (0.0%) |
| Mining, Quarrying, & Extraction | 0 (0.0%) | 0 (0.0%) |
| Construction | 2 (100.0%) | 0 (0.0%) |
| Manufacturing | 0 (0.0%) | 0 (0.0%) |
| Wholesale Trade | 0 (0.0%) | 0 (0.0%) |
| Retail Trade | 6 (31.6%) | 13 (68.4%) |
| Transportation & Warehousing | 6 (100.0%) | 0 (0.0%) |
| Utilities | 0 (0.0%) | 0 (0.0%) |
| Information | 4 (100.0%) | 0 (0.0%) |
| Finance & Insurance | 0 (0.0%) | 4 (100.0%) |
| Real Estate, Rental & Leasing | 1 (100.0%) | 0 (0.0%) |
| Professional & Scientific | 2 (100.0%) | 0 (0.0%) |
| Enterprise Management | 0 (0.0%) | 0 (0.0%) |
| Administrative & Support | 0 (0.0%) | 13 (100.0%) |
| Educational Services | 3 (100.0%) | 0 (0.0%) |
| Health Care & Social Assistance | 3 (18.8%) | 13 (81.2%) |
| Arts, Entertainment & Recreation | 6 (85.7%) | 1 (14.3%) |
| Accommodation & Food Services | 0 (0.0%) | 2 (100.0%) |
| Public Administration | 0 (0.0%) | 0 (0.0%) |
| Total | 44 (45.8%) | 52 (54.2%) |
Education in Kane
School Enrollment in Kane
The most common levels of schooling among the 32 students in Kane are high school (15 | 46.9%), middle school (7 | 21.9%), and elementary school (6 | 18.8%).
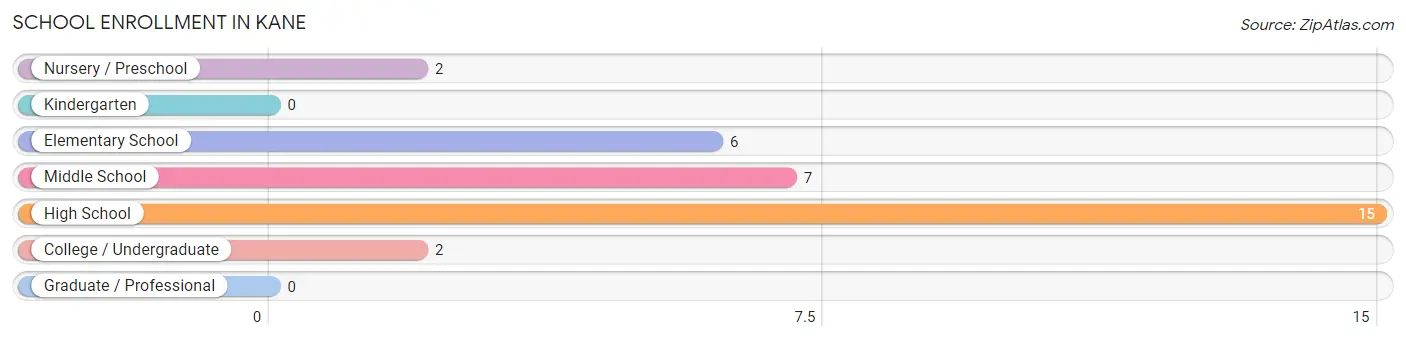
| School Level | # Students | % Students |
| Nursery / Preschool | 2 | 6.2% |
| Kindergarten | 0 | 0.0% |
| Elementary School | 6 | 18.8% |
| Middle School | 7 | 21.9% |
| High School | 15 | 46.9% |
| College / Undergraduate | 2 | 6.2% |
| Graduate / Professional | 0 | 0.0% |
| Total | 32 | 100.0% |
School Enrollment by Age by Funding Source in Kane
Out of a total of 32 students who are enrolled in schools in Kane, 3 (9.4%) attend a private institution, while the remaining 29 (90.6%) are enrolled in public schools. The age group of 5 to 9 year old has the highest likelihood of being enrolled in private schools, with 3 (37.5% in the age bracket) enrolled. Conversely, the age group of 10 to 14 year olds has the lowest likelihood of being enrolled in a private school, with 9 (100.0% in the age bracket) attending a public institution.
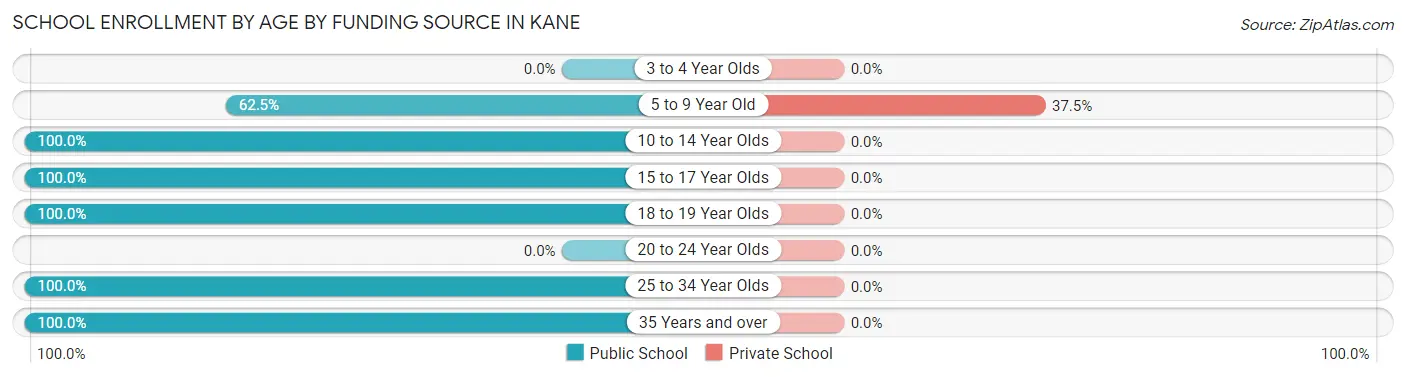
| Age Bracket | Public School | Private School |
| 3 to 4 Year Olds | 0 (0.0%) | 0 (0.0%) |
| 5 to 9 Year Old | 5 (62.5%) | 3 (37.5%) |
| 10 to 14 Year Olds | 9 (100.0%) | 0 (0.0%) |
| 15 to 17 Year Olds | 12 (100.0%) | 0 (0.0%) |
| 18 to 19 Year Olds | 1 (100.0%) | 0 (0.0%) |
| 20 to 24 Year Olds | 0 (0.0%) | 0 (0.0%) |
| 25 to 34 Year Olds | 1 (100.0%) | 0 (0.0%) |
| 35 Years and over | 1 (100.0%) | 0 (0.0%) |
| Total | 29 (90.6%) | 3 (9.4%) |
Educational Attainment by Field of Study in Kane
Education (3 | 60.0%), and business (2 | 40.0%) are the most common fields of study among 5 individuals in Kane who have obtained a bachelor's degree or higher.
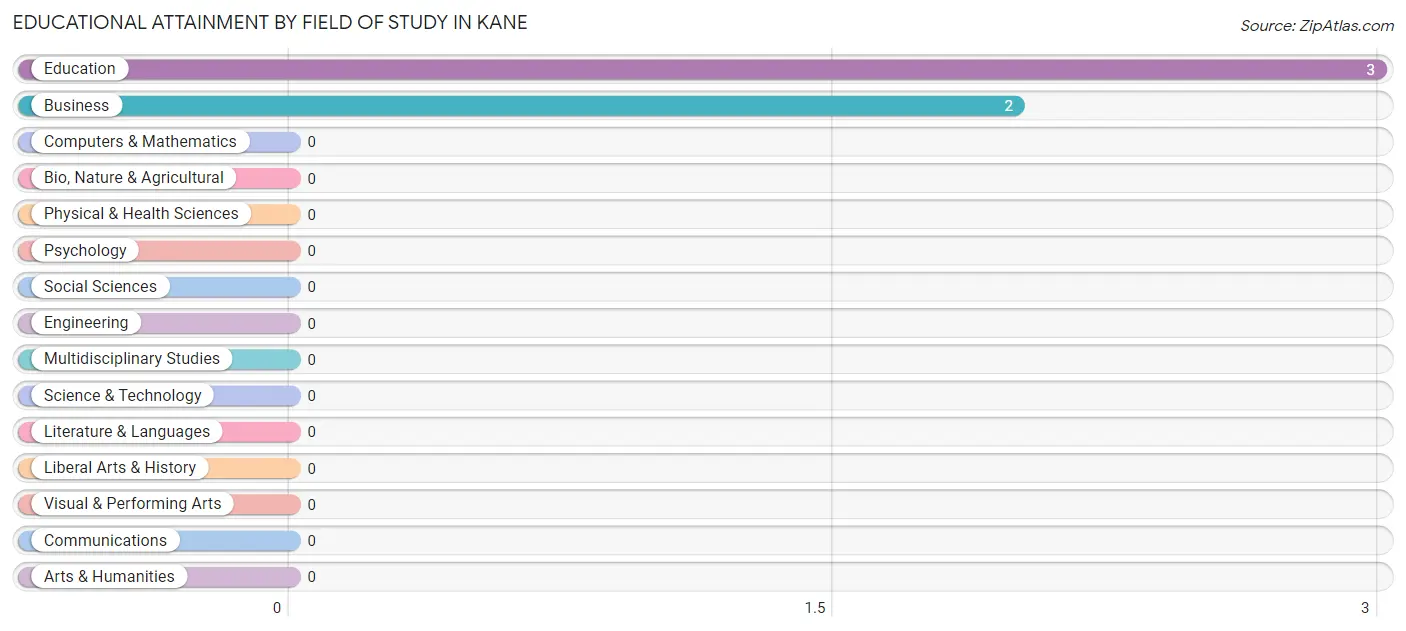
| Field of Study | # Graduates | % Graduates |
| Computers & Mathematics | 0 | 0.0% |
| Bio, Nature & Agricultural | 0 | 0.0% |
| Physical & Health Sciences | 0 | 0.0% |
| Psychology | 0 | 0.0% |
| Social Sciences | 0 | 0.0% |
| Engineering | 0 | 0.0% |
| Multidisciplinary Studies | 0 | 0.0% |
| Science & Technology | 0 | 0.0% |
| Business | 2 | 40.0% |
| Education | 3 | 60.0% |
| Literature & Languages | 0 | 0.0% |
| Liberal Arts & History | 0 | 0.0% |
| Visual & Performing Arts | 0 | 0.0% |
| Communications | 0 | 0.0% |
| Arts & Humanities | 0 | 0.0% |
| Total | 5 | 100.0% |
Transportation & Commute in Kane
Vehicle Availability by Sex in Kane
The most prevalent vehicle ownership categories in Kane are males with 2 vehicles (16, accounting for 39.0%) and females with 2 vehicles (14, making up 30.8%).
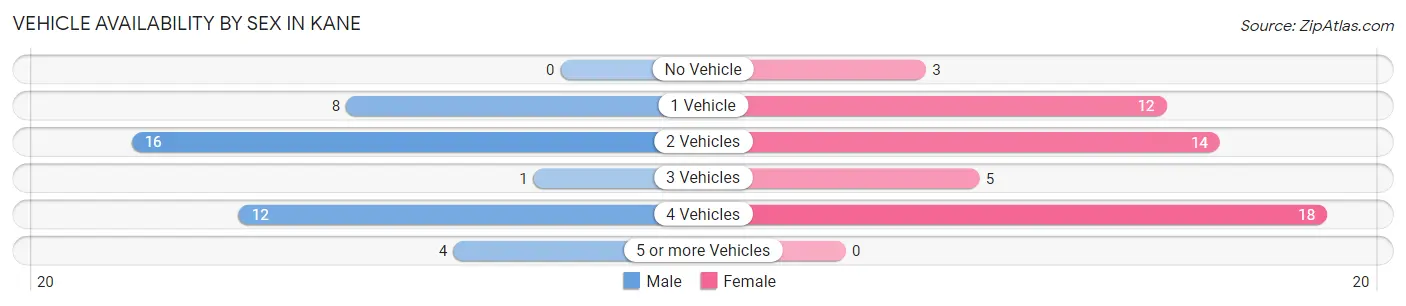
| Vehicles Available | Male | Female |
| No Vehicle | 0 (0.0%) | 3 (5.8%) |
| 1 Vehicle | 8 (19.5%) | 12 (23.1%) |
| 2 Vehicles | 16 (39.0%) | 14 (26.9%) |
| 3 Vehicles | 1 (2.4%) | 5 (9.6%) |
| 4 Vehicles | 12 (29.3%) | 18 (34.6%) |
| 5 or more Vehicles | 4 (9.8%) | 0 (0.0%) |
| Total | 41 (100.0%) | 52 (100.0%) |
Commute Time in Kane
The most frequently occuring commute durations in Kane are 15 to 19 minutes (24 commuters, 27.6%), 10 to 14 minutes (15 commuters, 17.2%), and 20 to 24 minutes (11 commuters, 12.6%).
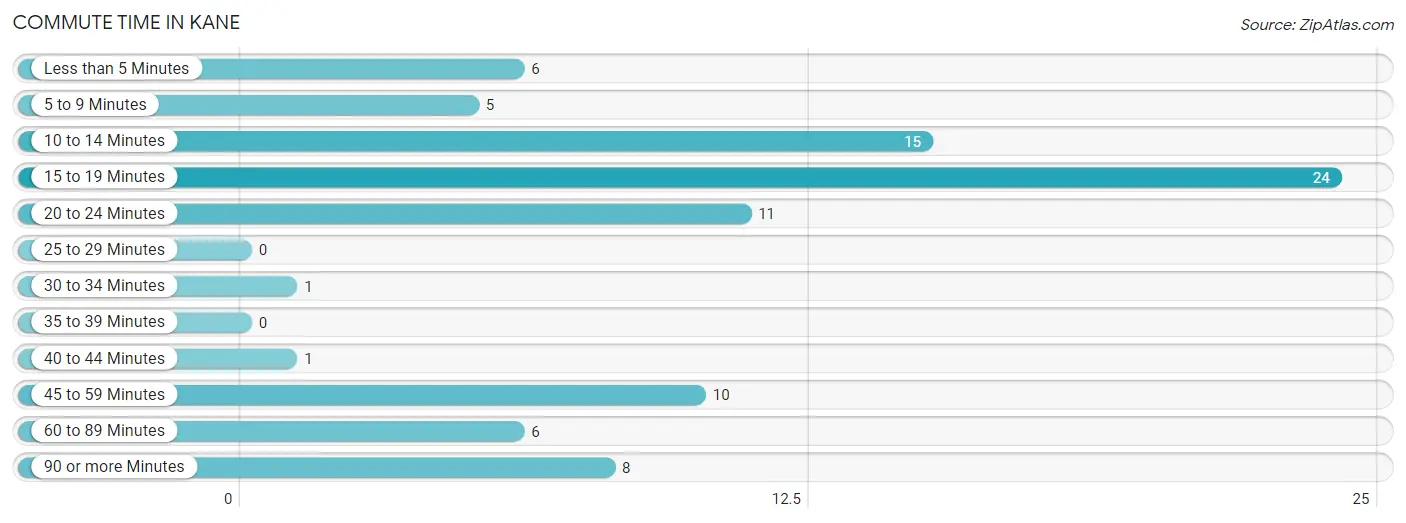
| Commute Time | # Commuters | % Commuters |
| Less than 5 Minutes | 6 | 6.9% |
| 5 to 9 Minutes | 5 | 5.8% |
| 10 to 14 Minutes | 15 | 17.2% |
| 15 to 19 Minutes | 24 | 27.6% |
| 20 to 24 Minutes | 11 | 12.6% |
| 25 to 29 Minutes | 0 | 0.0% |
| 30 to 34 Minutes | 1 | 1.1% |
| 35 to 39 Minutes | 0 | 0.0% |
| 40 to 44 Minutes | 1 | 1.1% |
| 45 to 59 Minutes | 10 | 11.5% |
| 60 to 89 Minutes | 6 | 6.9% |
| 90 or more Minutes | 8 | 9.2% |
Commute Time by Sex in Kane
The most common commute times in Kane are 20 to 24 minutes (7 commuters, 17.9%) for males and 15 to 19 minutes (18 commuters, 37.5%) for females.
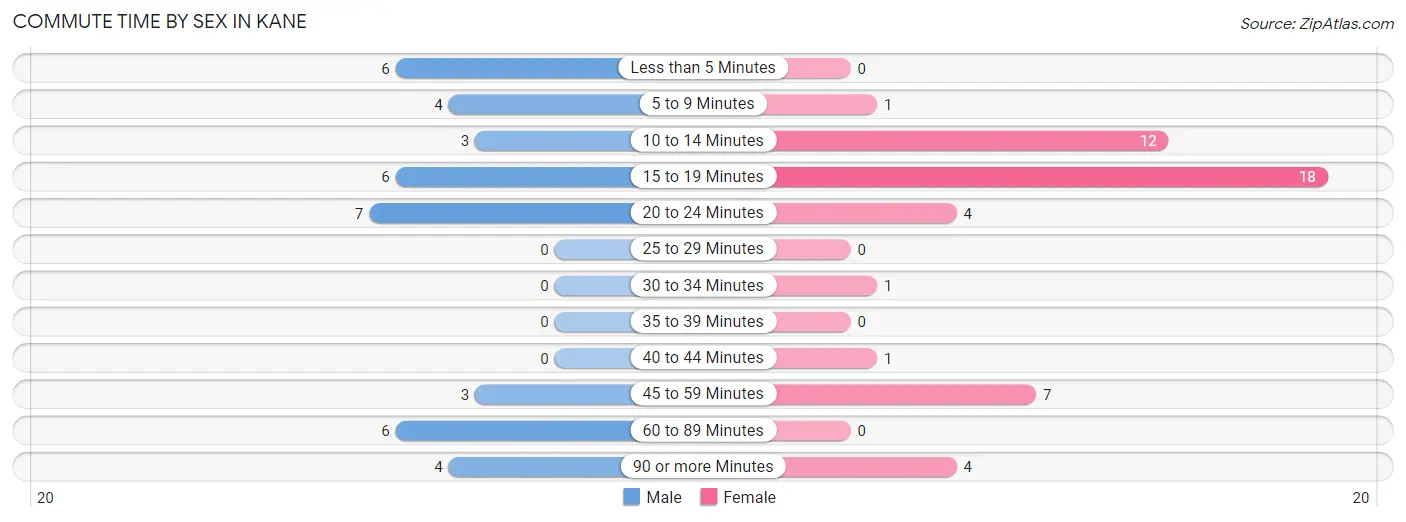
| Commute Time | Male | Female |
| Less than 5 Minutes | 6 (15.4%) | 0 (0.0%) |
| 5 to 9 Minutes | 4 (10.3%) | 1 (2.1%) |
| 10 to 14 Minutes | 3 (7.7%) | 12 (25.0%) |
| 15 to 19 Minutes | 6 (15.4%) | 18 (37.5%) |
| 20 to 24 Minutes | 7 (17.9%) | 4 (8.3%) |
| 25 to 29 Minutes | 0 (0.0%) | 0 (0.0%) |
| 30 to 34 Minutes | 0 (0.0%) | 1 (2.1%) |
| 35 to 39 Minutes | 0 (0.0%) | 0 (0.0%) |
| 40 to 44 Minutes | 0 (0.0%) | 1 (2.1%) |
| 45 to 59 Minutes | 3 (7.7%) | 7 (14.6%) |
| 60 to 89 Minutes | 6 (15.4%) | 0 (0.0%) |
| 90 or more Minutes | 4 (10.3%) | 4 (8.3%) |
Time of Departure to Work by Sex in Kane
The most frequent times of departure to work in Kane are 12:00 AM to 4:59 AM (6, 15.4%) for males and 7:00 AM to 7:29 AM (13, 27.1%) for females.
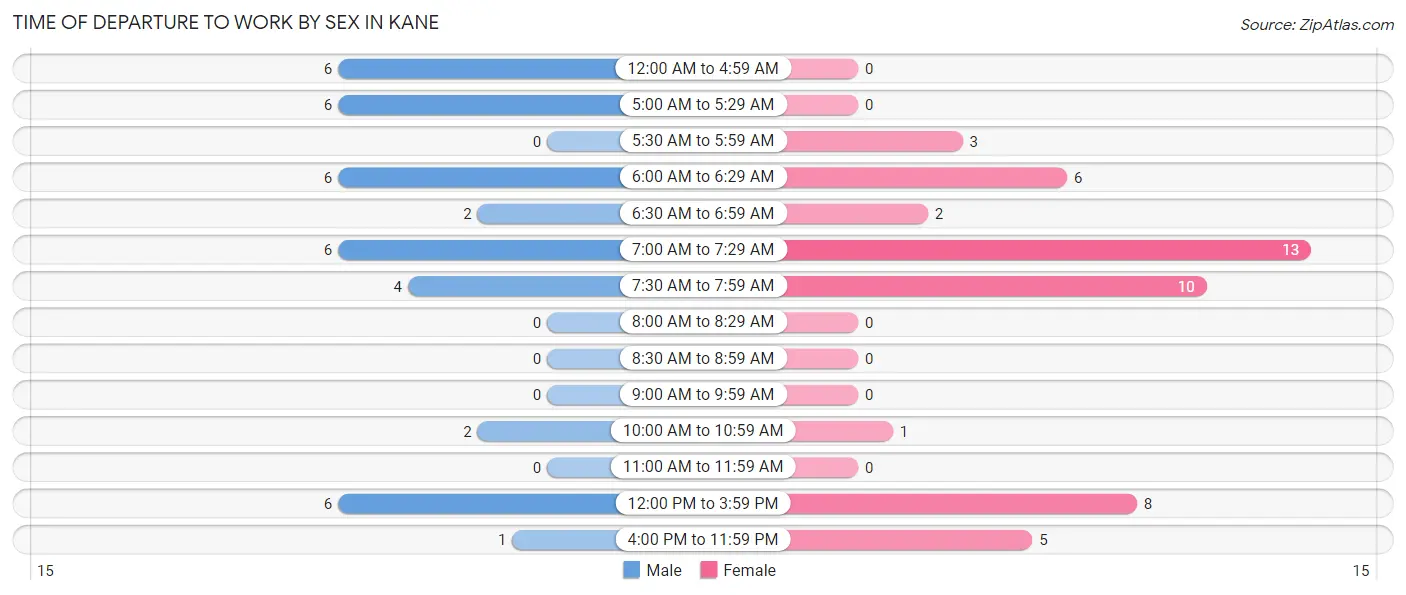
| Time of Departure | Male | Female |
| 12:00 AM to 4:59 AM | 6 (15.4%) | 0 (0.0%) |
| 5:00 AM to 5:29 AM | 6 (15.4%) | 0 (0.0%) |
| 5:30 AM to 5:59 AM | 0 (0.0%) | 3 (6.2%) |
| 6:00 AM to 6:29 AM | 6 (15.4%) | 6 (12.5%) |
| 6:30 AM to 6:59 AM | 2 (5.1%) | 2 (4.2%) |
| 7:00 AM to 7:29 AM | 6 (15.4%) | 13 (27.1%) |
| 7:30 AM to 7:59 AM | 4 (10.3%) | 10 (20.8%) |
| 8:00 AM to 8:29 AM | 0 (0.0%) | 0 (0.0%) |
| 8:30 AM to 8:59 AM | 0 (0.0%) | 0 (0.0%) |
| 9:00 AM to 9:59 AM | 0 (0.0%) | 0 (0.0%) |
| 10:00 AM to 10:59 AM | 2 (5.1%) | 1 (2.1%) |
| 11:00 AM to 11:59 AM | 0 (0.0%) | 0 (0.0%) |
| 12:00 PM to 3:59 PM | 6 (15.4%) | 8 (16.7%) |
| 4:00 PM to 11:59 PM | 1 (2.6%) | 5 (10.4%) |
| Total | 39 (100.0%) | 48 (100.0%) |
Housing Occupancy in Kane
Occupancy by Ownership in Kane
Of the total 83 dwellings in Kane, owner-occupied units account for 68 (81.9%), while renter-occupied units make up 15 (18.1%).
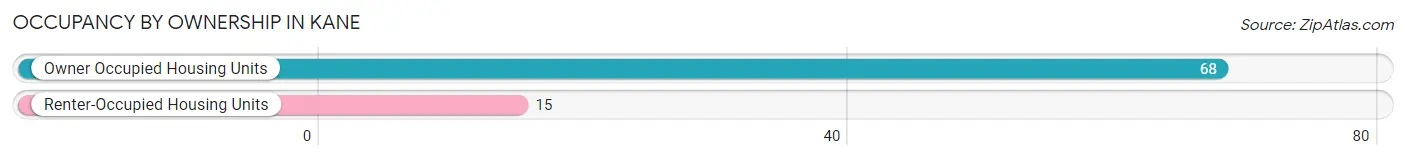
| Occupancy | # Housing Units | % Housing Units |
| Owner Occupied Housing Units | 68 | 81.9% |
| Renter-Occupied Housing Units | 15 | 18.1% |
| Total Occupied Housing Units | 83 | 100.0% |
Occupancy by Household Size in Kane
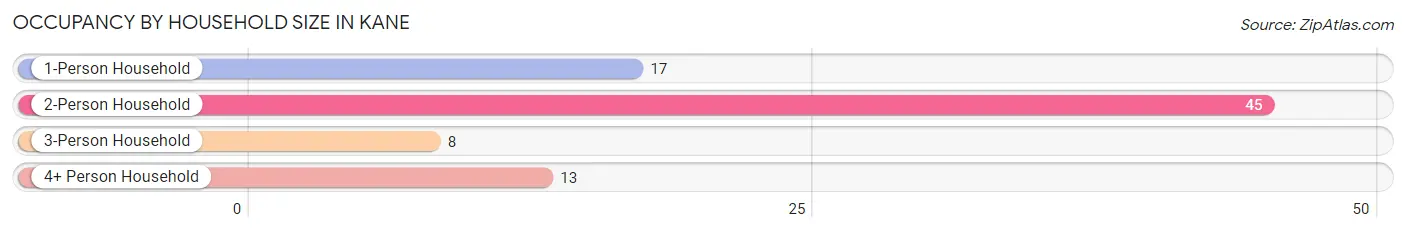
| Household Size | # Housing Units | % Housing Units |
| 1-Person Household | 17 | 20.5% |
| 2-Person Household | 45 | 54.2% |
| 3-Person Household | 8 | 9.6% |
| 4+ Person Household | 13 | 15.7% |
| Total Housing Units | 83 | 100.0% |
Occupancy by Ownership by Household Size in Kane
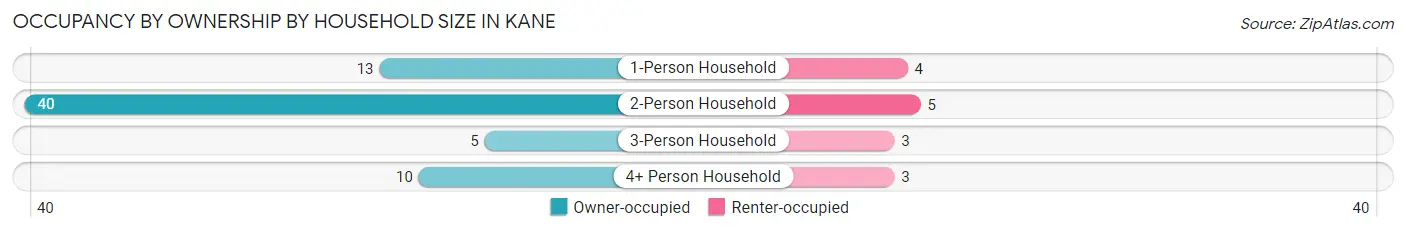
| Household Size | Owner-occupied | Renter-occupied |
| 1-Person Household | 13 (76.5%) | 4 (23.5%) |
| 2-Person Household | 40 (88.9%) | 5 (11.1%) |
| 3-Person Household | 5 (62.5%) | 3 (37.5%) |
| 4+ Person Household | 10 (76.9%) | 3 (23.1%) |
| Total Housing Units | 68 (81.9%) | 15 (18.1%) |
Occupancy by Educational Attainment in Kane
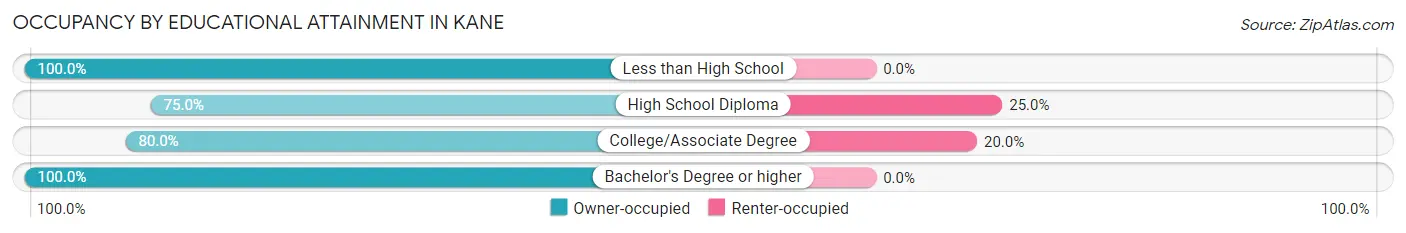
| Household Size | Owner-occupied | Renter-occupied |
| Less than High School | 13 (100.0%) | 0 (0.0%) |
| High School Diploma | 36 (75.0%) | 12 (25.0%) |
| College/Associate Degree | 12 (80.0%) | 3 (20.0%) |
| Bachelor's Degree or higher | 7 (100.0%) | 0 (0.0%) |
Occupancy by Age of Householder in Kane
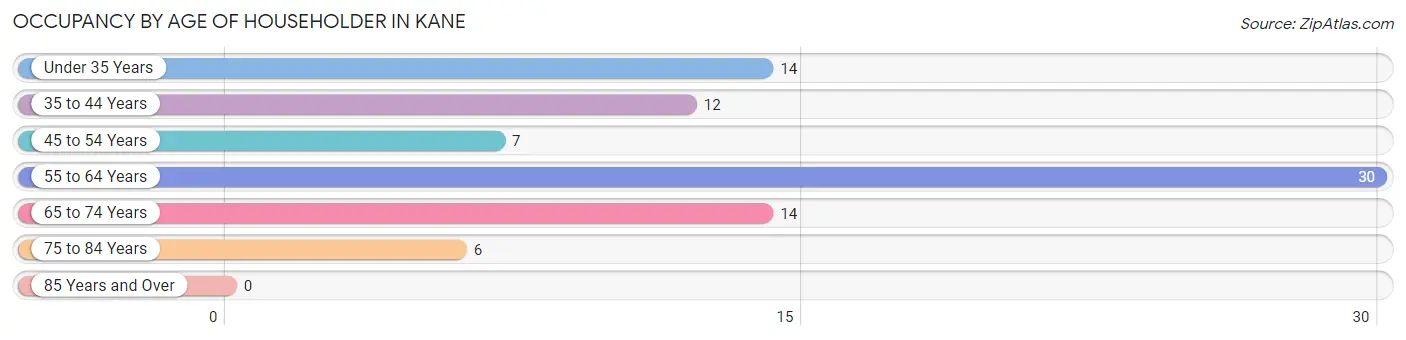
| Age Bracket | # Households | % Households |
| Under 35 Years | 14 | 16.9% |
| 35 to 44 Years | 12 | 14.5% |
| 45 to 54 Years | 7 | 8.4% |
| 55 to 64 Years | 30 | 36.1% |
| 65 to 74 Years | 14 | 16.9% |
| 75 to 84 Years | 6 | 7.2% |
| 85 Years and Over | 0 | 0.0% |
| Total | 83 | 100.0% |
Housing Finances in Kane
Median Income by Occupancy in Kane
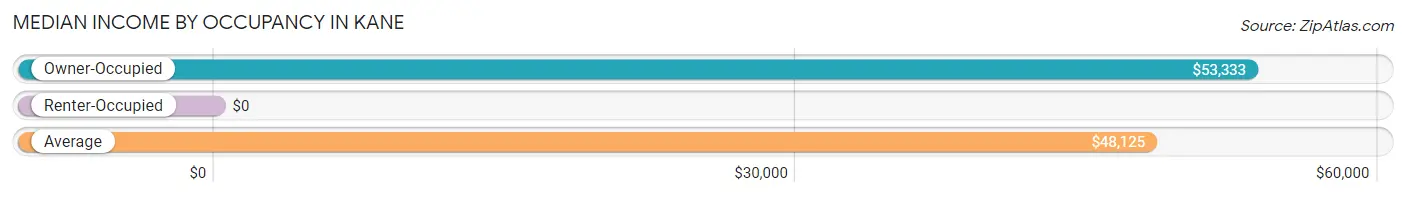
| Occupancy Type | # Households | Median Income |
| Owner-Occupied | 68 (81.9%) | $53,333 |
| Renter-Occupied | 15 (18.1%) | $0 |
| Average | 83 (100.0%) | $48,125 |
Occupancy by Householder Income Bracket in Kane
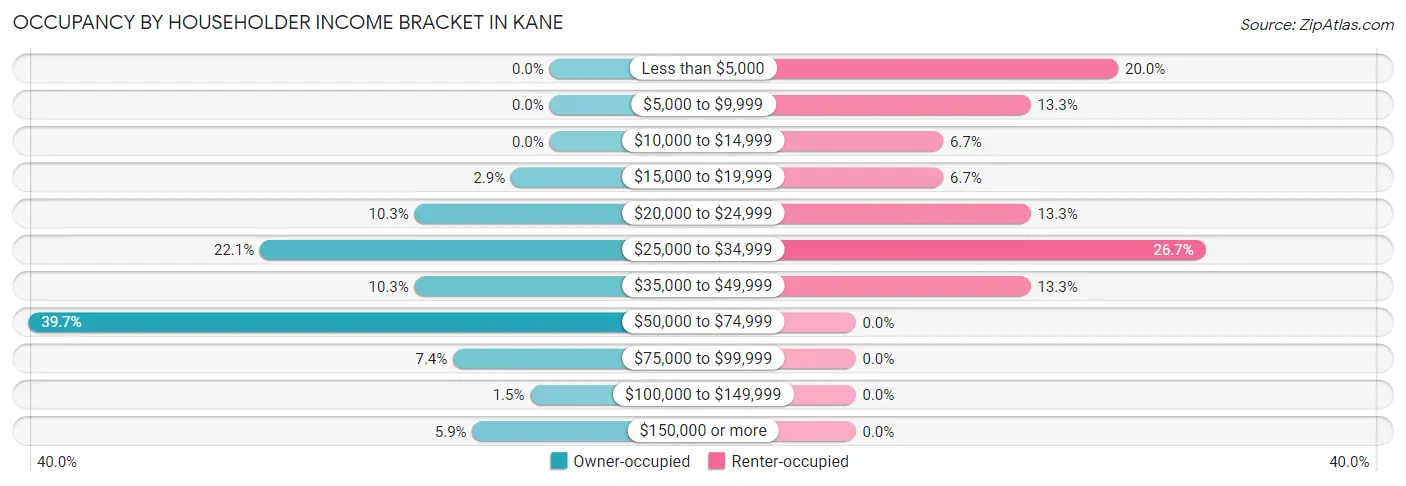
| Income Bracket | Owner-occupied | Renter-occupied |
| Less than $5,000 | 0 (0.0%) | 3 (20.0%) |
| $5,000 to $9,999 | 0 (0.0%) | 2 (13.3%) |
| $10,000 to $14,999 | 0 (0.0%) | 1 (6.7%) |
| $15,000 to $19,999 | 2 (2.9%) | 1 (6.7%) |
| $20,000 to $24,999 | 7 (10.3%) | 2 (13.3%) |
| $25,000 to $34,999 | 15 (22.1%) | 4 (26.7%) |
| $35,000 to $49,999 | 7 (10.3%) | 2 (13.3%) |
| $50,000 to $74,999 | 27 (39.7%) | 0 (0.0%) |
| $75,000 to $99,999 | 5 (7.3%) | 0 (0.0%) |
| $100,000 to $149,999 | 1 (1.5%) | 0 (0.0%) |
| $150,000 or more | 4 (5.9%) | 0 (0.0%) |
| Total | 68 (100.0%) | 15 (100.0%) |
Monthly Housing Cost Tiers in Kane
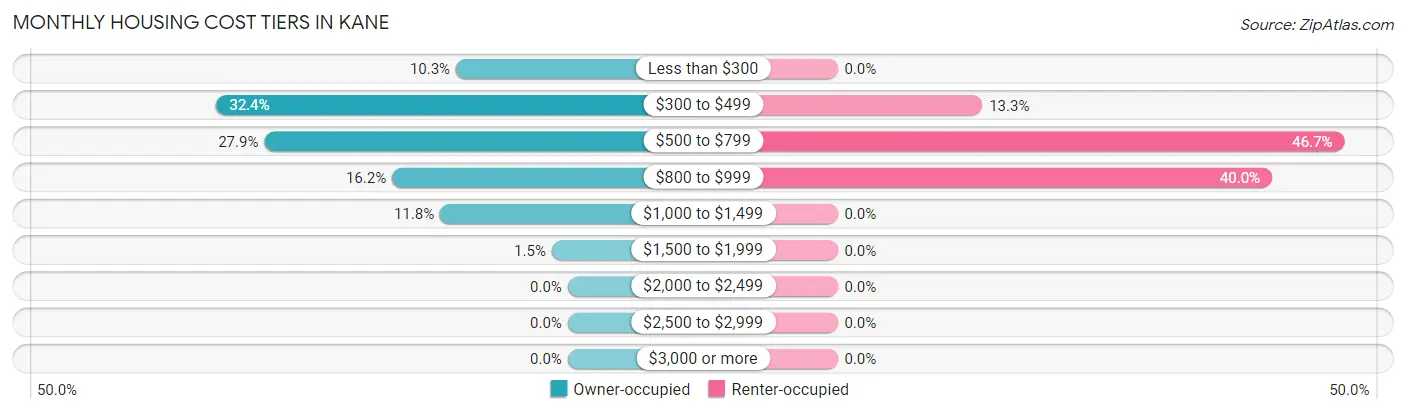
| Monthly Cost | Owner-occupied | Renter-occupied |
| Less than $300 | 7 (10.3%) | 0 (0.0%) |
| $300 to $499 | 22 (32.4%) | 2 (13.3%) |
| $500 to $799 | 19 (27.9%) | 7 (46.7%) |
| $800 to $999 | 11 (16.2%) | 6 (40.0%) |
| $1,000 to $1,499 | 8 (11.8%) | 0 (0.0%) |
| $1,500 to $1,999 | 1 (1.5%) | 0 (0.0%) |
| $2,000 to $2,499 | 0 (0.0%) | 0 (0.0%) |
| $2,500 to $2,999 | 0 (0.0%) | 0 (0.0%) |
| $3,000 or more | 0 (0.0%) | 0 (0.0%) |
| Total | 68 (100.0%) | 15 (100.0%) |
Physical Housing Characteristics in Kane
Housing Structures in Kane
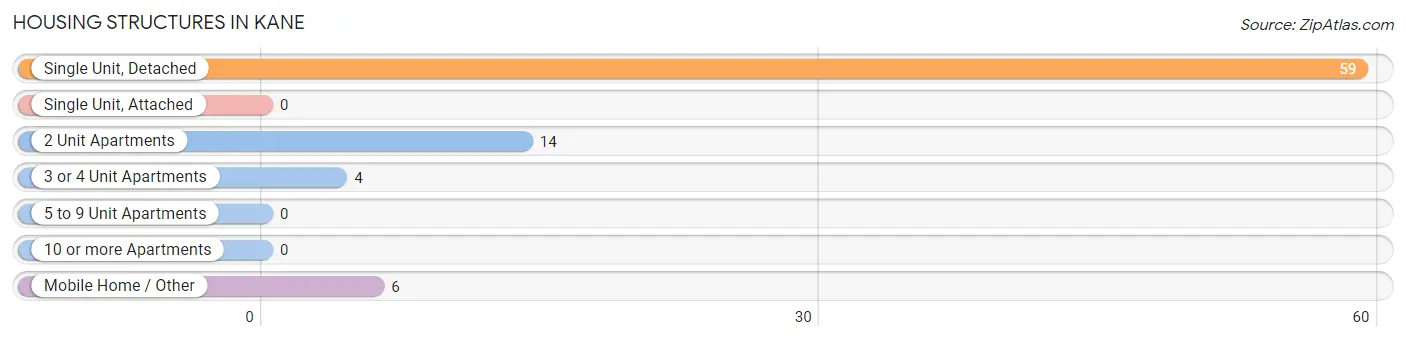
| Structure Type | # Housing Units | % Housing Units |
| Single Unit, Detached | 59 | 71.1% |
| Single Unit, Attached | 0 | 0.0% |
| 2 Unit Apartments | 14 | 16.9% |
| 3 or 4 Unit Apartments | 4 | 4.8% |
| 5 to 9 Unit Apartments | 0 | 0.0% |
| 10 or more Apartments | 0 | 0.0% |
| Mobile Home / Other | 6 | 7.2% |
| Total | 83 | 100.0% |
Housing Structures by Occupancy in Kane
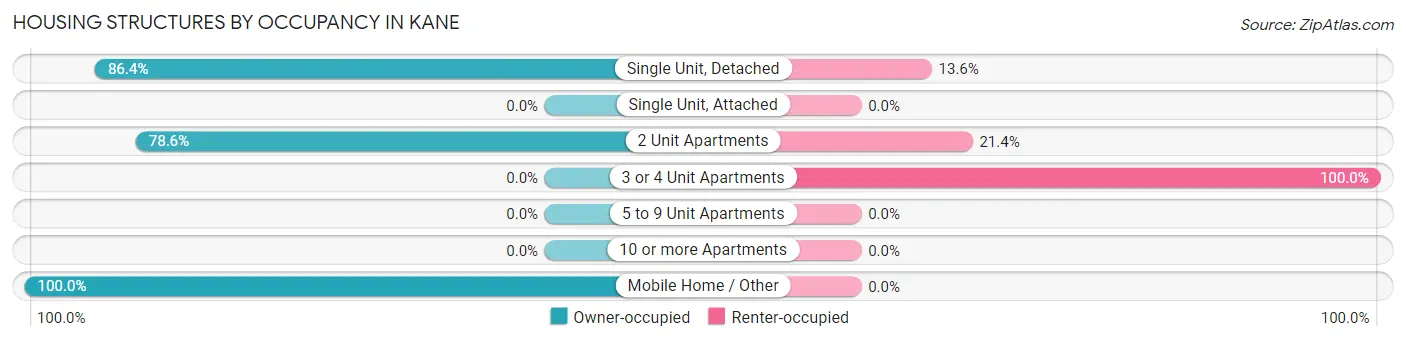
| Structure Type | Owner-occupied | Renter-occupied |
| Single Unit, Detached | 51 (86.4%) | 8 (13.6%) |
| Single Unit, Attached | 0 (0.0%) | 0 (0.0%) |
| 2 Unit Apartments | 11 (78.6%) | 3 (21.4%) |
| 3 or 4 Unit Apartments | 0 (0.0%) | 4 (100.0%) |
| 5 to 9 Unit Apartments | 0 (0.0%) | 0 (0.0%) |
| 10 or more Apartments | 0 (0.0%) | 0 (0.0%) |
| Mobile Home / Other | 6 (100.0%) | 0 (0.0%) |
| Total | 68 (81.9%) | 15 (18.1%) |
Housing Structures by Number of Rooms in Kane
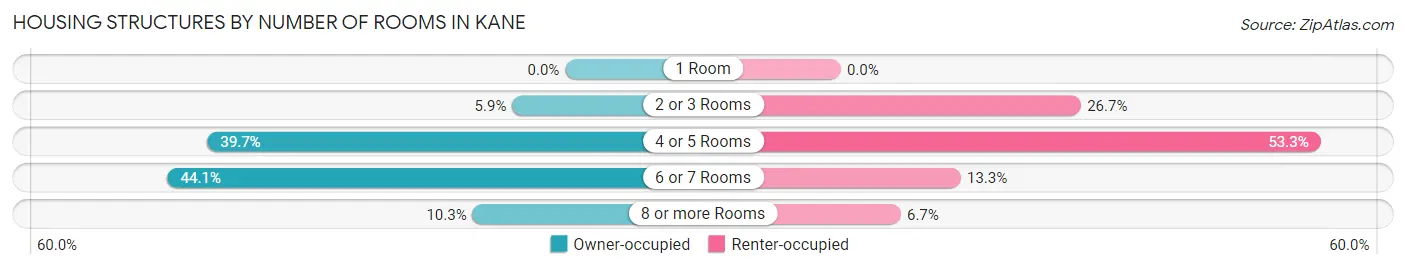
| Number of Rooms | Owner-occupied | Renter-occupied |
| 1 Room | 0 (0.0%) | 0 (0.0%) |
| 2 or 3 Rooms | 4 (5.9%) | 4 (26.7%) |
| 4 or 5 Rooms | 27 (39.7%) | 8 (53.3%) |
| 6 or 7 Rooms | 30 (44.1%) | 2 (13.3%) |
| 8 or more Rooms | 7 (10.3%) | 1 (6.7%) |
| Total | 68 (100.0%) | 15 (100.0%) |
Housing Structure by Heating Type in Kane
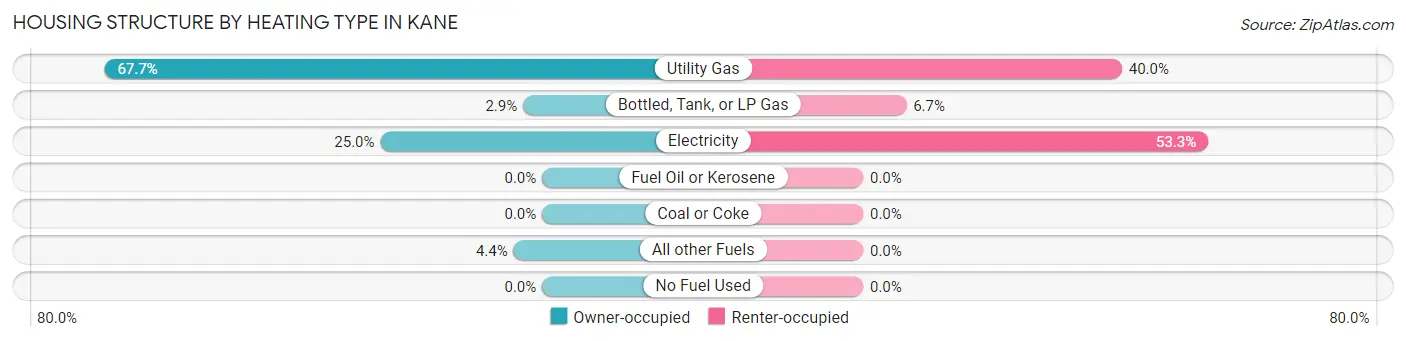
| Heating Type | Owner-occupied | Renter-occupied |
| Utility Gas | 46 (67.6%) | 6 (40.0%) |
| Bottled, Tank, or LP Gas | 2 (2.9%) | 1 (6.7%) |
| Electricity | 17 (25.0%) | 8 (53.3%) |
| Fuel Oil or Kerosene | 0 (0.0%) | 0 (0.0%) |
| Coal or Coke | 0 (0.0%) | 0 (0.0%) |
| All other Fuels | 3 (4.4%) | 0 (0.0%) |
| No Fuel Used | 0 (0.0%) | 0 (0.0%) |
| Total | 68 (100.0%) | 15 (100.0%) |
Household Vehicle Usage in Kane
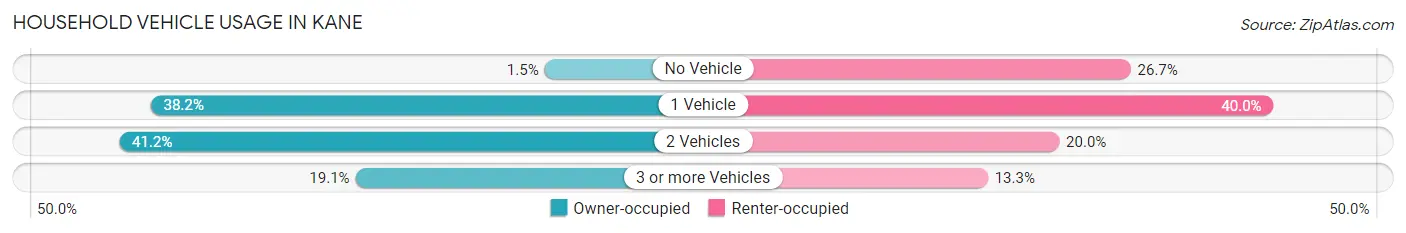
| Vehicles per Household | Owner-occupied | Renter-occupied |
| No Vehicle | 1 (1.5%) | 4 (26.7%) |
| 1 Vehicle | 26 (38.2%) | 6 (40.0%) |
| 2 Vehicles | 28 (41.2%) | 3 (20.0%) |
| 3 or more Vehicles | 13 (19.1%) | 2 (13.3%) |
| Total | 68 (100.0%) | 15 (100.0%) |
Real Estate & Mortgages in Kane
Real Estate and Mortgage Overview in Kane
| Characteristic | Without Mortgage | With Mortgage |
| Housing Units | 44 | 24 |
| Median Property Value | $78,900 | $85,000 |
| Median Household Income | $55,455 | $4 |
| Monthly Housing Costs | $371 | $0 |
| Real Estate Taxes | - | - |
Property Value by Mortgage Status in Kane
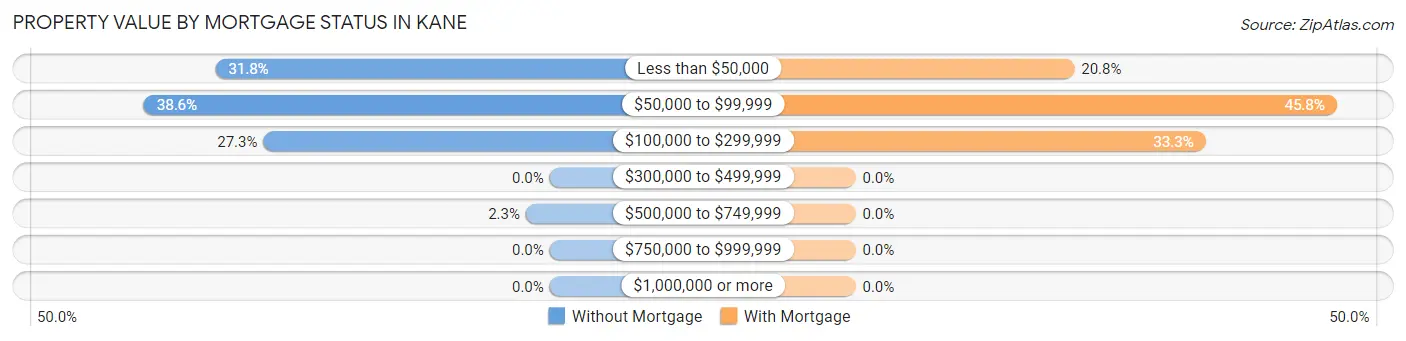
| Property Value | Without Mortgage | With Mortgage |
| Less than $50,000 | 14 (31.8%) | 5 (20.8%) |
| $50,000 to $99,999 | 17 (38.6%) | 11 (45.8%) |
| $100,000 to $299,999 | 12 (27.3%) | 8 (33.3%) |
| $300,000 to $499,999 | 0 (0.0%) | 0 (0.0%) |
| $500,000 to $749,999 | 1 (2.3%) | 0 (0.0%) |
| $750,000 to $999,999 | 0 (0.0%) | 0 (0.0%) |
| $1,000,000 or more | 0 (0.0%) | 0 (0.0%) |
| Total | 44 (100.0%) | 24 (100.0%) |
Household Income by Mortgage Status in Kane
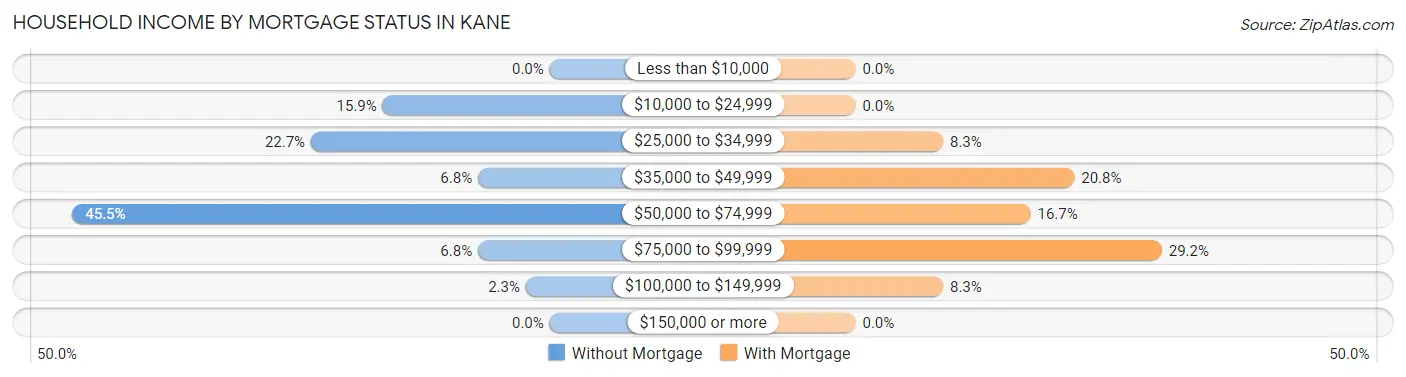
| Household Income | Without Mortgage | With Mortgage |
| Less than $10,000 | 0 (0.0%) | 0 (0.0%) |
| $10,000 to $24,999 | 7 (15.9%) | 0 (0.0%) |
| $25,000 to $34,999 | 10 (22.7%) | 2 (8.3%) |
| $35,000 to $49,999 | 3 (6.8%) | 5 (20.8%) |
| $50,000 to $74,999 | 20 (45.5%) | 4 (16.7%) |
| $75,000 to $99,999 | 3 (6.8%) | 7 (29.2%) |
| $100,000 to $149,999 | 1 (2.3%) | 2 (8.3%) |
| $150,000 or more | 0 (0.0%) | 0 (0.0%) |
| Total | 44 (100.0%) | 24 (100.0%) |
Property Value to Household Income Ratio in Kane
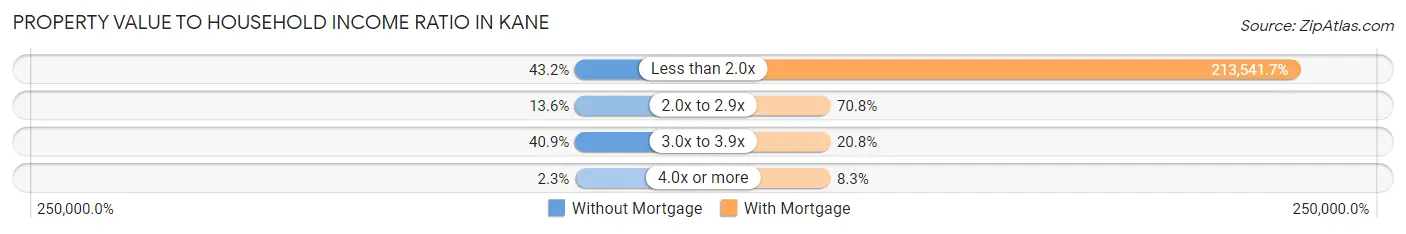
| Value-to-Income Ratio | Without Mortgage | With Mortgage |
| Less than 2.0x | 19 (43.2%) | 51,250 (213,541.7%) |
| 2.0x to 2.9x | 6 (13.6%) | 17 (70.8%) |
| 3.0x to 3.9x | 18 (40.9%) | 5 (20.8%) |
| 4.0x or more | 1 (2.3%) | 2 (8.3%) |
| Total | 44 (100.0%) | 24 (100.0%) |
Real Estate Taxes by Mortgage Status in Kane
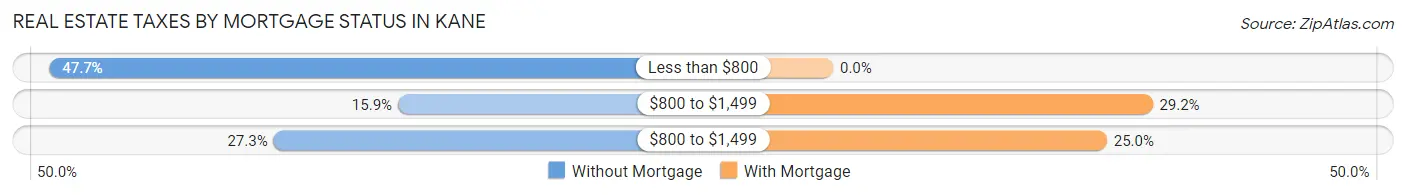
| Property Taxes | Without Mortgage | With Mortgage |
| Less than $800 | 21 (47.7%) | 0 (0.0%) |
| $800 to $1,499 | 7 (15.9%) | 7 (29.2%) |
| $800 to $1,499 | 12 (27.3%) | 6 (25.0%) |
| Total | 44 (100.0%) | 24 (100.0%) |
Health & Disability in Kane
Health Insurance Coverage by Age in Kane
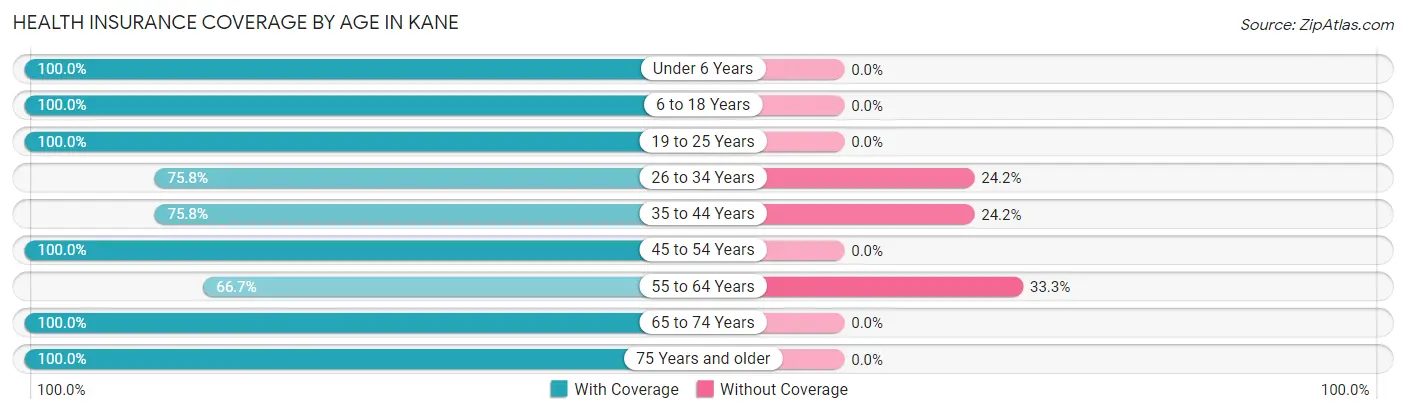
| Age Bracket | With Coverage | Without Coverage |
| Under 6 Years | 6 (100.0%) | 0 (0.0%) |
| 6 to 18 Years | 28 (100.0%) | 0 (0.0%) |
| 19 to 25 Years | 20 (100.0%) | 0 (0.0%) |
| 26 to 34 Years | 25 (75.8%) | 8 (24.2%) |
| 35 to 44 Years | 25 (75.8%) | 8 (24.2%) |
| 45 to 54 Years | 24 (100.0%) | 0 (0.0%) |
| 55 to 64 Years | 30 (66.7%) | 15 (33.3%) |
| 65 to 74 Years | 24 (100.0%) | 0 (0.0%) |
| 75 Years and older | 14 (100.0%) | 0 (0.0%) |
| Total | 196 (86.3%) | 31 (13.7%) |
Health Insurance Coverage by Citizenship Status in Kane
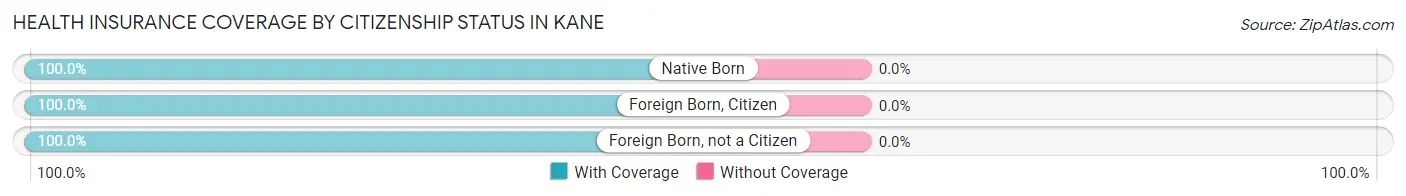
| Citizenship Status | With Coverage | Without Coverage |
| Native Born | 6 (100.0%) | 0 (0.0%) |
| Foreign Born, Citizen | 28 (100.0%) | 0 (0.0%) |
| Foreign Born, not a Citizen | 20 (100.0%) | 0 (0.0%) |
Health Insurance Coverage by Household Income in Kane
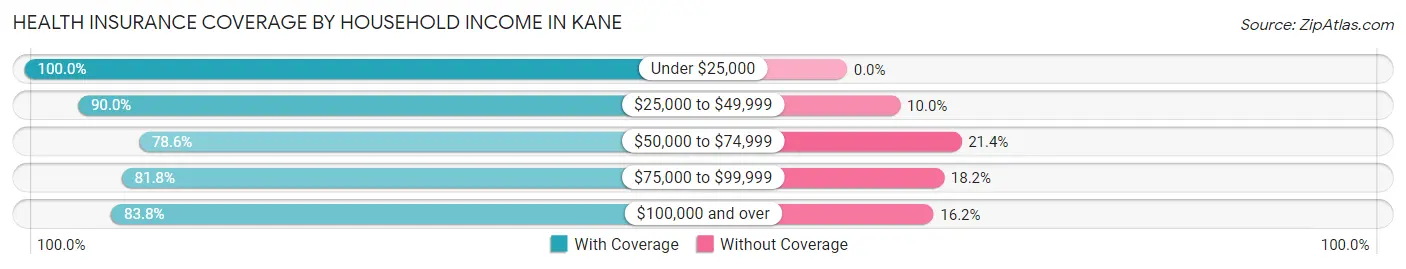
| Household Income | With Coverage | Without Coverage |
| Under $25,000 | 29 (100.0%) | 0 (0.0%) |
| $25,000 to $49,999 | 72 (90.0%) | 8 (10.0%) |
| $50,000 to $74,999 | 55 (78.6%) | 15 (21.4%) |
| $75,000 to $99,999 | 9 (81.8%) | 2 (18.2%) |
| $100,000 and over | 31 (83.8%) | 6 (16.2%) |
Public vs Private Health Insurance Coverage by Age in Kane
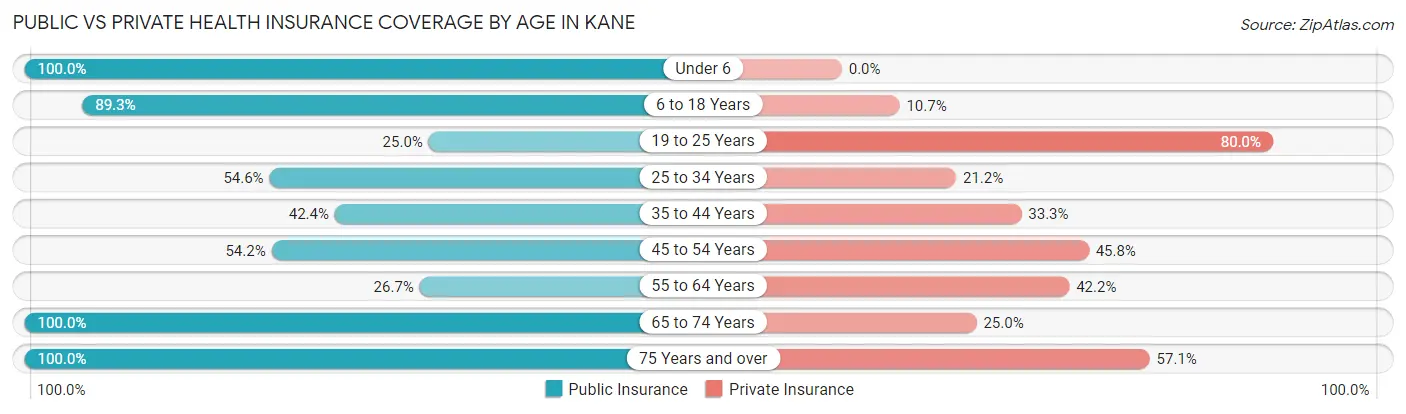
| Age Bracket | Public Insurance | Private Insurance |
| Under 6 | 6 (100.0%) | 0 (0.0%) |
| 6 to 18 Years | 25 (89.3%) | 3 (10.7%) |
| 19 to 25 Years | 5 (25.0%) | 16 (80.0%) |
| 25 to 34 Years | 18 (54.5%) | 7 (21.2%) |
| 35 to 44 Years | 14 (42.4%) | 11 (33.3%) |
| 45 to 54 Years | 13 (54.2%) | 11 (45.8%) |
| 55 to 64 Years | 12 (26.7%) | 19 (42.2%) |
| 65 to 74 Years | 24 (100.0%) | 6 (25.0%) |
| 75 Years and over | 14 (100.0%) | 8 (57.1%) |
| Total | 131 (57.7%) | 81 (35.7%) |
Disability Status by Sex by Age in Kane
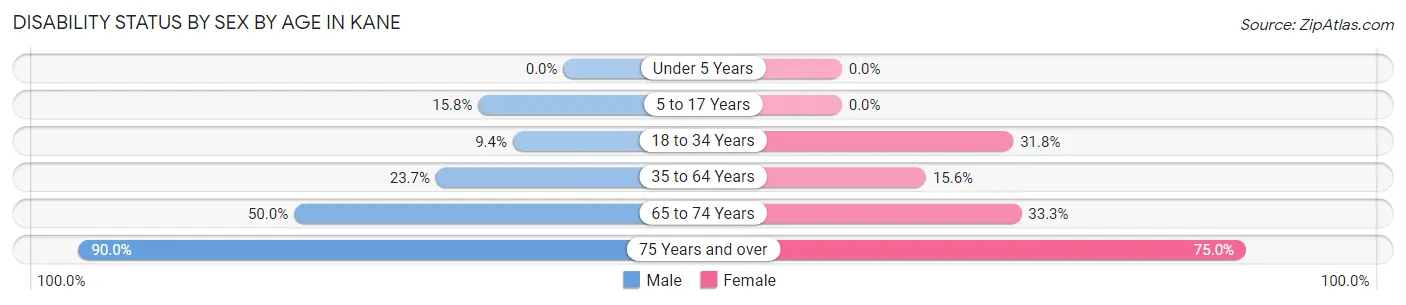
| Age Bracket | Male | Female |
| Under 5 Years | 0 (0.0%) | 0 (0.0%) |
| 5 to 17 Years | 3 (15.8%) | 0 (0.0%) |
| 18 to 34 Years | 3 (9.4%) | 7 (31.8%) |
| 35 to 64 Years | 9 (23.7%) | 10 (15.6%) |
| 65 to 74 Years | 6 (50.0%) | 4 (33.3%) |
| 75 Years and over | 9 (90.0%) | 3 (75.0%) |
Disability Class by Sex by Age in Kane
Disability Class: Hearing Difficulty
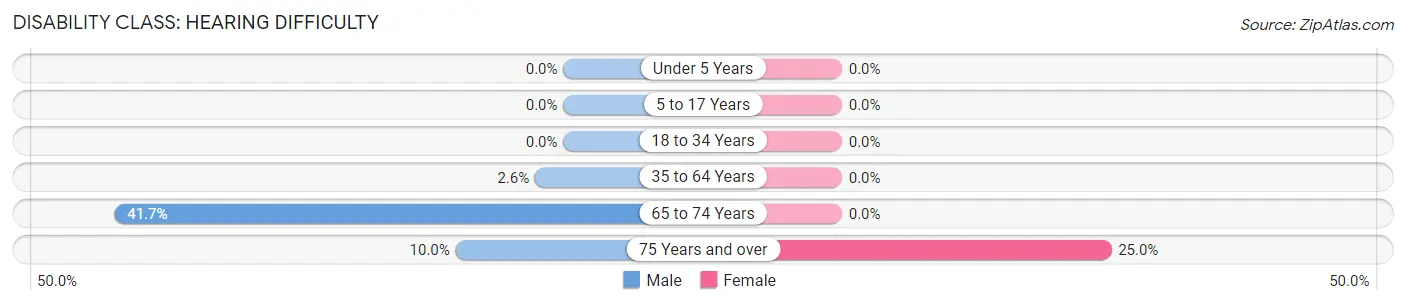
| Age Bracket | Male | Female |
| Under 5 Years | 0 (0.0%) | 0 (0.0%) |
| 5 to 17 Years | 0 (0.0%) | 0 (0.0%) |
| 18 to 34 Years | 0 (0.0%) | 0 (0.0%) |
| 35 to 64 Years | 1 (2.6%) | 0 (0.0%) |
| 65 to 74 Years | 5 (41.7%) | 0 (0.0%) |
| 75 Years and over | 1 (10.0%) | 1 (25.0%) |
Disability Class: Vision Difficulty
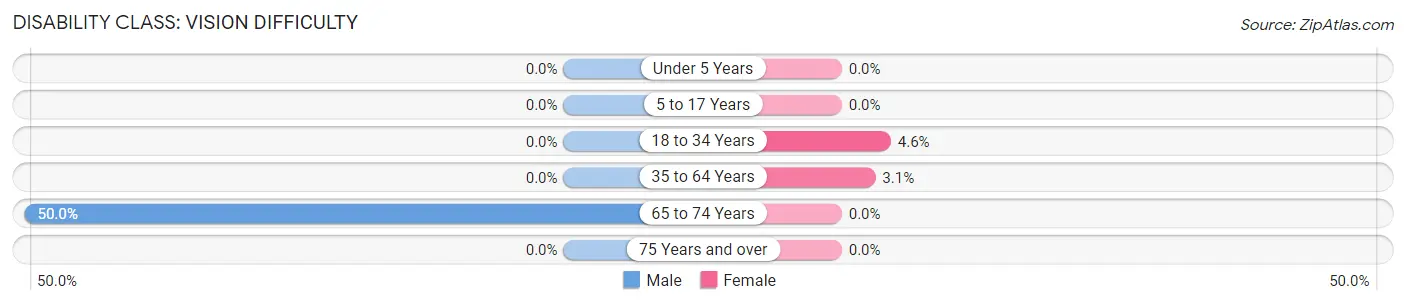
| Age Bracket | Male | Female |
| Under 5 Years | 0 (0.0%) | 0 (0.0%) |
| 5 to 17 Years | 0 (0.0%) | 0 (0.0%) |
| 18 to 34 Years | 0 (0.0%) | 1 (4.5%) |
| 35 to 64 Years | 0 (0.0%) | 2 (3.1%) |
| 65 to 74 Years | 6 (50.0%) | 0 (0.0%) |
| 75 Years and over | 0 (0.0%) | 0 (0.0%) |
Disability Class: Cognitive Difficulty
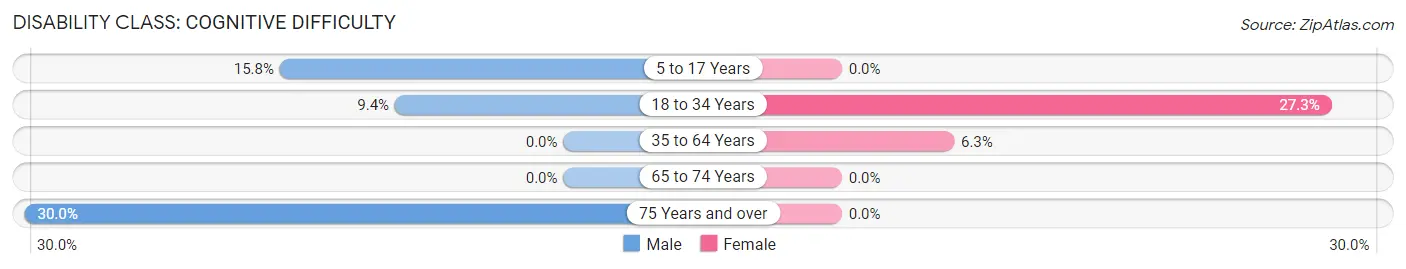
| Age Bracket | Male | Female |
| 5 to 17 Years | 3 (15.8%) | 0 (0.0%) |
| 18 to 34 Years | 3 (9.4%) | 6 (27.3%) |
| 35 to 64 Years | 0 (0.0%) | 4 (6.2%) |
| 65 to 74 Years | 0 (0.0%) | 0 (0.0%) |
| 75 Years and over | 3 (30.0%) | 0 (0.0%) |
Disability Class: Ambulatory Difficulty
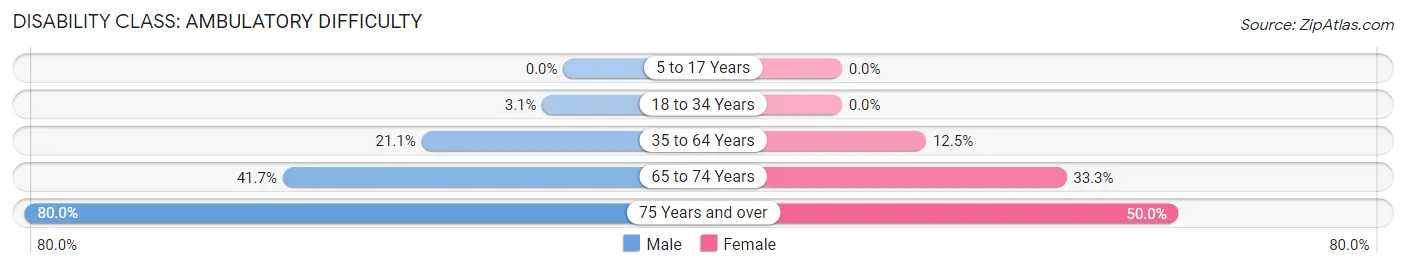
| Age Bracket | Male | Female |
| 5 to 17 Years | 0 (0.0%) | 0 (0.0%) |
| 18 to 34 Years | 1 (3.1%) | 0 (0.0%) |
| 35 to 64 Years | 8 (21.0%) | 8 (12.5%) |
| 65 to 74 Years | 5 (41.7%) | 4 (33.3%) |
| 75 Years and over | 8 (80.0%) | 2 (50.0%) |
Disability Class: Self-Care Difficulty
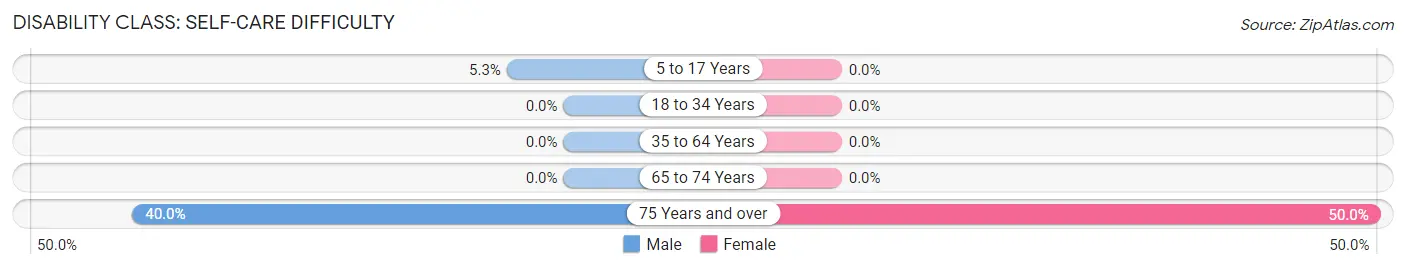
| Age Bracket | Male | Female |
| 5 to 17 Years | 1 (5.3%) | 0 (0.0%) |
| 18 to 34 Years | 0 (0.0%) | 0 (0.0%) |
| 35 to 64 Years | 0 (0.0%) | 0 (0.0%) |
| 65 to 74 Years | 0 (0.0%) | 0 (0.0%) |
| 75 Years and over | 4 (40.0%) | 2 (50.0%) |
Technology Access in Kane
Computing Device Access in Kane
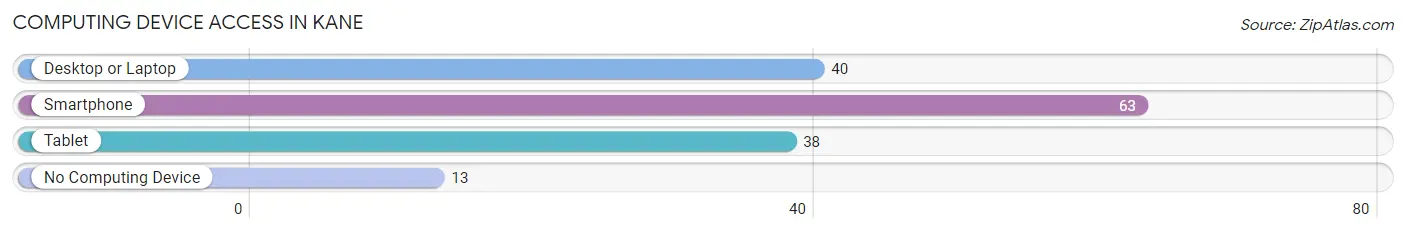
| Device Type | # Households | % Households |
| Desktop or Laptop | 40 | 48.2% |
| Smartphone | 63 | 75.9% |
| Tablet | 38 | 45.8% |
| No Computing Device | 13 | 15.7% |
| Total | 83 | 100.0% |
Internet Access in Kane
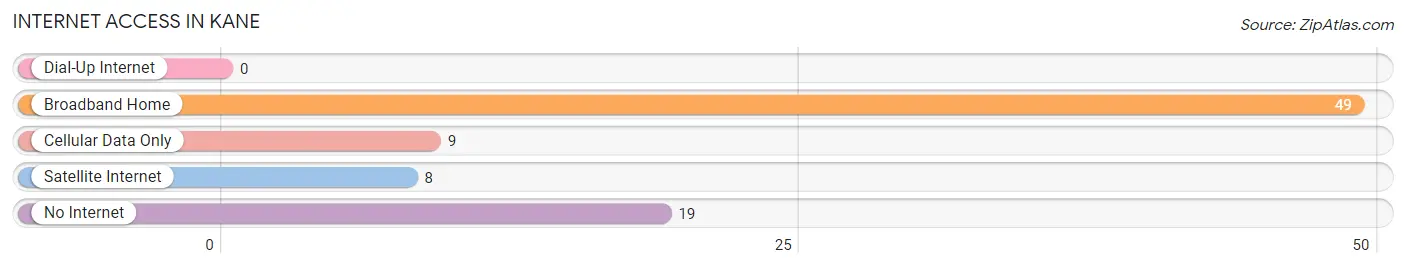
| Internet Type | # Households | % Households |
| Dial-Up Internet | 0 | 0.0% |
| Broadband Home | 49 | 59.0% |
| Cellular Data Only | 9 | 10.8% |
| Satellite Internet | 8 | 9.6% |
| No Internet | 19 | 22.9% |
| Total | 83 | 100.0% |
Kane Summary
Kane, Illinois is a small village located in the northern part of the state, in Kane County. It is situated on the Fox River, about 40 miles west of Chicago. The village has a population of about 1,500 people, and is part of the larger Fox Valley region.
History
Kane was first settled in 1835 by a group of settlers from New York. The village was named after Elias Kane, a prominent politician and judge in the area. The village was incorporated in 1854, and the first post office was established in 1855.
In the late 19th century, Kane was a thriving agricultural community, with a variety of crops being grown in the area. The village also had a number of small businesses, including a sawmill, a grist mill, and a blacksmith shop.
Geography
Kane is located in the northern part of Kane County, about 40 miles west of Chicago. The village is situated on the Fox River, and is surrounded by rolling hills and farmland. The village is located in the Fox Valley region, which is known for its scenic beauty and recreational opportunities.
The climate in Kane is typical of the Midwest, with hot summers and cold winters. The average temperature in the summer is around 75 degrees Fahrenheit, and the average temperature in the winter is around 25 degrees Fahrenheit.
Economy
Kane’s economy is largely based on agriculture and tourism. The village is home to a number of small businesses, including restaurants, shops, and other services. The village also has a number of small manufacturing companies, which produce a variety of products, including furniture, clothing, and electronics.
The village is also home to a number of recreational activities, including fishing, boating, and camping. The Fox River is a popular destination for kayaking and canoeing, and the village also has a number of parks and trails for hiking and biking.
Demographics
Kane has a population of about 1,500 people, with a median age of 39. The village is predominantly white, with about 90% of the population identifying as Caucasian. The village also has a small Hispanic population, with about 5% of the population identifying as Hispanic or Latino.
The village has a median household income of about $50,000, and the median home value is around $150,000. The village has a low unemployment rate, with only about 4% of the population being unemployed.
Kane is a small village with a rich history and a vibrant economy. The village is home to a variety of businesses and recreational activities, and is a popular destination for tourists and locals alike. The village has a diverse population, with a variety of ethnic backgrounds and economic backgrounds. Kane is a great place to live, work, and play.
Common Questions
What is Per Capita Income in Kane?
Per Capita income in Kane is $23,411.
What is the Median Family Income in Kane?
Median Family Income in Kane is $47,917.
What is the Median Household income in Kane?
Median Household Income in Kane is $48,125.
What is Income or Wage Gap in Kane?
Income or Wage Gap in Kane is 31.9%.
Women in Kane earn 68.1 cents for every dollar earned by a man.
What is Inequality or Gini Index in Kane?
Inequality or Gini Index in Kane is 0.41.
What is the Total Population of Kane?
Total Population of Kane is 227.
What is the Total Male Population of Kane?
Total Male Population of Kane is 115.
What is the Total Female Population of Kane?
Total Female Population of Kane is 112.
What is the Ratio of Males per 100 Females in Kane?
There are 102.68 Males per 100 Females in Kane.
What is the Ratio of Females per 100 Males in Kane?
There are 97.39 Females per 100 Males in Kane.
What is the Median Population Age in Kane?
Median Population Age in Kane is 42.3 Years.
What is the Average Family Size in Kane
Average Family Size in Kane is 3.2 People.
What is the Average Household Size in Kane
Average Household Size in Kane is 2.7 People.
How Large is the Labor Force in Kane?
There are 102 People in the Labor Forcein in Kane.
What is the Percentage of People in the Labor Force in Kane?
50.2% of People are in the Labor Force in Kane.
What is the Unemployment Rate in Kane?
Unemployment Rate in Kane is 5.9%.