Belleville, IL Map & Demographics
Belleville Map
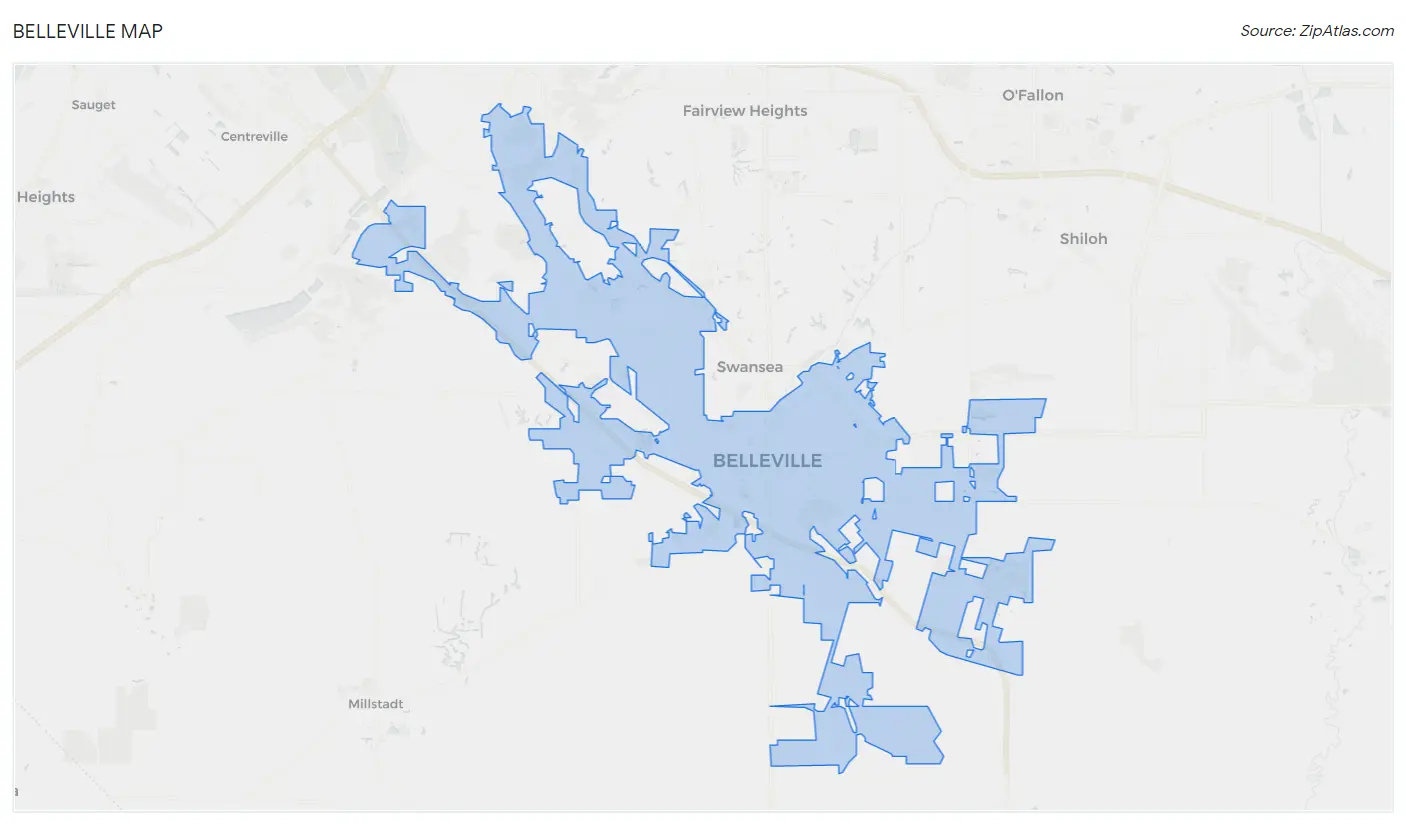
Belleville Overview
$31,798
PER CAPITA INCOME
$77,904
AVG FAMILY INCOME
$60,573
AVG HOUSEHOLD INCOME
20.2%
WAGE / INCOME GAP [ % ]
79.8¢/ $1
WAGE / INCOME GAP [ $ ]
$10,237
FAMILY INCOME DEFICIT
0.43
INEQUALITY / GINI INDEX
42,155
TOTAL POPULATION
19,919
MALE POPULATION
22,236
FEMALE POPULATION
89.58
MALES / 100 FEMALES
111.63
FEMALES / 100 MALES
38.4
MEDIAN AGE
3.1
AVG FAMILY SIZE
2.3
AVG HOUSEHOLD SIZE
22,216
LABOR FORCE [ PEOPLE ]
66.0%
PERCENT IN LABOR FORCE
6.0%
UNEMPLOYMENT RATE
Belleville Area Codes
Income in Belleville
Income Overview in Belleville
Per Capita Income in Belleville is $31,798, while median incomes of families and households are $77,904 and $60,573 respectively.
| Characteristic | Number | Measure |
| Per Capita Income | 42,155 | $31,798 |
| Median Family Income | 9,909 | $77,904 |
| Mean Family Income | 9,909 | $90,554 |
| Median Household Income | 17,596 | $60,573 |
| Mean Household Income | 17,596 | $74,567 |
| Income Deficit | 9,909 | $10,237 |
| Wage / Income Gap (%) | 42,155 | 20.17% |
| Wage / Income Gap ($) | 42,155 | 79.83¢ per $1 |
| Gini / Inequality Index | 42,155 | 0.43 |
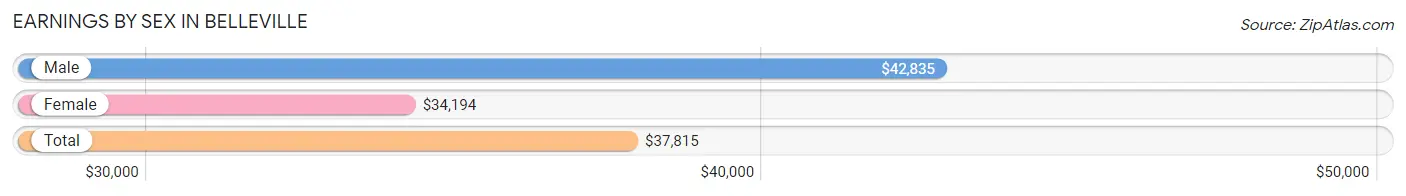
Earnings by Sex in Belleville
Average Earnings in Belleville are $37,815, $42,835 for men and $34,194 for women, a difference of 20.2%.
| Sex | Number | Average Earnings |
| Male | 11,093 (48.9%) | $42,835 |
| Female | 11,599 (51.1%) | $34,194 |
| Total | 22,692 (100.0%) | $37,815 |
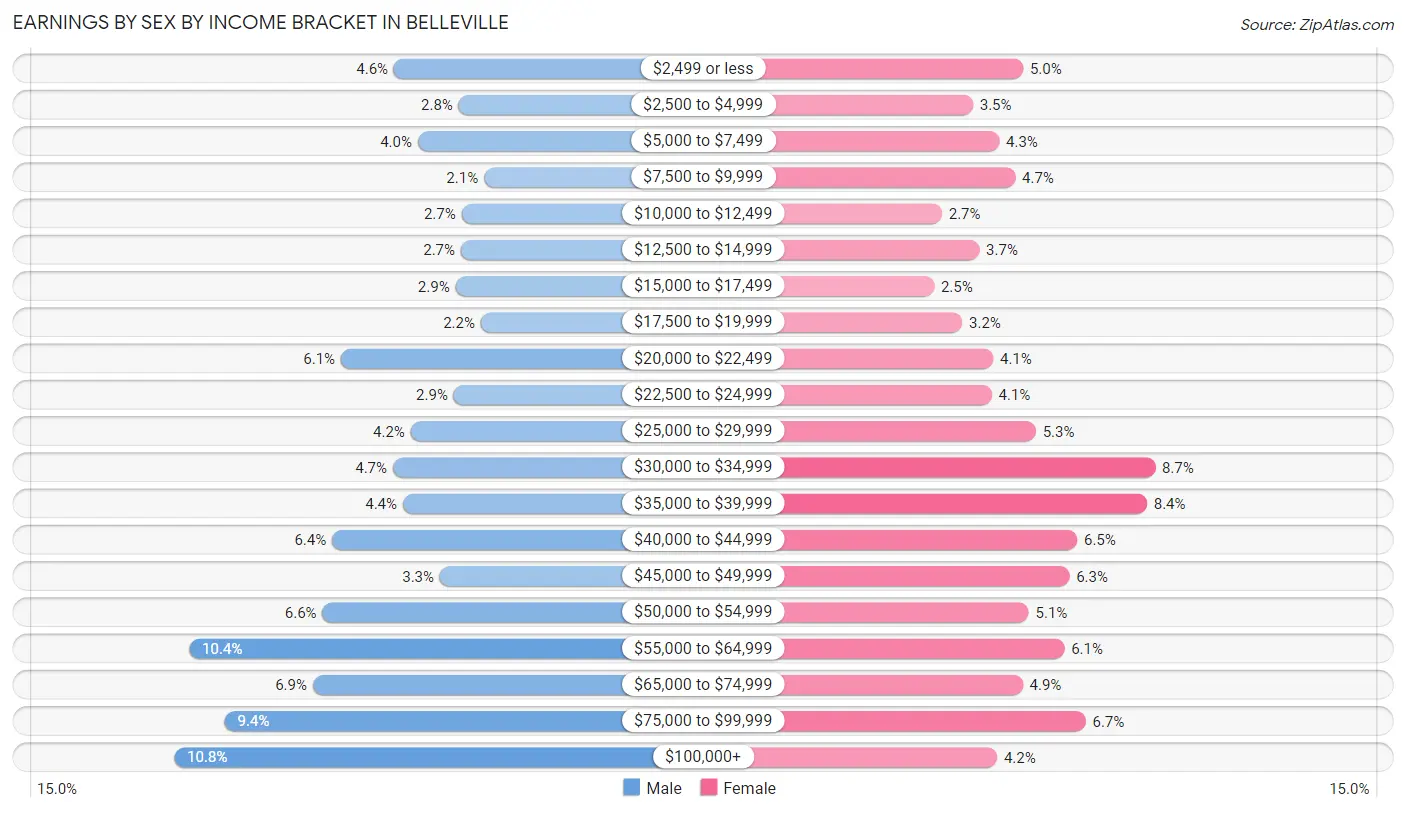
Earnings by Sex by Income Bracket in Belleville
The most common earnings brackets in Belleville are $100,000+ for men (1,198 | 10.8%) and $30,000 to $34,999 for women (1,004 | 8.7%).
| Income | Male | Female |
| $2,499 or less | 513 (4.6%) | 574 (5.0%) |
| $2,500 to $4,999 | 311 (2.8%) | 411 (3.5%) |
| $5,000 to $7,499 | 438 (4.0%) | 497 (4.3%) |
| $7,500 to $9,999 | 232 (2.1%) | 549 (4.7%) |
| $10,000 to $12,499 | 302 (2.7%) | 310 (2.7%) |
| $12,500 to $14,999 | 304 (2.7%) | 432 (3.7%) |
| $15,000 to $17,499 | 321 (2.9%) | 284 (2.5%) |
| $17,500 to $19,999 | 242 (2.2%) | 376 (3.2%) |
| $20,000 to $22,499 | 678 (6.1%) | 477 (4.1%) |
| $22,500 to $24,999 | 326 (2.9%) | 472 (4.1%) |
| $25,000 to $29,999 | 460 (4.2%) | 616 (5.3%) |
| $30,000 to $34,999 | 516 (4.6%) | 1,004 (8.7%) |
| $35,000 to $39,999 | 485 (4.4%) | 978 (8.4%) |
| $40,000 to $44,999 | 706 (6.4%) | 751 (6.5%) |
| $45,000 to $49,999 | 369 (3.3%) | 725 (6.2%) |
| $50,000 to $54,999 | 735 (6.6%) | 593 (5.1%) |
| $55,000 to $64,999 | 1,152 (10.4%) | 709 (6.1%) |
| $65,000 to $74,999 | 765 (6.9%) | 573 (4.9%) |
| $75,000 to $99,999 | 1,040 (9.4%) | 778 (6.7%) |
| $100,000+ | 1,198 (10.8%) | 490 (4.2%) |
| Total | 11,093 (100.0%) | 11,599 (100.0%) |
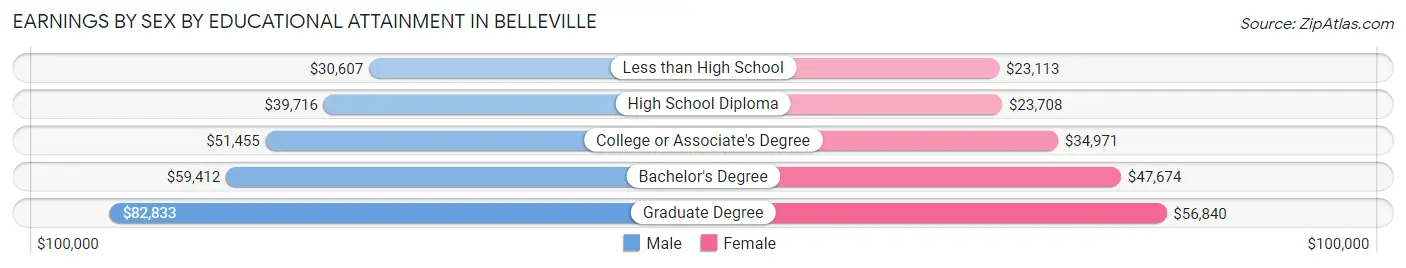
Earnings by Sex by Educational Attainment in Belleville
Average earnings in Belleville are $50,449 for men and $37,049 for women, a difference of 26.6%. Men with an educational attainment of graduate degree enjoy the highest average annual earnings of $82,833, while those with less than high school education earn the least with $30,607. Women with an educational attainment of graduate degree earn the most with the average annual earnings of $56,840, while those with less than high school education have the smallest earnings of $23,113.
| Educational Attainment | Male Income | Female Income |
| Less than High School | $30,607 | $23,113 |
| High School Diploma | $39,716 | $23,708 |
| College or Associate's Degree | $51,455 | $34,971 |
| Bachelor's Degree | $59,412 | $47,674 |
| Graduate Degree | $82,833 | $56,840 |
| Total | $50,449 | $37,049 |
Family Income in Belleville
Family Income Brackets in Belleville
According to the Belleville family income data, there are 2,140 families falling into the $100,000 to $149,999 income range, which is the most common income bracket and makes up 21.6% of all families. Conversely, the less than $10,000 income bracket is the least frequent group with only 218 families (2.2%) belonging to this category.
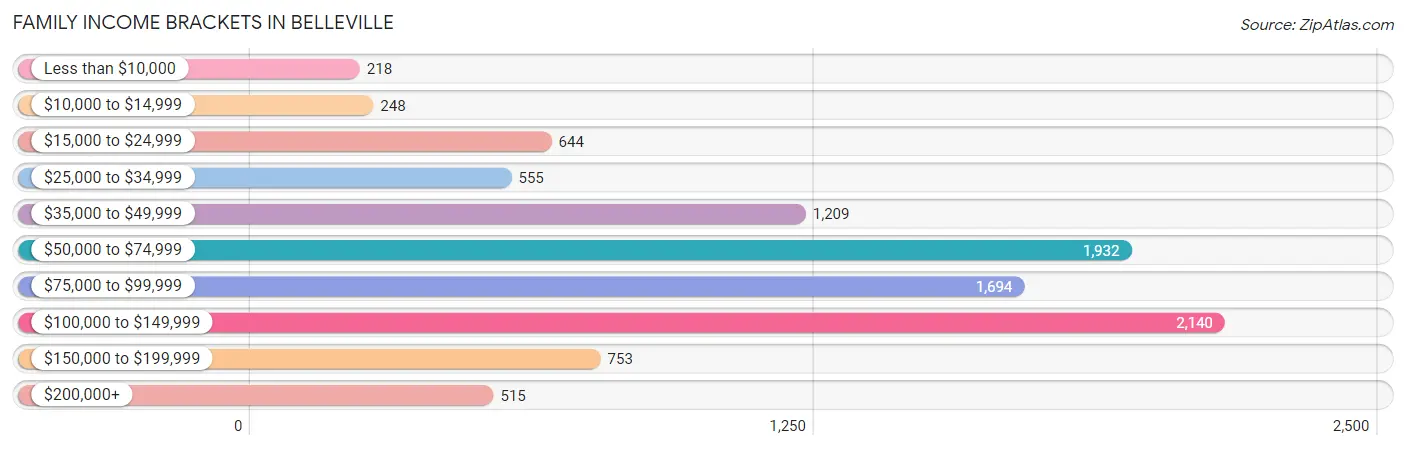
| Income Bracket | # Families | % Families |
| Less than $10,000 | 218 | 2.2% |
| $10,000 to $14,999 | 248 | 2.5% |
| $15,000 to $24,999 | 644 | 6.5% |
| $25,000 to $34,999 | 555 | 5.6% |
| $35,000 to $49,999 | 1,209 | 12.2% |
| $50,000 to $74,999 | 1,932 | 19.5% |
| $75,000 to $99,999 | 1,694 | 17.1% |
| $100,000 to $149,999 | 2,140 | 21.6% |
| $150,000 to $199,999 | 753 | 7.6% |
| $200,000+ | 515 | 5.2% |
Family Income by Famaliy Size in Belleville
4-person families (1,571 | 15.9%) account for the highest median family income in Belleville with $110,012 per family, while 2-person families (4,372 | 44.1%) have the highest median income of $34,518 per family member.
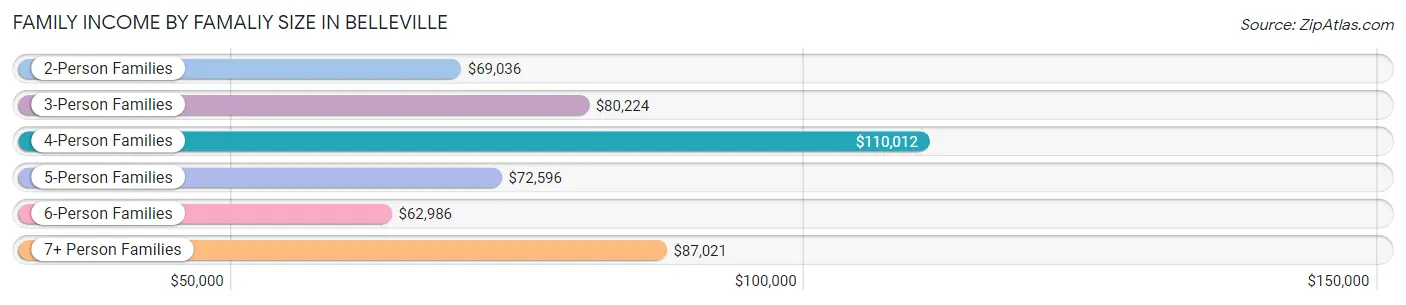
| Income Bracket | # Families | Median Income |
| 2-Person Families | 4,372 (44.1%) | $69,036 |
| 3-Person Families | 2,854 (28.8%) | $80,224 |
| 4-Person Families | 1,571 (15.9%) | $110,012 |
| 5-Person Families | 691 (7.0%) | $72,596 |
| 6-Person Families | 153 (1.5%) | $62,986 |
| 7+ Person Families | 268 (2.7%) | $87,021 |
| Total | 9,909 (100.0%) | $77,904 |
Family Income by Number of Earners in Belleville
The median family income in Belleville is $77,904, with families comprising 3+ earners (996) having the highest median family income of $111,686, while families with 1 earner (3,503) have the lowest median family income of $51,449, accounting for 10.1% and 35.3% of families, respectively.
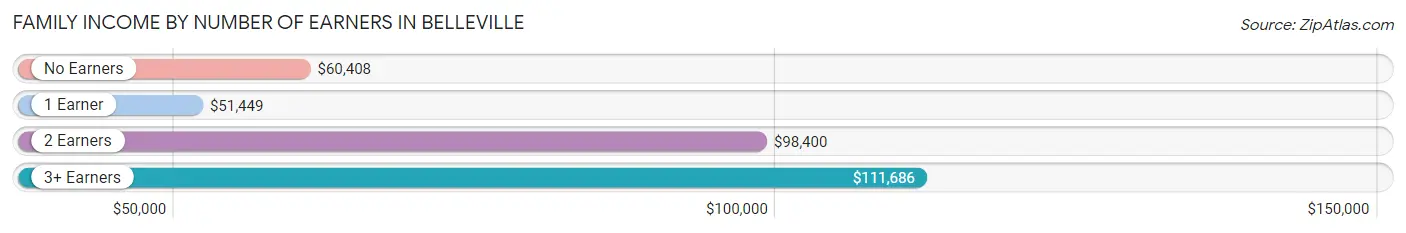
| Number of Earners | # Families | Median Income |
| No Earners | 1,073 (10.8%) | $60,408 |
| 1 Earner | 3,503 (35.3%) | $51,449 |
| 2 Earners | 4,337 (43.8%) | $98,400 |
| 3+ Earners | 996 (10.1%) | $111,686 |
| Total | 9,909 (100.0%) | $77,904 |
Household Income in Belleville
Household Income Brackets in Belleville
With 3,378 households falling in the category, the $50,000 to $74,999 income range is the most frequent in Belleville, accounting for 19.2% of all households. In contrast, only 669 households (3.8%) fall into the $200,000+ income bracket, making it the least populous group.
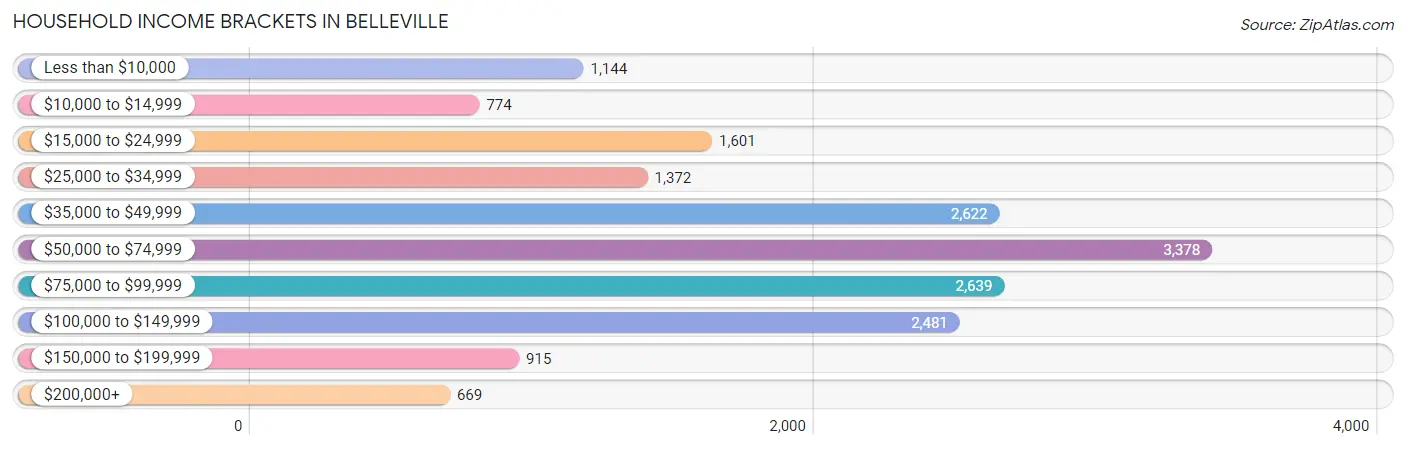
| Income Bracket | # Households | % Households |
| Less than $10,000 | 1,144 | 6.5% |
| $10,000 to $14,999 | 774 | 4.4% |
| $15,000 to $24,999 | 1,601 | 9.1% |
| $25,000 to $34,999 | 1,372 | 7.8% |
| $35,000 to $49,999 | 2,622 | 14.9% |
| $50,000 to $74,999 | 3,378 | 19.2% |
| $75,000 to $99,999 | 2,639 | 15.0% |
| $100,000 to $149,999 | 2,481 | 14.1% |
| $150,000 to $199,999 | 915 | 5.2% |
| $200,000+ | 669 | 3.8% |
Household Income by Householder Age in Belleville
The median household income in Belleville is $60,573, with the highest median household income of $66,345 found in the 45 to 64 years age bracket for the primary householder. A total of 6,532 households (37.1%) fall into this category. Meanwhile, the 65+ years age bracket for the primary householder has the lowest median household income of $46,644, with 3,955 households (22.5%) in this group.
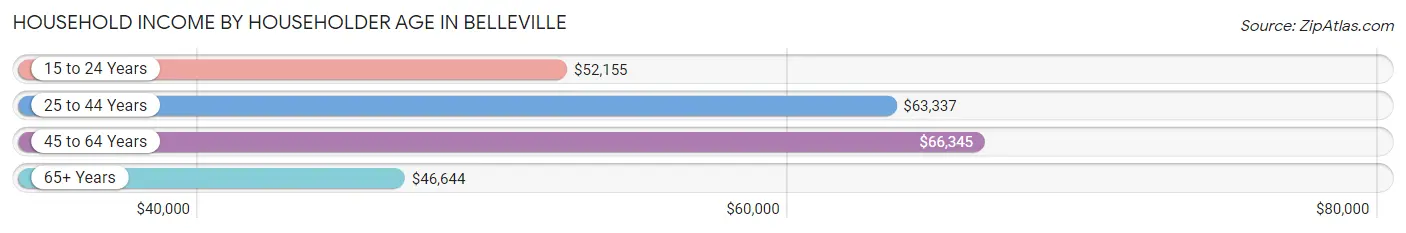
| Income Bracket | # Households | Median Income |
| 15 to 24 Years | 594 (3.4%) | $52,155 |
| 25 to 44 Years | 6,515 (37.0%) | $63,337 |
| 45 to 64 Years | 6,532 (37.1%) | $66,345 |
| 65+ Years | 3,955 (22.5%) | $46,644 |
| Total | 17,596 (100.0%) | $60,573 |
Poverty in Belleville
Income Below Poverty by Sex and Age in Belleville
With 14.9% poverty level for males and 14.6% for females among the residents of Belleville, under 5 year old males and 5 year old females are the most vulnerable to poverty, with 259 males (26.7%) and 106 females (80.9%) in their respective age groups living below the poverty level.
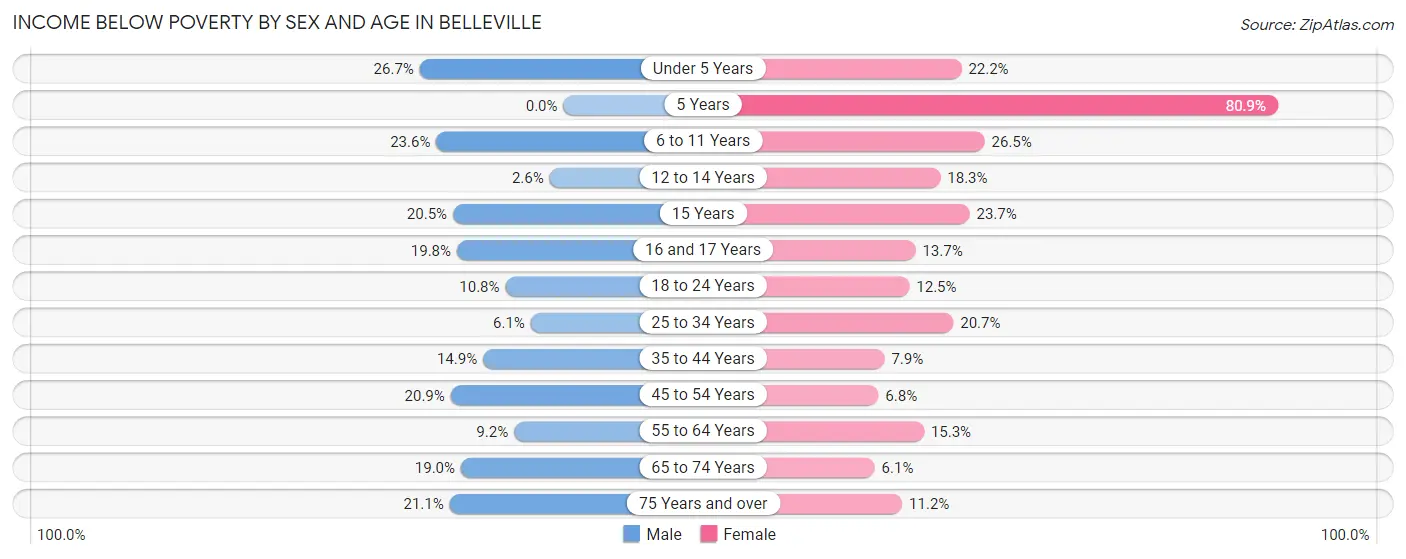
| Age Bracket | Male | Female |
| Under 5 Years | 259 (26.7%) | 312 (22.2%) |
| 5 Years | 0 (0.0%) | 106 (80.9%) |
| 6 to 11 Years | 371 (23.6%) | 434 (26.5%) |
| 12 to 14 Years | 19 (2.6%) | 173 (18.3%) |
| 15 Years | 57 (20.5%) | 74 (23.7%) |
| 16 and 17 Years | 87 (19.8%) | 96 (13.7%) |
| 18 to 24 Years | 202 (10.8%) | 190 (12.5%) |
| 25 to 34 Years | 148 (6.1%) | 648 (20.7%) |
| 35 to 44 Years | 471 (14.9%) | 232 (7.9%) |
| 45 to 54 Years | 502 (20.9%) | 180 (6.8%) |
| 55 to 64 Years | 220 (9.2%) | 439 (15.2%) |
| 65 to 74 Years | 326 (19.0%) | 121 (6.1%) |
| 75 Years and over | 166 (21.1%) | 153 (11.2%) |
| Total | 2,828 (14.9%) | 3,158 (14.6%) |
Income Above Poverty by Sex and Age in Belleville
According to the poverty statistics in Belleville, males aged 5 years and females aged 65 to 74 years are the age groups that are most secure financially, with 100.0% of males and 93.9% of females in these age groups living above the poverty line.
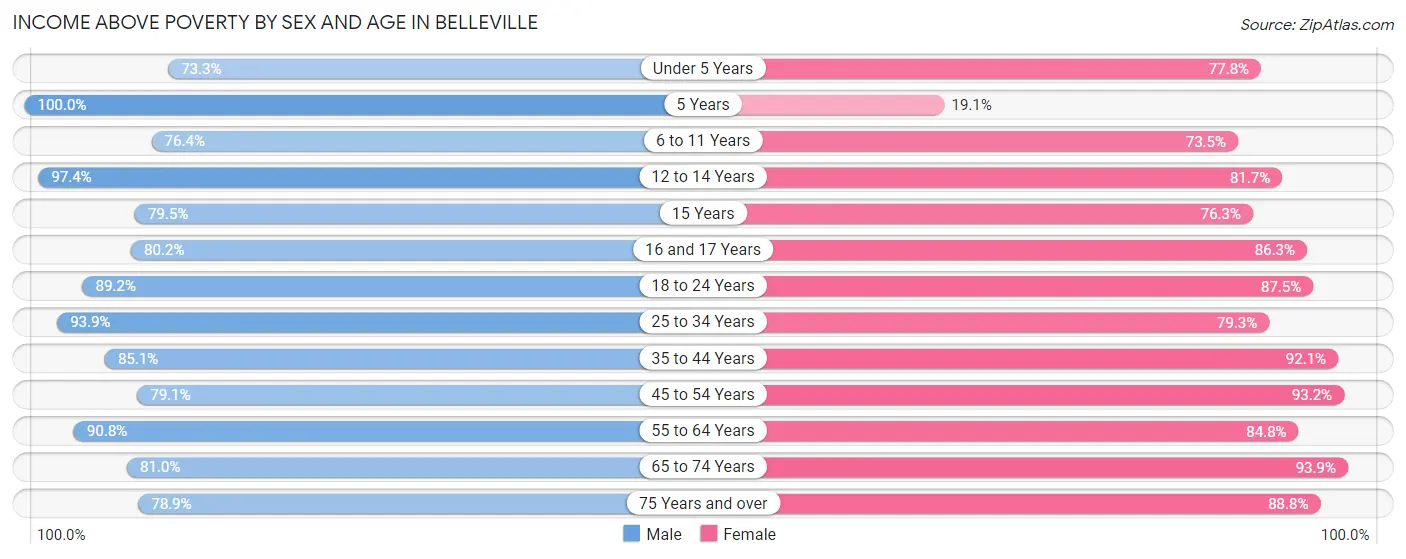
| Age Bracket | Male | Female |
| Under 5 Years | 712 (73.3%) | 1,093 (77.8%) |
| 5 Years | 228 (100.0%) | 25 (19.1%) |
| 6 to 11 Years | 1,202 (76.4%) | 1,203 (73.5%) |
| 12 to 14 Years | 721 (97.4%) | 773 (81.7%) |
| 15 Years | 221 (79.5%) | 238 (76.3%) |
| 16 and 17 Years | 353 (80.2%) | 606 (86.3%) |
| 18 to 24 Years | 1,676 (89.2%) | 1,325 (87.5%) |
| 25 to 34 Years | 2,296 (93.9%) | 2,484 (79.3%) |
| 35 to 44 Years | 2,686 (85.1%) | 2,697 (92.1%) |
| 45 to 54 Years | 1,897 (79.1%) | 2,467 (93.2%) |
| 55 to 64 Years | 2,182 (90.8%) | 2,439 (84.8%) |
| 65 to 74 Years | 1,388 (81.0%) | 1,861 (93.9%) |
| 75 Years and over | 620 (78.9%) | 1,213 (88.8%) |
| Total | 16,182 (85.1%) | 18,424 (85.4%) |
Income Below Poverty Among Married-Couple Families in Belleville
The poverty statistics for married-couple families in Belleville show that 3.0% or 194 of the total 6,502 families live below the poverty line. Families with 3 or 4 children have the highest poverty rate of 15.3%, comprising of 84 families. On the other hand, families with 5 or more children have the lowest poverty rate of 0.0%, which includes 0 families.
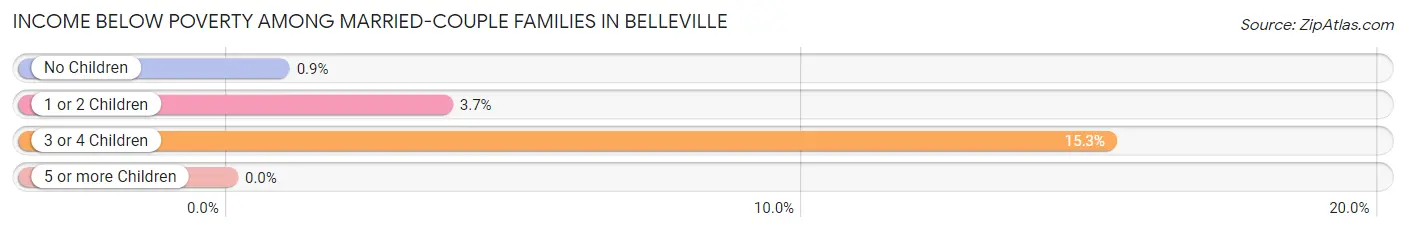
| Children | Above Poverty | Below Poverty |
| No Children | 3,730 (99.1%) | 34 (0.9%) |
| 1 or 2 Children | 1,956 (96.3%) | 76 (3.7%) |
| 3 or 4 Children | 465 (84.7%) | 84 (15.3%) |
| 5 or more Children | 157 (100.0%) | 0 (0.0%) |
| Total | 6,308 (97.0%) | 194 (3.0%) |
Income Below Poverty Among Single-Parent Households in Belleville
According to the poverty data in Belleville, 19.1% or 165 single-father households and 24.2% or 615 single-mother households are living below the poverty line. Among single-father households, those with 1 or 2 children have the highest poverty rate, with 138 households (25.2%) experiencing poverty. Likewise, among single-mother households, those with 5 or more children have the highest poverty rate, with 50 households (100.0%) falling below the poverty line.
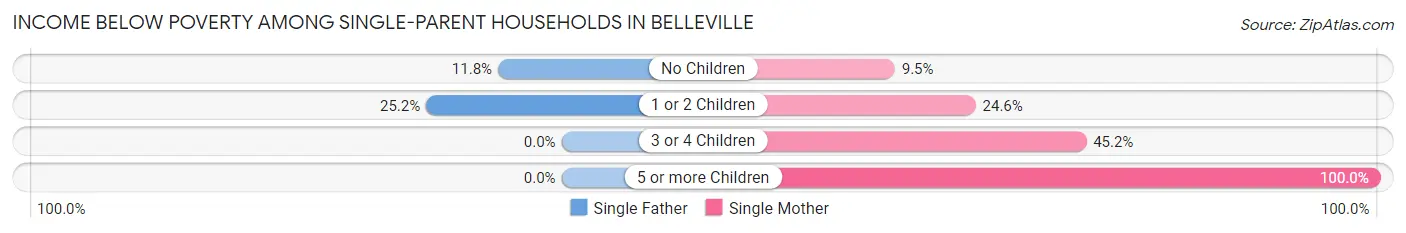
| Children | Single Father | Single Mother |
| No Children | 27 (11.8%) | 72 (9.5%) |
| 1 or 2 Children | 138 (25.2%) | 348 (24.6%) |
| 3 or 4 Children | 0 (0.0%) | 145 (45.2%) |
| 5 or more Children | 0 (0.0%) | 50 (100.0%) |
| Total | 165 (19.1%) | 615 (24.2%) |
Income Below Poverty Among Married-Couple vs Single-Parent Households in Belleville
The poverty data for Belleville shows that 194 of the married-couple family households (3.0%) and 780 of the single-parent households (22.9%) are living below the poverty level. Within the married-couple family households, those with 3 or 4 children have the highest poverty rate, with 84 households (15.3%) falling below the poverty line. Among the single-parent households, those with 5 or more children have the highest poverty rate, with 50 household (100.0%) living below poverty.
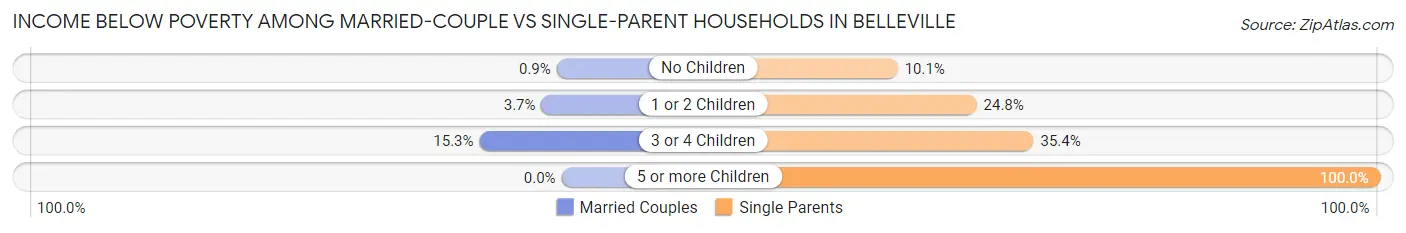
| Children | Married-Couple Families | Single-Parent Households |
| No Children | 34 (0.9%) | 99 (10.1%) |
| 1 or 2 Children | 76 (3.7%) | 486 (24.8%) |
| 3 or 4 Children | 84 (15.3%) | 145 (35.4%) |
| 5 or more Children | 0 (0.0%) | 50 (100.0%) |
| Total | 194 (3.0%) | 780 (22.9%) |
Race in Belleville
The most populous races in Belleville are White / Caucasian (25,138 | 59.6%), Black / African American (12,897 | 30.6%), and Two or more Races (2,786 | 6.6%).
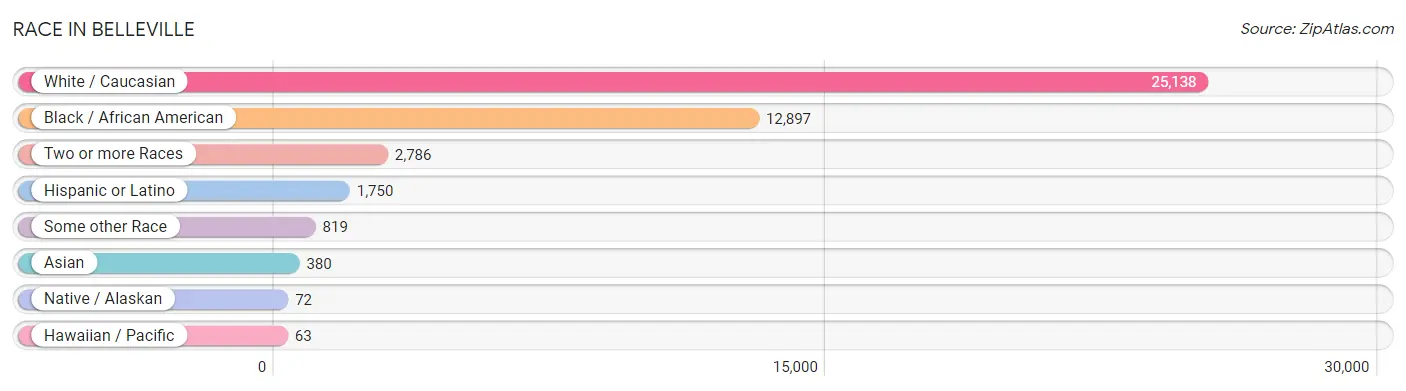
| Race | # Population | % Population |
| Asian | 380 | 0.9% |
| Black / African American | 12,897 | 30.6% |
| Hawaiian / Pacific | 63 | 0.2% |
| Hispanic or Latino | 1,750 | 4.2% |
| Native / Alaskan | 72 | 0.2% |
| White / Caucasian | 25,138 | 59.6% |
| Two or more Races | 2,786 | 6.6% |
| Some other Race | 819 | 1.9% |
| Total | 42,155 | 100.0% |
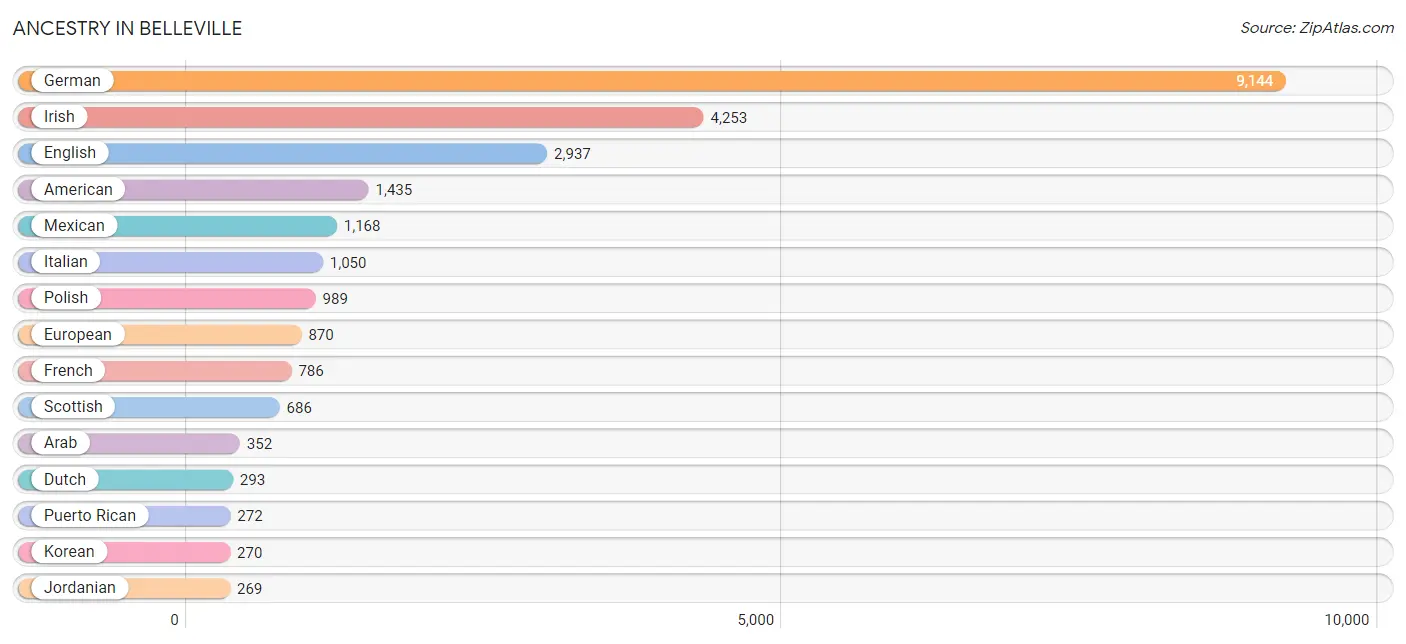
Ancestry in Belleville
The most populous ancestries reported in Belleville are German (9,144 | 21.7%), Irish (4,253 | 10.1%), English (2,937 | 7.0%), American (1,435 | 3.4%), and Mexican (1,168 | 2.8%), together accounting for 44.9% of all Belleville residents.
| Ancestry | # Population | % Population |
| African | 151 | 0.4% |
| American | 1,435 | 3.4% |
| Apache | 28 | 0.1% |
| Arab | 352 | 0.8% |
| Armenian | 90 | 0.2% |
| Austrian | 165 | 0.4% |
| Belgian | 11 | 0.0% |
| Bermudan | 8 | 0.0% |
| Bhutanese | 148 | 0.4% |
| Blackfeet | 81 | 0.2% |
| British | 109 | 0.3% |
| Burmese | 59 | 0.1% |
| Canadian | 39 | 0.1% |
| Central American | 158 | 0.4% |
| Cherokee | 37 | 0.1% |
| Chippewa | 20 | 0.1% |
| Choctaw | 61 | 0.1% |
| Costa Rican | 136 | 0.3% |
| Creek | 19 | 0.1% |
| Croatian | 135 | 0.3% |
| Cuban | 32 | 0.1% |
| Czech | 161 | 0.4% |
| Danish | 15 | 0.0% |
| Dutch | 293 | 0.7% |
| Eastern European | 34 | 0.1% |
| English | 2,937 | 7.0% |
| European | 870 | 2.1% |
| French | 786 | 1.9% |
| French Canadian | 117 | 0.3% |
| German | 9,144 | 21.7% |
| Greek | 61 | 0.1% |
| Guatemalan | 9 | 0.0% |
| Guyanese | 51 | 0.1% |
| Hungarian | 181 | 0.4% |
| Icelander | 26 | 0.1% |
| Indian (Asian) | 133 | 0.3% |
| Iranian | 20 | 0.1% |
| Irish | 4,253 | 10.1% |
| Iroquois | 13 | 0.0% |
| Italian | 1,050 | 2.5% |
| Jamaican | 114 | 0.3% |
| Japanese | 56 | 0.1% |
| Jordanian | 269 | 0.6% |
| Korean | 270 | 0.6% |
| Latvian | 5 | 0.0% |
| Lebanese | 83 | 0.2% |
| Lithuanian | 115 | 0.3% |
| Luxembourger | 10 | 0.0% |
| Malaysian | 5 | 0.0% |
| Mexican | 1,168 | 2.8% |
| Native Hawaiian | 81 | 0.2% |
| Navajo | 14 | 0.0% |
| Nigerian | 19 | 0.1% |
| Northern European | 54 | 0.1% |
| Norwegian | 65 | 0.2% |
| Pakistani | 26 | 0.1% |
| Panamanian | 13 | 0.0% |
| Polish | 989 | 2.4% |
| Portuguese | 10 | 0.0% |
| Puerto Rican | 272 | 0.6% |
| Romanian | 6 | 0.0% |
| Russian | 15 | 0.0% |
| Samoan | 24 | 0.1% |
| Scandinavian | 38 | 0.1% |
| Scotch-Irish | 194 | 0.5% |
| Scottish | 686 | 1.6% |
| Slavic | 25 | 0.1% |
| Slovak | 14 | 0.0% |
| Spaniard | 29 | 0.1% |
| Sri Lankan | 56 | 0.1% |
| Subsaharan African | 184 | 0.4% |
| Swedish | 139 | 0.3% |
| Swiss | 34 | 0.1% |
| Thai | 68 | 0.2% |
| Trinidadian and Tobagonian | 69 | 0.2% |
| Turkish | 7 | 0.0% |
| Ukrainian | 20 | 0.1% |
| Welsh | 178 | 0.4% |
| Yaqui | 20 | 0.1% |
| Yugoslavian | 8 | 0.0% | View All 80 Rows |
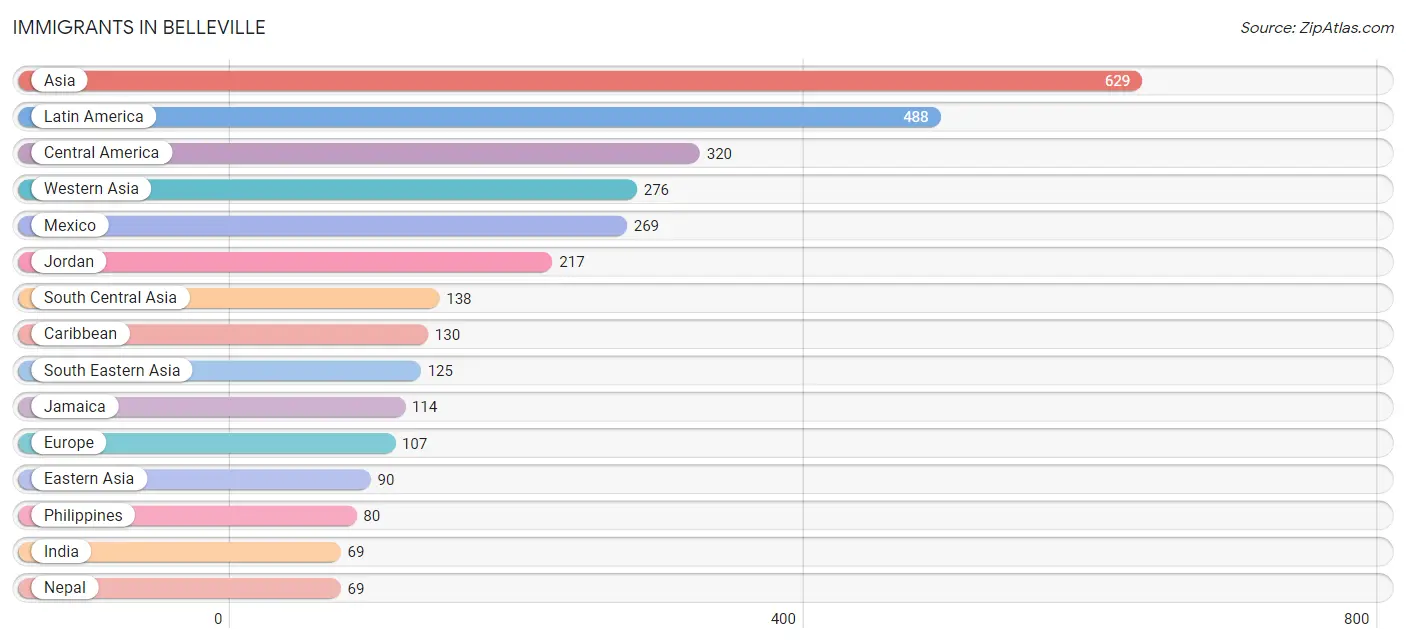
Immigrants in Belleville
The most numerous immigrant groups reported in Belleville came from Asia (629 | 1.5%), Latin America (488 | 1.2%), Central America (320 | 0.8%), Western Asia (276 | 0.6%), and Mexico (269 | 0.6%), together accounting for 4.7% of all Belleville residents.
| Immigration Origin | # Population | % Population |
| Asia | 629 | 1.5% |
| Canada | 40 | 0.1% |
| Caribbean | 130 | 0.3% |
| Central America | 320 | 0.8% |
| China | 60 | 0.1% |
| Costa Rica | 41 | 0.1% |
| Eastern Asia | 90 | 0.2% |
| Eastern Europe | 9 | 0.0% |
| England | 14 | 0.0% |
| Europe | 107 | 0.3% |
| Germany | 27 | 0.1% |
| Guatemala | 5 | 0.0% |
| Guyana | 38 | 0.1% |
| India | 69 | 0.2% |
| Jamaica | 114 | 0.3% |
| Japan | 30 | 0.1% |
| Jordan | 217 | 0.5% |
| Kuwait | 52 | 0.1% |
| Latin America | 488 | 1.2% |
| Mexico | 269 | 0.6% |
| Nepal | 69 | 0.2% |
| Netherlands | 20 | 0.1% |
| Northern Europe | 51 | 0.1% |
| Panama | 5 | 0.0% |
| Philippines | 80 | 0.2% |
| Russia | 9 | 0.0% |
| South America | 38 | 0.1% |
| South Central Asia | 138 | 0.3% |
| South Eastern Asia | 125 | 0.3% |
| Sweden | 4 | 0.0% |
| Thailand | 26 | 0.1% |
| Trinidad and Tobago | 16 | 0.0% |
| Turkey | 7 | 0.0% |
| Vietnam | 19 | 0.1% |
| Western Asia | 276 | 0.6% |
| Western Europe | 47 | 0.1% | View All 36 Rows |
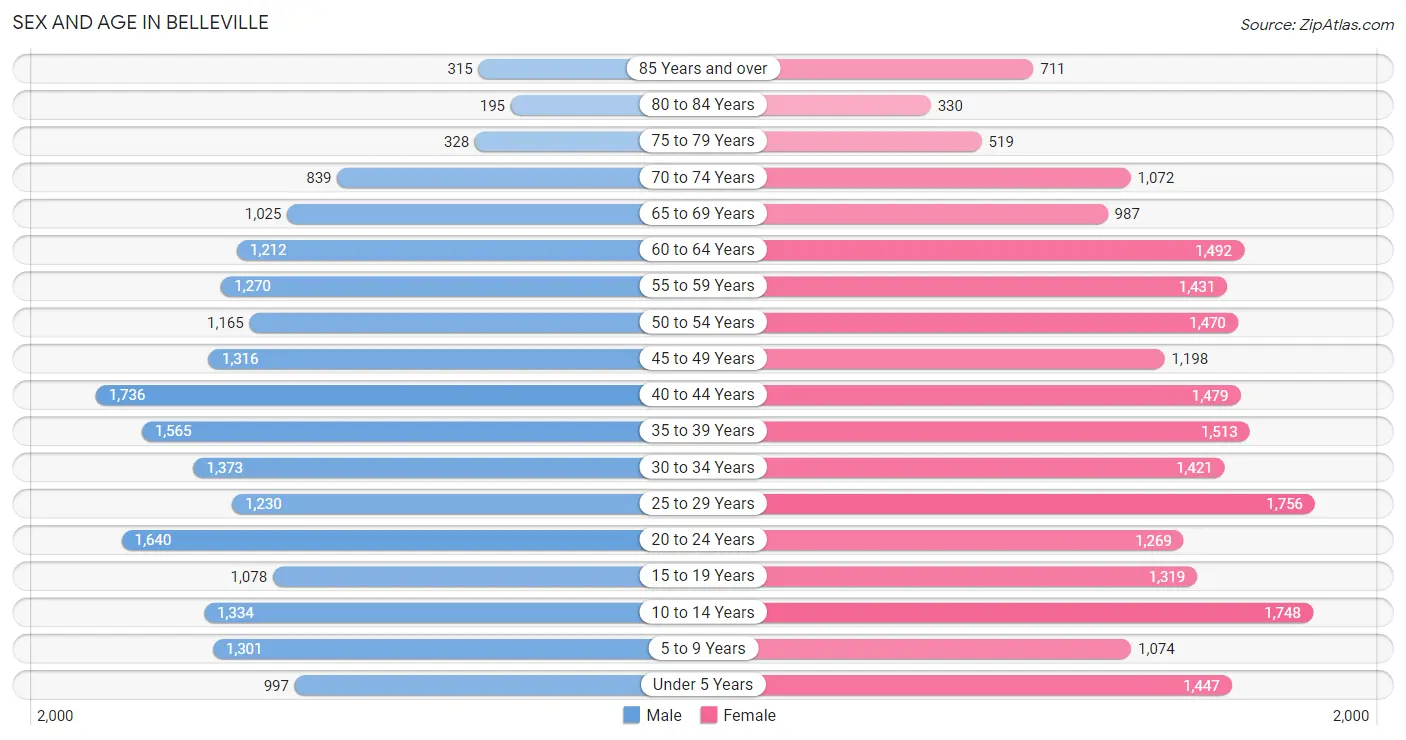
Sex and Age in Belleville
Sex and Age in Belleville
The most populous age groups in Belleville are 40 to 44 Years (1,736 | 8.7%) for men and 25 to 29 Years (1,756 | 7.9%) for women.
| Age Bracket | Male | Female |
| Under 5 Years | 997 (5.0%) | 1,447 (6.5%) |
| 5 to 9 Years | 1,301 (6.5%) | 1,074 (4.8%) |
| 10 to 14 Years | 1,334 (6.7%) | 1,748 (7.9%) |
| 15 to 19 Years | 1,078 (5.4%) | 1,319 (5.9%) |
| 20 to 24 Years | 1,640 (8.2%) | 1,269 (5.7%) |
| 25 to 29 Years | 1,230 (6.2%) | 1,756 (7.9%) |
| 30 to 34 Years | 1,373 (6.9%) | 1,421 (6.4%) |
| 35 to 39 Years | 1,565 (7.9%) | 1,513 (6.8%) |
| 40 to 44 Years | 1,736 (8.7%) | 1,479 (6.7%) |
| 45 to 49 Years | 1,316 (6.6%) | 1,198 (5.4%) |
| 50 to 54 Years | 1,165 (5.9%) | 1,470 (6.6%) |
| 55 to 59 Years | 1,270 (6.4%) | 1,431 (6.4%) |
| 60 to 64 Years | 1,212 (6.1%) | 1,492 (6.7%) |
| 65 to 69 Years | 1,025 (5.1%) | 987 (4.4%) |
| 70 to 74 Years | 839 (4.2%) | 1,072 (4.8%) |
| 75 to 79 Years | 328 (1.7%) | 519 (2.3%) |
| 80 to 84 Years | 195 (1.0%) | 330 (1.5%) |
| 85 Years and over | 315 (1.6%) | 711 (3.2%) |
| Total | 19,919 (100.0%) | 22,236 (100.0%) |
Families and Households in Belleville
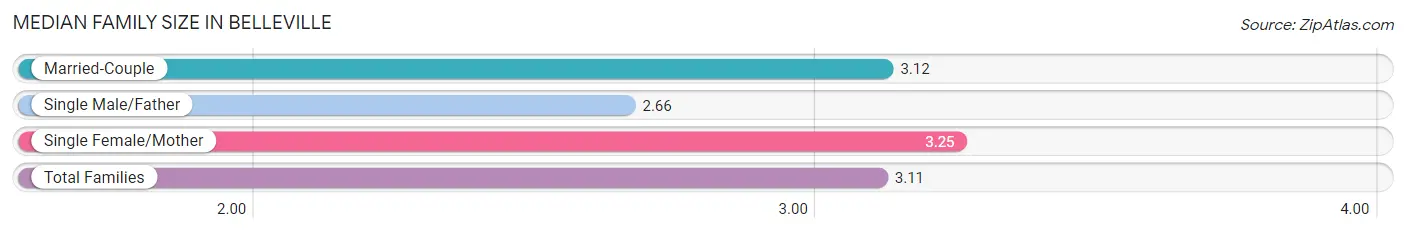
Median Family Size in Belleville
The median family size in Belleville is 3.11 persons per family, with single female/mother families (2,543 | 25.7%) accounting for the largest median family size of 3.25 persons per family. On the other hand, single male/father families (864 | 8.7%) represent the smallest median family size with 2.66 persons per family.
| Family Type | # Families | Family Size |
| Married-Couple | 6,502 (65.6%) | 3.12 |
| Single Male/Father | 864 (8.7%) | 2.66 |
| Single Female/Mother | 2,543 (25.7%) | 3.25 |
| Total Families | 9,909 (100.0%) | 3.11 |
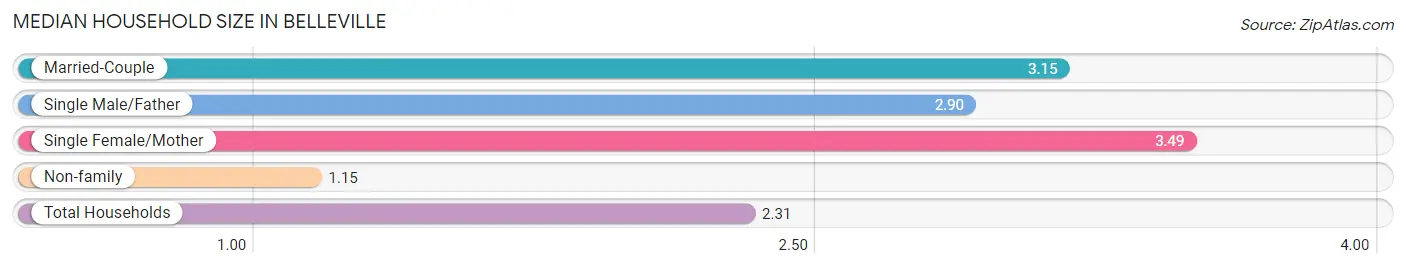
Median Household Size in Belleville
The median household size in Belleville is 2.31 persons per household, with single female/mother households (2,543 | 14.4%) accounting for the largest median household size of 3.49 persons per household. non-family households (7,687 | 43.7%) represent the smallest median household size with 1.15 persons per household.
| Household Type | # Households | Household Size |
| Married-Couple | 6,502 (36.9%) | 3.15 |
| Single Male/Father | 864 (4.9%) | 2.90 |
| Single Female/Mother | 2,543 (14.4%) | 3.49 |
| Non-family | 7,687 (43.7%) | 1.15 |
| Total Households | 17,596 (100.0%) | 2.31 |
Household Size by Marriage Status in Belleville
Out of a total of 17,596 households in Belleville, 9,909 (56.3%) are family households, while 7,687 (43.7%) are nonfamily households. The most numerous type of family households are 2-person households, comprising 3,995, and the most common type of nonfamily households are 1-person households, comprising 6,671.
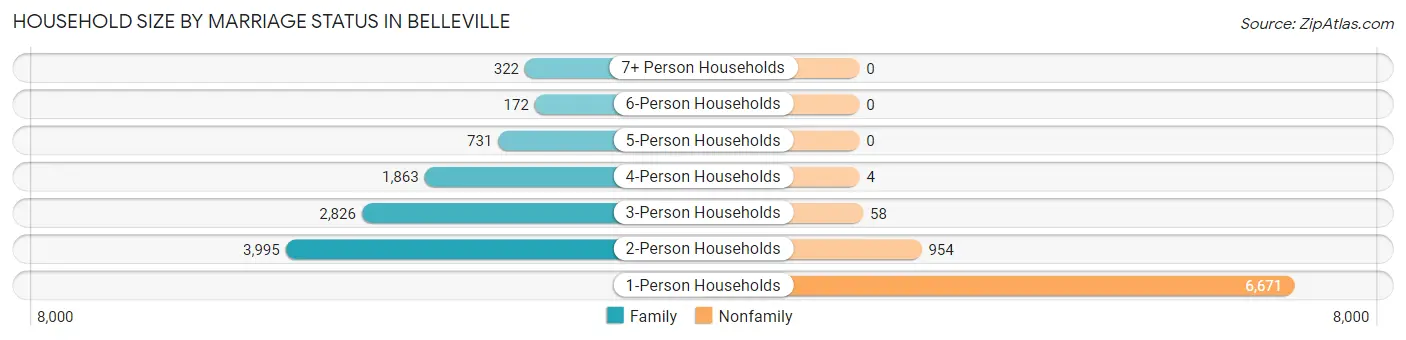
| Household Size | Family Households | Nonfamily Households |
| 1-Person Households | - | 6,671 (37.9%) |
| 2-Person Households | 3,995 (22.7%) | 954 (5.4%) |
| 3-Person Households | 2,826 (16.1%) | 58 (0.3%) |
| 4-Person Households | 1,863 (10.6%) | 4 (0.0%) |
| 5-Person Households | 731 (4.2%) | 0 (0.0%) |
| 6-Person Households | 172 (1.0%) | 0 (0.0%) |
| 7+ Person Households | 322 (1.8%) | 0 (0.0%) |
| Total | 9,909 (56.3%) | 7,687 (43.7%) |
Female Fertility in Belleville
Fertility by Age in Belleville
Average fertility rate in Belleville is 42.0 births per 1,000 women. Women in the age bracket of 20 to 34 years have the highest fertility rate with 85.0 births per 1,000 women. Women in the age bracket of 20 to 34 years acount for 86.5% of all women with births.
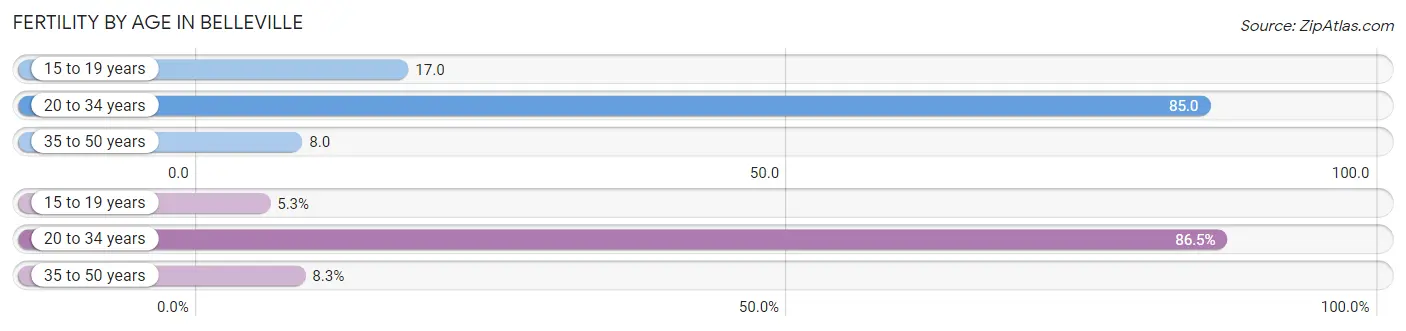
| Age Bracket | Women with Births | Births / 1,000 Women |
| 15 to 19 years | 23 (5.3%) | 17.0 |
| 20 to 34 years | 377 (86.5%) | 85.0 |
| 35 to 50 years | 36 (8.3%) | 8.0 |
| Total | 436 (100.0%) | 42.0 |
Fertility by Age by Marriage Status in Belleville
56.0% of women with births (436) in Belleville are married. The highest percentage of unmarried women with births falls into 15 to 19 years age bracket with 100.0% of them unmarried at the time of birth, while the lowest percentage of unmarried women with births belong to 35 to 50 years age bracket with 0.0% of them unmarried.
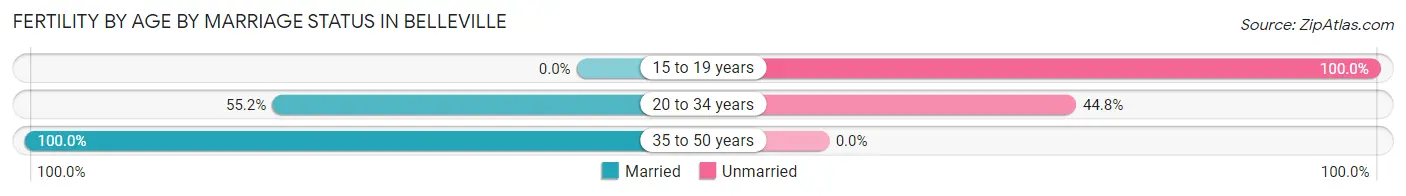
| Age Bracket | Married | Unmarried |
| 15 to 19 years | 0 (0.0%) | 23 (100.0%) |
| 20 to 34 years | 208 (55.2%) | 169 (44.8%) |
| 35 to 50 years | 36 (100.0%) | 0 (0.0%) |
| Total | 244 (56.0%) | 192 (44.0%) |
Fertility by Education in Belleville
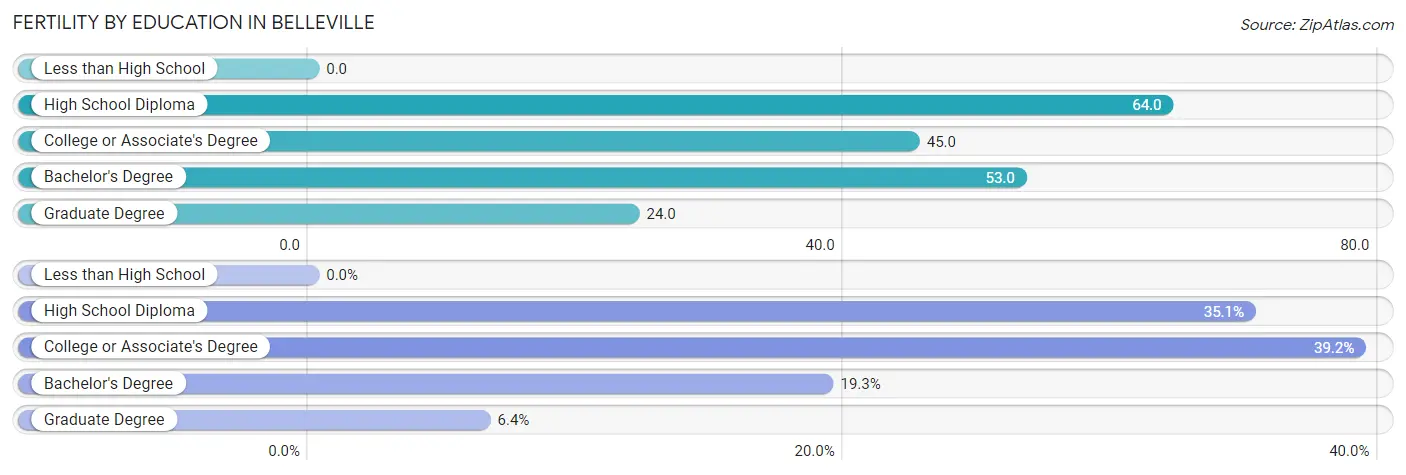
| Educational Attainment | Women with Births | Births / 1,000 Women |
| Less than High School | 0 (0.0%) | 0.0 |
| High School Diploma | 153 (35.1%) | 64.0 |
| College or Associate's Degree | 171 (39.2%) | 45.0 |
| Bachelor's Degree | 84 (19.3%) | 53.0 |
| Graduate Degree | 28 (6.4%) | 24.0 |
| Total | 436 (100.0%) | 42.0 |
Fertility by Education by Marriage Status in Belleville
44.0% of women with births in Belleville are unmarried. Women with the educational attainment of bachelor's degree are most likely to be married with 100.0% of them married at childbirth, while women with the educational attainment of high school diploma are least likely to be married with 65.4% of them unmarried at childbirth.
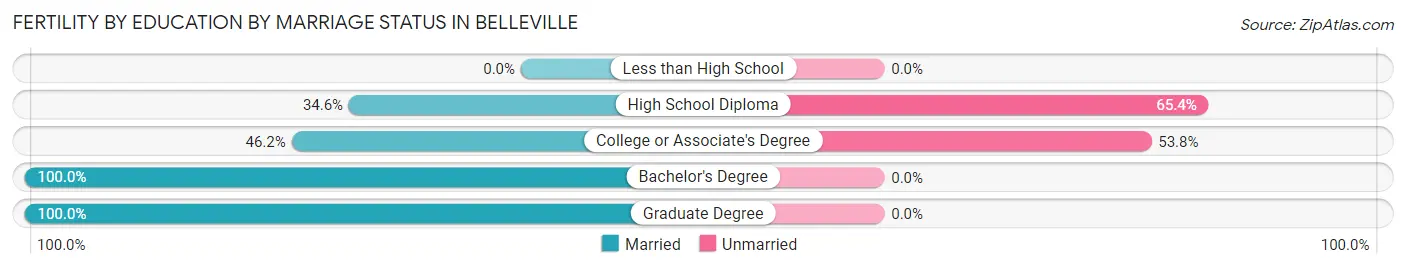
| Educational Attainment | Married | Unmarried |
| Less than High School | 0 (0.0%) | 0 (0.0%) |
| High School Diploma | 53 (34.6%) | 100 (65.4%) |
| College or Associate's Degree | 79 (46.2%) | 92 (53.8%) |
| Bachelor's Degree | 84 (100.0%) | 0 (0.0%) |
| Graduate Degree | 28 (100.0%) | 0 (0.0%) |
| Total | 244 (56.0%) | 192 (44.0%) |
Employment Characteristics in Belleville
Employment by Class of Employer in Belleville
Among the 20,615 employed individuals in Belleville, private company employees (14,138 | 68.6%), not-for-profit organizations (1,966 | 9.5%), and local government employees (1,403 | 6.8%) make up the most common classes of employment.
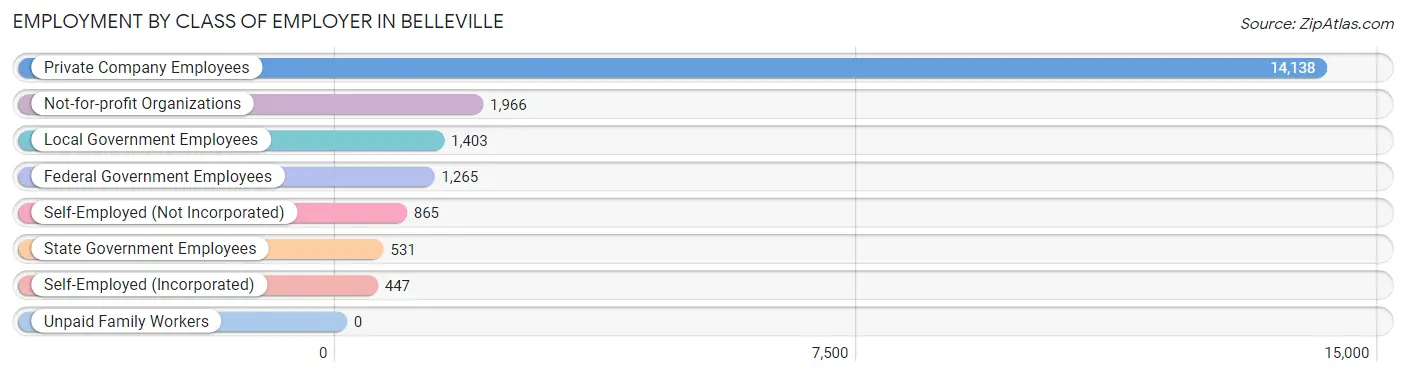
| Employer Class | # Employees | % Employees |
| Private Company Employees | 14,138 | 68.6% |
| Self-Employed (Incorporated) | 447 | 2.2% |
| Self-Employed (Not Incorporated) | 865 | 4.2% |
| Not-for-profit Organizations | 1,966 | 9.5% |
| Local Government Employees | 1,403 | 6.8% |
| State Government Employees | 531 | 2.6% |
| Federal Government Employees | 1,265 | 6.1% |
| Unpaid Family Workers | 0 | 0.0% |
| Total | 20,615 | 100.0% |
Employment Status by Age in Belleville
According to the labor force statistics for Belleville, out of the total population over 16 years of age (33,660), 66.0% or 22,216 individuals are in the labor force, with 6.0% or 1,333 of them unemployed. The age group with the highest labor force participation rate is 35 to 44 years, with 84.8% or 5,336 individuals in the labor force. Within the labor force, the 16 to 19 years age range has the highest percentage of unemployed individuals, with 14.9% or 131 of them being unemployed.
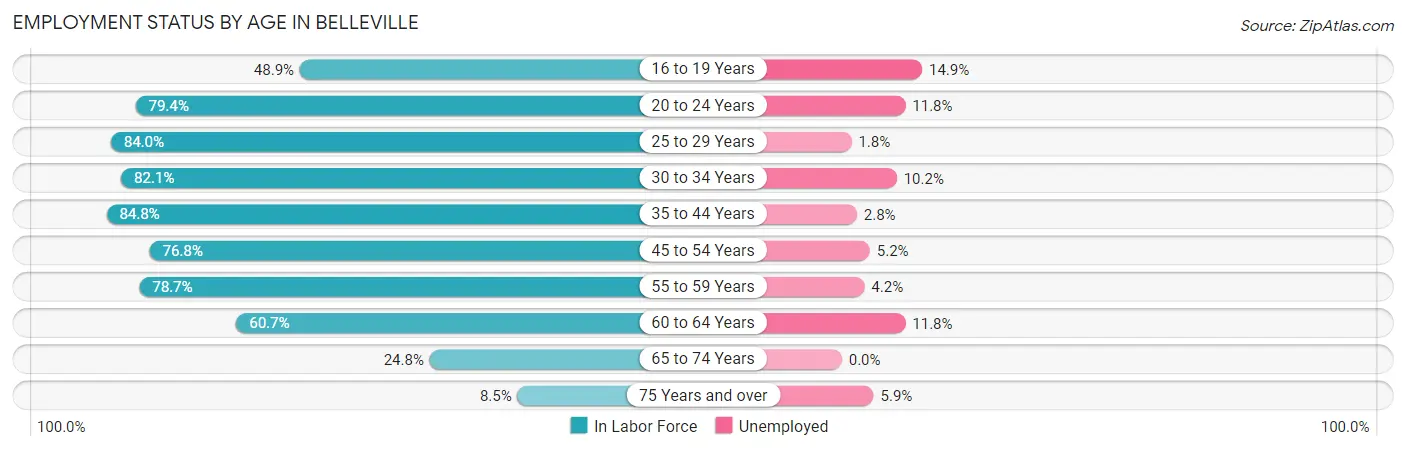
| Age Bracket | In Labor Force | Unemployed |
| 16 to 19 Years | 882 (48.9%) | 131 (14.9%) |
| 20 to 24 Years | 2,310 (79.4%) | 273 (11.8%) |
| 25 to 29 Years | 2,508 (84.0%) | 45 (1.8%) |
| 30 to 34 Years | 2,294 (82.1%) | 234 (10.2%) |
| 35 to 44 Years | 5,336 (84.8%) | 149 (2.8%) |
| 45 to 54 Years | 3,954 (76.8%) | 206 (5.2%) |
| 55 to 59 Years | 2,126 (78.7%) | 89 (4.2%) |
| 60 to 64 Years | 1,641 (60.7%) | 194 (11.8%) |
| 65 to 74 Years | 973 (24.8%) | 0 (0.0%) |
| 75 Years and over | 204 (8.5%) | 12 (5.9%) |
| Total | 22,216 (66.0%) | 1,333 (6.0%) |
Employment Status by Educational Attainment in Belleville
According to labor force statistics for Belleville, 78.9% of individuals (17,853) out of the total population between 25 and 64 years of age (22,627) are in the labor force, with 5.2% or 928 of them being unemployed. The group with the highest labor force participation rate are those with the educational attainment of bachelor's degree or higher, with 84.0% or 5,190 individuals in the labor force. Within the labor force, individuals with less than high school education have the highest percentage of unemployment, with 17.9% or 117 of them being unemployed.
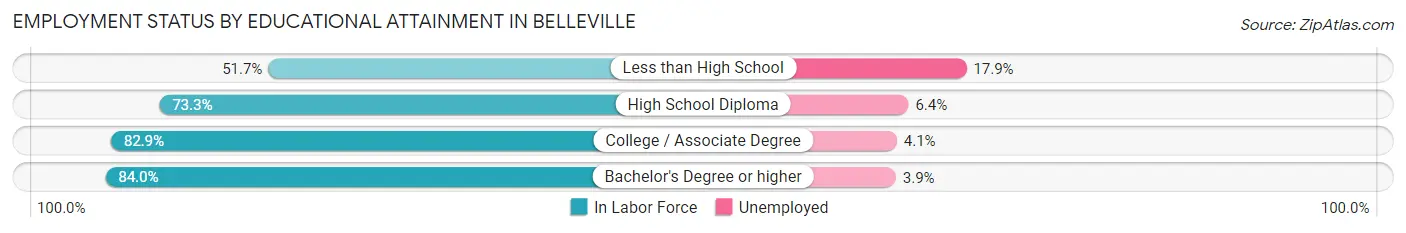
| Educational Attainment | In Labor Force | Unemployed |
| Less than High School | 654 (51.7%) | 226 (17.9%) |
| High School Diploma | 4,361 (73.3%) | 381 (6.4%) |
| College / Associate Degree | 7,655 (82.9%) | 379 (4.1%) |
| Bachelor's Degree or higher | 5,190 (84.0%) | 241 (3.9%) |
| Total | 17,853 (78.9%) | 1,177 (5.2%) |
Employment Occupations by Sex in Belleville
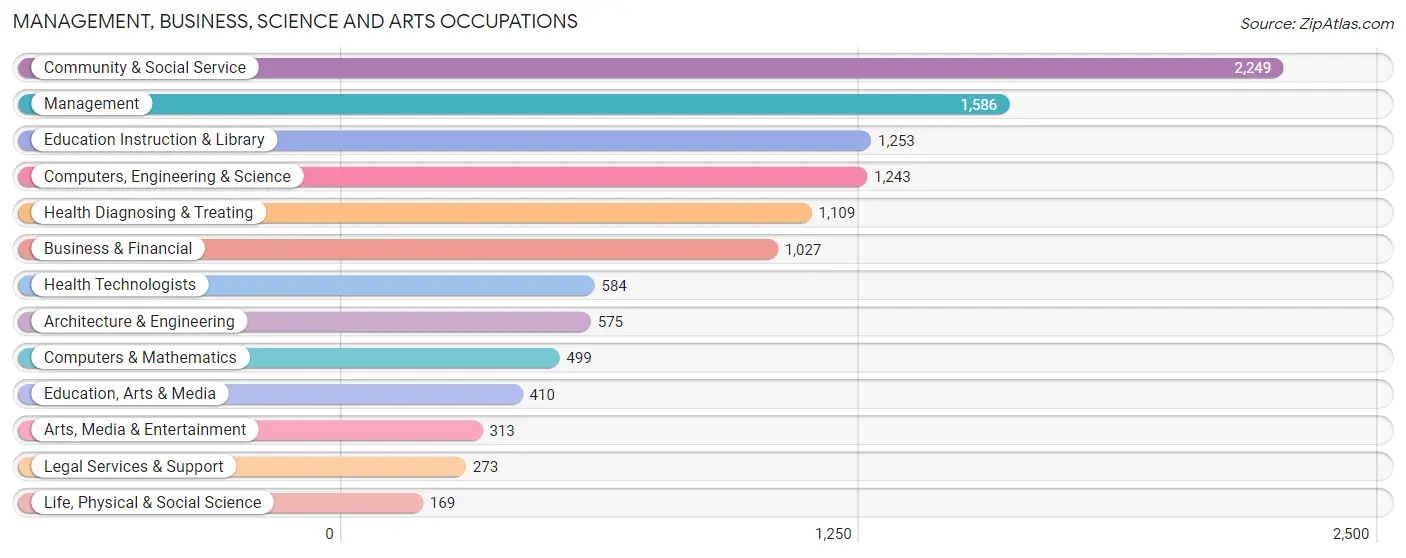
Management, Business, Science and Arts Occupations
The most common Management, Business, Science and Arts occupations in Belleville are Community & Social Service (2,249 | 11.0%), Management (1,586 | 7.7%), Education Instruction & Library (1,253 | 6.1%), Computers, Engineering & Science (1,243 | 6.0%), and Health Diagnosing & Treating (1,109 | 5.4%).
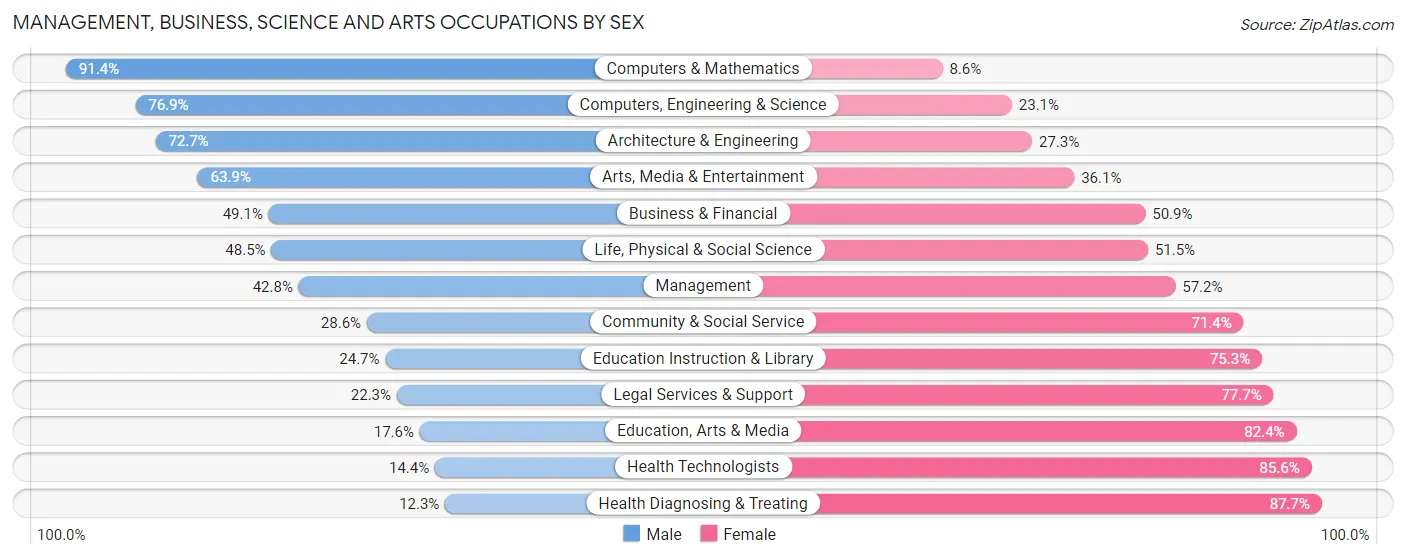
Management, Business, Science and Arts Occupations by Sex
Within the Management, Business, Science and Arts occupations in Belleville, the most male-oriented occupations are Computers & Mathematics (91.4%), Computers, Engineering & Science (76.9%), and Architecture & Engineering (72.7%), while the most female-oriented occupations are Health Diagnosing & Treating (87.7%), Health Technologists (85.6%), and Education, Arts & Media (82.4%).
| Occupation | Male | Female |
| Management | 679 (42.8%) | 907 (57.2%) |
| Business & Financial | 504 (49.1%) | 523 (50.9%) |
| Computers, Engineering & Science | 956 (76.9%) | 287 (23.1%) |
| Computers & Mathematics | 456 (91.4%) | 43 (8.6%) |
| Architecture & Engineering | 418 (72.7%) | 157 (27.3%) |
| Life, Physical & Social Science | 82 (48.5%) | 87 (51.5%) |
| Community & Social Service | 643 (28.6%) | 1,606 (71.4%) |
| Education, Arts & Media | 72 (17.6%) | 338 (82.4%) |
| Legal Services & Support | 61 (22.3%) | 212 (77.7%) |
| Education Instruction & Library | 310 (24.7%) | 943 (75.3%) |
| Arts, Media & Entertainment | 200 (63.9%) | 113 (36.1%) |
| Health Diagnosing & Treating | 136 (12.3%) | 973 (87.7%) |
| Health Technologists | 84 (14.4%) | 500 (85.6%) |
| Total (Category) | 2,918 (40.5%) | 4,296 (59.6%) |
| Total (Overall) | 9,760 (47.5%) | 10,776 (52.5%) |
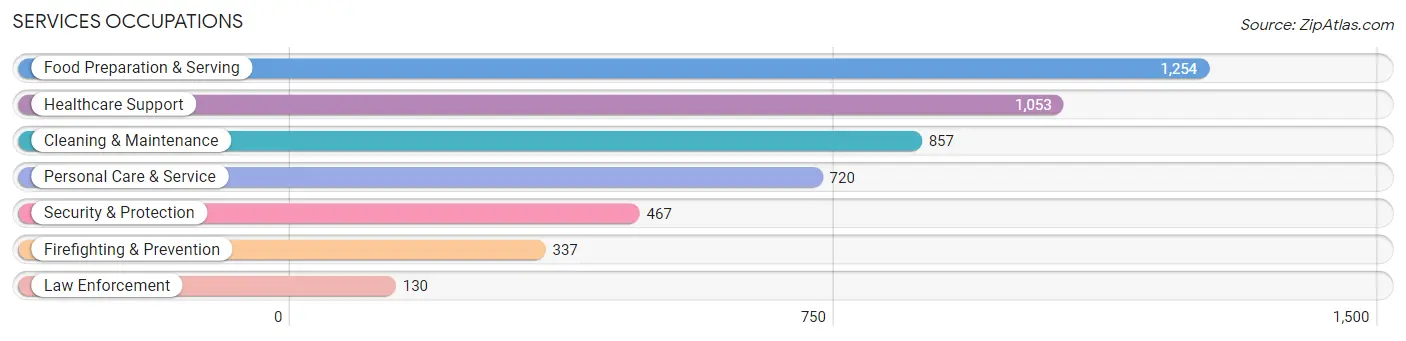
Services Occupations
The most common Services occupations in Belleville are Food Preparation & Serving (1,254 | 6.1%), Healthcare Support (1,053 | 5.1%), Cleaning & Maintenance (857 | 4.2%), Personal Care & Service (720 | 3.5%), and Security & Protection (467 | 2.3%).
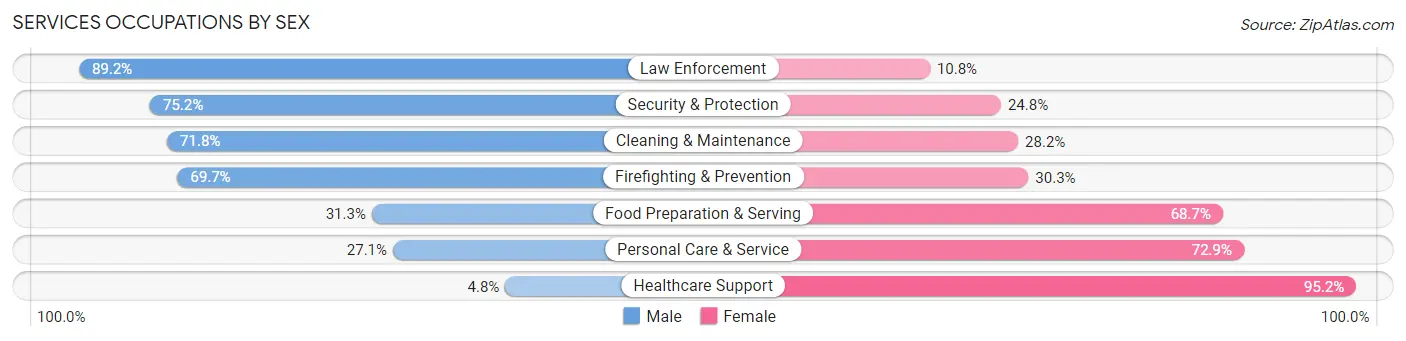
Services Occupations by Sex
Within the Services occupations in Belleville, the most male-oriented occupations are Law Enforcement (89.2%), Security & Protection (75.2%), and Cleaning & Maintenance (71.8%), while the most female-oriented occupations are Healthcare Support (95.2%), Personal Care & Service (72.9%), and Food Preparation & Serving (68.7%).
| Occupation | Male | Female |
| Healthcare Support | 51 (4.8%) | 1,002 (95.2%) |
| Security & Protection | 351 (75.2%) | 116 (24.8%) |
| Firefighting & Prevention | 235 (69.7%) | 102 (30.3%) |
| Law Enforcement | 116 (89.2%) | 14 (10.8%) |
| Food Preparation & Serving | 392 (31.3%) | 862 (68.7%) |
| Cleaning & Maintenance | 615 (71.8%) | 242 (28.2%) |
| Personal Care & Service | 195 (27.1%) | 525 (72.9%) |
| Total (Category) | 1,604 (36.9%) | 2,747 (63.1%) |
| Total (Overall) | 9,760 (47.5%) | 10,776 (52.5%) |
Sales and Office Occupations
The most common Sales and Office occupations in Belleville are Office & Administration (2,509 | 12.2%), and Sales & Related (1,821 | 8.9%).

Sales and Office Occupations by Sex
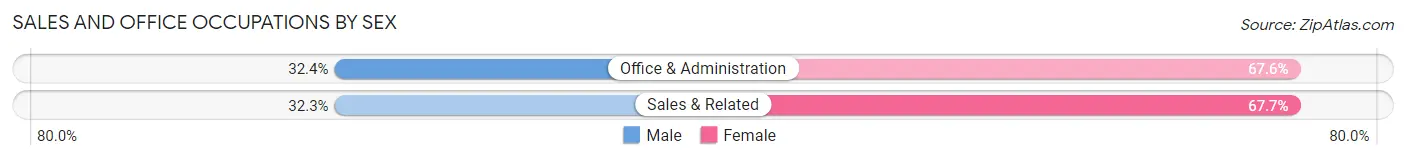
| Occupation | Male | Female |
| Sales & Related | 589 (32.3%) | 1,232 (67.7%) |
| Office & Administration | 812 (32.4%) | 1,697 (67.6%) |
| Total (Category) | 1,401 (32.4%) | 2,929 (67.6%) |
| Total (Overall) | 9,760 (47.5%) | 10,776 (52.5%) |
Natural Resources, Construction and Maintenance Occupations
The most common Natural Resources, Construction and Maintenance occupations in Belleville are Construction & Extraction (848 | 4.1%), Installation, Maintenance & Repair (533 | 2.6%), and Farming, Fishing & Forestry (13 | 0.1%).

Natural Resources, Construction and Maintenance Occupations by Sex
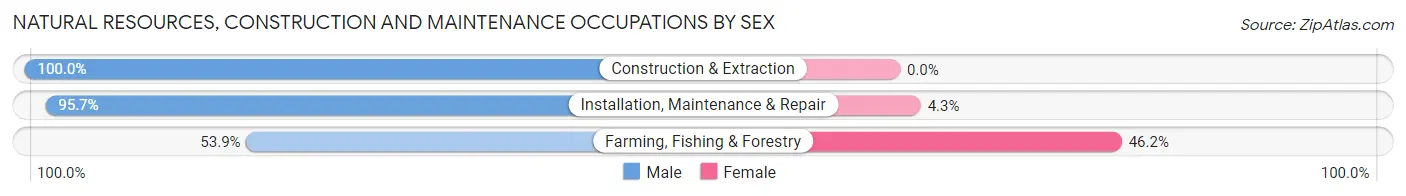
| Occupation | Male | Female |
| Farming, Fishing & Forestry | 7 (53.8%) | 6 (46.2%) |
| Construction & Extraction | 848 (100.0%) | 0 (0.0%) |
| Installation, Maintenance & Repair | 510 (95.7%) | 23 (4.3%) |
| Total (Category) | 1,365 (97.9%) | 29 (2.1%) |
| Total (Overall) | 9,760 (47.5%) | 10,776 (52.5%) |
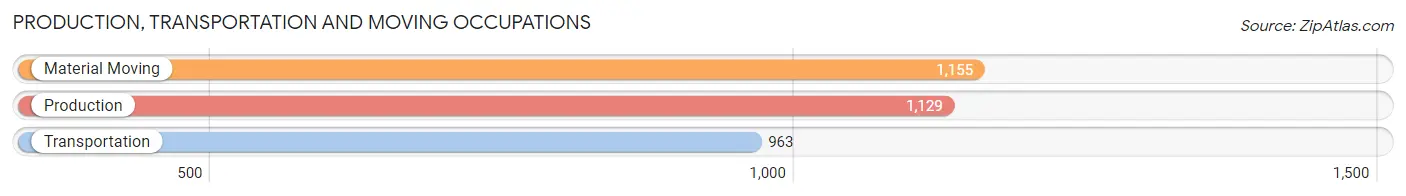
Production, Transportation and Moving Occupations
The most common Production, Transportation and Moving occupations in Belleville are Material Moving (1,155 | 5.6%), Production (1,129 | 5.5%), and Transportation (963 | 4.7%).
Production, Transportation and Moving Occupations by Sex
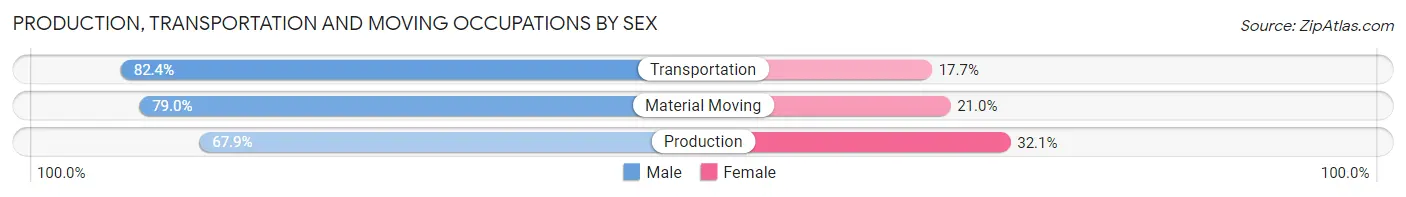
| Occupation | Male | Female |
| Production | 767 (67.9%) | 362 (32.1%) |
| Transportation | 793 (82.4%) | 170 (17.6%) |
| Material Moving | 912 (79.0%) | 243 (21.0%) |
| Total (Category) | 2,472 (76.1%) | 775 (23.9%) |
| Total (Overall) | 9,760 (47.5%) | 10,776 (52.5%) |
Employment Industries by Sex in Belleville
Employment Industries in Belleville
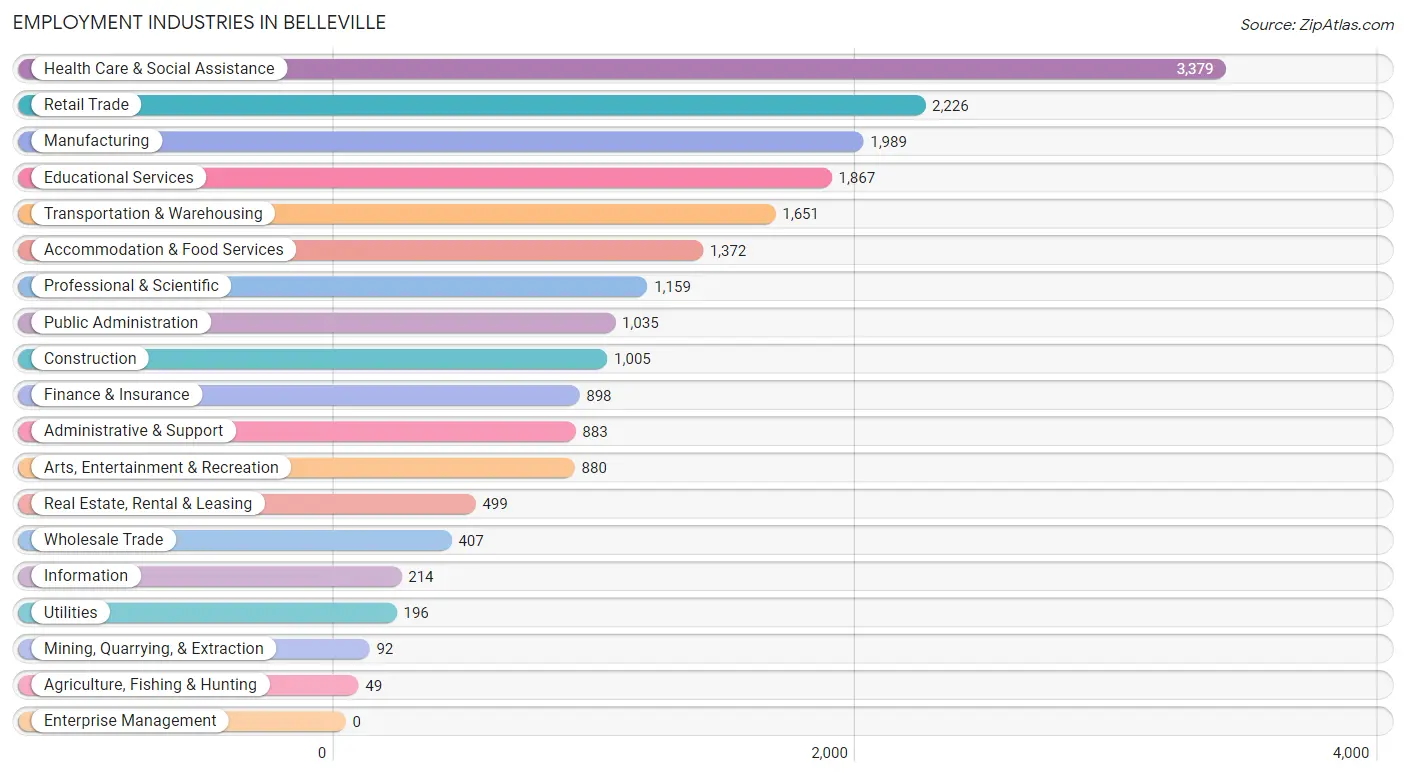
The major employment industries in Belleville include Health Care & Social Assistance (3,379 | 16.5%), Retail Trade (2,226 | 10.8%), Manufacturing (1,989 | 9.7%), Educational Services (1,867 | 9.1%), and Transportation & Warehousing (1,651 | 8.0%).
Employment Industries by Sex in Belleville
The Belleville industries that see more men than women are Agriculture, Fishing & Hunting (100.0%), Construction (92.9%), and Mining, Quarrying, & Extraction (90.2%), whereas the industries that tend to have a higher number of women are Health Care & Social Assistance (84.2%), Educational Services (72.8%), and Accommodation & Food Services (71.7%).
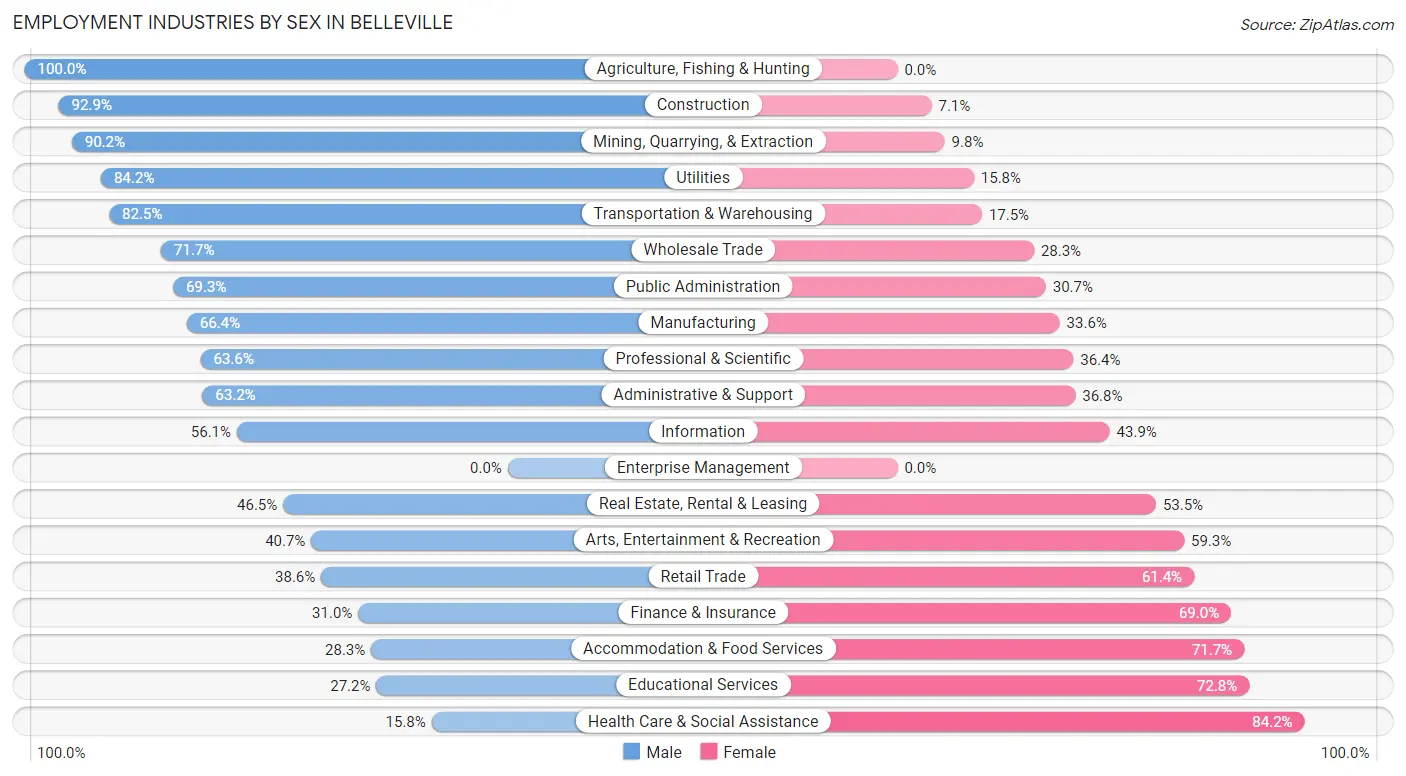
| Industry | Male | Female |
| Agriculture, Fishing & Hunting | 49 (100.0%) | 0 (0.0%) |
| Mining, Quarrying, & Extraction | 83 (90.2%) | 9 (9.8%) |
| Construction | 934 (92.9%) | 71 (7.1%) |
| Manufacturing | 1,321 (66.4%) | 668 (33.6%) |
| Wholesale Trade | 292 (71.7%) | 115 (28.3%) |
| Retail Trade | 860 (38.6%) | 1,366 (61.4%) |
| Transportation & Warehousing | 1,362 (82.5%) | 289 (17.5%) |
| Utilities | 165 (84.2%) | 31 (15.8%) |
| Information | 120 (56.1%) | 94 (43.9%) |
| Finance & Insurance | 278 (31.0%) | 620 (69.0%) |
| Real Estate, Rental & Leasing | 232 (46.5%) | 267 (53.5%) |
| Professional & Scientific | 737 (63.6%) | 422 (36.4%) |
| Enterprise Management | 0 (0.0%) | 0 (0.0%) |
| Administrative & Support | 558 (63.2%) | 325 (36.8%) |
| Educational Services | 508 (27.2%) | 1,359 (72.8%) |
| Health Care & Social Assistance | 533 (15.8%) | 2,846 (84.2%) |
| Arts, Entertainment & Recreation | 358 (40.7%) | 522 (59.3%) |
| Accommodation & Food Services | 388 (28.3%) | 984 (71.7%) |
| Public Administration | 717 (69.3%) | 318 (30.7%) |
| Total | 9,760 (47.5%) | 10,776 (52.5%) |
Education in Belleville
School Enrollment in Belleville
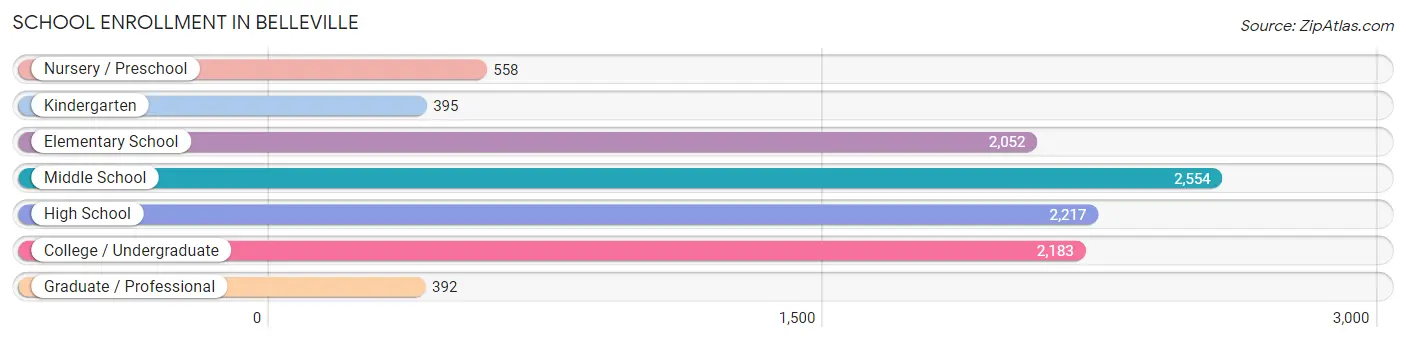
The most common levels of schooling among the 10,351 students in Belleville are middle school (2,554 | 24.7%), high school (2,217 | 21.4%), and college / undergraduate (2,183 | 21.1%).
| School Level | # Students | % Students |
| Nursery / Preschool | 558 | 5.4% |
| Kindergarten | 395 | 3.8% |
| Elementary School | 2,052 | 19.8% |
| Middle School | 2,554 | 24.7% |
| High School | 2,217 | 21.4% |
| College / Undergraduate | 2,183 | 21.1% |
| Graduate / Professional | 392 | 3.8% |
| Total | 10,351 | 100.0% |
School Enrollment by Age by Funding Source in Belleville
Out of a total of 10,351 students who are enrolled in schools in Belleville, 1,294 (12.5%) attend a private institution, while the remaining 9,057 (87.5%) are enrolled in public schools. The age group of 3 to 4 year olds has the highest likelihood of being enrolled in private schools, with 227 (47.0% in the age bracket) enrolled. Conversely, the age group of 18 to 19 year olds has the lowest likelihood of being enrolled in a private school, with 401 (95.7% in the age bracket) attending a public institution.
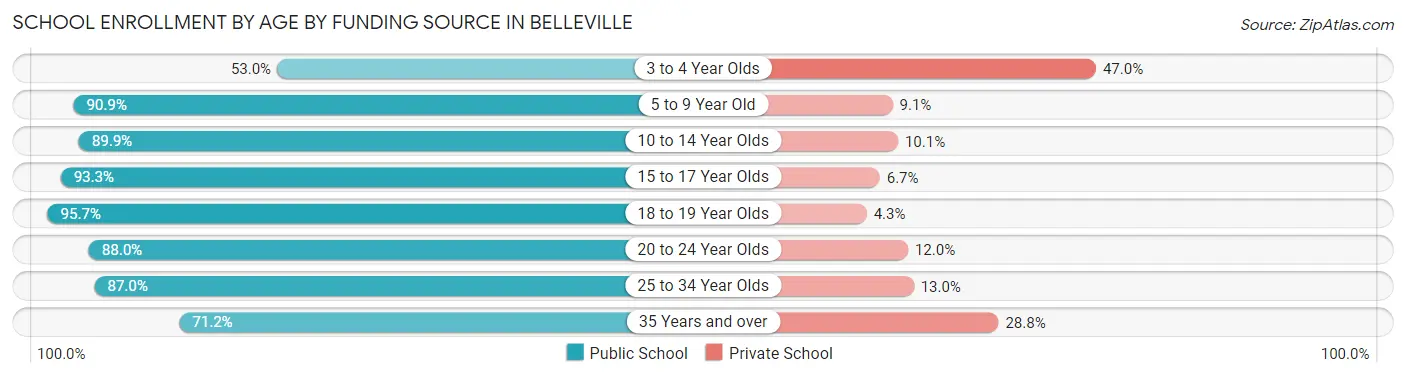
| Age Bracket | Public School | Private School |
| 3 to 4 Year Olds | 256 (53.0%) | 227 (47.0%) |
| 5 to 9 Year Old | 2,075 (90.9%) | 208 (9.1%) |
| 10 to 14 Year Olds | 2,735 (89.9%) | 308 (10.1%) |
| 15 to 17 Year Olds | 1,608 (93.3%) | 116 (6.7%) |
| 18 to 19 Year Olds | 401 (95.7%) | 18 (4.3%) |
| 20 to 24 Year Olds | 757 (88.0%) | 103 (12.0%) |
| 25 to 34 Year Olds | 687 (87.0%) | 103 (13.0%) |
| 35 Years and over | 533 (71.2%) | 216 (28.8%) |
| Total | 9,057 (87.5%) | 1,294 (12.5%) |
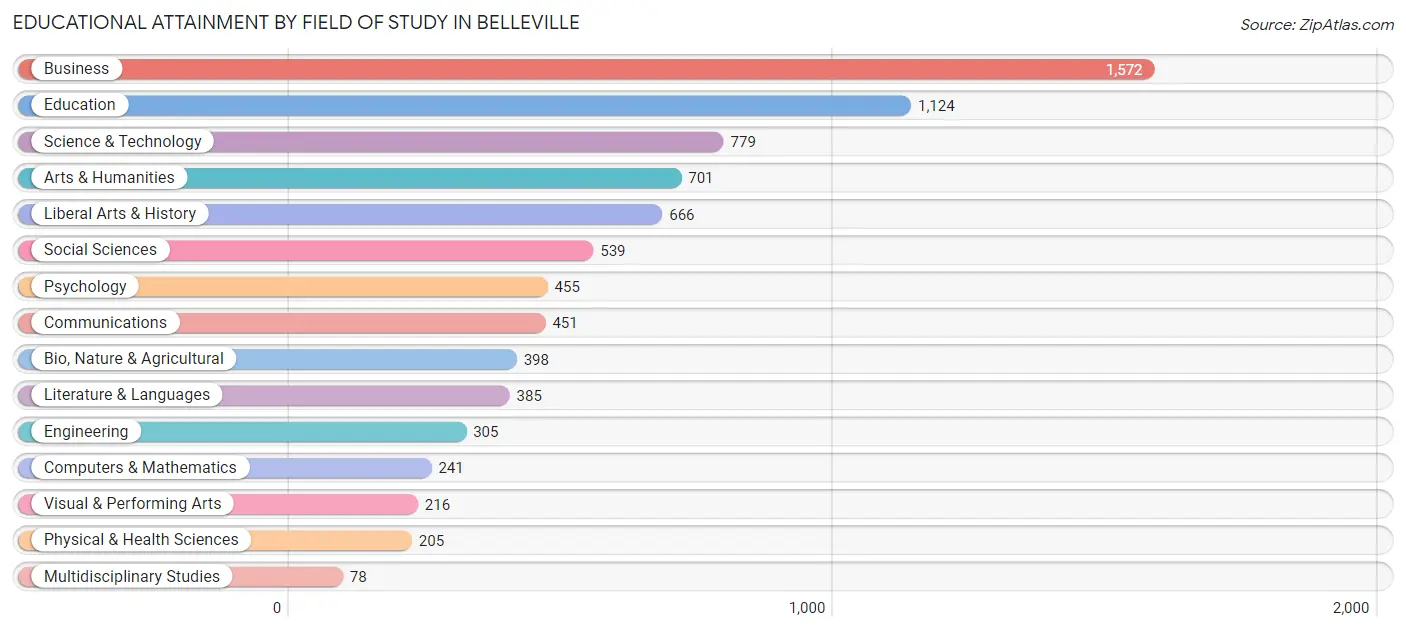
Educational Attainment by Field of Study in Belleville
Business (1,572 | 19.4%), education (1,124 | 13.9%), science & technology (779 | 9.6%), arts & humanities (701 | 8.6%), and liberal arts & history (666 | 8.2%) are the most common fields of study among 8,115 individuals in Belleville who have obtained a bachelor's degree or higher.
| Field of Study | # Graduates | % Graduates |
| Computers & Mathematics | 241 | 3.0% |
| Bio, Nature & Agricultural | 398 | 4.9% |
| Physical & Health Sciences | 205 | 2.5% |
| Psychology | 455 | 5.6% |
| Social Sciences | 539 | 6.6% |
| Engineering | 305 | 3.8% |
| Multidisciplinary Studies | 78 | 1.0% |
| Science & Technology | 779 | 9.6% |
| Business | 1,572 | 19.4% |
| Education | 1,124 | 13.9% |
| Literature & Languages | 385 | 4.7% |
| Liberal Arts & History | 666 | 8.2% |
| Visual & Performing Arts | 216 | 2.7% |
| Communications | 451 | 5.6% |
| Arts & Humanities | 701 | 8.6% |
| Total | 8,115 | 100.0% |
Transportation & Commute in Belleville
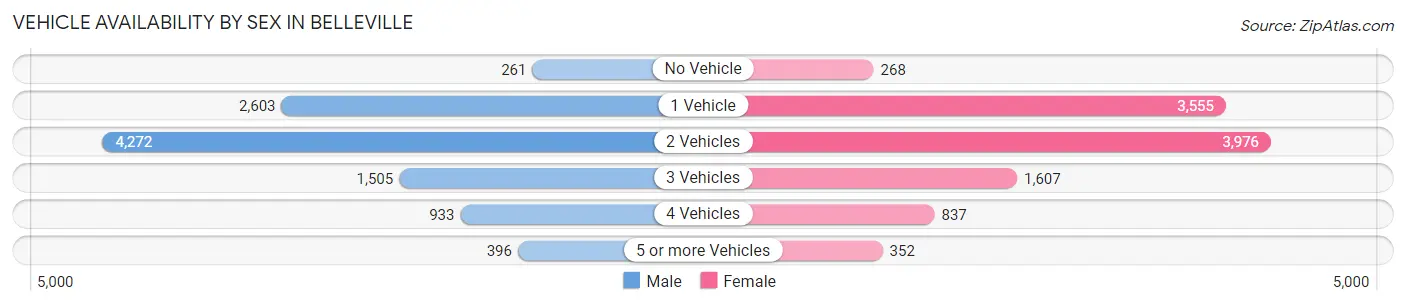
Vehicle Availability by Sex in Belleville
The most prevalent vehicle ownership categories in Belleville are males with 2 vehicles (4,272, accounting for 42.8%) and females with 2 vehicles (3,976, making up 40.3%).
| Vehicles Available | Male | Female |
| No Vehicle | 261 (2.6%) | 268 (2.5%) |
| 1 Vehicle | 2,603 (26.1%) | 3,555 (33.6%) |
| 2 Vehicles | 4,272 (42.8%) | 3,976 (37.5%) |
| 3 Vehicles | 1,505 (15.1%) | 1,607 (15.2%) |
| 4 Vehicles | 933 (9.4%) | 837 (7.9%) |
| 5 or more Vehicles | 396 (4.0%) | 352 (3.3%) |
| Total | 9,970 (100.0%) | 10,595 (100.0%) |
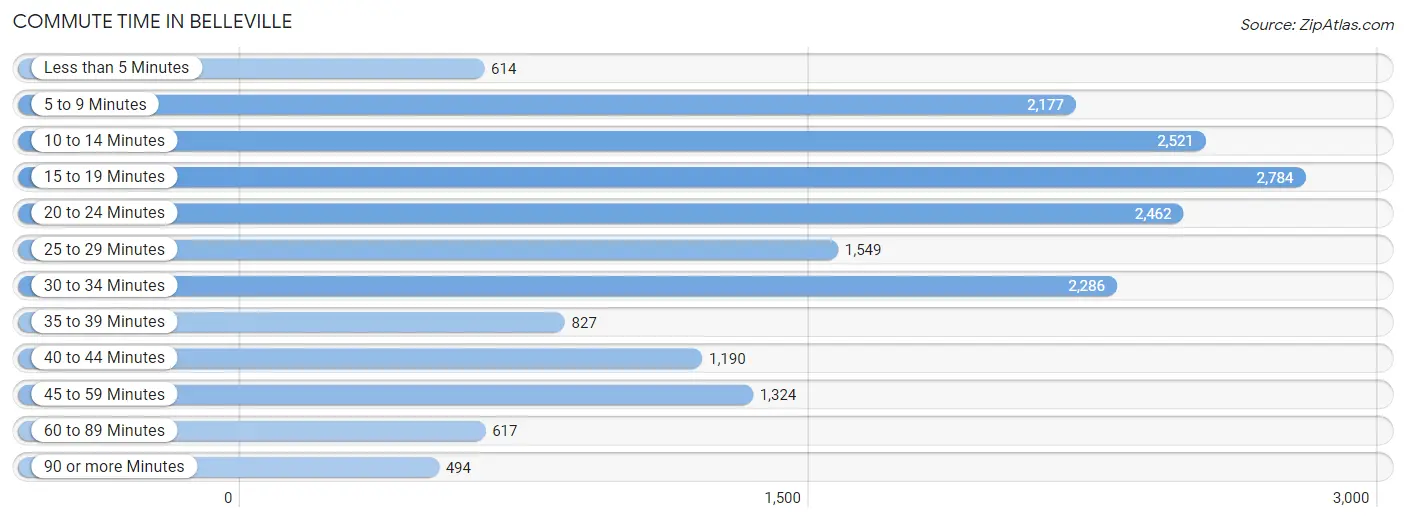
Commute Time in Belleville
The most frequently occuring commute durations in Belleville are 15 to 19 minutes (2,784 commuters, 14.8%), 10 to 14 minutes (2,521 commuters, 13.4%), and 20 to 24 minutes (2,462 commuters, 13.1%).
| Commute Time | # Commuters | % Commuters |
| Less than 5 Minutes | 614 | 3.3% |
| 5 to 9 Minutes | 2,177 | 11.6% |
| 10 to 14 Minutes | 2,521 | 13.4% |
| 15 to 19 Minutes | 2,784 | 14.8% |
| 20 to 24 Minutes | 2,462 | 13.1% |
| 25 to 29 Minutes | 1,549 | 8.2% |
| 30 to 34 Minutes | 2,286 | 12.1% |
| 35 to 39 Minutes | 827 | 4.4% |
| 40 to 44 Minutes | 1,190 | 6.3% |
| 45 to 59 Minutes | 1,324 | 7.0% |
| 60 to 89 Minutes | 617 | 3.3% |
| 90 or more Minutes | 494 | 2.6% |
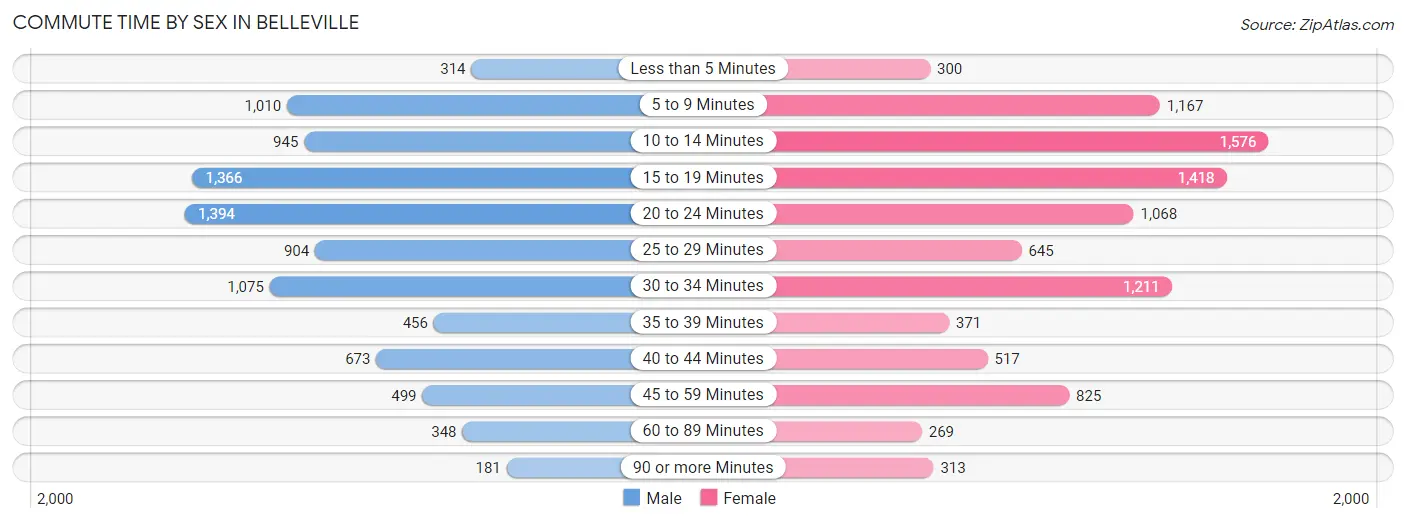
Commute Time by Sex in Belleville
The most common commute times in Belleville are 20 to 24 minutes (1,394 commuters, 15.2%) for males and 10 to 14 minutes (1,576 commuters, 16.3%) for females.
| Commute Time | Male | Female |
| Less than 5 Minutes | 314 (3.4%) | 300 (3.1%) |
| 5 to 9 Minutes | 1,010 (11.0%) | 1,167 (12.1%) |
| 10 to 14 Minutes | 945 (10.3%) | 1,576 (16.3%) |
| 15 to 19 Minutes | 1,366 (14.9%) | 1,418 (14.6%) |
| 20 to 24 Minutes | 1,394 (15.2%) | 1,068 (11.0%) |
| 25 to 29 Minutes | 904 (9.9%) | 645 (6.7%) |
| 30 to 34 Minutes | 1,075 (11.7%) | 1,211 (12.5%) |
| 35 to 39 Minutes | 456 (5.0%) | 371 (3.8%) |
| 40 to 44 Minutes | 673 (7.3%) | 517 (5.3%) |
| 45 to 59 Minutes | 499 (5.4%) | 825 (8.5%) |
| 60 to 89 Minutes | 348 (3.8%) | 269 (2.8%) |
| 90 or more Minutes | 181 (2.0%) | 313 (3.2%) |
Time of Departure to Work by Sex in Belleville
The most frequent times of departure to work in Belleville are 6:00 AM to 6:29 AM (1,306, 14.2%) for males and 7:00 AM to 7:29 AM (1,425, 14.7%) for females.
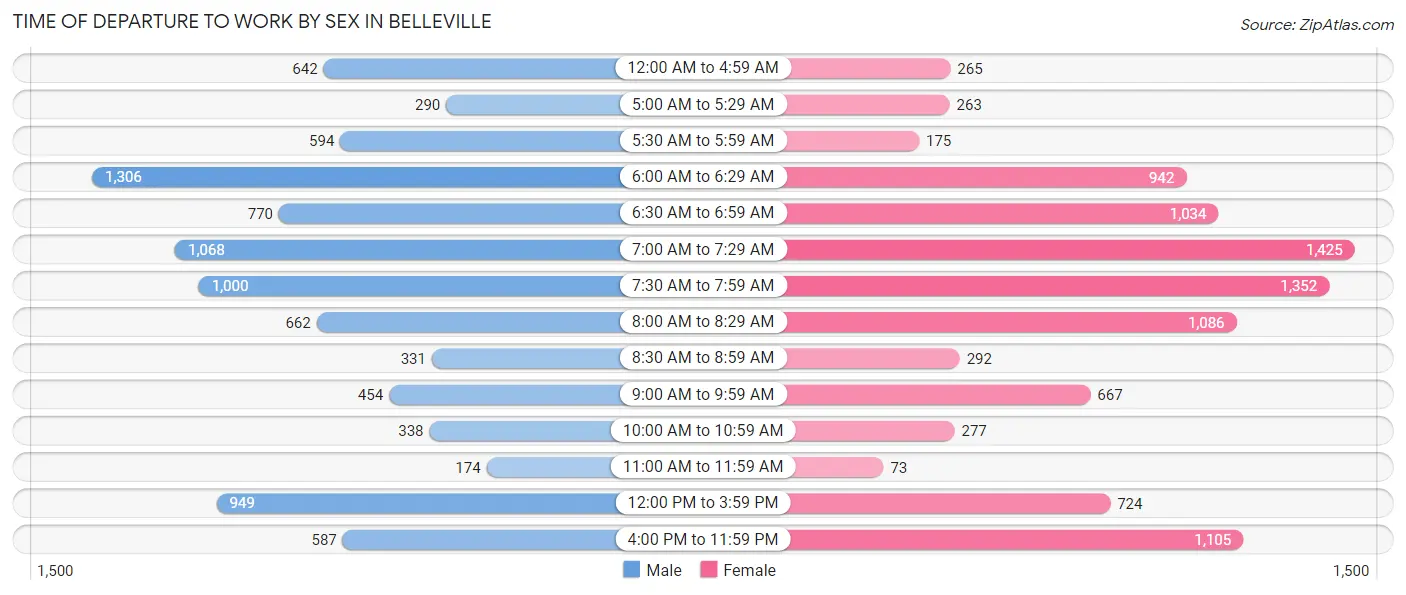
| Time of Departure | Male | Female |
| 12:00 AM to 4:59 AM | 642 (7.0%) | 265 (2.7%) |
| 5:00 AM to 5:29 AM | 290 (3.2%) | 263 (2.7%) |
| 5:30 AM to 5:59 AM | 594 (6.5%) | 175 (1.8%) |
| 6:00 AM to 6:29 AM | 1,306 (14.2%) | 942 (9.7%) |
| 6:30 AM to 6:59 AM | 770 (8.4%) | 1,034 (10.7%) |
| 7:00 AM to 7:29 AM | 1,068 (11.7%) | 1,425 (14.7%) |
| 7:30 AM to 7:59 AM | 1,000 (10.9%) | 1,352 (14.0%) |
| 8:00 AM to 8:29 AM | 662 (7.2%) | 1,086 (11.2%) |
| 8:30 AM to 8:59 AM | 331 (3.6%) | 292 (3.0%) |
| 9:00 AM to 9:59 AM | 454 (5.0%) | 667 (6.9%) |
| 10:00 AM to 10:59 AM | 338 (3.7%) | 277 (2.9%) |
| 11:00 AM to 11:59 AM | 174 (1.9%) | 73 (0.7%) |
| 12:00 PM to 3:59 PM | 949 (10.3%) | 724 (7.5%) |
| 4:00 PM to 11:59 PM | 587 (6.4%) | 1,105 (11.4%) |
| Total | 9,165 (100.0%) | 9,680 (100.0%) |
Housing Occupancy in Belleville
Occupancy by Ownership in Belleville
Of the total 17,596 dwellings in Belleville, owner-occupied units account for 10,999 (62.5%), while renter-occupied units make up 6,597 (37.5%).
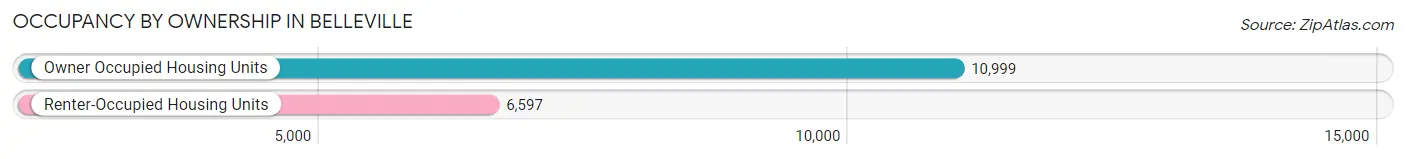
| Occupancy | # Housing Units | % Housing Units |
| Owner Occupied Housing Units | 10,999 | 62.5% |
| Renter-Occupied Housing Units | 6,597 | 37.5% |
| Total Occupied Housing Units | 17,596 | 100.0% |
Occupancy by Household Size in Belleville
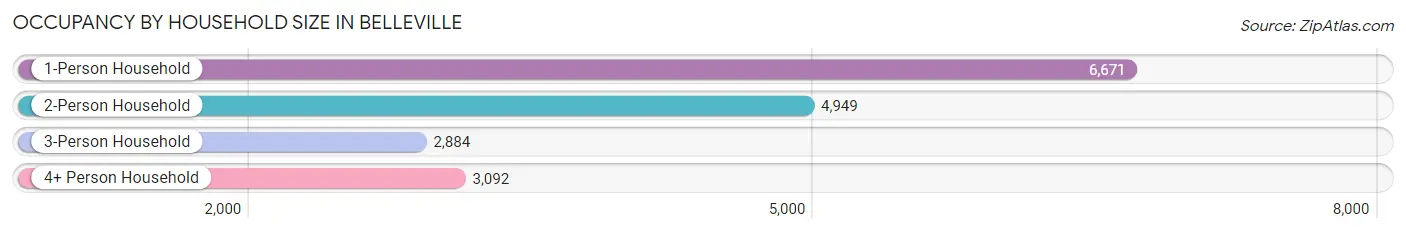
| Household Size | # Housing Units | % Housing Units |
| 1-Person Household | 6,671 | 37.9% |
| 2-Person Household | 4,949 | 28.1% |
| 3-Person Household | 2,884 | 16.4% |
| 4+ Person Household | 3,092 | 17.6% |
| Total Housing Units | 17,596 | 100.0% |
Occupancy by Ownership by Household Size in Belleville
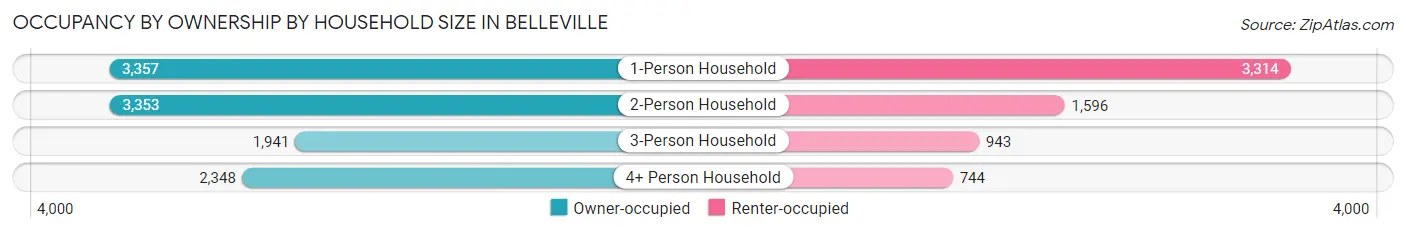
| Household Size | Owner-occupied | Renter-occupied |
| 1-Person Household | 3,357 (50.3%) | 3,314 (49.7%) |
| 2-Person Household | 3,353 (67.7%) | 1,596 (32.3%) |
| 3-Person Household | 1,941 (67.3%) | 943 (32.7%) |
| 4+ Person Household | 2,348 (75.9%) | 744 (24.1%) |
| Total Housing Units | 10,999 (62.5%) | 6,597 (37.5%) |
Occupancy by Educational Attainment in Belleville
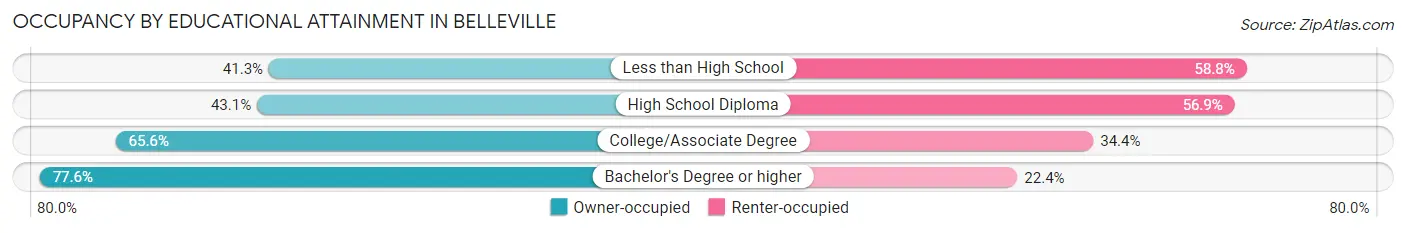
| Household Size | Owner-occupied | Renter-occupied |
| Less than High School | 311 (41.2%) | 443 (58.8%) |
| High School Diploma | 1,799 (43.1%) | 2,371 (56.9%) |
| College/Associate Degree | 5,141 (65.6%) | 2,701 (34.4%) |
| Bachelor's Degree or higher | 3,748 (77.6%) | 1,082 (22.4%) |
Occupancy by Age of Householder in Belleville
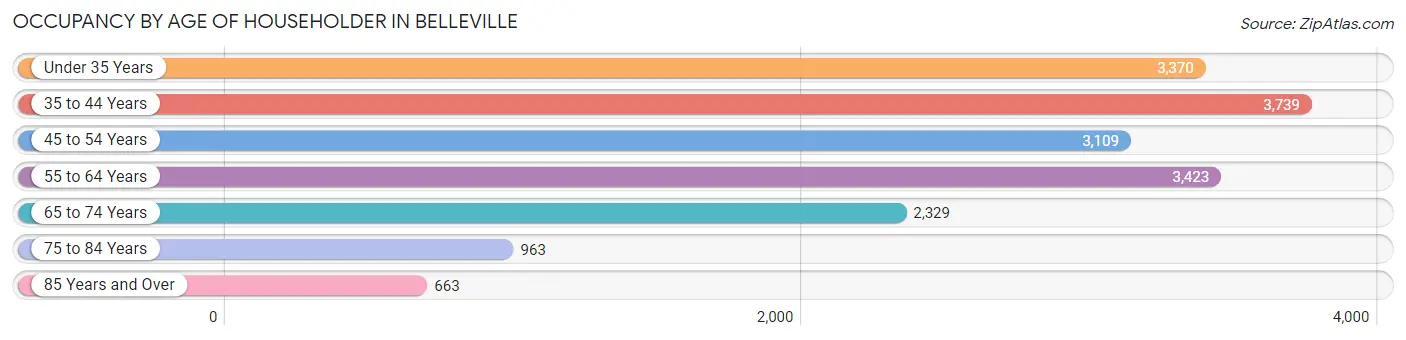
| Age Bracket | # Households | % Households |
| Under 35 Years | 3,370 | 19.2% |
| 35 to 44 Years | 3,739 | 21.2% |
| 45 to 54 Years | 3,109 | 17.7% |
| 55 to 64 Years | 3,423 | 19.5% |
| 65 to 74 Years | 2,329 | 13.2% |
| 75 to 84 Years | 963 | 5.5% |
| 85 Years and Over | 663 | 3.8% |
| Total | 17,596 | 100.0% |
Housing Finances in Belleville
Median Income by Occupancy in Belleville
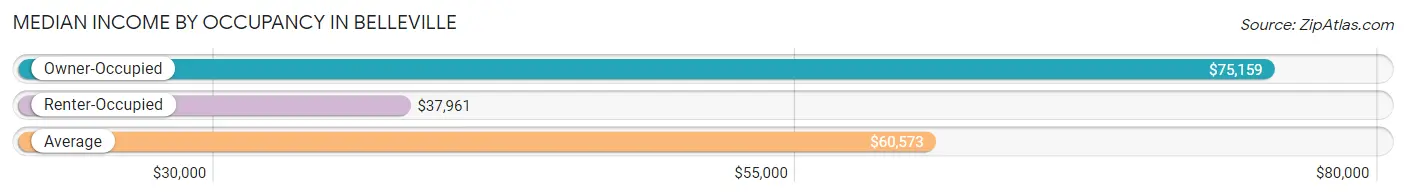
| Occupancy Type | # Households | Median Income |
| Owner-Occupied | 10,999 (62.5%) | $75,159 |
| Renter-Occupied | 6,597 (37.5%) | $37,961 |
| Average | 17,596 (100.0%) | $60,573 |
Occupancy by Householder Income Bracket in Belleville
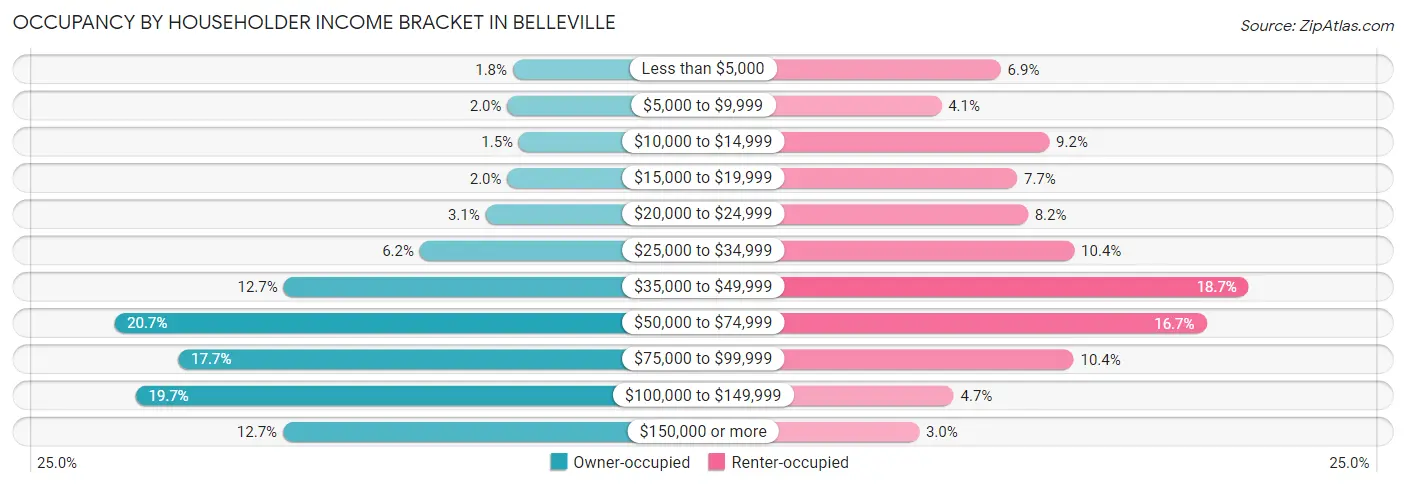
| Income Bracket | Owner-occupied | Renter-occupied |
| Less than $5,000 | 193 (1.8%) | 456 (6.9%) |
| $5,000 to $9,999 | 221 (2.0%) | 269 (4.1%) |
| $10,000 to $14,999 | 161 (1.5%) | 608 (9.2%) |
| $15,000 to $19,999 | 221 (2.0%) | 507 (7.7%) |
| $20,000 to $24,999 | 336 (3.0%) | 541 (8.2%) |
| $25,000 to $34,999 | 680 (6.2%) | 687 (10.4%) |
| $35,000 to $49,999 | 1,394 (12.7%) | 1,235 (18.7%) |
| $50,000 to $74,999 | 2,281 (20.7%) | 1,102 (16.7%) |
| $75,000 to $99,999 | 1,946 (17.7%) | 685 (10.4%) |
| $100,000 to $149,999 | 2,169 (19.7%) | 308 (4.7%) |
| $150,000 or more | 1,397 (12.7%) | 199 (3.0%) |
| Total | 10,999 (100.0%) | 6,597 (100.0%) |
Monthly Housing Cost Tiers in Belleville
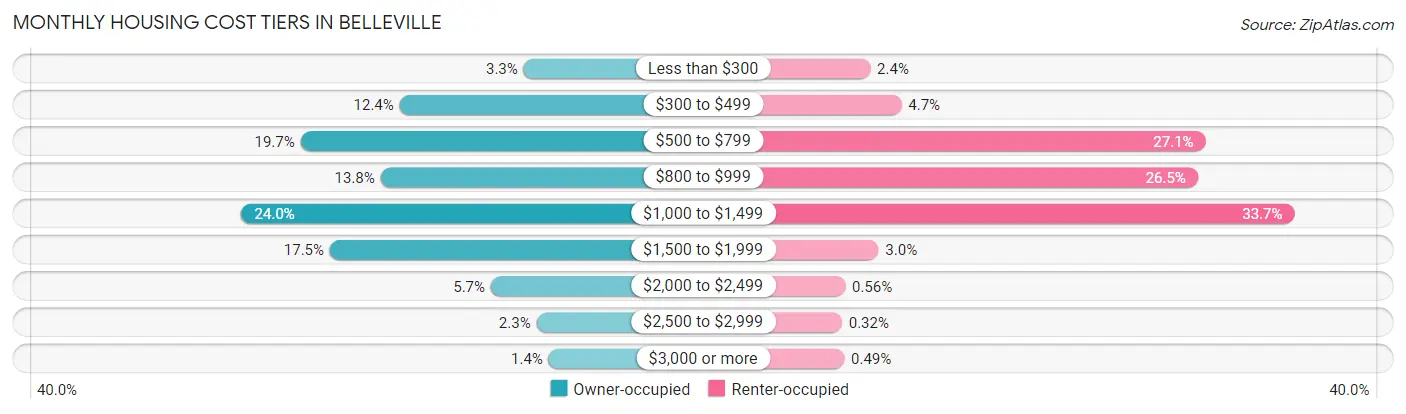
| Monthly Cost | Owner-occupied | Renter-occupied |
| Less than $300 | 357 (3.3%) | 159 (2.4%) |
| $300 to $499 | 1,362 (12.4%) | 311 (4.7%) |
| $500 to $799 | 2,165 (19.7%) | 1,788 (27.1%) |
| $800 to $999 | 1,516 (13.8%) | 1,750 (26.5%) |
| $1,000 to $1,499 | 2,643 (24.0%) | 2,220 (33.7%) |
| $1,500 to $1,999 | 1,927 (17.5%) | 199 (3.0%) |
| $2,000 to $2,499 | 622 (5.7%) | 37 (0.6%) |
| $2,500 to $2,999 | 253 (2.3%) | 21 (0.3%) |
| $3,000 or more | 154 (1.4%) | 32 (0.5%) |
| Total | 10,999 (100.0%) | 6,597 (100.0%) |
Physical Housing Characteristics in Belleville
Housing Structures in Belleville
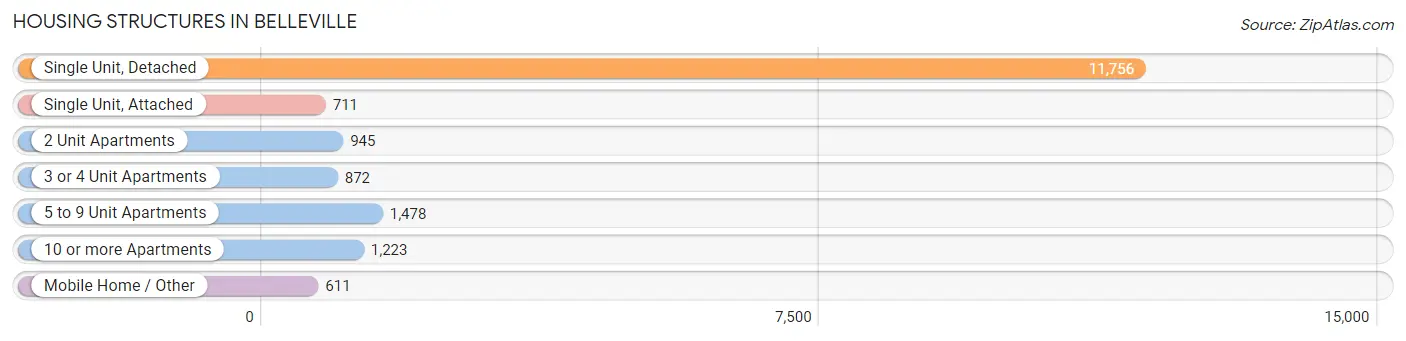
| Structure Type | # Housing Units | % Housing Units |
| Single Unit, Detached | 11,756 | 66.8% |
| Single Unit, Attached | 711 | 4.0% |
| 2 Unit Apartments | 945 | 5.4% |
| 3 or 4 Unit Apartments | 872 | 5.0% |
| 5 to 9 Unit Apartments | 1,478 | 8.4% |
| 10 or more Apartments | 1,223 | 7.0% |
| Mobile Home / Other | 611 | 3.5% |
| Total | 17,596 | 100.0% |
Housing Structures by Occupancy in Belleville
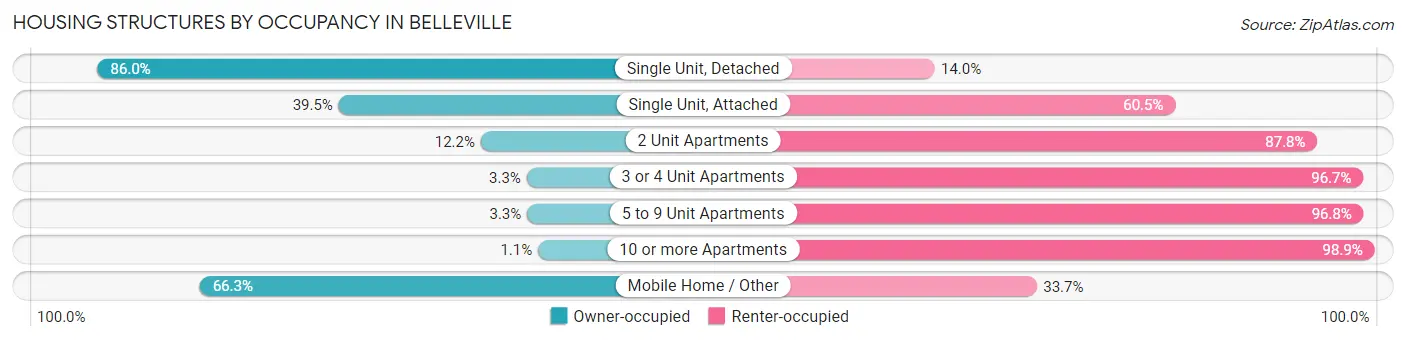
| Structure Type | Owner-occupied | Renter-occupied |
| Single Unit, Detached | 10,107 (86.0%) | 1,649 (14.0%) |
| Single Unit, Attached | 281 (39.5%) | 430 (60.5%) |
| 2 Unit Apartments | 115 (12.2%) | 830 (87.8%) |
| 3 or 4 Unit Apartments | 29 (3.3%) | 843 (96.7%) |
| 5 to 9 Unit Apartments | 48 (3.3%) | 1,430 (96.8%) |
| 10 or more Apartments | 14 (1.1%) | 1,209 (98.9%) |
| Mobile Home / Other | 405 (66.3%) | 206 (33.7%) |
| Total | 10,999 (62.5%) | 6,597 (37.5%) |
Housing Structures by Number of Rooms in Belleville
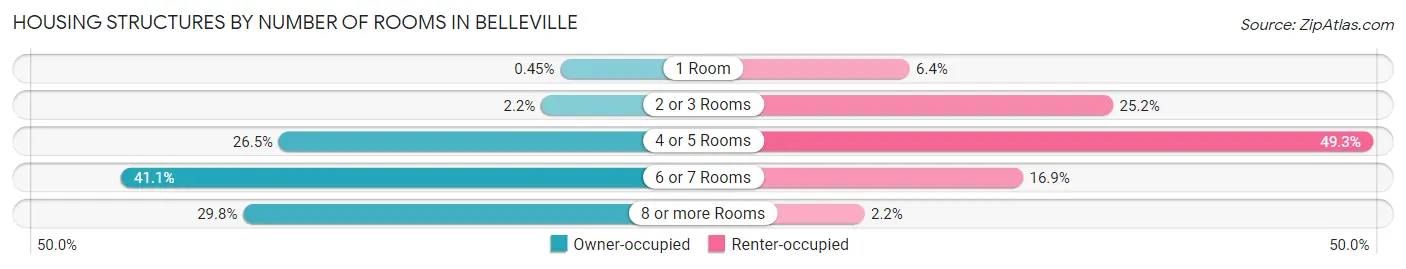
| Number of Rooms | Owner-occupied | Renter-occupied |
| 1 Room | 49 (0.4%) | 422 (6.4%) |
| 2 or 3 Rooms | 245 (2.2%) | 1,664 (25.2%) |
| 4 or 5 Rooms | 2,913 (26.5%) | 3,250 (49.3%) |
| 6 or 7 Rooms | 4,517 (41.1%) | 1,114 (16.9%) |
| 8 or more Rooms | 3,275 (29.8%) | 147 (2.2%) |
| Total | 10,999 (100.0%) | 6,597 (100.0%) |
Housing Structure by Heating Type in Belleville
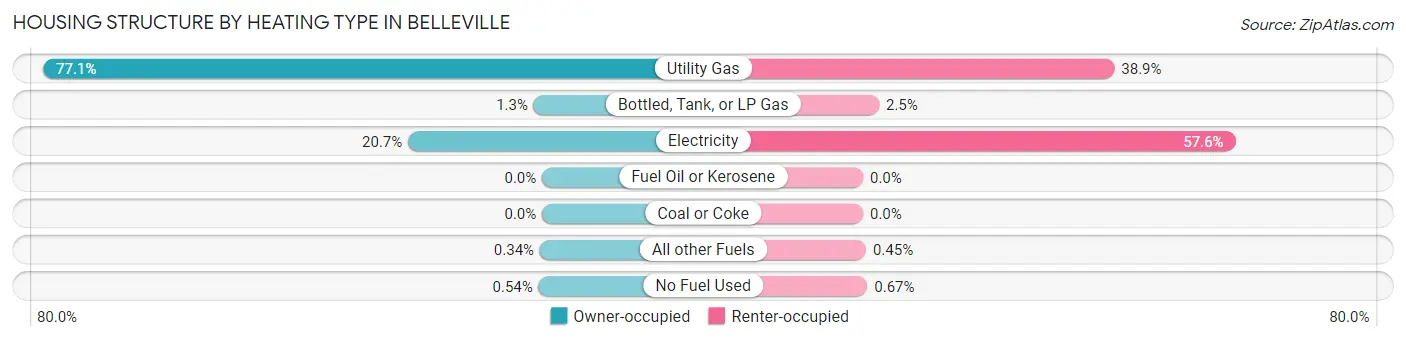
| Heating Type | Owner-occupied | Renter-occupied |
| Utility Gas | 8,484 (77.1%) | 2,563 (38.9%) |
| Bottled, Tank, or LP Gas | 141 (1.3%) | 163 (2.5%) |
| Electricity | 2,278 (20.7%) | 3,797 (57.6%) |
| Fuel Oil or Kerosene | 0 (0.0%) | 0 (0.0%) |
| Coal or Coke | 0 (0.0%) | 0 (0.0%) |
| All other Fuels | 37 (0.3%) | 30 (0.4%) |
| No Fuel Used | 59 (0.5%) | 44 (0.7%) |
| Total | 10,999 (100.0%) | 6,597 (100.0%) |
Household Vehicle Usage in Belleville
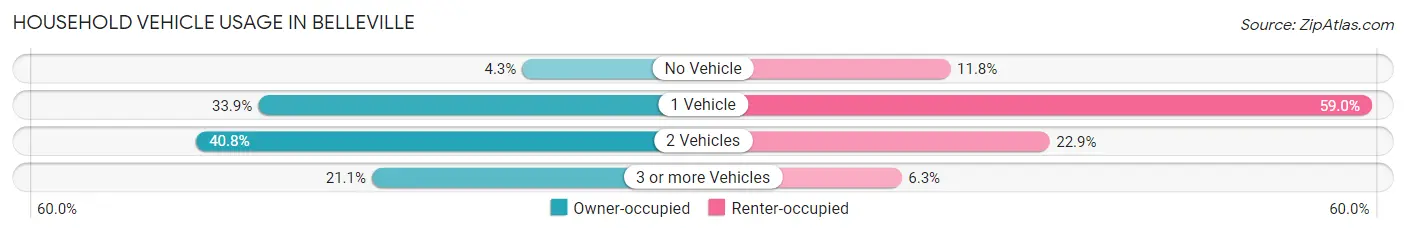
| Vehicles per Household | Owner-occupied | Renter-occupied |
| No Vehicle | 470 (4.3%) | 777 (11.8%) |
| 1 Vehicle | 3,723 (33.9%) | 3,893 (59.0%) |
| 2 Vehicles | 4,484 (40.8%) | 1,510 (22.9%) |
| 3 or more Vehicles | 2,322 (21.1%) | 417 (6.3%) |
| Total | 10,999 (100.0%) | 6,597 (100.0%) |
Real Estate & Mortgages in Belleville
Real Estate and Mortgage Overview in Belleville
| Characteristic | Without Mortgage | With Mortgage |
| Housing Units | 4,200 | 6,799 |
| Median Property Value | $97,000 | $138,200 |
| Median Household Income | $62,572 | $974 |
| Monthly Housing Costs | $568 | $142 |
| Real Estate Taxes | $2,443 | $173 |
Property Value by Mortgage Status in Belleville
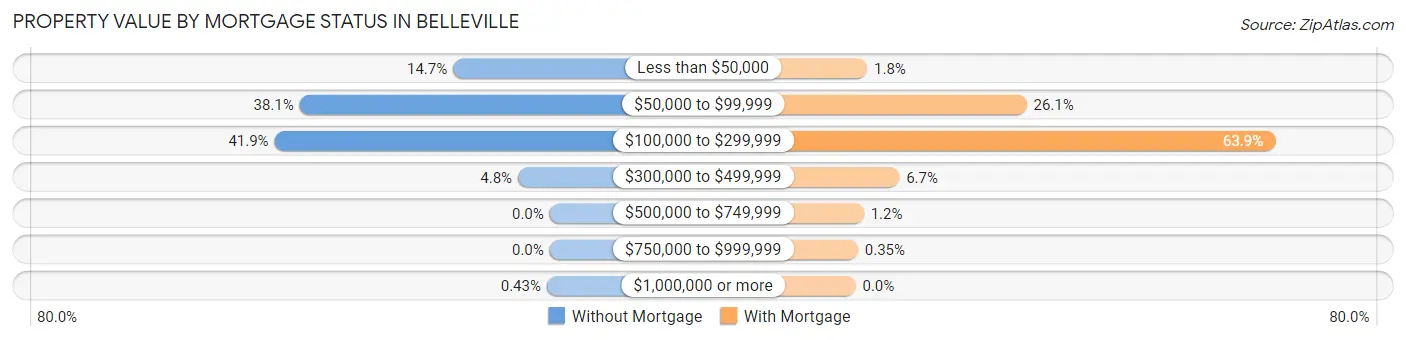
| Property Value | Without Mortgage | With Mortgage |
| Less than $50,000 | 618 (14.7%) | 120 (1.8%) |
| $50,000 to $99,999 | 1,600 (38.1%) | 1,772 (26.1%) |
| $100,000 to $299,999 | 1,761 (41.9%) | 4,346 (63.9%) |
| $300,000 to $499,999 | 203 (4.8%) | 453 (6.7%) |
| $500,000 to $749,999 | 0 (0.0%) | 84 (1.2%) |
| $750,000 to $999,999 | 0 (0.0%) | 24 (0.4%) |
| $1,000,000 or more | 18 (0.4%) | 0 (0.0%) |
| Total | 4,200 (100.0%) | 6,799 (100.0%) |
Household Income by Mortgage Status in Belleville
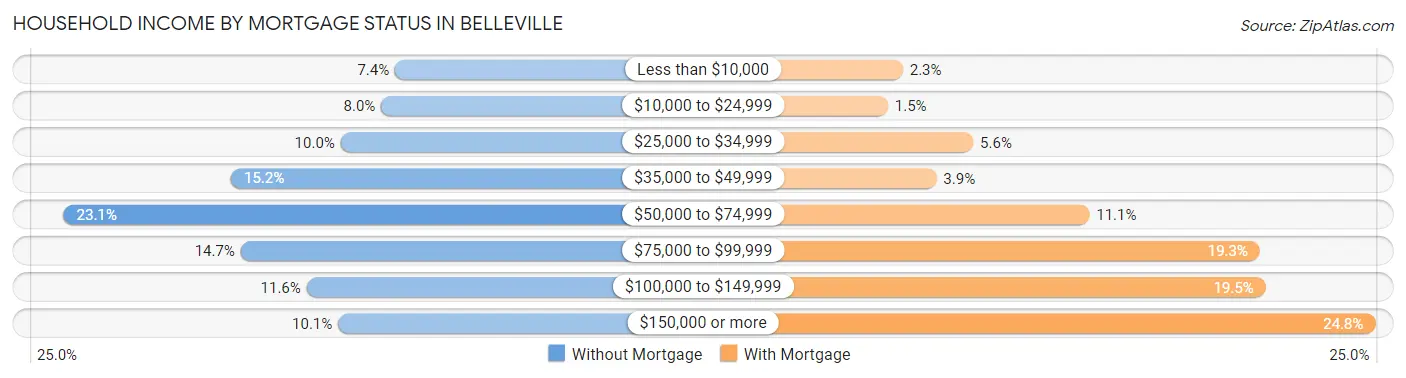
| Household Income | Without Mortgage | With Mortgage |
| Less than $10,000 | 309 (7.4%) | 153 (2.2%) |
| $10,000 to $24,999 | 337 (8.0%) | 105 (1.5%) |
| $25,000 to $34,999 | 418 (10.0%) | 381 (5.6%) |
| $35,000 to $49,999 | 637 (15.2%) | 262 (3.8%) |
| $50,000 to $74,999 | 972 (23.1%) | 757 (11.1%) |
| $75,000 to $99,999 | 618 (14.7%) | 1,309 (19.3%) |
| $100,000 to $149,999 | 486 (11.6%) | 1,328 (19.5%) |
| $150,000 or more | 423 (10.1%) | 1,683 (24.7%) |
| Total | 4,200 (100.0%) | 6,799 (100.0%) |
Property Value to Household Income Ratio in Belleville
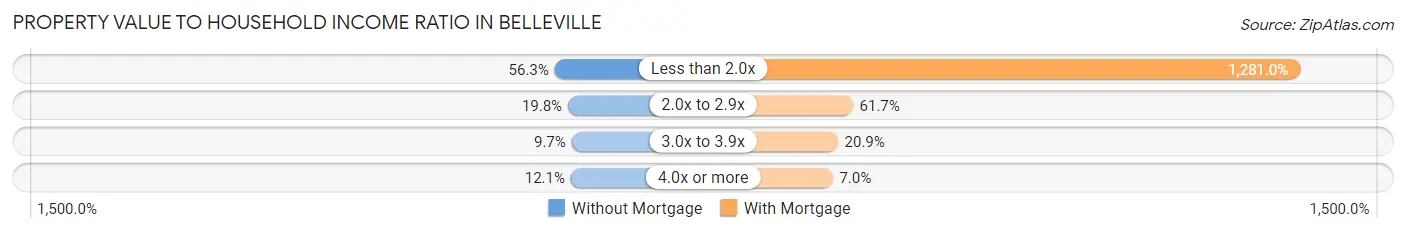
| Value-to-Income Ratio | Without Mortgage | With Mortgage |
| Less than 2.0x | 2,363 (56.3%) | 87,095 (1,281.0%) |
| 2.0x to 2.9x | 833 (19.8%) | 4,197 (61.7%) |
| 3.0x to 3.9x | 409 (9.7%) | 1,419 (20.9%) |
| 4.0x or more | 510 (12.1%) | 475 (7.0%) |
| Total | 4,200 (100.0%) | 6,799 (100.0%) |
Real Estate Taxes by Mortgage Status in Belleville
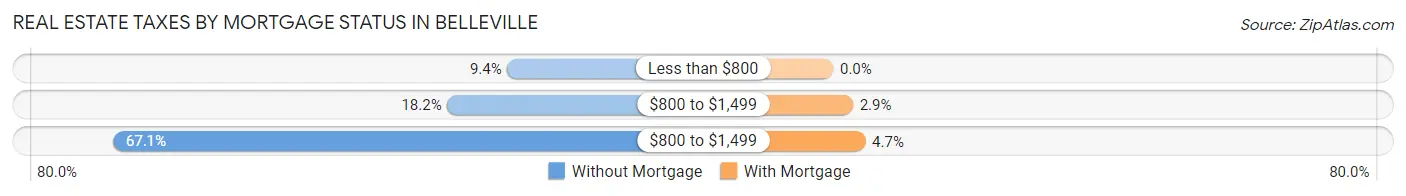
| Property Taxes | Without Mortgage | With Mortgage |
| Less than $800 | 396 (9.4%) | 0 (0.0%) |
| $800 to $1,499 | 765 (18.2%) | 195 (2.9%) |
| $800 to $1,499 | 2,818 (67.1%) | 319 (4.7%) |
| Total | 4,200 (100.0%) | 6,799 (100.0%) |
Health & Disability in Belleville
Health Insurance Coverage by Age in Belleville
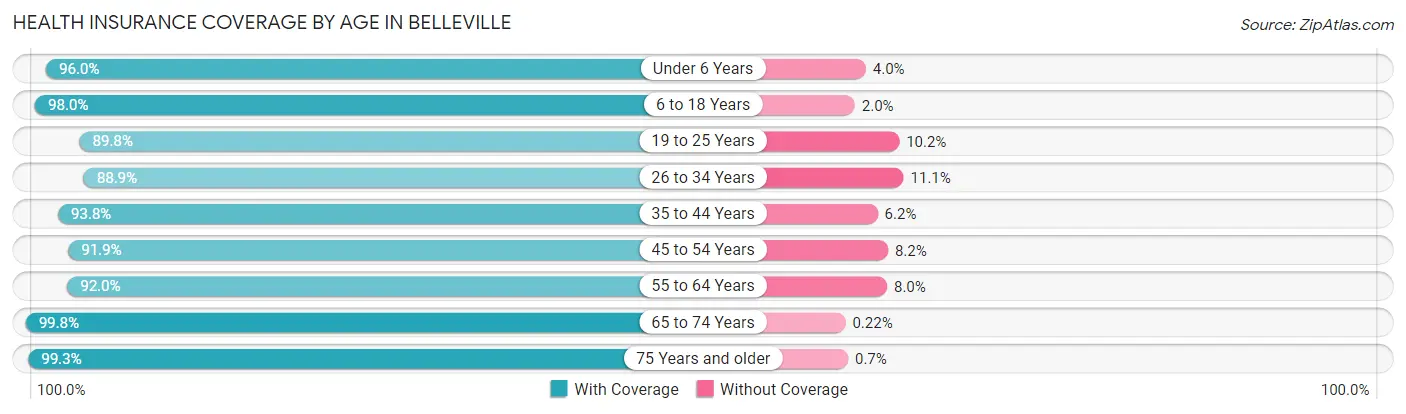
| Age Bracket | With Coverage | Without Coverage |
| Under 6 Years | 2,745 (96.0%) | 115 (4.0%) |
| 6 to 18 Years | 6,913 (98.0%) | 139 (2.0%) |
| 19 to 25 Years | 3,313 (89.8%) | 378 (10.2%) |
| 26 to 34 Years | 4,351 (88.9%) | 541 (11.1%) |
| 35 to 44 Years | 5,550 (93.8%) | 368 (6.2%) |
| 45 to 54 Years | 4,635 (91.8%) | 411 (8.2%) |
| 55 to 64 Years | 4,859 (92.0%) | 421 (8.0%) |
| 65 to 74 Years | 3,688 (99.8%) | 8 (0.2%) |
| 75 Years and older | 2,137 (99.3%) | 15 (0.7%) |
| Total | 38,191 (94.1%) | 2,396 (5.9%) |
Health Insurance Coverage by Citizenship Status in Belleville
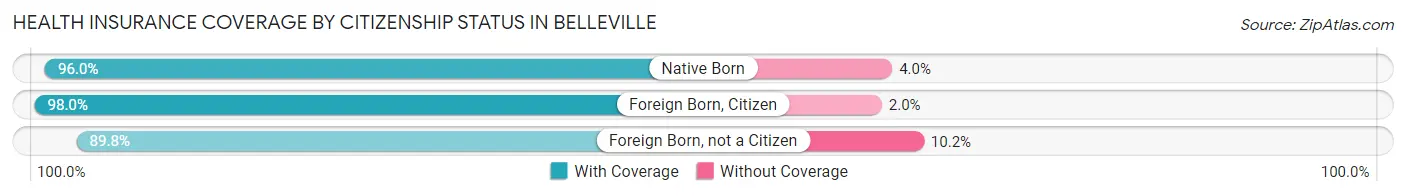
| Citizenship Status | With Coverage | Without Coverage |
| Native Born | 2,745 (96.0%) | 115 (4.0%) |
| Foreign Born, Citizen | 6,913 (98.0%) | 139 (2.0%) |
| Foreign Born, not a Citizen | 3,313 (89.8%) | 378 (10.2%) |
Health Insurance Coverage by Household Income in Belleville
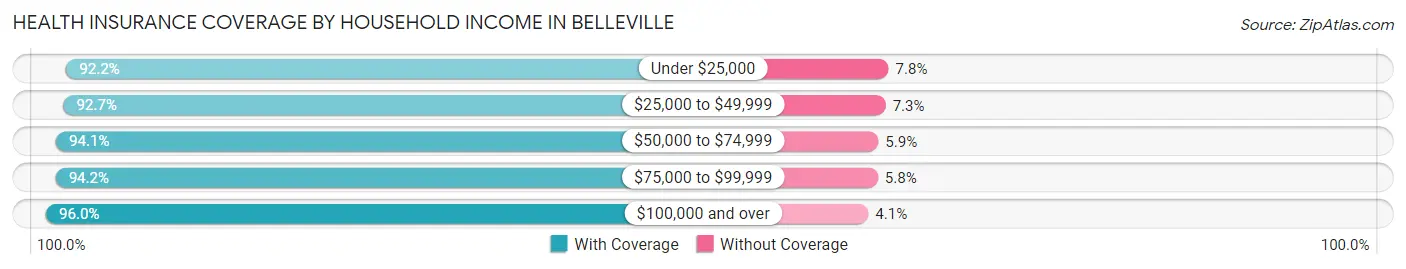
| Household Income | With Coverage | Without Coverage |
| Under $25,000 | 4,817 (92.2%) | 410 (7.8%) |
| $25,000 to $49,999 | 7,323 (92.7%) | 576 (7.3%) |
| $50,000 to $74,999 | 7,714 (94.1%) | 485 (5.9%) |
| $75,000 to $99,999 | 6,763 (94.2%) | 419 (5.8%) |
| $100,000 and over | 11,322 (96.0%) | 478 (4.1%) |
Public vs Private Health Insurance Coverage by Age in Belleville
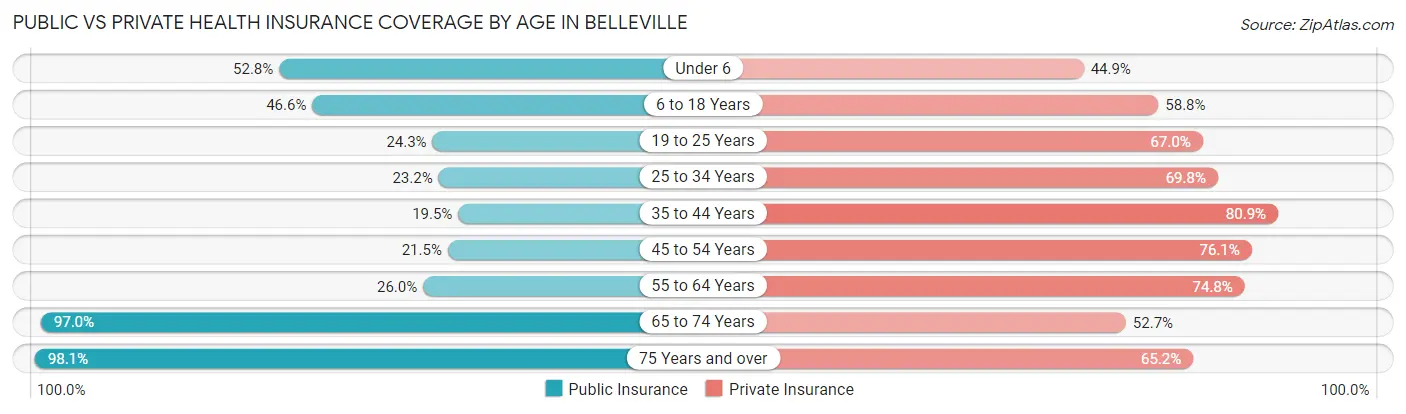
| Age Bracket | Public Insurance | Private Insurance |
| Under 6 | 1,509 (52.8%) | 1,284 (44.9%) |
| 6 to 18 Years | 3,287 (46.6%) | 4,144 (58.8%) |
| 19 to 25 Years | 897 (24.3%) | 2,472 (67.0%) |
| 25 to 34 Years | 1,134 (23.2%) | 3,413 (69.8%) |
| 35 to 44 Years | 1,155 (19.5%) | 4,790 (80.9%) |
| 45 to 54 Years | 1,083 (21.5%) | 3,838 (76.1%) |
| 55 to 64 Years | 1,375 (26.0%) | 3,948 (74.8%) |
| 65 to 74 Years | 3,584 (97.0%) | 1,949 (52.7%) |
| 75 Years and over | 2,111 (98.1%) | 1,403 (65.2%) |
| Total | 16,135 (39.8%) | 27,241 (67.1%) |
Disability Status by Sex by Age in Belleville
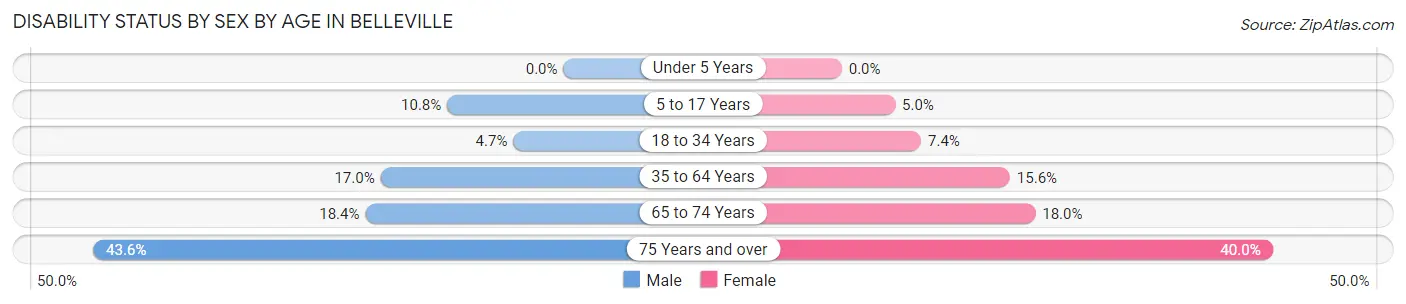
| Age Bracket | Male | Female |
| Under 5 Years | 0 (0.0%) | 0 (0.0%) |
| 5 to 17 Years | 361 (10.8%) | 190 (5.0%) |
| 18 to 34 Years | 195 (4.6%) | 344 (7.4%) |
| 35 to 64 Years | 1,324 (17.0%) | 1,317 (15.6%) |
| 65 to 74 Years | 315 (18.4%) | 356 (18.0%) |
| 75 Years and over | 343 (43.6%) | 546 (40.0%) |
Disability Class by Sex by Age in Belleville
Disability Class: Hearing Difficulty
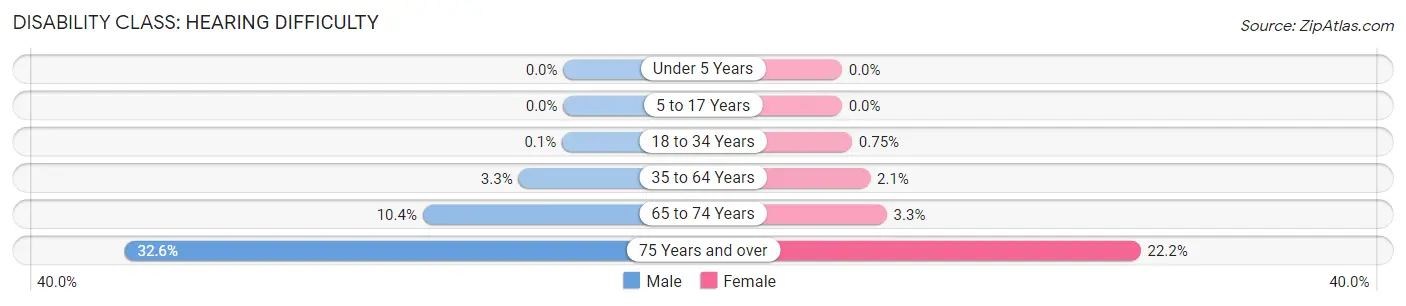
| Age Bracket | Male | Female |
| Under 5 Years | 0 (0.0%) | 0 (0.0%) |
| 5 to 17 Years | 0 (0.0%) | 0 (0.0%) |
| 18 to 34 Years | 4 (0.1%) | 35 (0.7%) |
| 35 to 64 Years | 260 (3.3%) | 177 (2.1%) |
| 65 to 74 Years | 179 (10.4%) | 66 (3.3%) |
| 75 Years and over | 256 (32.6%) | 303 (22.2%) |
Disability Class: Vision Difficulty
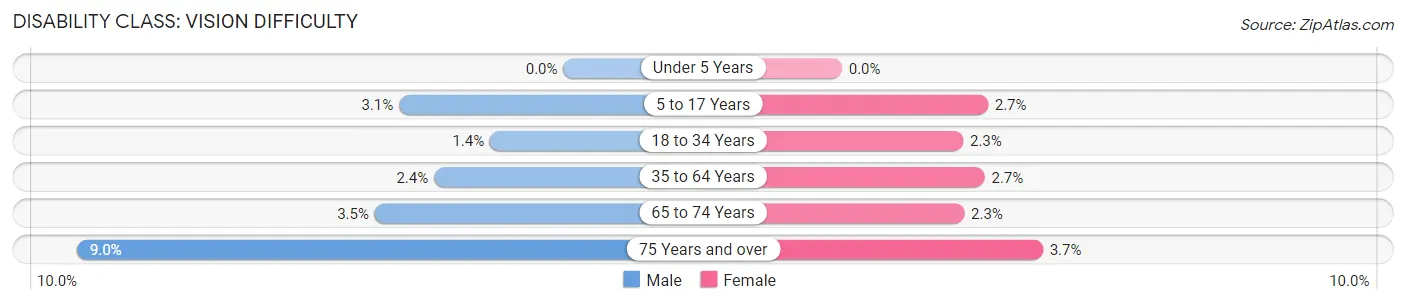
| Age Bracket | Male | Female |
| Under 5 Years | 0 (0.0%) | 0 (0.0%) |
| 5 to 17 Years | 102 (3.0%) | 104 (2.7%) |
| 18 to 34 Years | 57 (1.4%) | 105 (2.2%) |
| 35 to 64 Years | 187 (2.4%) | 224 (2.6%) |
| 65 to 74 Years | 60 (3.5%) | 45 (2.3%) |
| 75 Years and over | 71 (9.0%) | 51 (3.7%) |
Disability Class: Cognitive Difficulty
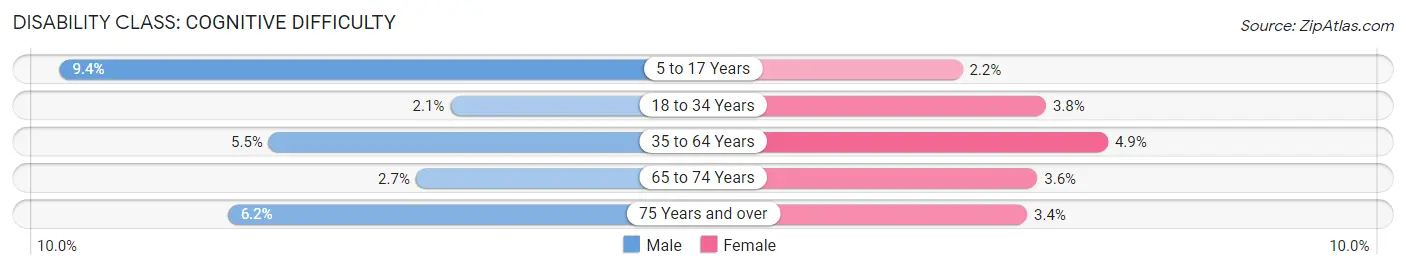
| Age Bracket | Male | Female |
| 5 to 17 Years | 313 (9.3%) | 86 (2.2%) |
| 18 to 34 Years | 88 (2.1%) | 177 (3.8%) |
| 35 to 64 Years | 427 (5.5%) | 417 (4.9%) |
| 65 to 74 Years | 47 (2.7%) | 72 (3.6%) |
| 75 Years and over | 49 (6.2%) | 47 (3.4%) |
Disability Class: Ambulatory Difficulty
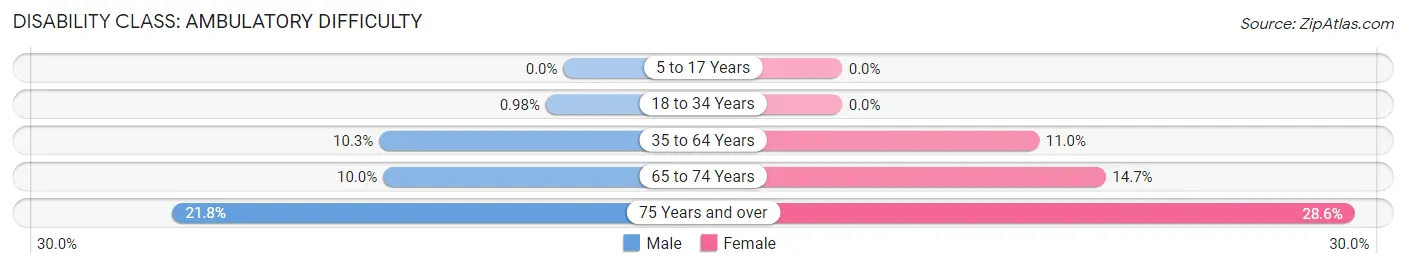
| Age Bracket | Male | Female |
| 5 to 17 Years | 0 (0.0%) | 0 (0.0%) |
| 18 to 34 Years | 41 (1.0%) | 0 (0.0%) |
| 35 to 64 Years | 801 (10.3%) | 926 (11.0%) |
| 65 to 74 Years | 172 (10.0%) | 291 (14.7%) |
| 75 Years and over | 171 (21.8%) | 390 (28.5%) |
Disability Class: Self-Care Difficulty
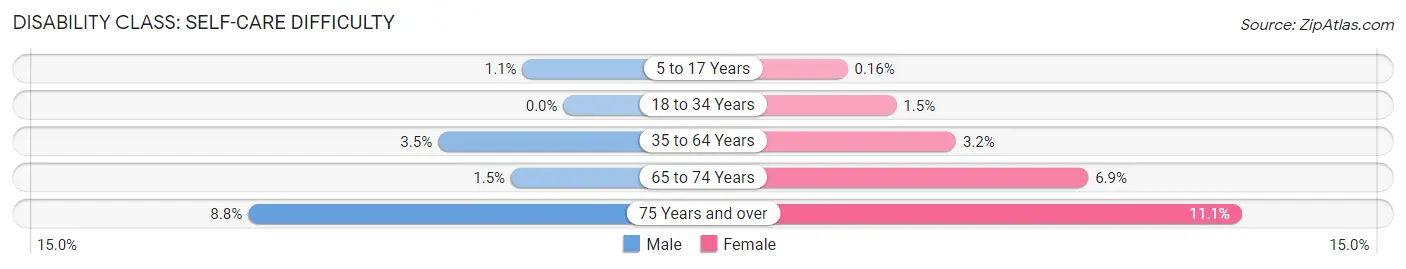
| Age Bracket | Male | Female |
| 5 to 17 Years | 38 (1.1%) | 6 (0.2%) |
| 18 to 34 Years | 0 (0.0%) | 71 (1.5%) |
| 35 to 64 Years | 272 (3.5%) | 268 (3.2%) |
| 65 to 74 Years | 25 (1.5%) | 136 (6.9%) |
| 75 Years and over | 69 (8.8%) | 152 (11.1%) |
Technology Access in Belleville
Computing Device Access in Belleville
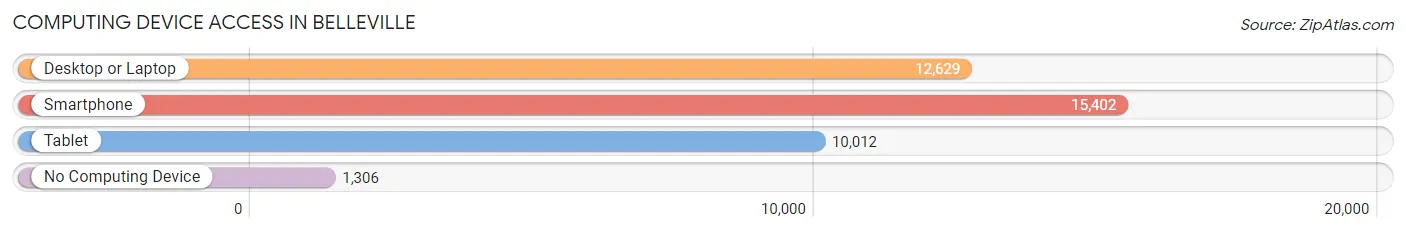
| Device Type | # Households | % Households |
| Desktop or Laptop | 12,629 | 71.8% |
| Smartphone | 15,402 | 87.5% |
| Tablet | 10,012 | 56.9% |
| No Computing Device | 1,306 | 7.4% |
| Total | 17,596 | 100.0% |
Internet Access in Belleville
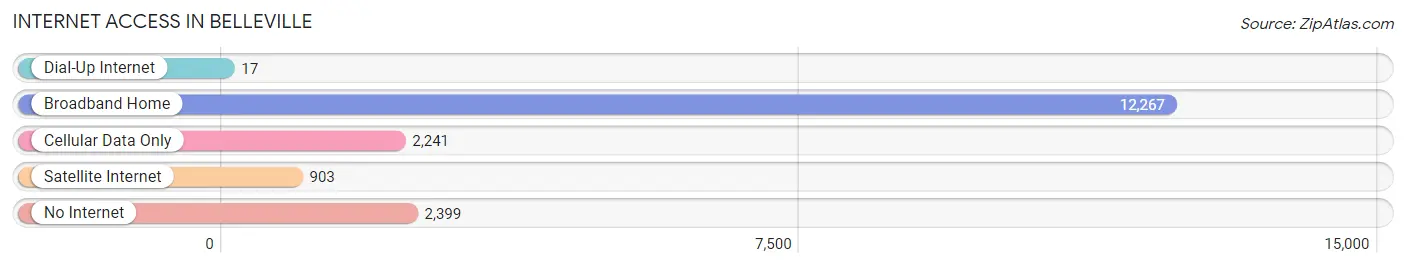
| Internet Type | # Households | % Households |
| Dial-Up Internet | 17 | 0.1% |
| Broadband Home | 12,267 | 69.7% |
| Cellular Data Only | 2,241 | 12.7% |
| Satellite Internet | 903 | 5.1% |
| No Internet | 2,399 | 13.6% |
| Total | 17,596 | 100.0% |
Belleville Summary
Belleville, Illinois is a city located in St. Clair County, Illinois, United States. It is the county seat of St. Clair County and is located approximately 25 miles east of St. Louis, Missouri. The population of Belleville was 44,478 at the 2010 census, making it the 15th largest city in the state of Illinois.
History
Belleville was founded in 1814 by George Blair, a settler from Kentucky. The city was named after the French term for “beautiful town”. The city was incorporated in 1819 and became the county seat of St. Clair County in 1821.
Belleville was a major stop on the Underground Railroad, and was home to a large number of German immigrants in the 19th century. The city was also the site of the first public library in Illinois, which opened in 1839.
In the late 19th century, Belleville was a major industrial center, with several factories producing a variety of products, including shoes, cigars, and furniture. The city was also home to a large number of breweries, including the Belleville Brewing Company, which was founded in 1867 and operated until the early 20th century.
Geography
Belleville is located in southwestern Illinois, in St. Clair County. The city is situated on the banks of the Mississippi River, and is bordered by the cities of East St. Louis and O’Fallon. The city covers an area of 16.3 square miles, with a population density of 2,717 people per square mile.
The city is located in the humid continental climate zone, with hot, humid summers and cold, snowy winters. The average temperature in July is 81°F, and the average temperature in January is 24°F. The average annual precipitation is 40.3 inches.
Economy
Belleville’s economy is largely based on manufacturing and healthcare. The city is home to several major employers, including Scott Air Force Base, St. Elizabeth’s Hospital, and the Belleville News-Democrat.
The city is also home to a number of smaller businesses, including restaurants, retail stores, and service providers. The city’s largest employers are Scott Air Force Base, St. Elizabeth’s Hospital, and the Belleville News-Democrat.
Demographics
As of the 2010 census, the population of Belleville was 44,478, with a population density of 2,717 people per square mile. The racial makeup of the city was 79.2% White, 15.3% African American, 0.4% Native American, 1.2% Asian, 0.1% Pacific Islander, 1.7% from other races, and 2.1% from two or more races. Hispanic or Latino of any race were 4.2% of the population.
The median income for a household in the city was $41,902, and the median income for a family was $50,919. The per capita income for the city was $21,845. About 11.2% of families and 14.2% of the population were below the poverty line, including 19.2% of those under age 18 and 8.2% of those age 65 or over.
Belleville is a diverse city, with a mix of cultures and backgrounds. The city is home to a large number of German immigrants, as well as a growing Hispanic population. The city is also home to a large number of military personnel, due to its proximity to Scott Air Force Base.
Common Questions
What is Per Capita Income in Belleville?
Per Capita income in Belleville is $31,798.
What is the Median Family Income in Belleville?
Median Family Income in Belleville is $77,904.
What is the Median Household income in Belleville?
Median Household Income in Belleville is $60,573.
What is Income or Wage Gap in Belleville?
Income or Wage Gap in Belleville is 20.2%.
Women in Belleville earn 79.8 cents for every dollar earned by a man.
What is Family Income Deficit in Belleville?
Family Income Deficit in Belleville is $10,237.
Families that are below poverty line in Belleville earn $10,237 less on average than the poverty threshold level.
What is Inequality or Gini Index in Belleville?
Inequality or Gini Index in Belleville is 0.43.
What is the Total Population of Belleville?
Total Population of Belleville is 42,155.
What is the Total Male Population of Belleville?
Total Male Population of Belleville is 19,919.
What is the Total Female Population of Belleville?
Total Female Population of Belleville is 22,236.
What is the Ratio of Males per 100 Females in Belleville?
There are 89.58 Males per 100 Females in Belleville.
What is the Ratio of Females per 100 Males in Belleville?
There are 111.63 Females per 100 Males in Belleville.
What is the Median Population Age in Belleville?
Median Population Age in Belleville is 38.4 Years.
What is the Average Family Size in Belleville
Average Family Size in Belleville is 3.1 People.
What is the Average Household Size in Belleville
Average Household Size in Belleville is 2.3 People.
How Large is the Labor Force in Belleville?
There are 22,216 People in the Labor Forcein in Belleville.
What is the Percentage of People in the Labor Force in Belleville?
66.0% of People are in the Labor Force in Belleville.
What is the Unemployment Rate in Belleville?
Unemployment Rate in Belleville is 6.0%.