Rochelle, IL Map & Demographics
Rochelle Map
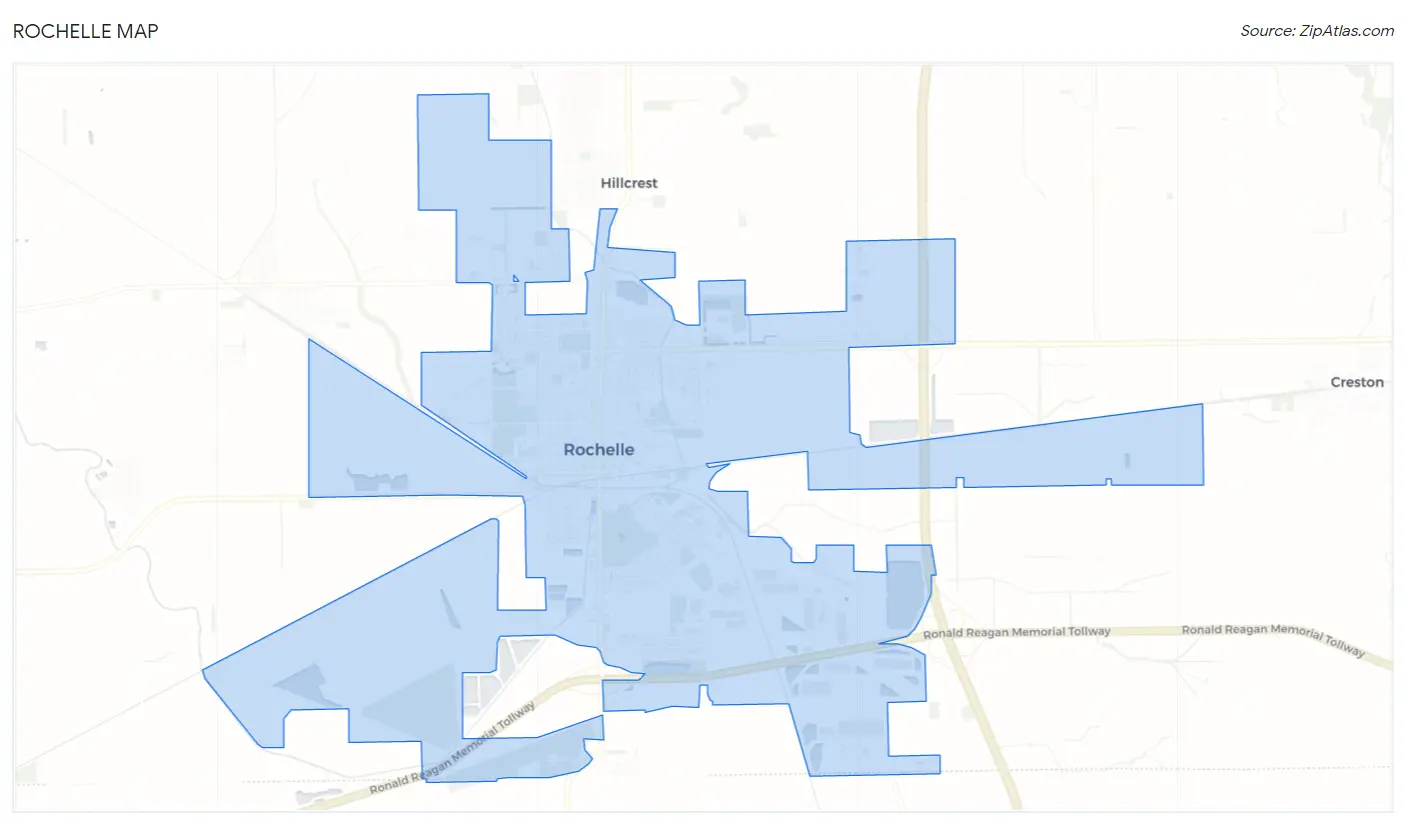
Rochelle Overview
$30,949
PER CAPITA INCOME
$76,924
AVG FAMILY INCOME
$55,974
AVG HOUSEHOLD INCOME
42.0%
WAGE / INCOME GAP [ % ]
58.0¢/ $1
WAGE / INCOME GAP [ $ ]
0.42
INEQUALITY / GINI INDEX
9,417
TOTAL POPULATION
4,651
MALE POPULATION
4,766
FEMALE POPULATION
97.59
MALES / 100 FEMALES
102.47
FEMALES / 100 MALES
37.9
MEDIAN AGE
3.2
AVG FAMILY SIZE
2.4
AVG HOUSEHOLD SIZE
5,285
LABOR FORCE [ PEOPLE ]
68.0%
PERCENT IN LABOR FORCE
10.9%
UNEMPLOYMENT RATE
Rochelle Zip Codes
Rochelle Area Codes
Income in Rochelle
Income Overview in Rochelle
Per Capita Income in Rochelle is $30,949, while median incomes of families and households are $76,924 and $55,974 respectively.
| Characteristic | Number | Measure |
| Per Capita Income | 9,417 | $30,949 |
| Median Family Income | 2,123 | $76,924 |
| Mean Family Income | 2,123 | $88,237 |
| Median Household Income | 3,955 | $55,974 |
| Mean Household Income | 3,955 | $71,378 |
| Income Deficit | 2,123 | $0 |
| Wage / Income Gap (%) | 9,417 | 42.01% |
| Wage / Income Gap ($) | 9,417 | 57.99¢ per $1 |
| Gini / Inequality Index | 9,417 | 0.42 |
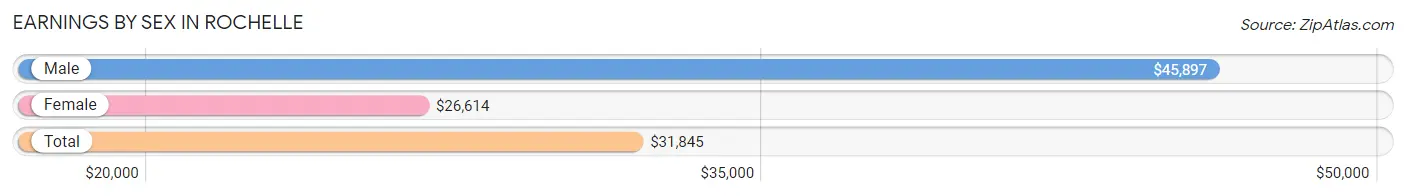
Earnings by Sex in Rochelle
Average Earnings in Rochelle are $31,845, $45,897 for men and $26,614 for women, a difference of 42.0%.
| Sex | Number | Average Earnings |
| Male | 2,593 (48.8%) | $45,897 |
| Female | 2,724 (51.2%) | $26,614 |
| Total | 5,317 (100.0%) | $31,845 |
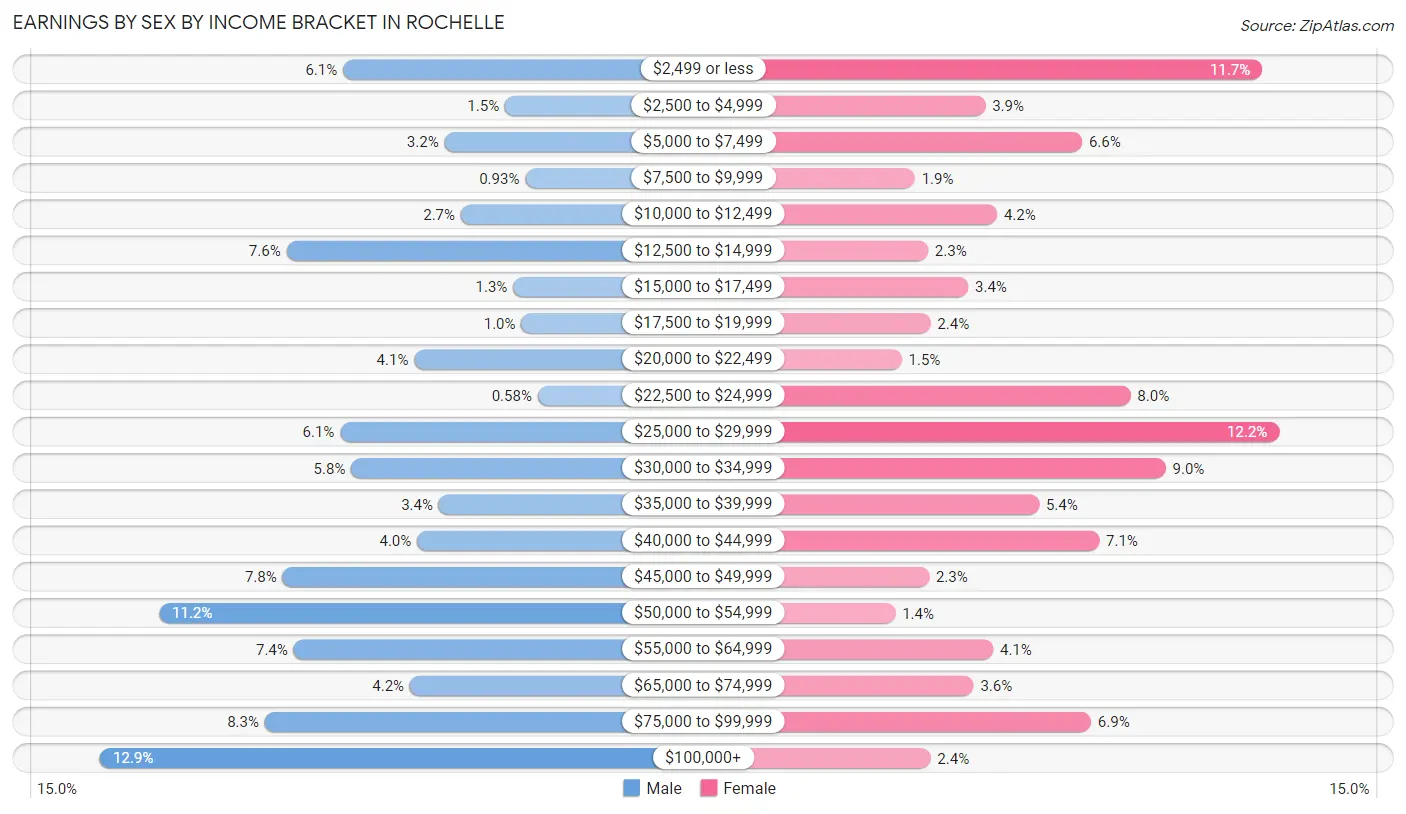
Earnings by Sex by Income Bracket in Rochelle
The most common earnings brackets in Rochelle are $100,000+ for men (334 | 12.9%) and $25,000 to $29,999 for women (331 | 12.1%).
| Income | Male | Female |
| $2,499 or less | 157 (6.0%) | 318 (11.7%) |
| $2,500 to $4,999 | 39 (1.5%) | 106 (3.9%) |
| $5,000 to $7,499 | 83 (3.2%) | 180 (6.6%) |
| $7,500 to $9,999 | 24 (0.9%) | 52 (1.9%) |
| $10,000 to $12,499 | 71 (2.7%) | 115 (4.2%) |
| $12,500 to $14,999 | 198 (7.6%) | 62 (2.3%) |
| $15,000 to $17,499 | 33 (1.3%) | 93 (3.4%) |
| $17,500 to $19,999 | 27 (1.0%) | 64 (2.4%) |
| $20,000 to $22,499 | 105 (4.1%) | 42 (1.5%) |
| $22,500 to $24,999 | 15 (0.6%) | 217 (8.0%) |
| $25,000 to $29,999 | 159 (6.1%) | 331 (12.1%) |
| $30,000 to $34,999 | 151 (5.8%) | 244 (9.0%) |
| $35,000 to $39,999 | 87 (3.4%) | 147 (5.4%) |
| $40,000 to $44,999 | 103 (4.0%) | 193 (7.1%) |
| $45,000 to $49,999 | 201 (7.7%) | 63 (2.3%) |
| $50,000 to $54,999 | 291 (11.2%) | 37 (1.4%) |
| $55,000 to $64,999 | 193 (7.4%) | 112 (4.1%) |
| $65,000 to $74,999 | 108 (4.2%) | 97 (3.6%) |
| $75,000 to $99,999 | 214 (8.3%) | 187 (6.9%) |
| $100,000+ | 334 (12.9%) | 64 (2.4%) |
| Total | 2,593 (100.0%) | 2,724 (100.0%) |
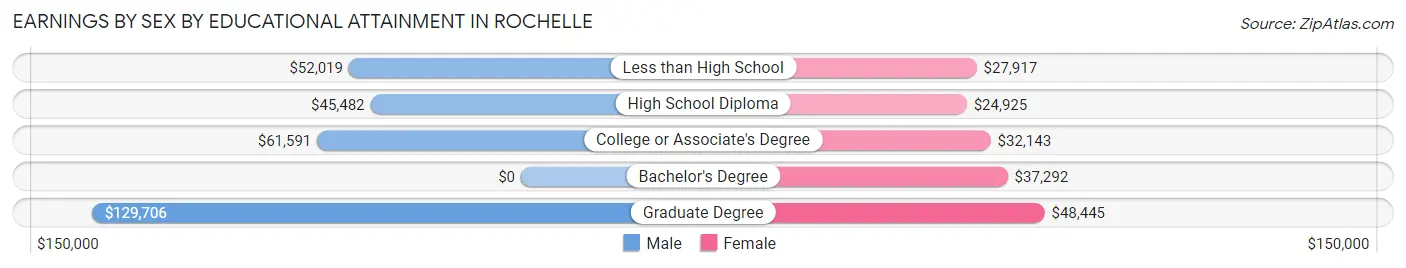
Earnings by Sex by Educational Attainment in Rochelle
Average earnings in Rochelle are $50,573 for men and $31,502 for women, a difference of 37.7%. Men with an educational attainment of graduate degree enjoy the highest average annual earnings of $129,706, while those with high school diploma education earn the least with $45,482. Women with an educational attainment of graduate degree earn the most with the average annual earnings of $48,445, while those with high school diploma education have the smallest earnings of $24,925.
| Educational Attainment | Male Income | Female Income |
| Less than High School | $52,019 | $27,917 |
| High School Diploma | $45,482 | $24,925 |
| College or Associate's Degree | $61,591 | $32,143 |
| Bachelor's Degree | - | - |
| Graduate Degree | $129,706 | $48,445 |
| Total | $50,573 | $31,502 |
Family Income in Rochelle
Family Income Brackets in Rochelle
According to the Rochelle family income data, there are 518 families falling into the $75,000 to $99,999 income range, which is the most common income bracket and makes up 24.4% of all families. Conversely, the $10,000 to $14,999 income bracket is the least frequent group with only 23 families (1.1%) belonging to this category.
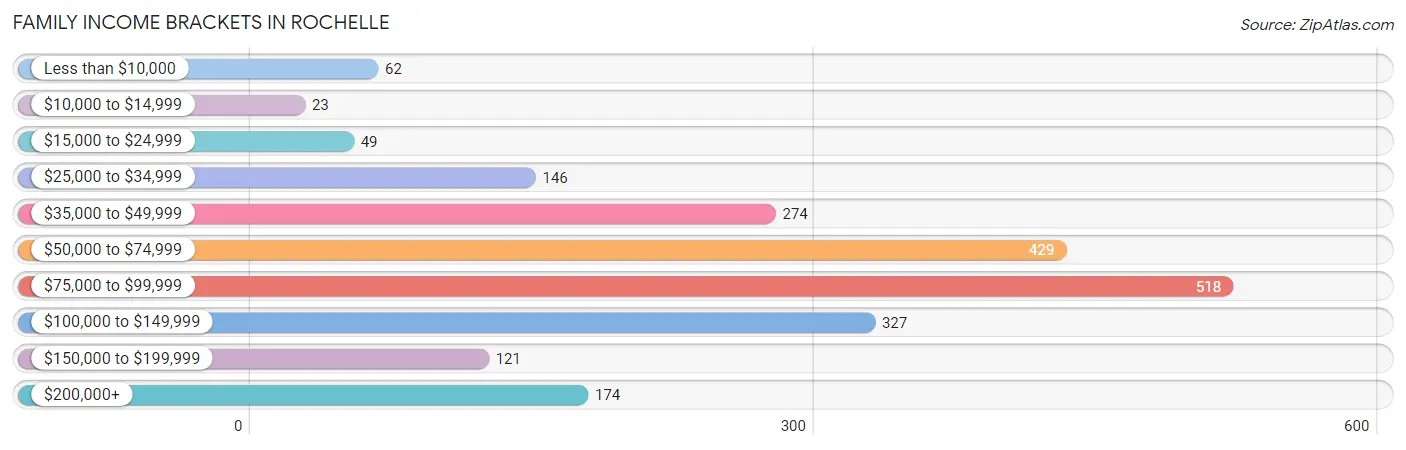
| Income Bracket | # Families | % Families |
| Less than $10,000 | 62 | 2.9% |
| $10,000 to $14,999 | 23 | 1.1% |
| $15,000 to $24,999 | 49 | 2.3% |
| $25,000 to $34,999 | 146 | 6.9% |
| $35,000 to $49,999 | 274 | 12.9% |
| $50,000 to $74,999 | 429 | 20.2% |
| $75,000 to $99,999 | 518 | 24.4% |
| $100,000 to $149,999 | 327 | 15.4% |
| $150,000 to $199,999 | 121 | 5.7% |
| $200,000+ | 174 | 8.2% |
Family Income by Famaliy Size in Rochelle
5-person families (384 | 18.1%) account for the highest median family income in Rochelle with $88,941 per family, while 2-person families (1,039 | 48.9%) have the highest median income of $37,375 per family member.
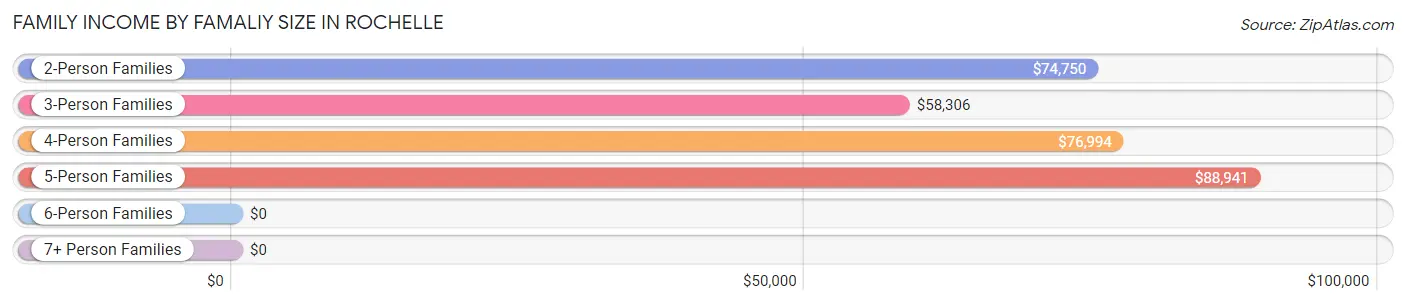
| Income Bracket | # Families | Median Income |
| 2-Person Families | 1,039 (48.9%) | $74,750 |
| 3-Person Families | 399 (18.8%) | $58,306 |
| 4-Person Families | 229 (10.8%) | $76,994 |
| 5-Person Families | 384 (18.1%) | $88,941 |
| 6-Person Families | 67 (3.2%) | $0 |
| 7+ Person Families | 5 (0.2%) | $0 |
| Total | 2,123 (100.0%) | $76,924 |
Family Income by Number of Earners in Rochelle
The median family income in Rochelle is $76,924, with families comprising 3+ earners (403) having the highest median family income of $91,122, while families with no earners (273) have the lowest median family income of $40,250, accounting for 19.0% and 12.9% of families, respectively.
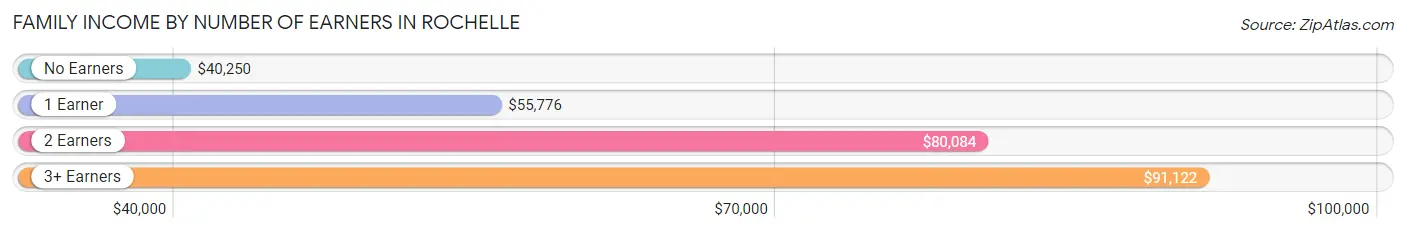
| Number of Earners | # Families | Median Income |
| No Earners | 273 (12.9%) | $40,250 |
| 1 Earner | 536 (25.3%) | $55,776 |
| 2 Earners | 911 (42.9%) | $80,084 |
| 3+ Earners | 403 (19.0%) | $91,122 |
| Total | 2,123 (100.0%) | $76,924 |
Household Income in Rochelle
Household Income Brackets in Rochelle
With 744 households falling in the category, the $100,000 to $149,999 income range is the most frequent in Rochelle, accounting for 18.8% of all households. In contrast, only 142 households (3.6%) fall into the $150,000 to $199,999 income bracket, making it the least populous group.
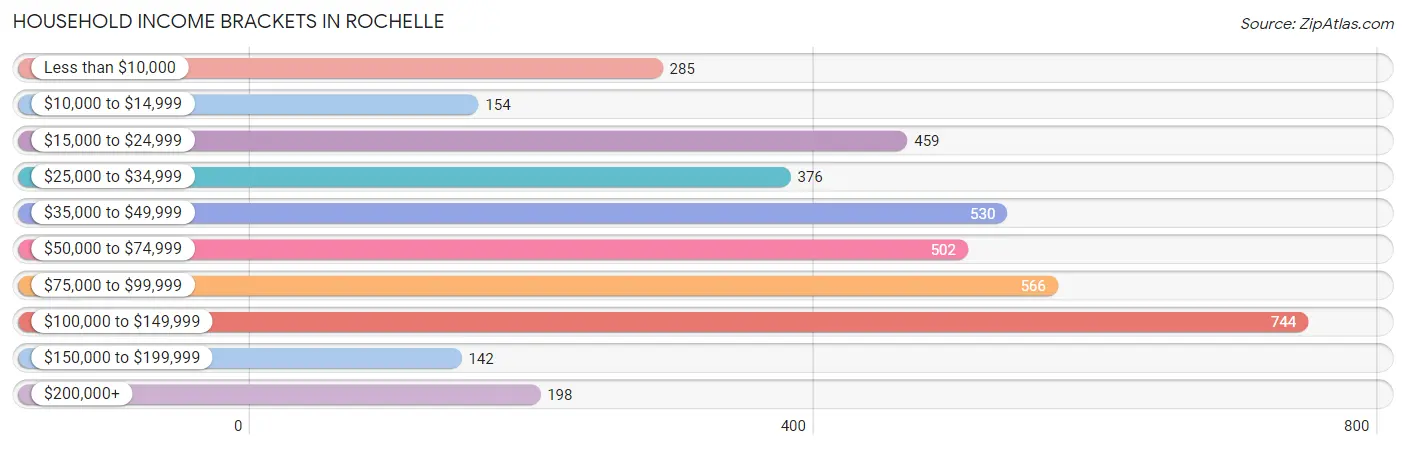
| Income Bracket | # Households | % Households |
| Less than $10,000 | 285 | 7.2% |
| $10,000 to $14,999 | 154 | 3.9% |
| $15,000 to $24,999 | 459 | 11.6% |
| $25,000 to $34,999 | 376 | 9.5% |
| $35,000 to $49,999 | 530 | 13.4% |
| $50,000 to $74,999 | 502 | 12.7% |
| $75,000 to $99,999 | 566 | 14.3% |
| $100,000 to $149,999 | 744 | 18.8% |
| $150,000 to $199,999 | 142 | 3.6% |
| $200,000+ | 198 | 5.0% |
Household Income by Householder Age in Rochelle
The median household income in Rochelle is $55,974, with the highest median household income of $75,238 found in the 25 to 44 years age bracket for the primary householder. A total of 890 households (22.5%) fall into this category. Meanwhile, the 65+ years age bracket for the primary householder has the lowest median household income of $33,327, with 1,111 households (28.1%) in this group.
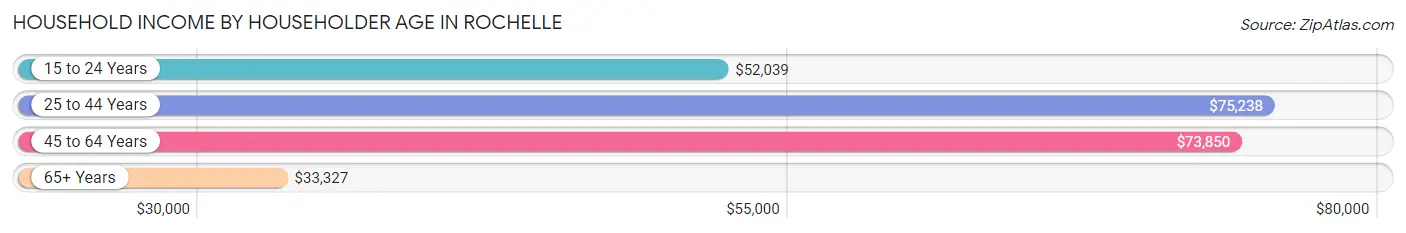
| Income Bracket | # Households | Median Income |
| 15 to 24 Years | 219 (5.5%) | $52,039 |
| 25 to 44 Years | 890 (22.5%) | $75,238 |
| 45 to 64 Years | 1,735 (43.9%) | $73,850 |
| 65+ Years | 1,111 (28.1%) | $33,327 |
| Total | 3,955 (100.0%) | $55,974 |
Poverty in Rochelle
Income Below Poverty by Sex and Age in Rochelle
With 9.0% poverty level for males and 11.4% for females among the residents of Rochelle, 5 year old males and 5 year old females are the most vulnerable to poverty, with 41 males (58.6%) and 18 females (58.1%) in their respective age groups living below the poverty level.
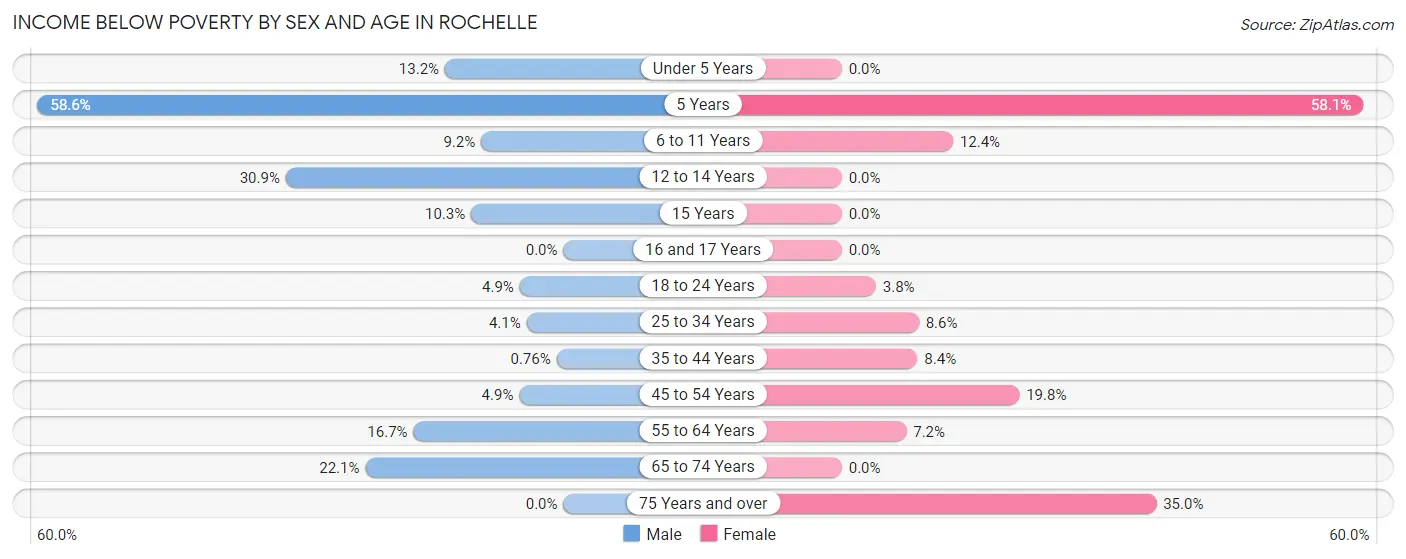
| Age Bracket | Male | Female |
| Under 5 Years | 36 (13.2%) | 0 (0.0%) |
| 5 Years | 41 (58.6%) | 18 (58.1%) |
| 6 to 11 Years | 21 (9.2%) | 52 (12.4%) |
| 12 to 14 Years | 47 (30.9%) | 0 (0.0%) |
| 15 Years | 22 (10.3%) | 0 (0.0%) |
| 16 and 17 Years | 0 (0.0%) | 0 (0.0%) |
| 18 to 24 Years | 32 (4.9%) | 29 (3.8%) |
| 25 to 34 Years | 24 (4.1%) | 40 (8.6%) |
| 35 to 44 Years | 4 (0.8%) | 46 (8.4%) |
| 45 to 54 Years | 32 (4.9%) | 99 (19.8%) |
| 55 to 64 Years | 83 (16.7%) | 53 (7.2%) |
| 65 to 74 Years | 75 (22.1%) | 0 (0.0%) |
| 75 Years and over | 0 (0.0%) | 201 (35.0%) |
| Total | 417 (9.0%) | 538 (11.4%) |
Income Above Poverty by Sex and Age in Rochelle
According to the poverty statistics in Rochelle, males aged 16 and 17 years and females aged under 5 years are the age groups that are most secure financially, with 100.0% of males and 100.0% of females in these age groups living above the poverty line.
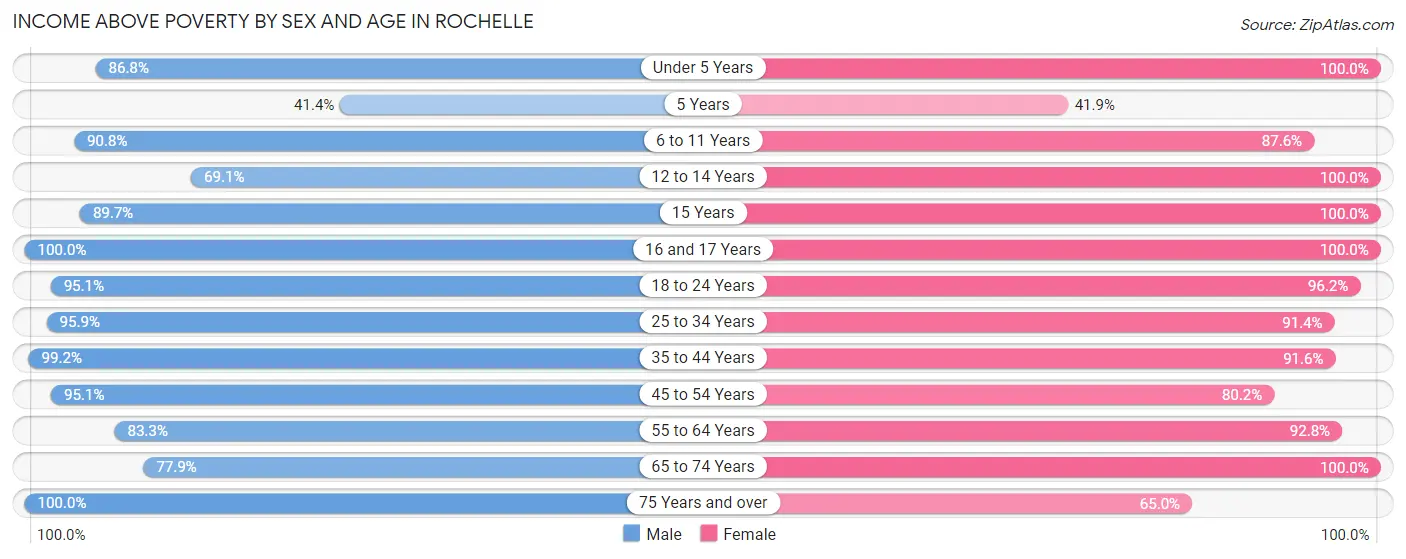
| Age Bracket | Male | Female |
| Under 5 Years | 237 (86.8%) | 140 (100.0%) |
| 5 Years | 29 (41.4%) | 13 (41.9%) |
| 6 to 11 Years | 208 (90.8%) | 368 (87.6%) |
| 12 to 14 Years | 105 (69.1%) | 98 (100.0%) |
| 15 Years | 192 (89.7%) | 18 (100.0%) |
| 16 and 17 Years | 160 (100.0%) | 112 (100.0%) |
| 18 to 24 Years | 627 (95.1%) | 737 (96.2%) |
| 25 to 34 Years | 562 (95.9%) | 427 (91.4%) |
| 35 to 44 Years | 520 (99.2%) | 500 (91.6%) |
| 45 to 54 Years | 620 (95.1%) | 402 (80.2%) |
| 55 to 64 Years | 414 (83.3%) | 685 (92.8%) |
| 65 to 74 Years | 265 (77.9%) | 292 (100.0%) |
| 75 Years and over | 258 (100.0%) | 373 (65.0%) |
| Total | 4,197 (91.0%) | 4,165 (88.6%) |
Income Below Poverty Among Married-Couple Families in Rochelle
The poverty statistics for married-couple families in Rochelle show that 0.9% or 12 of the total 1,277 families live below the poverty line. Families with 1 or 2 children have the highest poverty rate of 1.3%, comprising of 4 families. On the other hand, families with 3 or 4 children have the lowest poverty rate of 0.0%, which includes 0 families.
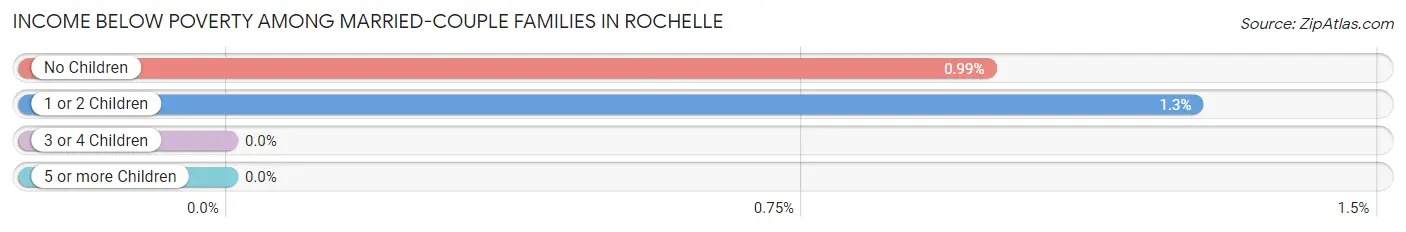
| Children | Above Poverty | Below Poverty |
| No Children | 797 (99.0%) | 8 (1.0%) |
| 1 or 2 Children | 314 (98.7%) | 4 (1.3%) |
| 3 or 4 Children | 149 (100.0%) | 0 (0.0%) |
| 5 or more Children | 5 (100.0%) | 0 (0.0%) |
| Total | 1,265 (99.1%) | 12 (0.9%) |
Income Below Poverty Among Single-Parent Households in Rochelle
According to the poverty data in Rochelle, 1.2% or 4 single-father households and 20.8% or 108 single-mother households are living below the poverty line. Among single-father households, those with no children have the highest poverty rate, with 4 households (2.2%) experiencing poverty. Likewise, among single-mother households, those with 3 or 4 children have the highest poverty rate, with 19 households (42.2%) falling below the poverty line.
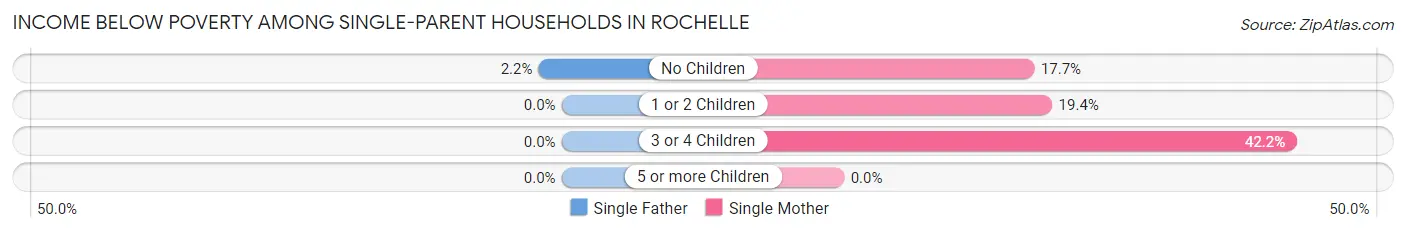
| Children | Single Father | Single Mother |
| No Children | 4 (2.2%) | 28 (17.7%) |
| 1 or 2 Children | 0 (0.0%) | 61 (19.4%) |
| 3 or 4 Children | 0 (0.0%) | 19 (42.2%) |
| 5 or more Children | 0 (0.0%) | 0 (0.0%) |
| Total | 4 (1.2%) | 108 (20.8%) |
Income Below Poverty Among Married-Couple vs Single-Parent Households in Rochelle
The poverty data for Rochelle shows that 12 of the married-couple family households (0.9%) and 112 of the single-parent households (13.2%) are living below the poverty level. Within the married-couple family households, those with 1 or 2 children have the highest poverty rate, with 4 households (1.3%) falling below the poverty line. Among the single-parent households, those with 3 or 4 children have the highest poverty rate, with 19 household (42.2%) living below poverty.
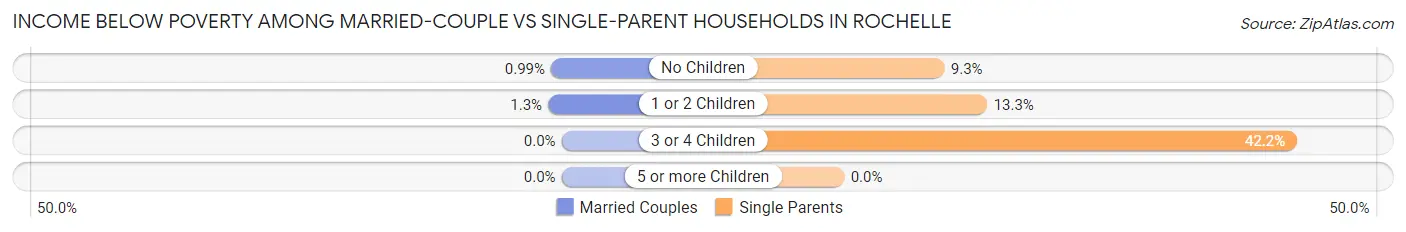
| Children | Married-Couple Families | Single-Parent Households |
| No Children | 8 (1.0%) | 32 (9.3%) |
| 1 or 2 Children | 4 (1.3%) | 61 (13.3%) |
| 3 or 4 Children | 0 (0.0%) | 19 (42.2%) |
| 5 or more Children | 0 (0.0%) | 0 (0.0%) |
| Total | 12 (0.9%) | 112 (13.2%) |
Race in Rochelle
The most populous races in Rochelle are White / Caucasian (7,630 | 81.0%), Hispanic or Latino (2,244 | 23.8%), and Two or more Races (1,260 | 13.4%).
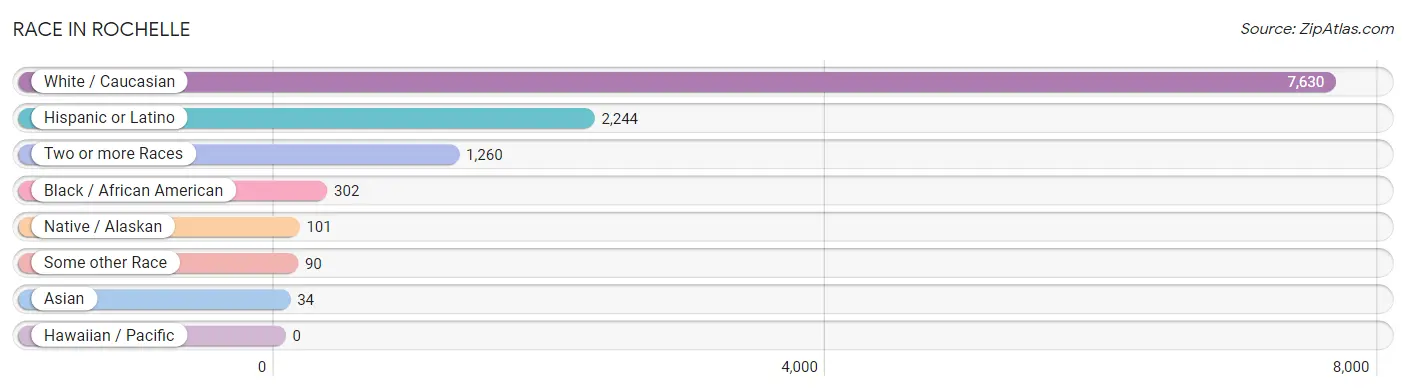
| Race | # Population | % Population |
| Asian | 34 | 0.4% |
| Black / African American | 302 | 3.2% |
| Hawaiian / Pacific | 0 | 0.0% |
| Hispanic or Latino | 2,244 | 23.8% |
| Native / Alaskan | 101 | 1.1% |
| White / Caucasian | 7,630 | 81.0% |
| Two or more Races | 1,260 | 13.4% |
| Some other Race | 90 | 1.0% |
| Total | 9,417 | 100.0% |
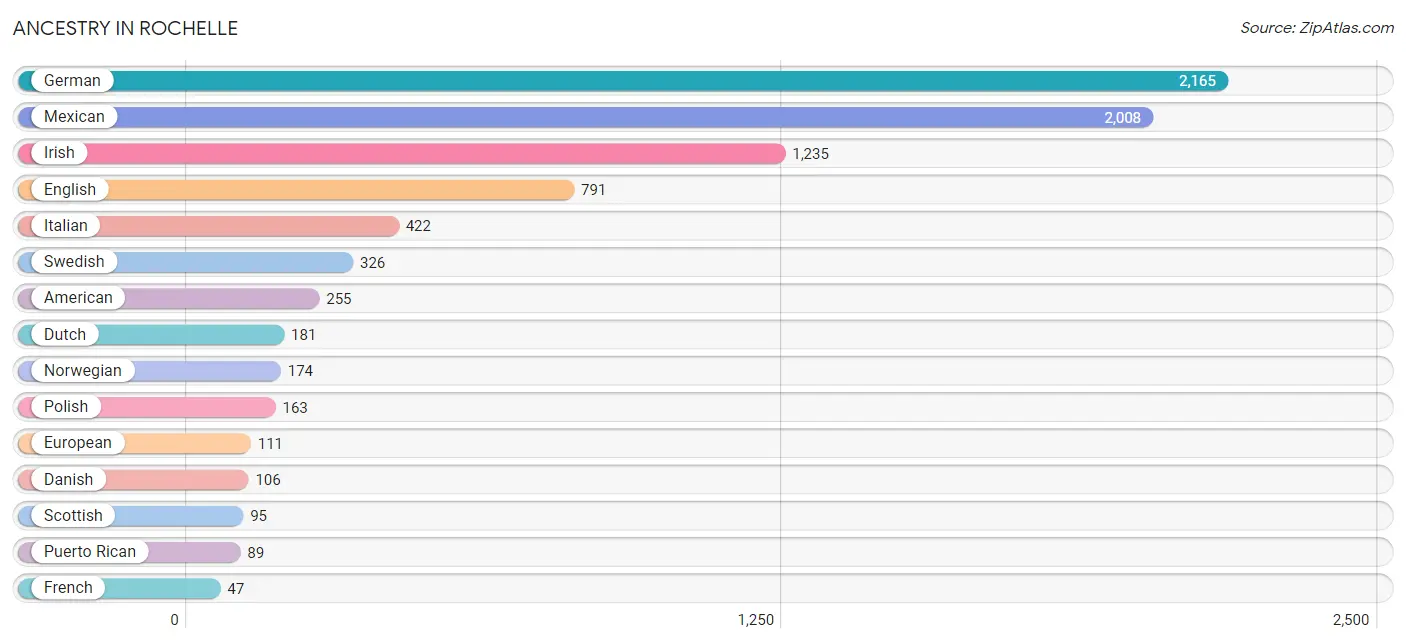
Ancestry in Rochelle
The most populous ancestries reported in Rochelle are German (2,165 | 23.0%), Mexican (2,008 | 21.3%), Irish (1,235 | 13.1%), English (791 | 8.4%), and Italian (422 | 4.5%), together accounting for 70.3% of all Rochelle residents.
| Ancestry | # Population | % Population |
| American | 255 | 2.7% |
| Austrian | 7 | 0.1% |
| Belgian | 18 | 0.2% |
| Bhutanese | 14 | 0.2% |
| Blackfeet | 35 | 0.4% |
| Brazilian | 6 | 0.1% |
| Burmese | 8 | 0.1% |
| Celtic | 22 | 0.2% |
| Central American | 29 | 0.3% |
| Central American Indian | 10 | 0.1% |
| Chippewa | 7 | 0.1% |
| Crow | 35 | 0.4% |
| Cuban | 10 | 0.1% |
| Czech | 2 | 0.0% |
| Danish | 106 | 1.1% |
| Dutch | 181 | 1.9% |
| English | 791 | 8.4% |
| European | 111 | 1.2% |
| French | 47 | 0.5% |
| German | 2,165 | 23.0% |
| Greek | 32 | 0.3% |
| Guatemalan | 29 | 0.3% |
| Hungarian | 8 | 0.1% |
| Irish | 1,235 | 13.1% |
| Iroquois | 1 | 0.0% |
| Italian | 422 | 4.5% |
| Korean | 29 | 0.3% |
| Lithuanian | 37 | 0.4% |
| Mexican | 2,008 | 21.3% |
| Northern European | 7 | 0.1% |
| Norwegian | 174 | 1.8% |
| Polish | 163 | 1.7% |
| Potawatomi | 12 | 0.1% |
| Puerto Rican | 89 | 0.9% |
| Scandinavian | 21 | 0.2% |
| Scotch-Irish | 10 | 0.1% |
| Scottish | 95 | 1.0% |
| Spanish | 42 | 0.4% |
| Swedish | 326 | 3.5% |
| Swiss | 9 | 0.1% |
| Welsh | 31 | 0.3% | View All 41 Rows |
Immigrants in Rochelle
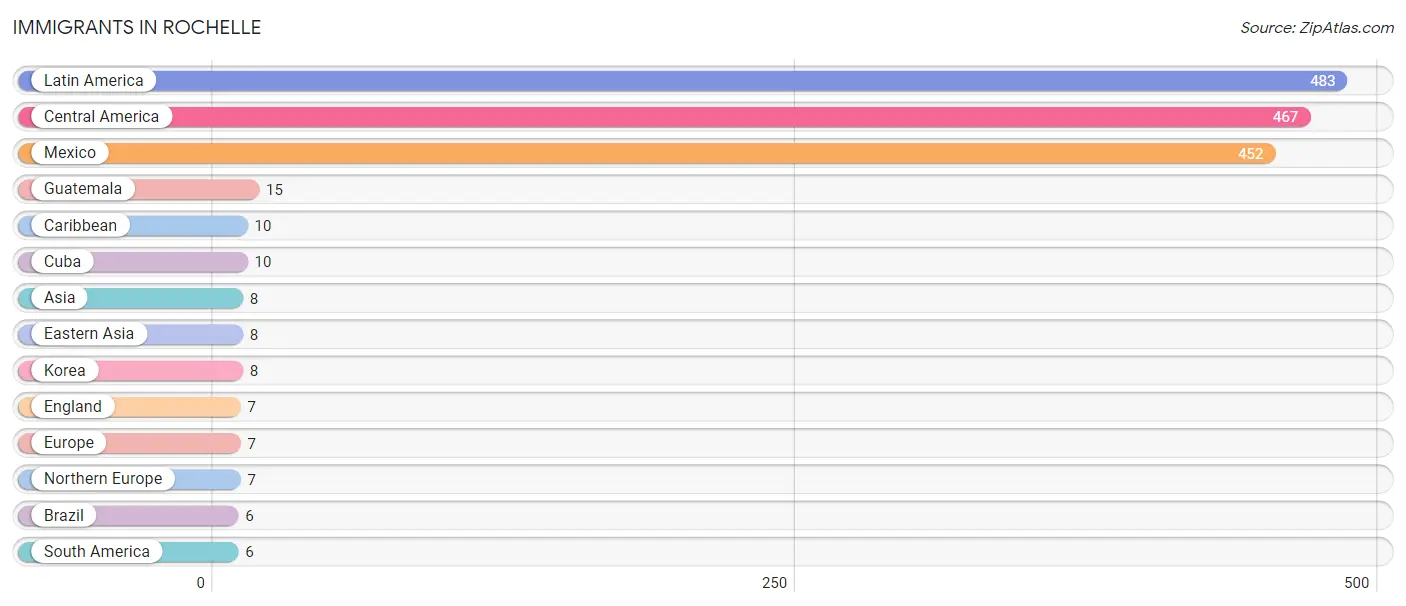
The most numerous immigrant groups reported in Rochelle came from Latin America (483 | 5.1%), Central America (467 | 5.0%), Mexico (452 | 4.8%), Guatemala (15 | 0.2%), and Caribbean (10 | 0.1%), together accounting for 15.2% of all Rochelle residents.
| Immigration Origin | # Population | % Population |
| Asia | 8 | 0.1% |
| Brazil | 6 | 0.1% |
| Caribbean | 10 | 0.1% |
| Central America | 467 | 5.0% |
| Cuba | 10 | 0.1% |
| Eastern Asia | 8 | 0.1% |
| England | 7 | 0.1% |
| Europe | 7 | 0.1% |
| Guatemala | 15 | 0.2% |
| Korea | 8 | 0.1% |
| Latin America | 483 | 5.1% |
| Mexico | 452 | 4.8% |
| Northern Europe | 7 | 0.1% |
| South America | 6 | 0.1% | View All 14 Rows |
Sex and Age in Rochelle
Sex and Age in Rochelle
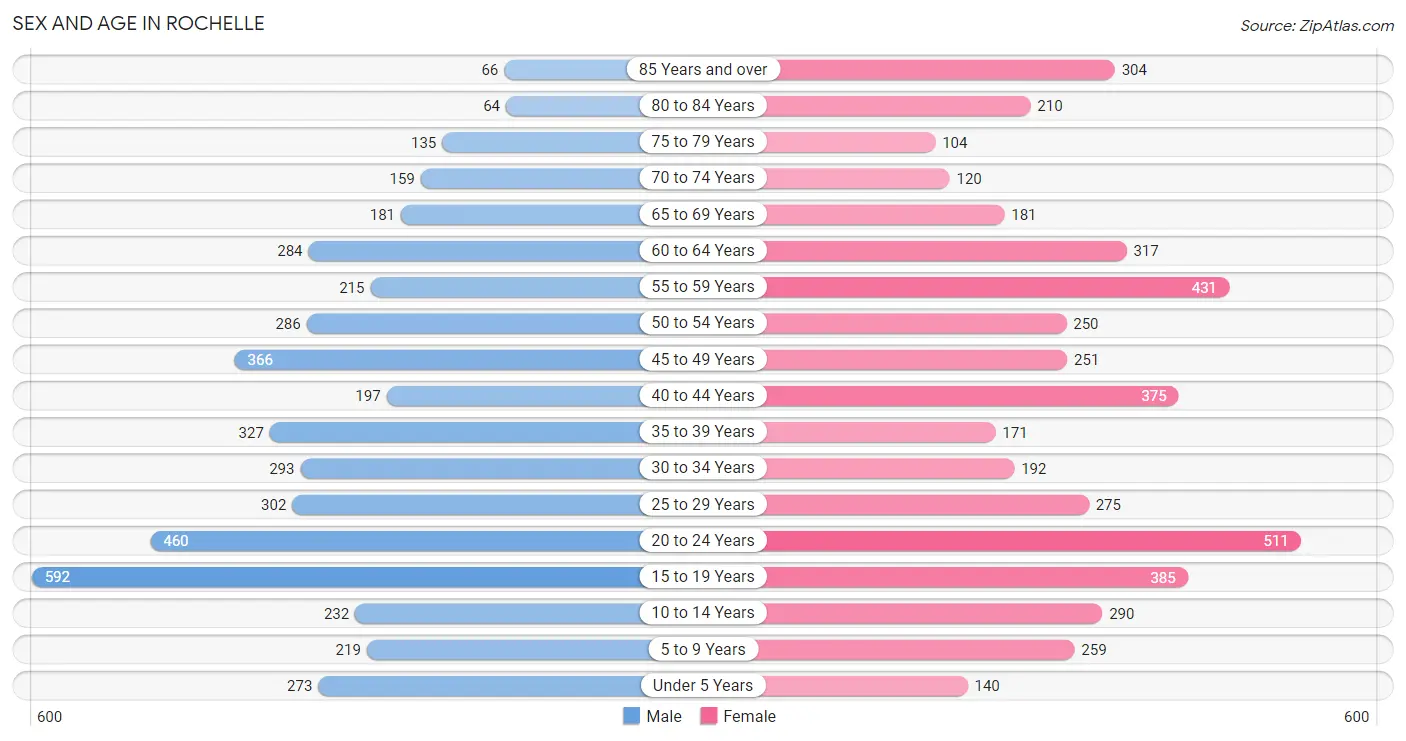
The most populous age groups in Rochelle are 15 to 19 Years (592 | 12.7%) for men and 20 to 24 Years (511 | 10.7%) for women.
| Age Bracket | Male | Female |
| Under 5 Years | 273 (5.9%) | 140 (2.9%) |
| 5 to 9 Years | 219 (4.7%) | 259 (5.4%) |
| 10 to 14 Years | 232 (5.0%) | 290 (6.1%) |
| 15 to 19 Years | 592 (12.7%) | 385 (8.1%) |
| 20 to 24 Years | 460 (9.9%) | 511 (10.7%) |
| 25 to 29 Years | 302 (6.5%) | 275 (5.8%) |
| 30 to 34 Years | 293 (6.3%) | 192 (4.0%) |
| 35 to 39 Years | 327 (7.0%) | 171 (3.6%) |
| 40 to 44 Years | 197 (4.2%) | 375 (7.9%) |
| 45 to 49 Years | 366 (7.9%) | 251 (5.3%) |
| 50 to 54 Years | 286 (6.1%) | 250 (5.2%) |
| 55 to 59 Years | 215 (4.6%) | 431 (9.0%) |
| 60 to 64 Years | 284 (6.1%) | 317 (6.7%) |
| 65 to 69 Years | 181 (3.9%) | 181 (3.8%) |
| 70 to 74 Years | 159 (3.4%) | 120 (2.5%) |
| 75 to 79 Years | 135 (2.9%) | 104 (2.2%) |
| 80 to 84 Years | 64 (1.4%) | 210 (4.4%) |
| 85 Years and over | 66 (1.4%) | 304 (6.4%) |
| Total | 4,651 (100.0%) | 4,766 (100.0%) |
Families and Households in Rochelle
Median Family Size in Rochelle
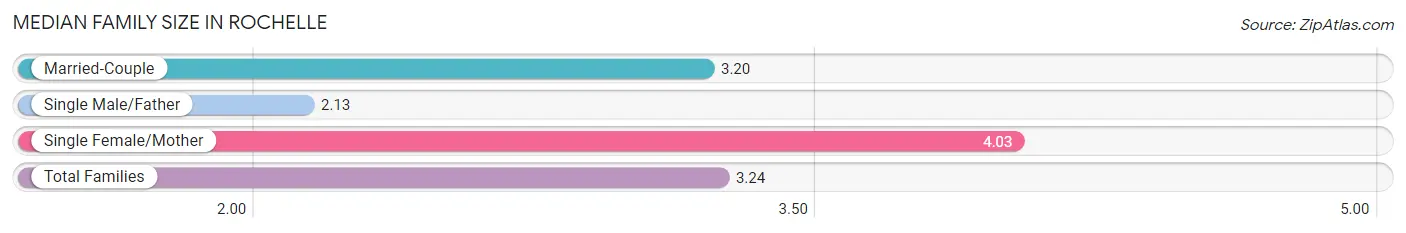
The median family size in Rochelle is 3.24 persons per family, with single female/mother families (518 | 24.4%) accounting for the largest median family size of 4.03 persons per family. On the other hand, single male/father families (328 | 15.4%) represent the smallest median family size with 2.13 persons per family.
| Family Type | # Families | Family Size |
| Married-Couple | 1,277 (60.2%) | 3.20 |
| Single Male/Father | 328 (15.4%) | 2.13 |
| Single Female/Mother | 518 (24.4%) | 4.03 |
| Total Families | 2,123 (100.0%) | 3.24 |
Median Household Size in Rochelle
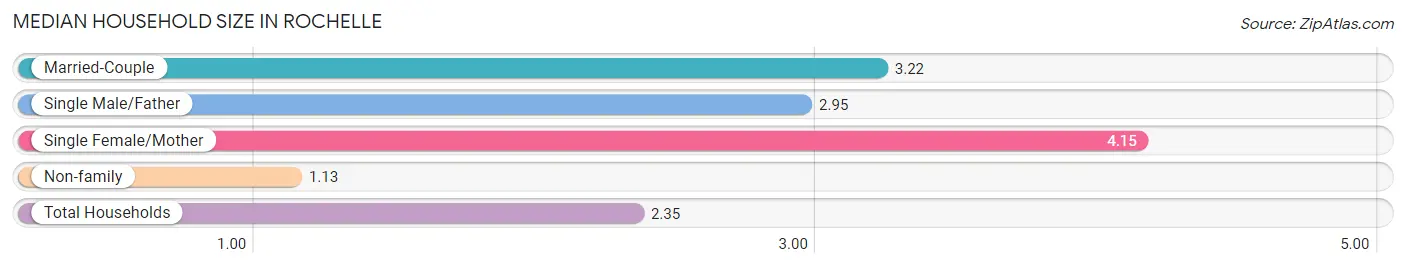
The median household size in Rochelle is 2.35 persons per household, with single female/mother households (518 | 13.1%) accounting for the largest median household size of 4.15 persons per household. non-family households (1,832 | 46.3%) represent the smallest median household size with 1.13 persons per household.
| Household Type | # Households | Household Size |
| Married-Couple | 1,277 (32.3%) | 3.22 |
| Single Male/Father | 328 (8.3%) | 2.95 |
| Single Female/Mother | 518 (13.1%) | 4.15 |
| Non-family | 1,832 (46.3%) | 1.13 |
| Total Households | 3,955 (100.0%) | 2.35 |
Household Size by Marriage Status in Rochelle
Out of a total of 3,955 households in Rochelle, 2,123 (53.7%) are family households, while 1,832 (46.3%) are nonfamily households. The most numerous type of family households are 2-person households, comprising 799, and the most common type of nonfamily households are 1-person households, comprising 1,610.
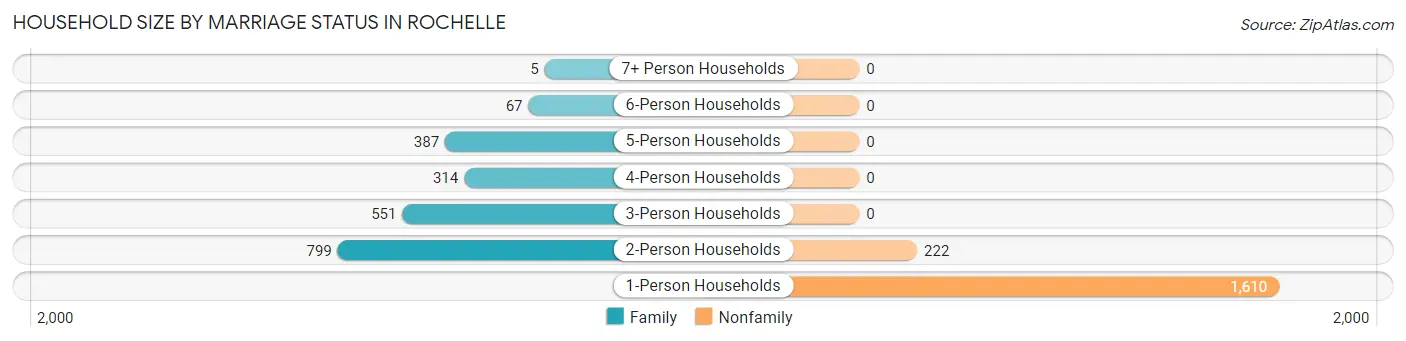
| Household Size | Family Households | Nonfamily Households |
| 1-Person Households | - | 1,610 (40.7%) |
| 2-Person Households | 799 (20.2%) | 222 (5.6%) |
| 3-Person Households | 551 (13.9%) | 0 (0.0%) |
| 4-Person Households | 314 (7.9%) | 0 (0.0%) |
| 5-Person Households | 387 (9.8%) | 0 (0.0%) |
| 6-Person Households | 67 (1.7%) | 0 (0.0%) |
| 7+ Person Households | 5 (0.1%) | 0 (0.0%) |
| Total | 2,123 (53.7%) | 1,832 (46.3%) |
Female Fertility in Rochelle
Fertility by Age in Rochelle
Average fertility rate in Rochelle is 91.0 births per 1,000 women. Women in the age bracket of 20 to 34 years have the highest fertility rate with 126.0 births per 1,000 women. Women in the age bracket of 20 to 34 years acount for 61.8% of all women with births.
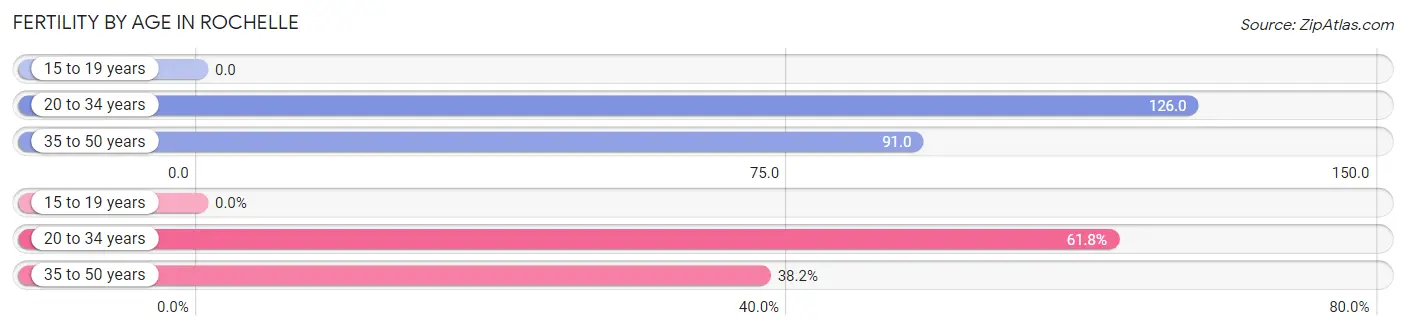
| Age Bracket | Women with Births | Births / 1,000 Women |
| 15 to 19 years | 0 (0.0%) | 0.0 |
| 20 to 34 years | 123 (61.8%) | 126.0 |
| 35 to 50 years | 76 (38.2%) | 91.0 |
| Total | 199 (100.0%) | 91.0 |
Fertility by Age by Marriage Status in Rochelle
62.8% of women with births (199) in Rochelle are married. The highest percentage of unmarried women with births falls into 20 to 34 years age bracket with 60.2% of them unmarried at the time of birth, while the lowest percentage of unmarried women with births belong to 35 to 50 years age bracket with 0.0% of them unmarried.
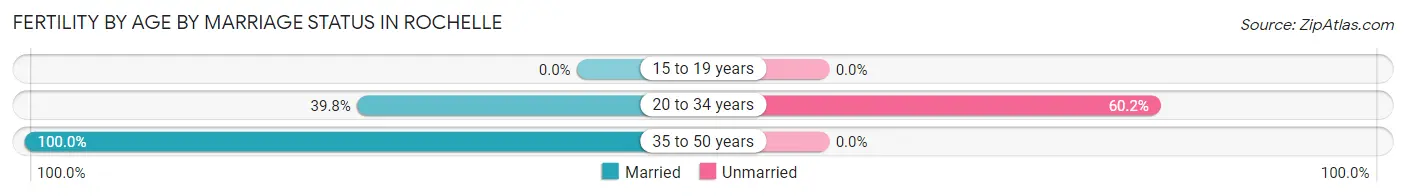
| Age Bracket | Married | Unmarried |
| 15 to 19 years | 0 (0.0%) | 0 (0.0%) |
| 20 to 34 years | 49 (39.8%) | 74 (60.2%) |
| 35 to 50 years | 76 (100.0%) | 0 (0.0%) |
| Total | 125 (62.8%) | 74 (37.2%) |
Fertility by Education in Rochelle
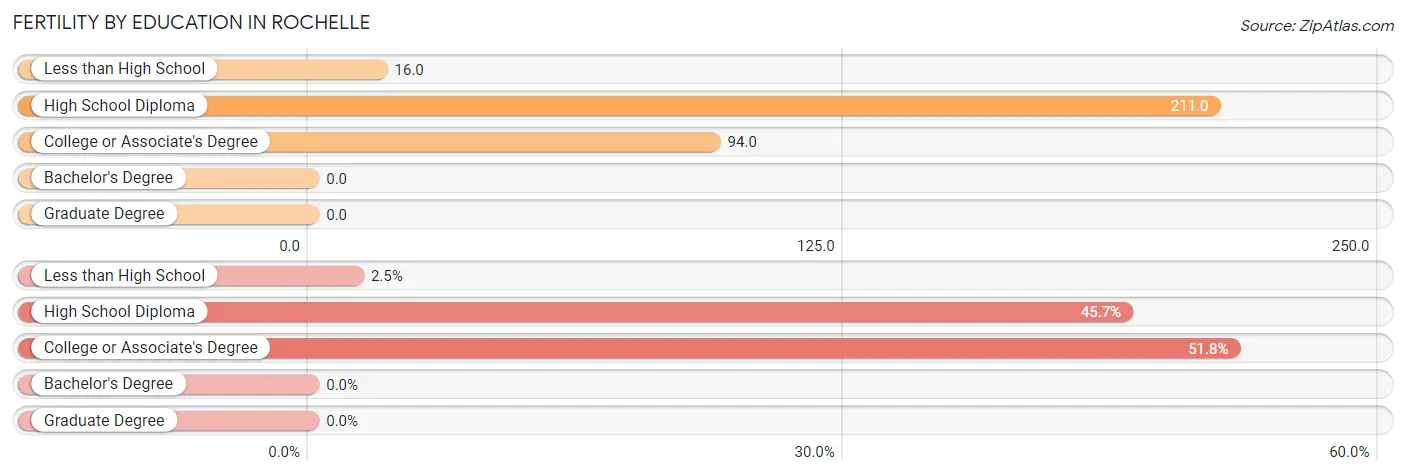
| Educational Attainment | Women with Births | Births / 1,000 Women |
| Less than High School | 5 (2.5%) | 16.0 |
| High School Diploma | 91 (45.7%) | 211.0 |
| College or Associate's Degree | 103 (51.8%) | 94.0 |
| Bachelor's Degree | 0 (0.0%) | 0.0 |
| Graduate Degree | 0 (0.0%) | 0.0 |
| Total | 199 (100.0%) | 91.0 |
Fertility by Education by Marriage Status in Rochelle
37.2% of women with births in Rochelle are unmarried. Women with the educational attainment of less than high school are most likely to be married with 100.0% of them married at childbirth, while women with the educational attainment of college or associate's degree are least likely to be married with 62.1% of them unmarried at childbirth.
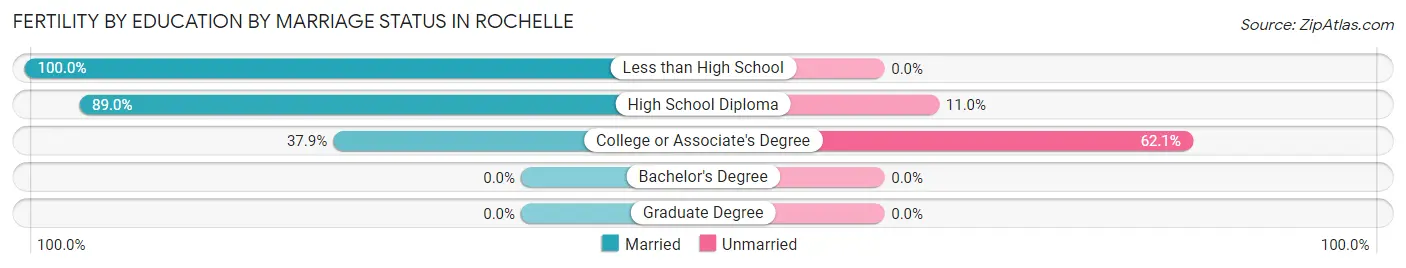
| Educational Attainment | Married | Unmarried |
| Less than High School | 5 (100.0%) | 0 (0.0%) |
| High School Diploma | 81 (89.0%) | 10 (11.0%) |
| College or Associate's Degree | 39 (37.9%) | 64 (62.1%) |
| Bachelor's Degree | 0 (0.0%) | 0 (0.0%) |
| Graduate Degree | 0 (0.0%) | 0 (0.0%) |
| Total | 125 (62.8%) | 74 (37.2%) |
Employment Characteristics in Rochelle
Employment by Class of Employer in Rochelle
Among the 4,712 employed individuals in Rochelle, private company employees (3,228 | 68.5%), not-for-profit organizations (460 | 9.8%), and local government employees (455 | 9.7%) make up the most common classes of employment.
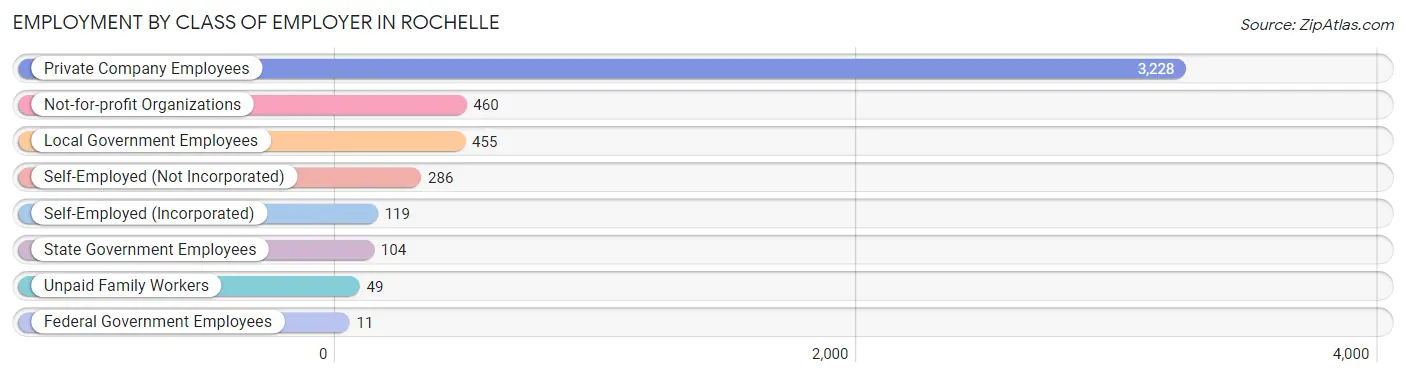
| Employer Class | # Employees | % Employees |
| Private Company Employees | 3,228 | 68.5% |
| Self-Employed (Incorporated) | 119 | 2.5% |
| Self-Employed (Not Incorporated) | 286 | 6.1% |
| Not-for-profit Organizations | 460 | 9.8% |
| Local Government Employees | 455 | 9.7% |
| State Government Employees | 104 | 2.2% |
| Federal Government Employees | 11 | 0.2% |
| Unpaid Family Workers | 49 | 1.0% |
| Total | 4,712 | 100.0% |
Employment Status by Age in Rochelle
According to the labor force statistics for Rochelle, out of the total population over 16 years of age (7,772), 68.0% or 5,285 individuals are in the labor force, with 10.9% or 576 of them unemployed. The age group with the highest labor force participation rate is 25 to 29 years, with 94.5% or 545 individuals in the labor force. Within the labor force, the 16 to 19 years age range has the highest percentage of unemployed individuals, with 39.2% or 130 of them being unemployed.
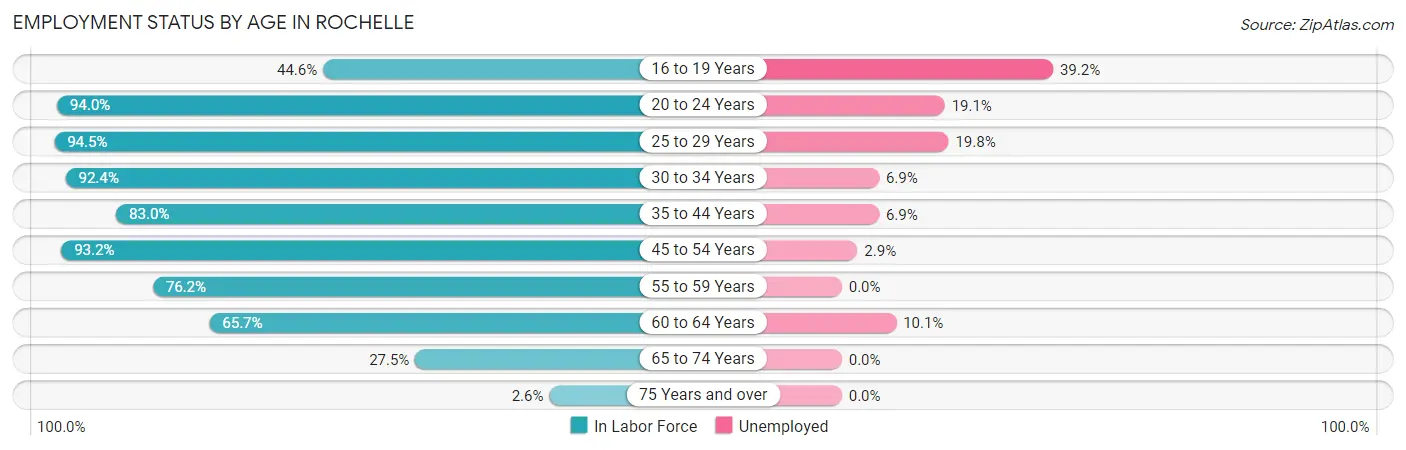
| Age Bracket | In Labor Force | Unemployed |
| 16 to 19 Years | 332 (44.6%) | 130 (39.2%) |
| 20 to 24 Years | 913 (94.0%) | 174 (19.1%) |
| 25 to 29 Years | 545 (94.5%) | 108 (19.8%) |
| 30 to 34 Years | 448 (92.4%) | 31 (6.9%) |
| 35 to 44 Years | 888 (83.0%) | 61 (6.9%) |
| 45 to 54 Years | 1,075 (93.2%) | 31 (2.9%) |
| 55 to 59 Years | 492 (76.2%) | 0 (0.0%) |
| 60 to 64 Years | 395 (65.7%) | 40 (10.1%) |
| 65 to 74 Years | 176 (27.5%) | 0 (0.0%) |
| 75 Years and over | 23 (2.6%) | 0 (0.0%) |
| Total | 5,285 (68.0%) | 576 (10.9%) |
Employment Status by Educational Attainment in Rochelle
According to labor force statistics for Rochelle, 84.8% of individuals (3,843) out of the total population between 25 and 64 years of age (4,532) are in the labor force, with 7.1% or 273 of them being unemployed. The group with the highest labor force participation rate are those with the educational attainment of bachelor's degree or higher, with 92.4% or 942 individuals in the labor force. Within the labor force, individuals with high school diploma education have the highest percentage of unemployment, with 14.1% or 160 of them being unemployed.
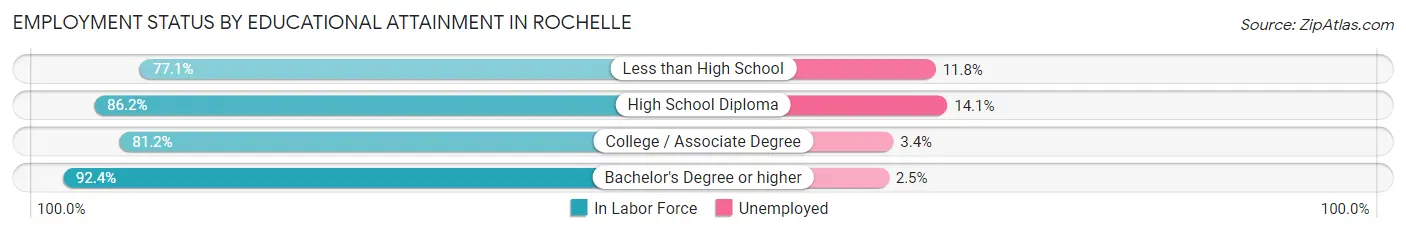
| Educational Attainment | In Labor Force | Unemployed |
| Less than High School | 313 (77.1%) | 48 (11.8%) |
| High School Diploma | 1,136 (86.2%) | 186 (14.1%) |
| College / Associate Degree | 1,453 (81.2%) | 61 (3.4%) |
| Bachelor's Degree or higher | 942 (92.4%) | 25 (2.5%) |
| Total | 3,843 (84.8%) | 322 (7.1%) |
Employment Occupations by Sex in Rochelle
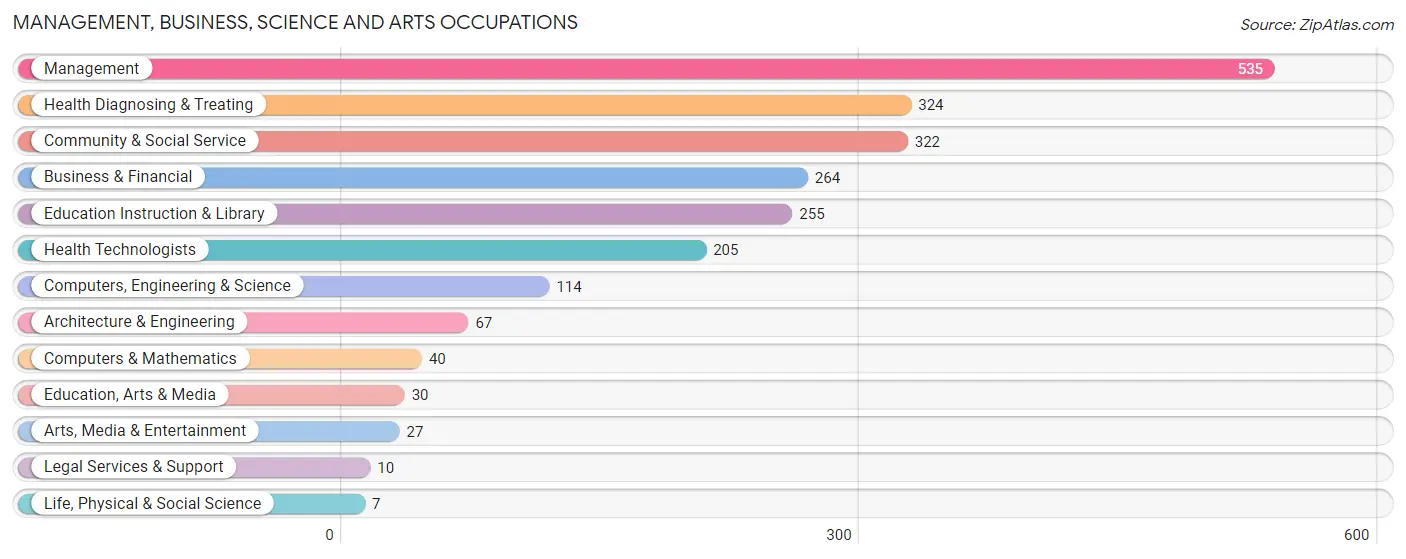
Management, Business, Science and Arts Occupations
The most common Management, Business, Science and Arts occupations in Rochelle are Management (535 | 11.4%), Health Diagnosing & Treating (324 | 6.9%), Community & Social Service (322 | 6.8%), Business & Financial (264 | 5.6%), and Education Instruction & Library (255 | 5.4%).
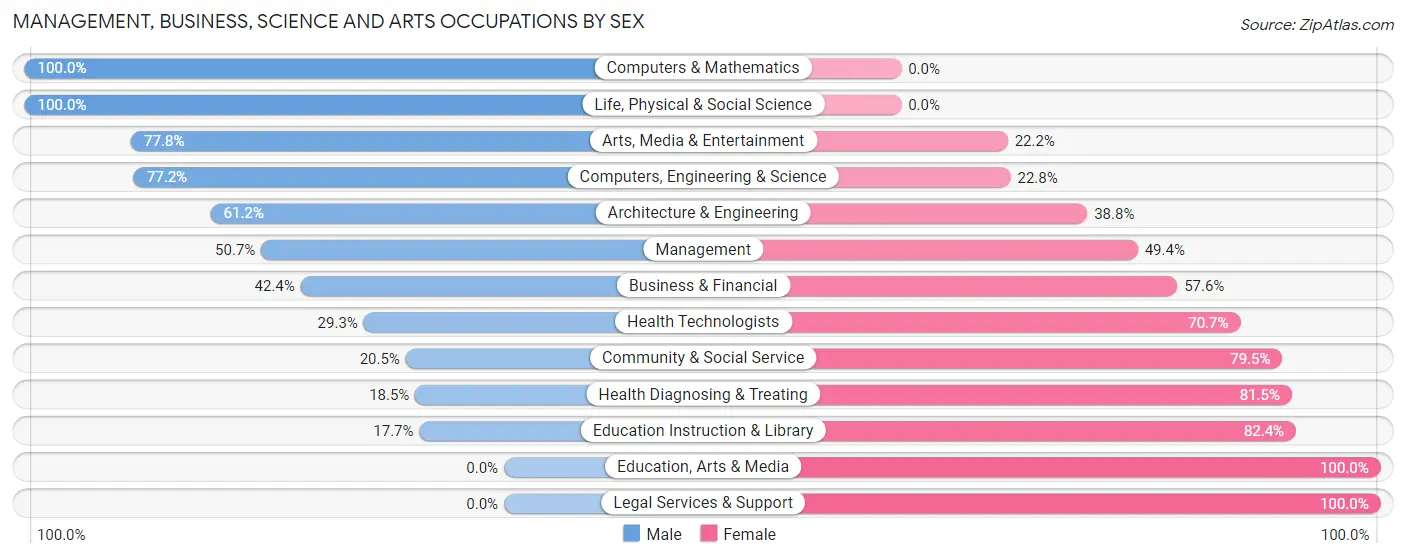
Management, Business, Science and Arts Occupations by Sex
Within the Management, Business, Science and Arts occupations in Rochelle, the most male-oriented occupations are Computers & Mathematics (100.0%), Life, Physical & Social Science (100.0%), and Arts, Media & Entertainment (77.8%), while the most female-oriented occupations are Education, Arts & Media (100.0%), Legal Services & Support (100.0%), and Education Instruction & Library (82.4%).
| Occupation | Male | Female |
| Management | 271 (50.6%) | 264 (49.3%) |
| Business & Financial | 112 (42.4%) | 152 (57.6%) |
| Computers, Engineering & Science | 88 (77.2%) | 26 (22.8%) |
| Computers & Mathematics | 40 (100.0%) | 0 (0.0%) |
| Architecture & Engineering | 41 (61.2%) | 26 (38.8%) |
| Life, Physical & Social Science | 7 (100.0%) | 0 (0.0%) |
| Community & Social Service | 66 (20.5%) | 256 (79.5%) |
| Education, Arts & Media | 0 (0.0%) | 30 (100.0%) |
| Legal Services & Support | 0 (0.0%) | 10 (100.0%) |
| Education Instruction & Library | 45 (17.6%) | 210 (82.4%) |
| Arts, Media & Entertainment | 21 (77.8%) | 6 (22.2%) |
| Health Diagnosing & Treating | 60 (18.5%) | 264 (81.5%) |
| Health Technologists | 60 (29.3%) | 145 (70.7%) |
| Total (Category) | 597 (38.3%) | 962 (61.7%) |
| Total (Overall) | 2,361 (50.1%) | 2,351 (49.9%) |
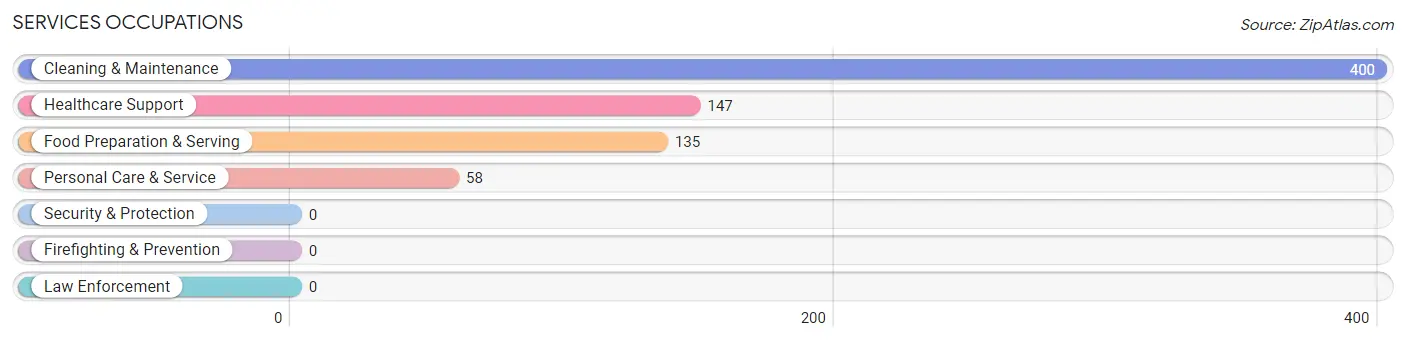
Services Occupations
The most common Services occupations in Rochelle are Cleaning & Maintenance (400 | 8.5%), Healthcare Support (147 | 3.1%), Food Preparation & Serving (135 | 2.9%), and Personal Care & Service (58 | 1.2%).
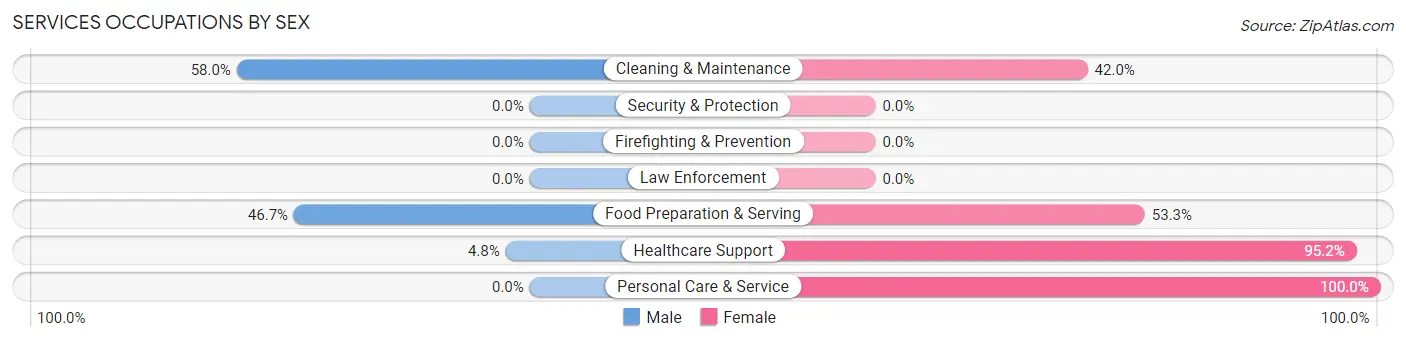
Services Occupations by Sex
Within the Services occupations in Rochelle, the most male-oriented occupations are Cleaning & Maintenance (58.0%), Food Preparation & Serving (46.7%), and Healthcare Support (4.8%), while the most female-oriented occupations are Personal Care & Service (100.0%), Healthcare Support (95.2%), and Food Preparation & Serving (53.3%).
| Occupation | Male | Female |
| Healthcare Support | 7 (4.8%) | 140 (95.2%) |
| Security & Protection | 0 (0.0%) | 0 (0.0%) |
| Firefighting & Prevention | 0 (0.0%) | 0 (0.0%) |
| Law Enforcement | 0 (0.0%) | 0 (0.0%) |
| Food Preparation & Serving | 63 (46.7%) | 72 (53.3%) |
| Cleaning & Maintenance | 232 (58.0%) | 168 (42.0%) |
| Personal Care & Service | 0 (0.0%) | 58 (100.0%) |
| Total (Category) | 302 (40.8%) | 438 (59.2%) |
| Total (Overall) | 2,361 (50.1%) | 2,351 (49.9%) |
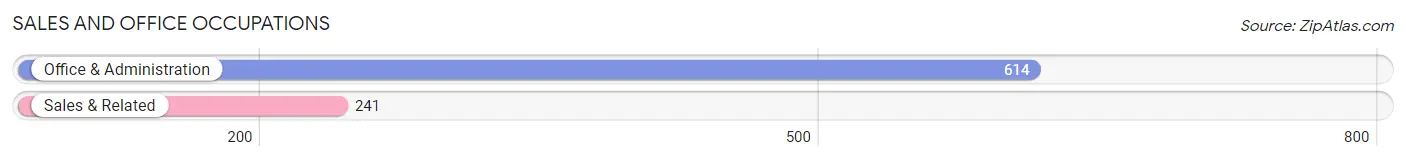
Sales and Office Occupations
The most common Sales and Office occupations in Rochelle are Office & Administration (614 | 13.0%), and Sales & Related (241 | 5.1%).
Sales and Office Occupations by Sex
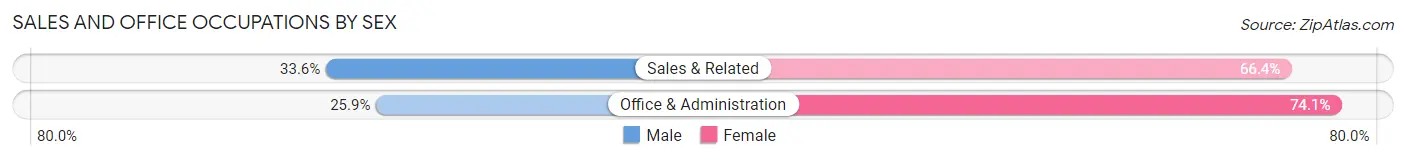
| Occupation | Male | Female |
| Sales & Related | 81 (33.6%) | 160 (66.4%) |
| Office & Administration | 159 (25.9%) | 455 (74.1%) |
| Total (Category) | 240 (28.1%) | 615 (71.9%) |
| Total (Overall) | 2,361 (50.1%) | 2,351 (49.9%) |
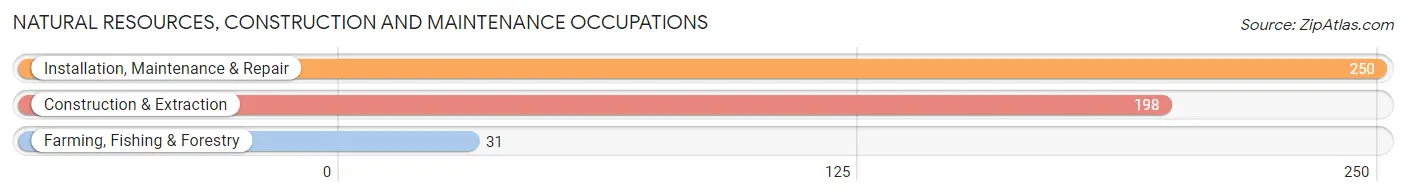
Natural Resources, Construction and Maintenance Occupations
The most common Natural Resources, Construction and Maintenance occupations in Rochelle are Installation, Maintenance & Repair (250 | 5.3%), Construction & Extraction (198 | 4.2%), and Farming, Fishing & Forestry (31 | 0.7%).
Natural Resources, Construction and Maintenance Occupations by Sex
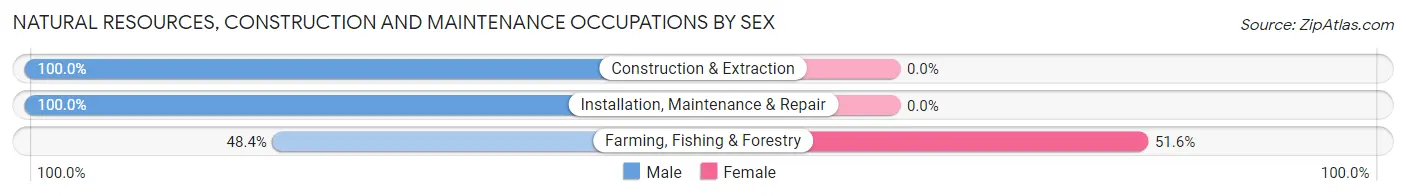
| Occupation | Male | Female |
| Farming, Fishing & Forestry | 15 (48.4%) | 16 (51.6%) |
| Construction & Extraction | 198 (100.0%) | 0 (0.0%) |
| Installation, Maintenance & Repair | 250 (100.0%) | 0 (0.0%) |
| Total (Category) | 463 (96.7%) | 16 (3.3%) |
| Total (Overall) | 2,361 (50.1%) | 2,351 (49.9%) |
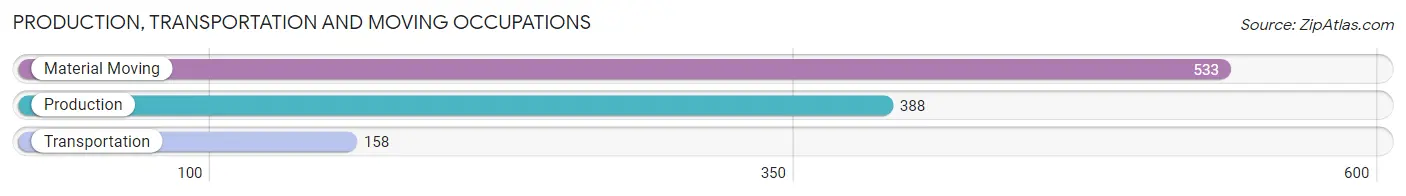
Production, Transportation and Moving Occupations
The most common Production, Transportation and Moving occupations in Rochelle are Material Moving (533 | 11.3%), Production (388 | 8.2%), and Transportation (158 | 3.4%).
Production, Transportation and Moving Occupations by Sex
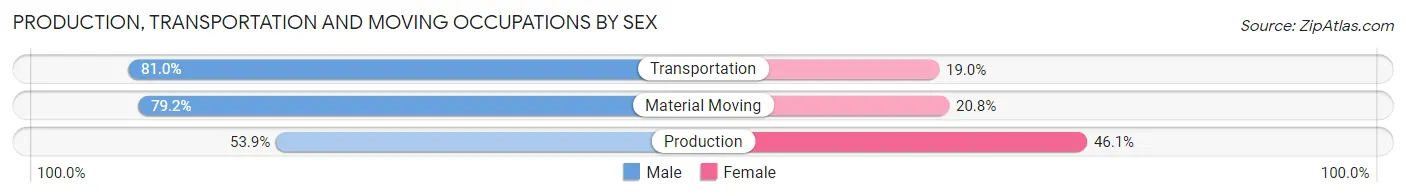
| Occupation | Male | Female |
| Production | 209 (53.9%) | 179 (46.1%) |
| Transportation | 128 (81.0%) | 30 (19.0%) |
| Material Moving | 422 (79.2%) | 111 (20.8%) |
| Total (Category) | 759 (70.3%) | 320 (29.7%) |
| Total (Overall) | 2,361 (50.1%) | 2,351 (49.9%) |
Employment Industries by Sex in Rochelle
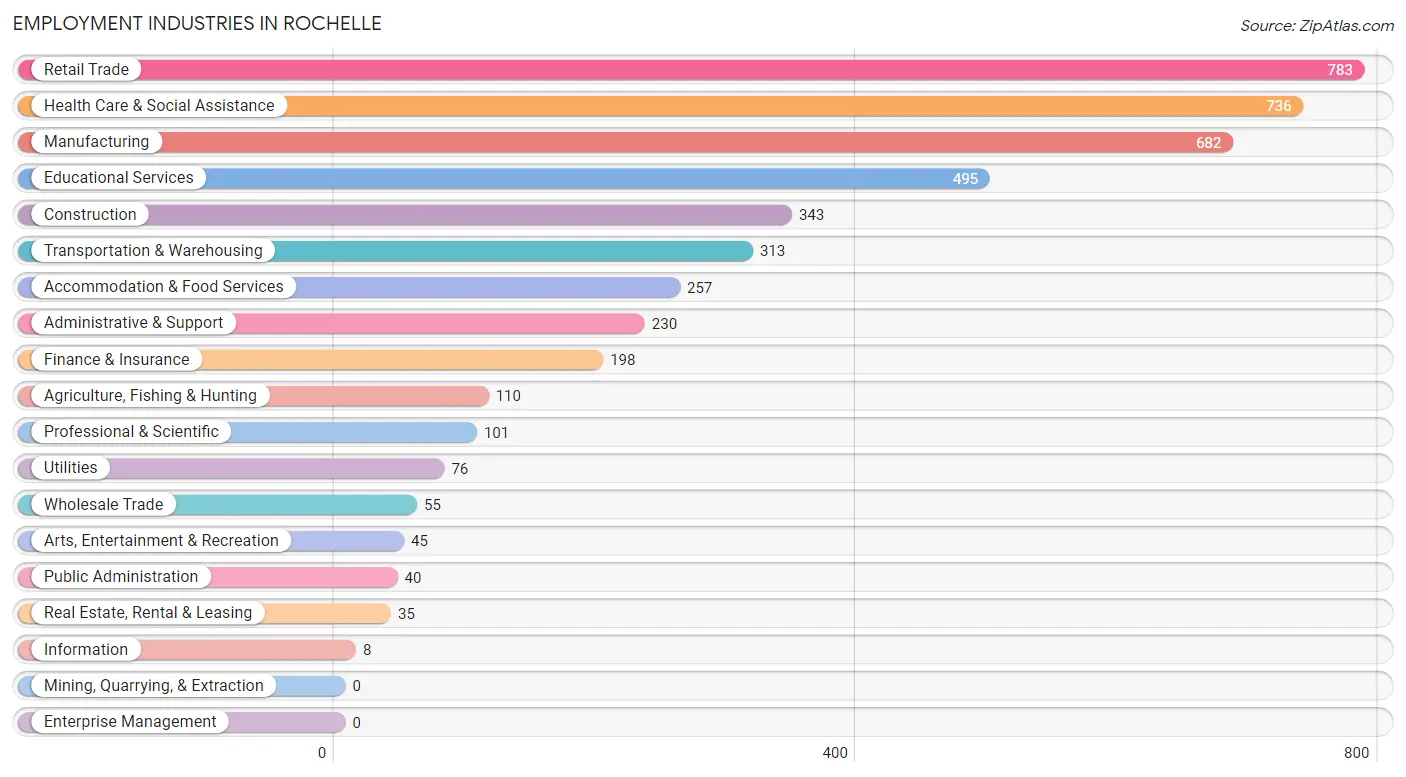
Employment Industries in Rochelle
The major employment industries in Rochelle include Retail Trade (783 | 16.6%), Health Care & Social Assistance (736 | 15.6%), Manufacturing (682 | 14.5%), Educational Services (495 | 10.5%), and Construction (343 | 7.3%).
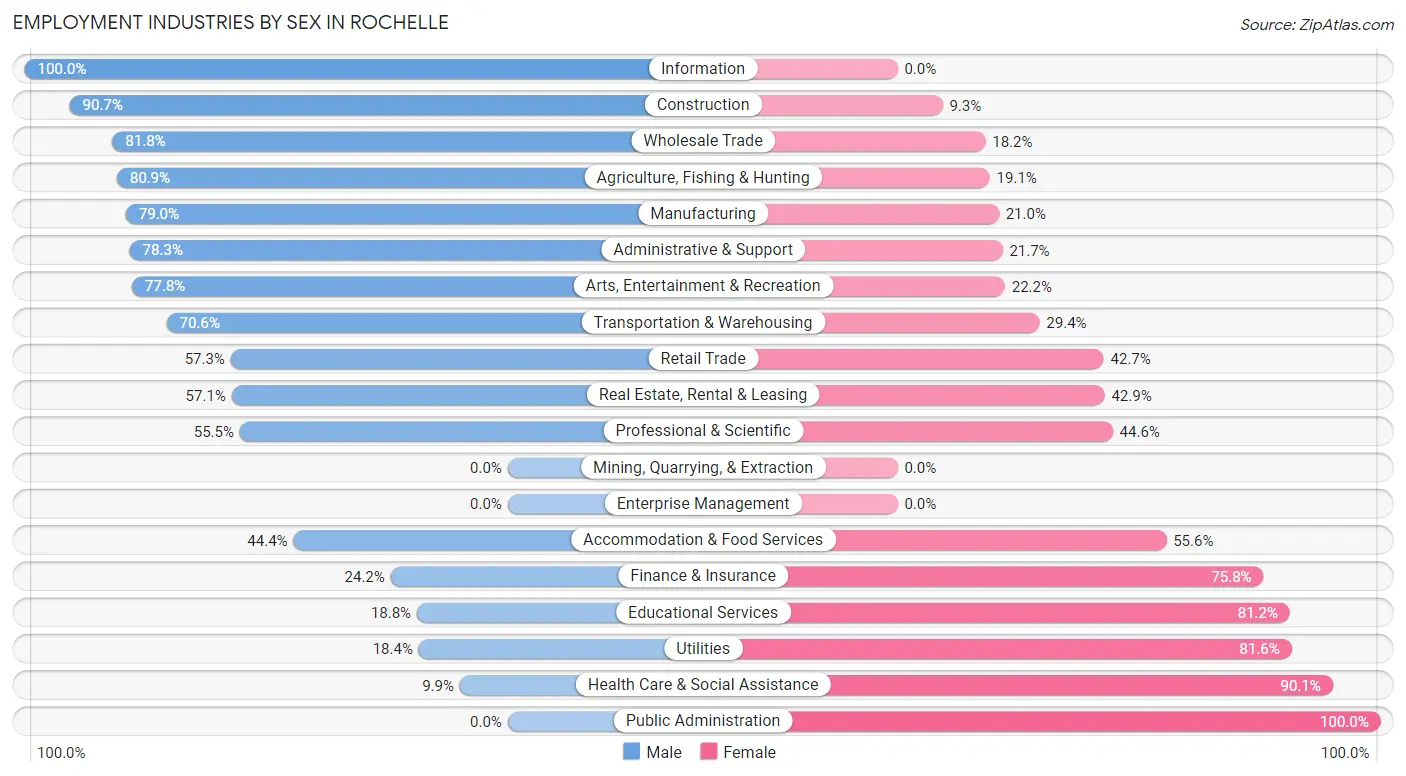
Employment Industries by Sex in Rochelle
The Rochelle industries that see more men than women are Information (100.0%), Construction (90.7%), and Wholesale Trade (81.8%), whereas the industries that tend to have a higher number of women are Public Administration (100.0%), Health Care & Social Assistance (90.1%), and Utilities (81.6%).
| Industry | Male | Female |
| Agriculture, Fishing & Hunting | 89 (80.9%) | 21 (19.1%) |
| Mining, Quarrying, & Extraction | 0 (0.0%) | 0 (0.0%) |
| Construction | 311 (90.7%) | 32 (9.3%) |
| Manufacturing | 539 (79.0%) | 143 (21.0%) |
| Wholesale Trade | 45 (81.8%) | 10 (18.2%) |
| Retail Trade | 449 (57.3%) | 334 (42.7%) |
| Transportation & Warehousing | 221 (70.6%) | 92 (29.4%) |
| Utilities | 14 (18.4%) | 62 (81.6%) |
| Information | 8 (100.0%) | 0 (0.0%) |
| Finance & Insurance | 48 (24.2%) | 150 (75.8%) |
| Real Estate, Rental & Leasing | 20 (57.1%) | 15 (42.9%) |
| Professional & Scientific | 56 (55.4%) | 45 (44.6%) |
| Enterprise Management | 0 (0.0%) | 0 (0.0%) |
| Administrative & Support | 180 (78.3%) | 50 (21.7%) |
| Educational Services | 93 (18.8%) | 402 (81.2%) |
| Health Care & Social Assistance | 73 (9.9%) | 663 (90.1%) |
| Arts, Entertainment & Recreation | 35 (77.8%) | 10 (22.2%) |
| Accommodation & Food Services | 114 (44.4%) | 143 (55.6%) |
| Public Administration | 0 (0.0%) | 40 (100.0%) |
| Total | 2,361 (50.1%) | 2,351 (49.9%) |
Education in Rochelle
School Enrollment in Rochelle
The most common levels of schooling among the 2,532 students in Rochelle are high school (724 | 28.6%), college / undergraduate (580 | 22.9%), and middle school (460 | 18.2%).
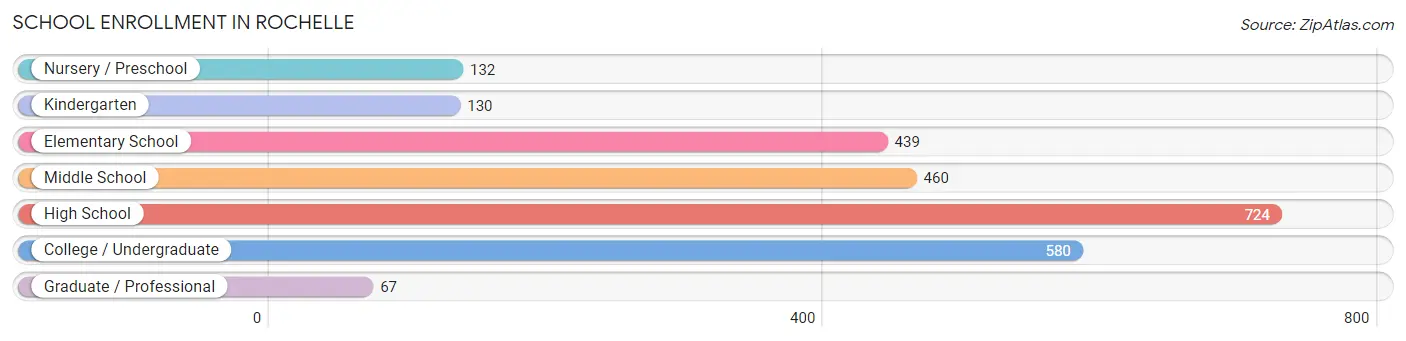
| School Level | # Students | % Students |
| Nursery / Preschool | 132 | 5.2% |
| Kindergarten | 130 | 5.1% |
| Elementary School | 439 | 17.3% |
| Middle School | 460 | 18.2% |
| High School | 724 | 28.6% |
| College / Undergraduate | 580 | 22.9% |
| Graduate / Professional | 67 | 2.6% |
| Total | 2,532 | 100.0% |
School Enrollment by Age by Funding Source in Rochelle
Out of a total of 2,532 students who are enrolled in schools in Rochelle, 410 (16.2%) attend a private institution, while the remaining 2,122 (83.8%) are enrolled in public schools. The age group of 35 years and over has the highest likelihood of being enrolled in private schools, with 18 (34.0% in the age bracket) enrolled. Conversely, the age group of 3 to 4 year olds has the lowest likelihood of being enrolled in a private school, with 161 (100.0% in the age bracket) attending a public institution.
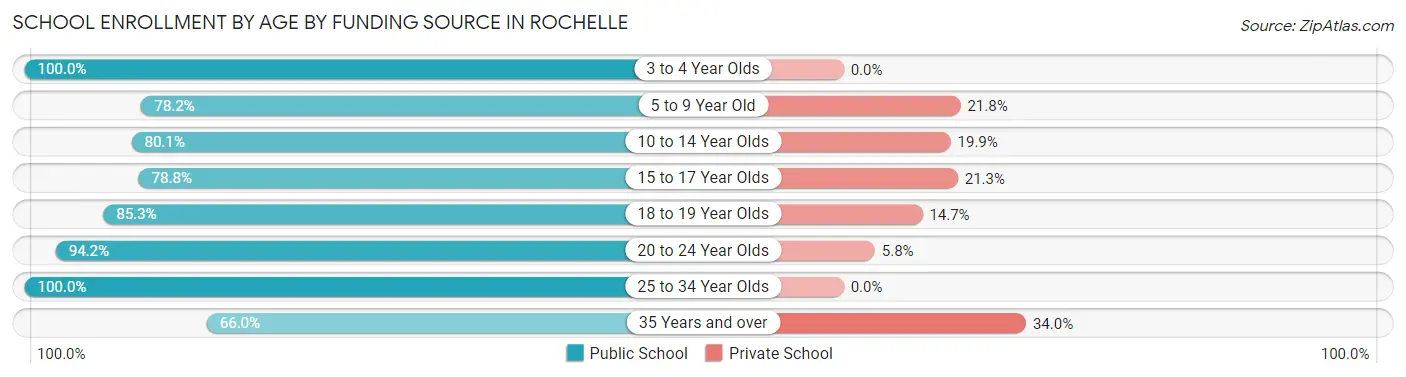
| Age Bracket | Public School | Private School |
| 3 to 4 Year Olds | 161 (100.0%) | 0 (0.0%) |
| 5 to 9 Year Old | 374 (78.2%) | 104 (21.8%) |
| 10 to 14 Year Olds | 418 (80.1%) | 104 (19.9%) |
| 15 to 17 Year Olds | 404 (78.7%) | 109 (21.2%) |
| 18 to 19 Year Olds | 349 (85.3%) | 60 (14.7%) |
| 20 to 24 Year Olds | 243 (94.2%) | 15 (5.8%) |
| 25 to 34 Year Olds | 138 (100.0%) | 0 (0.0%) |
| 35 Years and over | 35 (66.0%) | 18 (34.0%) |
| Total | 2,122 (83.8%) | 410 (16.2%) |
Educational Attainment by Field of Study in Rochelle
Education (448 | 33.3%), business (353 | 26.3%), science & technology (168 | 12.5%), social sciences (80 | 5.9%), and engineering (61 | 4.5%) are the most common fields of study among 1,344 individuals in Rochelle who have obtained a bachelor's degree or higher.
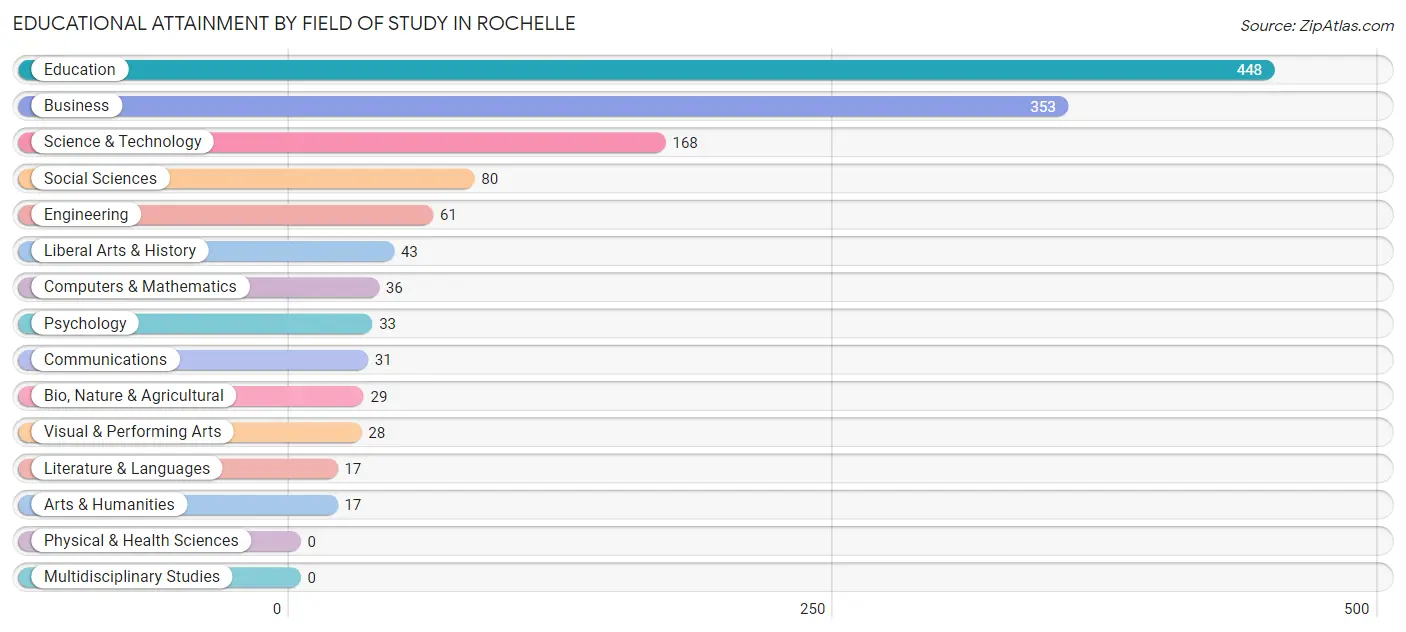
| Field of Study | # Graduates | % Graduates |
| Computers & Mathematics | 36 | 2.7% |
| Bio, Nature & Agricultural | 29 | 2.2% |
| Physical & Health Sciences | 0 | 0.0% |
| Psychology | 33 | 2.5% |
| Social Sciences | 80 | 5.9% |
| Engineering | 61 | 4.5% |
| Multidisciplinary Studies | 0 | 0.0% |
| Science & Technology | 168 | 12.5% |
| Business | 353 | 26.3% |
| Education | 448 | 33.3% |
| Literature & Languages | 17 | 1.3% |
| Liberal Arts & History | 43 | 3.2% |
| Visual & Performing Arts | 28 | 2.1% |
| Communications | 31 | 2.3% |
| Arts & Humanities | 17 | 1.3% |
| Total | 1,344 | 100.0% |
Transportation & Commute in Rochelle
Vehicle Availability by Sex in Rochelle
The most prevalent vehicle ownership categories in Rochelle are males with 2 vehicles (905, accounting for 38.3%) and females with 2 vehicles (813, making up 38.5%).
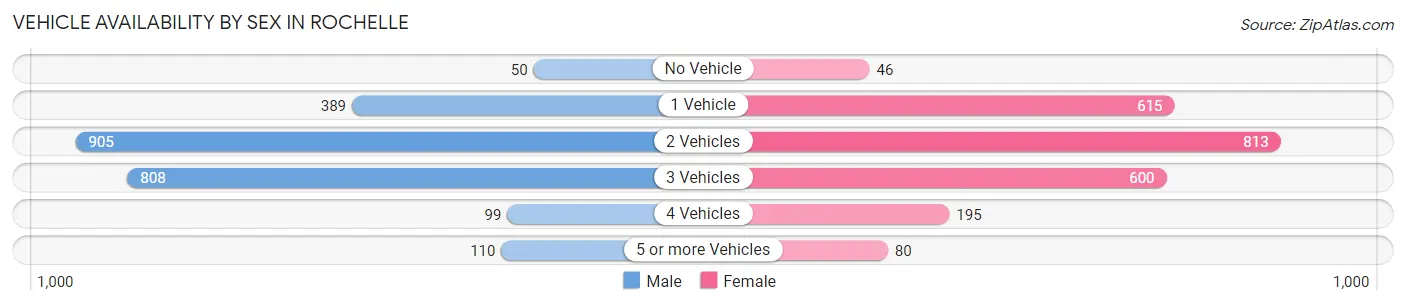
| Vehicles Available | Male | Female |
| No Vehicle | 50 (2.1%) | 46 (2.0%) |
| 1 Vehicle | 389 (16.5%) | 615 (26.2%) |
| 2 Vehicles | 905 (38.3%) | 813 (34.6%) |
| 3 Vehicles | 808 (34.2%) | 600 (25.5%) |
| 4 Vehicles | 99 (4.2%) | 195 (8.3%) |
| 5 or more Vehicles | 110 (4.7%) | 80 (3.4%) |
| Total | 2,361 (100.0%) | 2,349 (100.0%) |
Commute Time in Rochelle
The most frequently occuring commute durations in Rochelle are 5 to 9 minutes (978 commuters, 21.9%), 30 to 34 minutes (726 commuters, 16.3%), and 10 to 14 minutes (616 commuters, 13.8%).
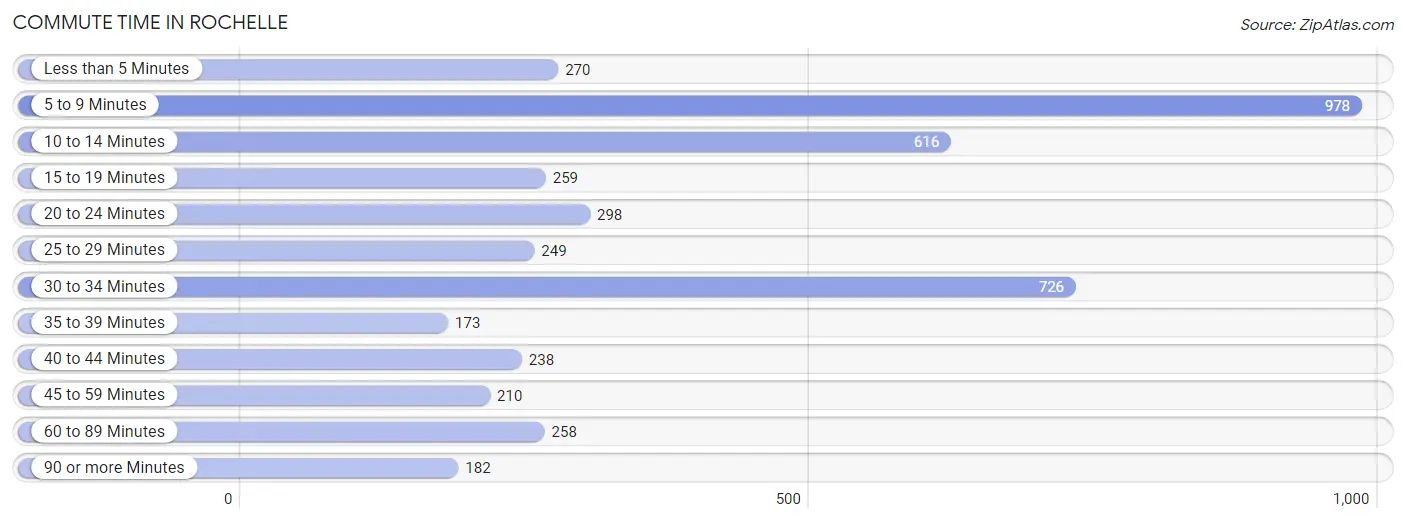
| Commute Time | # Commuters | % Commuters |
| Less than 5 Minutes | 270 | 6.1% |
| 5 to 9 Minutes | 978 | 21.9% |
| 10 to 14 Minutes | 616 | 13.8% |
| 15 to 19 Minutes | 259 | 5.8% |
| 20 to 24 Minutes | 298 | 6.7% |
| 25 to 29 Minutes | 249 | 5.6% |
| 30 to 34 Minutes | 726 | 16.3% |
| 35 to 39 Minutes | 173 | 3.9% |
| 40 to 44 Minutes | 238 | 5.3% |
| 45 to 59 Minutes | 210 | 4.7% |
| 60 to 89 Minutes | 258 | 5.8% |
| 90 or more Minutes | 182 | 4.1% |
Commute Time by Sex in Rochelle
The most common commute times in Rochelle are 5 to 9 minutes (454 commuters, 20.2%) for males and 5 to 9 minutes (524 commuters, 23.8%) for females.

| Commute Time | Male | Female |
| Less than 5 Minutes | 151 (6.7%) | 119 (5.4%) |
| 5 to 9 Minutes | 454 (20.2%) | 524 (23.8%) |
| 10 to 14 Minutes | 318 (14.1%) | 298 (13.5%) |
| 15 to 19 Minutes | 160 (7.1%) | 99 (4.5%) |
| 20 to 24 Minutes | 147 (6.5%) | 151 (6.9%) |
| 25 to 29 Minutes | 78 (3.5%) | 171 (7.8%) |
| 30 to 34 Minutes | 382 (17.0%) | 344 (15.6%) |
| 35 to 39 Minutes | 34 (1.5%) | 139 (6.3%) |
| 40 to 44 Minutes | 78 (3.5%) | 160 (7.3%) |
| 45 to 59 Minutes | 81 (3.6%) | 129 (5.9%) |
| 60 to 89 Minutes | 192 (8.5%) | 66 (3.0%) |
| 90 or more Minutes | 178 (7.9%) | 4 (0.2%) |
Time of Departure to Work by Sex in Rochelle
The most frequent times of departure to work in Rochelle are 12:00 PM to 3:59 PM (337, 15.0%) for males and 7:30 AM to 7:59 AM (493, 22.4%) for females.
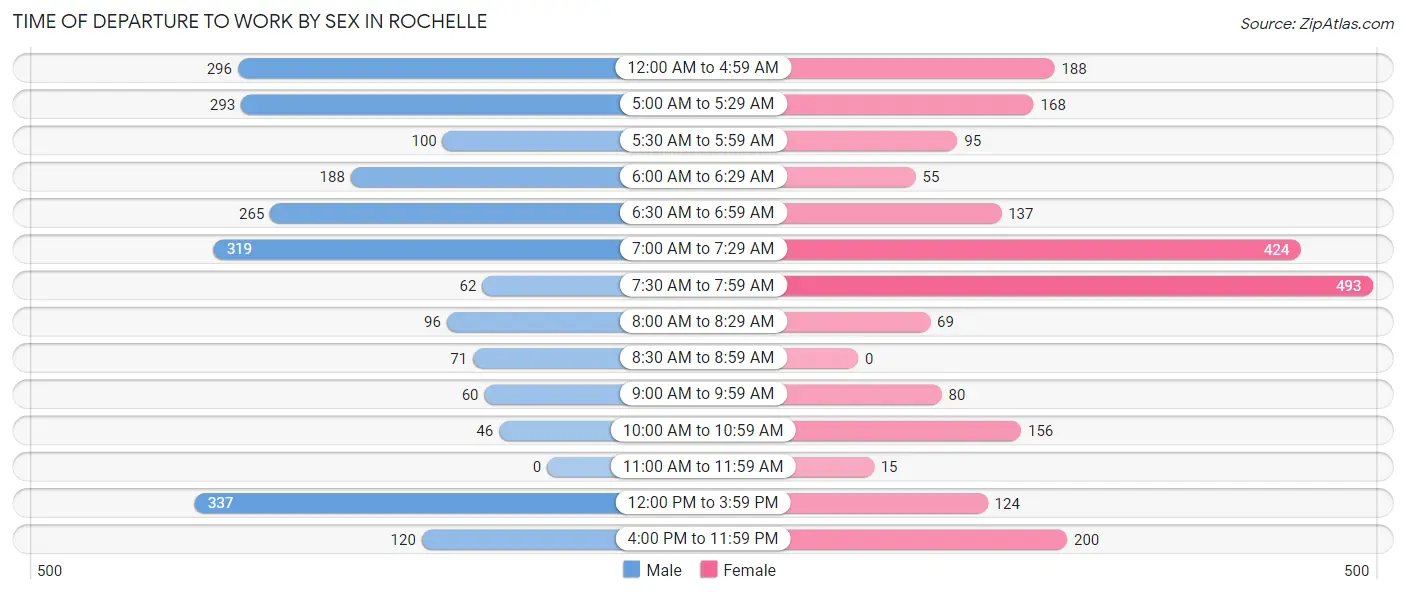
| Time of Departure | Male | Female |
| 12:00 AM to 4:59 AM | 296 (13.1%) | 188 (8.5%) |
| 5:00 AM to 5:29 AM | 293 (13.0%) | 168 (7.6%) |
| 5:30 AM to 5:59 AM | 100 (4.4%) | 95 (4.3%) |
| 6:00 AM to 6:29 AM | 188 (8.3%) | 55 (2.5%) |
| 6:30 AM to 6:59 AM | 265 (11.8%) | 137 (6.2%) |
| 7:00 AM to 7:29 AM | 319 (14.2%) | 424 (19.2%) |
| 7:30 AM to 7:59 AM | 62 (2.8%) | 493 (22.4%) |
| 8:00 AM to 8:29 AM | 96 (4.3%) | 69 (3.1%) |
| 8:30 AM to 8:59 AM | 71 (3.2%) | 0 (0.0%) |
| 9:00 AM to 9:59 AM | 60 (2.7%) | 80 (3.6%) |
| 10:00 AM to 10:59 AM | 46 (2.0%) | 156 (7.1%) |
| 11:00 AM to 11:59 AM | 0 (0.0%) | 15 (0.7%) |
| 12:00 PM to 3:59 PM | 337 (15.0%) | 124 (5.6%) |
| 4:00 PM to 11:59 PM | 120 (5.3%) | 200 (9.1%) |
| Total | 2,253 (100.0%) | 2,204 (100.0%) |
Housing Occupancy in Rochelle
Occupancy by Ownership in Rochelle
Of the total 3,955 dwellings in Rochelle, owner-occupied units account for 1,955 (49.4%), while renter-occupied units make up 2,000 (50.6%).
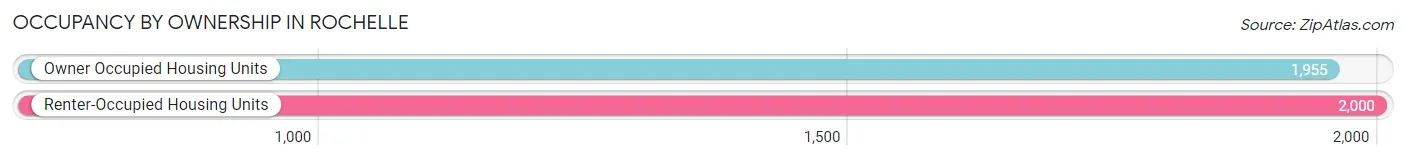
| Occupancy | # Housing Units | % Housing Units |
| Owner Occupied Housing Units | 1,955 | 49.4% |
| Renter-Occupied Housing Units | 2,000 | 50.6% |
| Total Occupied Housing Units | 3,955 | 100.0% |
Occupancy by Household Size in Rochelle
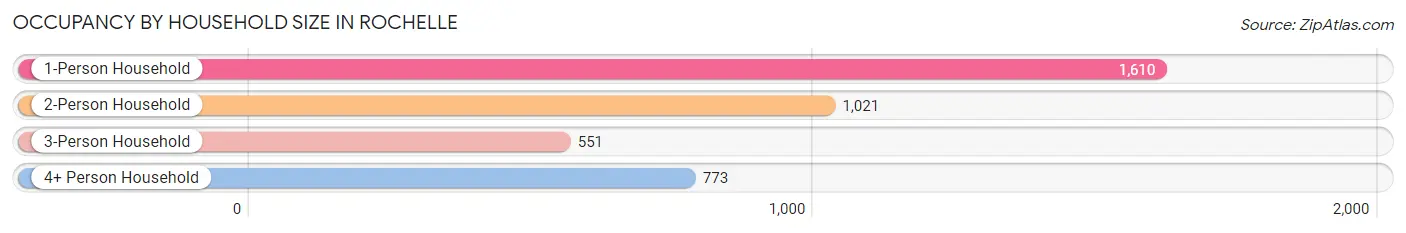
| Household Size | # Housing Units | % Housing Units |
| 1-Person Household | 1,610 | 40.7% |
| 2-Person Household | 1,021 | 25.8% |
| 3-Person Household | 551 | 13.9% |
| 4+ Person Household | 773 | 19.5% |
| Total Housing Units | 3,955 | 100.0% |
Occupancy by Ownership by Household Size in Rochelle
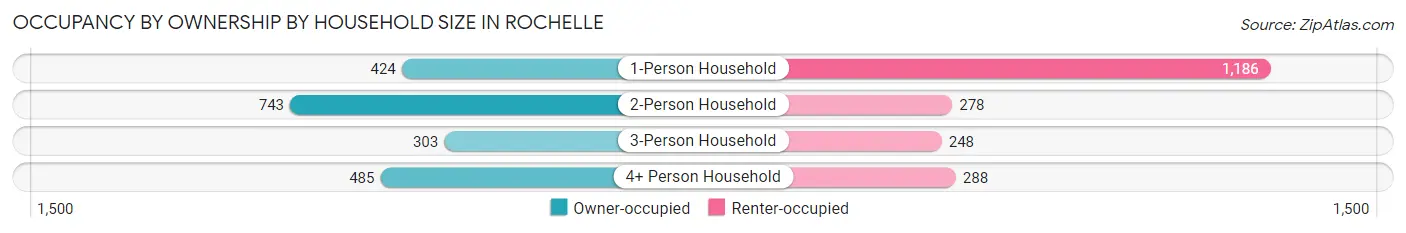
| Household Size | Owner-occupied | Renter-occupied |
| 1-Person Household | 424 (26.3%) | 1,186 (73.7%) |
| 2-Person Household | 743 (72.8%) | 278 (27.2%) |
| 3-Person Household | 303 (55.0%) | 248 (45.0%) |
| 4+ Person Household | 485 (62.7%) | 288 (37.3%) |
| Total Housing Units | 1,955 (49.4%) | 2,000 (50.6%) |
Occupancy by Educational Attainment in Rochelle
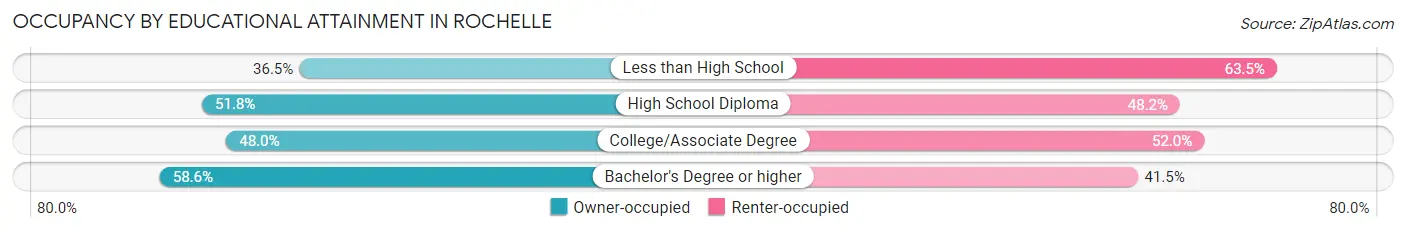
| Household Size | Owner-occupied | Renter-occupied |
| Less than High School | 210 (36.5%) | 366 (63.5%) |
| High School Diploma | 521 (51.8%) | 484 (48.2%) |
| College/Associate Degree | 755 (48.0%) | 818 (52.0%) |
| Bachelor's Degree or higher | 469 (58.6%) | 332 (41.4%) |
Occupancy by Age of Householder in Rochelle
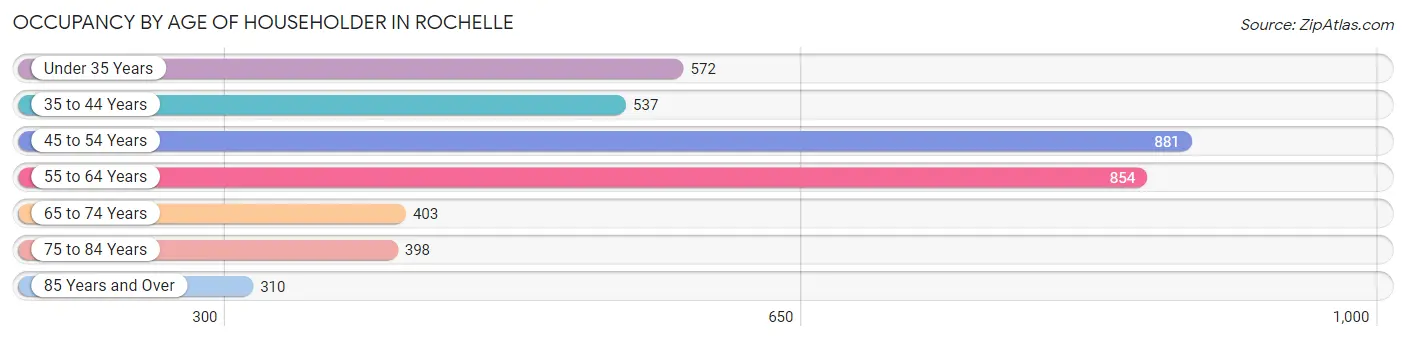
| Age Bracket | # Households | % Households |
| Under 35 Years | 572 | 14.5% |
| 35 to 44 Years | 537 | 13.6% |
| 45 to 54 Years | 881 | 22.3% |
| 55 to 64 Years | 854 | 21.6% |
| 65 to 74 Years | 403 | 10.2% |
| 75 to 84 Years | 398 | 10.1% |
| 85 Years and Over | 310 | 7.8% |
| Total | 3,955 | 100.0% |
Housing Finances in Rochelle
Median Income by Occupancy in Rochelle
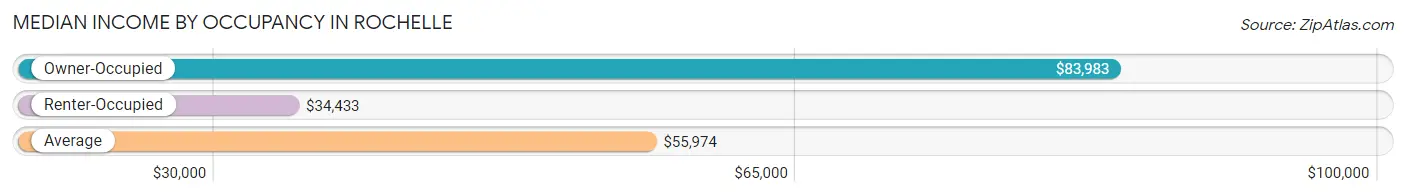
| Occupancy Type | # Households | Median Income |
| Owner-Occupied | 1,955 (49.4%) | $83,983 |
| Renter-Occupied | 2,000 (50.6%) | $34,433 |
| Average | 3,955 (100.0%) | $55,974 |
Occupancy by Householder Income Bracket in Rochelle
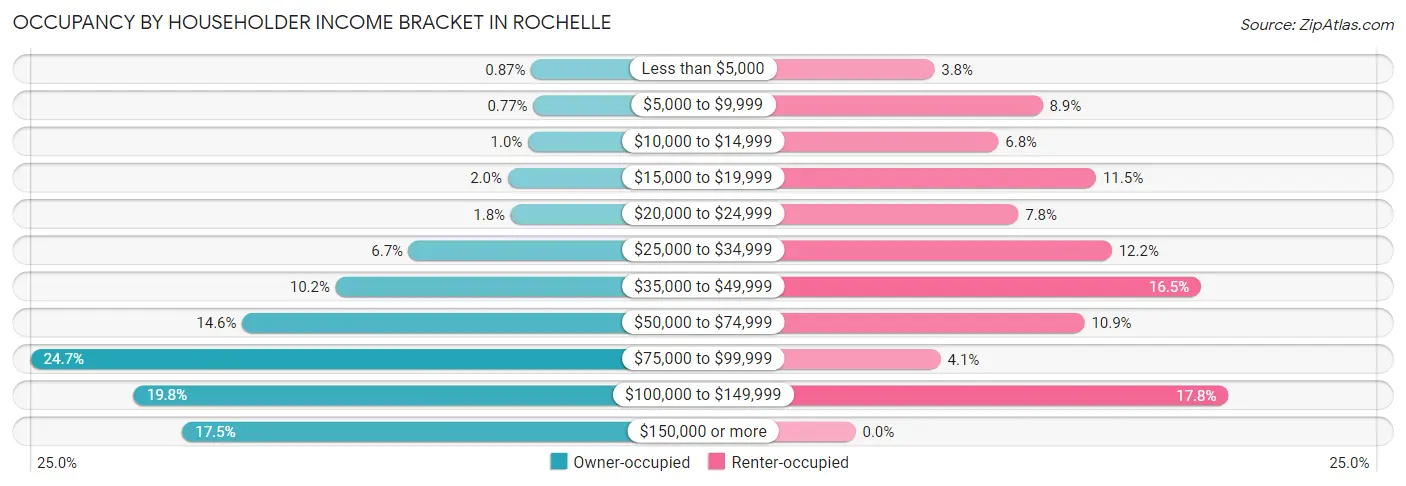
| Income Bracket | Owner-occupied | Renter-occupied |
| Less than $5,000 | 17 (0.9%) | 75 (3.7%) |
| $5,000 to $9,999 | 15 (0.8%) | 178 (8.9%) |
| $10,000 to $14,999 | 20 (1.0%) | 136 (6.8%) |
| $15,000 to $19,999 | 39 (2.0%) | 229 (11.5%) |
| $20,000 to $24,999 | 36 (1.8%) | 155 (7.7%) |
| $25,000 to $34,999 | 131 (6.7%) | 244 (12.2%) |
| $35,000 to $49,999 | 199 (10.2%) | 329 (16.5%) |
| $50,000 to $74,999 | 286 (14.6%) | 218 (10.9%) |
| $75,000 to $99,999 | 483 (24.7%) | 81 (4.1%) |
| $100,000 to $149,999 | 387 (19.8%) | 355 (17.7%) |
| $150,000 or more | 342 (17.5%) | 0 (0.0%) |
| Total | 1,955 (100.0%) | 2,000 (100.0%) |
Monthly Housing Cost Tiers in Rochelle
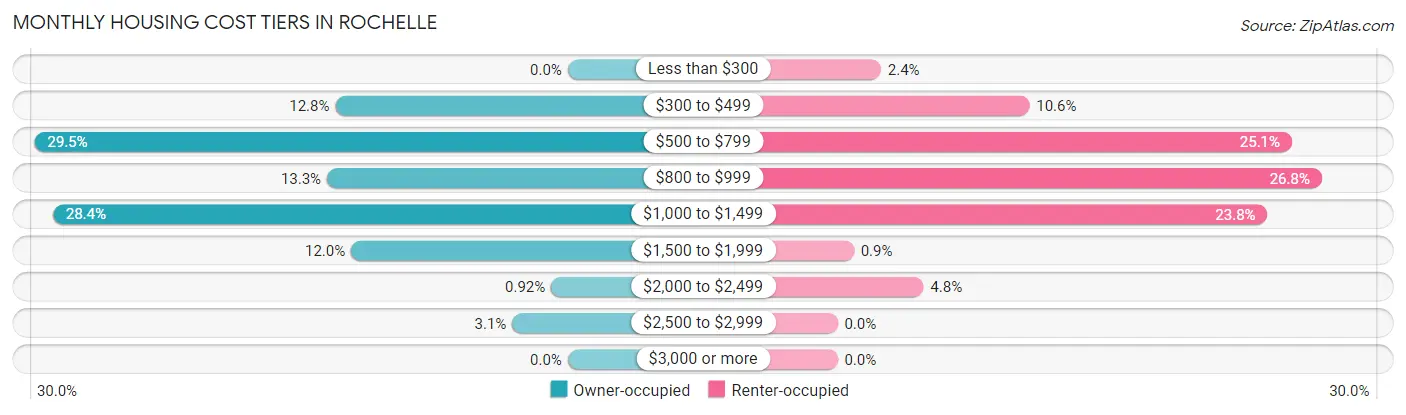
| Monthly Cost | Owner-occupied | Renter-occupied |
| Less than $300 | 0 (0.0%) | 48 (2.4%) |
| $300 to $499 | 251 (12.8%) | 212 (10.6%) |
| $500 to $799 | 576 (29.5%) | 502 (25.1%) |
| $800 to $999 | 260 (13.3%) | 535 (26.8%) |
| $1,000 to $1,499 | 556 (28.4%) | 475 (23.7%) |
| $1,500 to $1,999 | 234 (12.0%) | 18 (0.9%) |
| $2,000 to $2,499 | 18 (0.9%) | 95 (4.8%) |
| $2,500 to $2,999 | 60 (3.1%) | 0 (0.0%) |
| $3,000 or more | 0 (0.0%) | 0 (0.0%) |
| Total | 1,955 (100.0%) | 2,000 (100.0%) |
Physical Housing Characteristics in Rochelle
Housing Structures in Rochelle
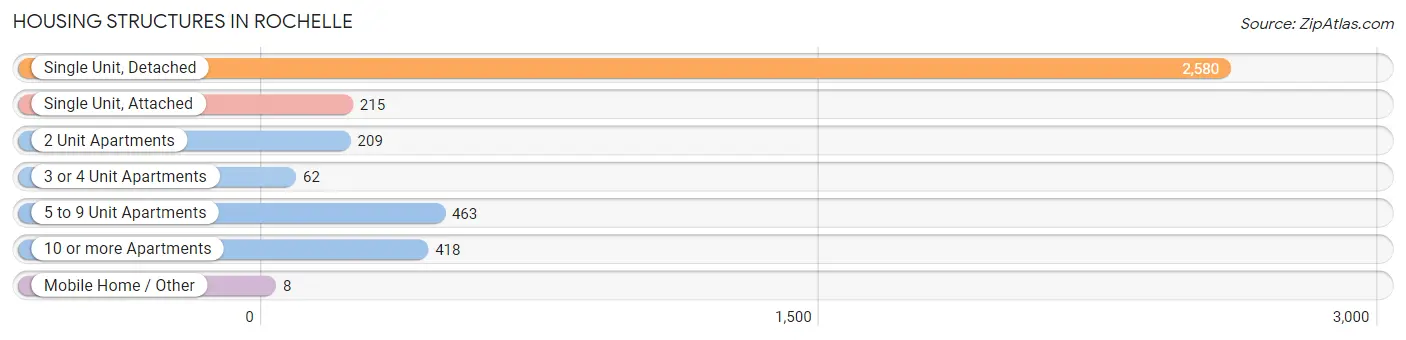
| Structure Type | # Housing Units | % Housing Units |
| Single Unit, Detached | 2,580 | 65.2% |
| Single Unit, Attached | 215 | 5.4% |
| 2 Unit Apartments | 209 | 5.3% |
| 3 or 4 Unit Apartments | 62 | 1.6% |
| 5 to 9 Unit Apartments | 463 | 11.7% |
| 10 or more Apartments | 418 | 10.6% |
| Mobile Home / Other | 8 | 0.2% |
| Total | 3,955 | 100.0% |
Housing Structures by Occupancy in Rochelle
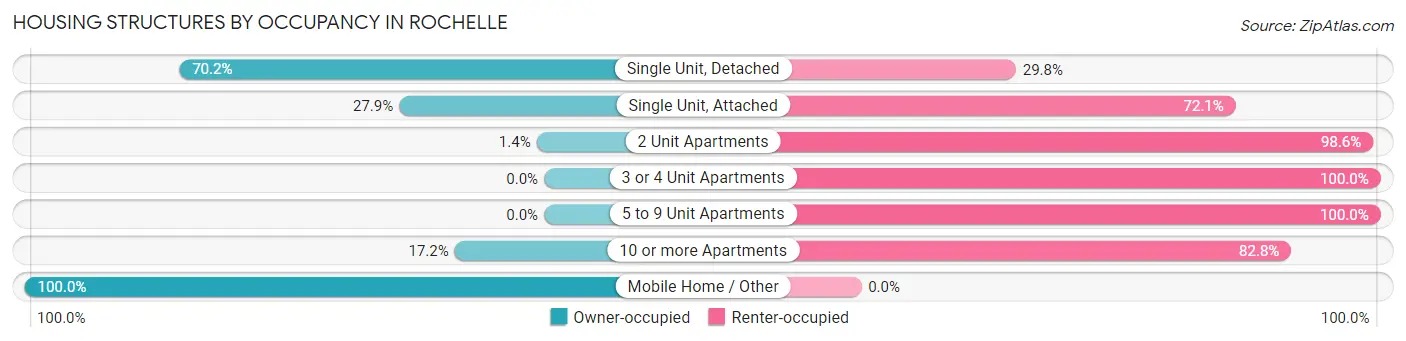
| Structure Type | Owner-occupied | Renter-occupied |
| Single Unit, Detached | 1,812 (70.2%) | 768 (29.8%) |
| Single Unit, Attached | 60 (27.9%) | 155 (72.1%) |
| 2 Unit Apartments | 3 (1.4%) | 206 (98.6%) |
| 3 or 4 Unit Apartments | 0 (0.0%) | 62 (100.0%) |
| 5 to 9 Unit Apartments | 0 (0.0%) | 463 (100.0%) |
| 10 or more Apartments | 72 (17.2%) | 346 (82.8%) |
| Mobile Home / Other | 8 (100.0%) | 0 (0.0%) |
| Total | 1,955 (49.4%) | 2,000 (50.6%) |
Housing Structures by Number of Rooms in Rochelle
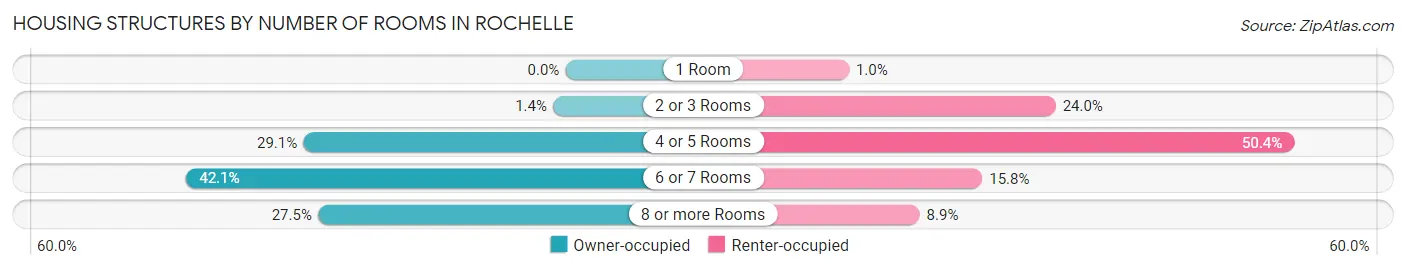
| Number of Rooms | Owner-occupied | Renter-occupied |
| 1 Room | 0 (0.0%) | 20 (1.0%) |
| 2 or 3 Rooms | 27 (1.4%) | 479 (23.9%) |
| 4 or 5 Rooms | 569 (29.1%) | 1,008 (50.4%) |
| 6 or 7 Rooms | 822 (42.0%) | 316 (15.8%) |
| 8 or more Rooms | 537 (27.5%) | 177 (8.8%) |
| Total | 1,955 (100.0%) | 2,000 (100.0%) |
Housing Structure by Heating Type in Rochelle
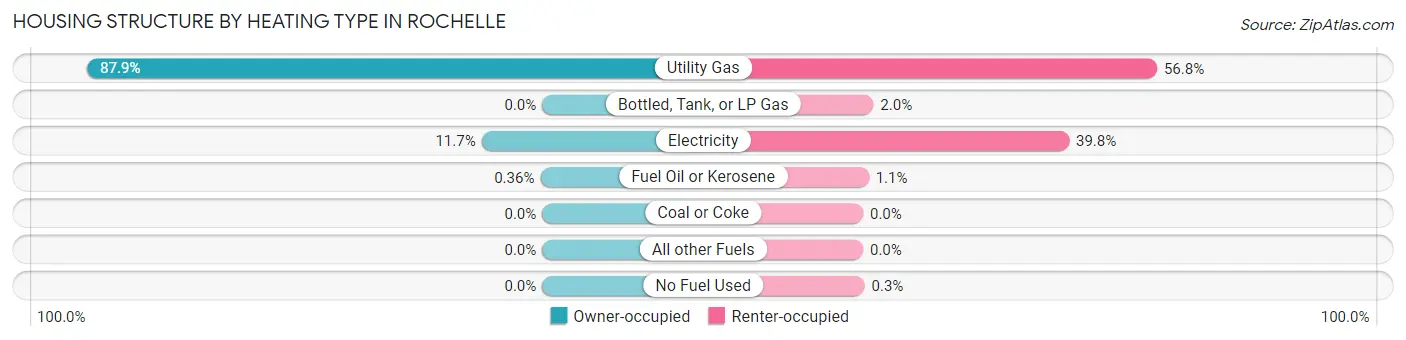
| Heating Type | Owner-occupied | Renter-occupied |
| Utility Gas | 1,719 (87.9%) | 1,136 (56.8%) |
| Bottled, Tank, or LP Gas | 0 (0.0%) | 40 (2.0%) |
| Electricity | 229 (11.7%) | 796 (39.8%) |
| Fuel Oil or Kerosene | 7 (0.4%) | 22 (1.1%) |
| Coal or Coke | 0 (0.0%) | 0 (0.0%) |
| All other Fuels | 0 (0.0%) | 0 (0.0%) |
| No Fuel Used | 0 (0.0%) | 6 (0.3%) |
| Total | 1,955 (100.0%) | 2,000 (100.0%) |
Household Vehicle Usage in Rochelle
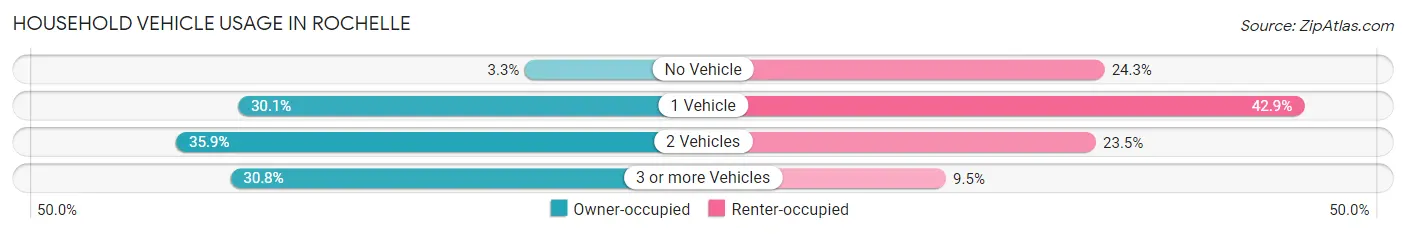
| Vehicles per Household | Owner-occupied | Renter-occupied |
| No Vehicle | 64 (3.3%) | 485 (24.2%) |
| 1 Vehicle | 588 (30.1%) | 857 (42.8%) |
| 2 Vehicles | 701 (35.9%) | 469 (23.4%) |
| 3 or more Vehicles | 602 (30.8%) | 189 (9.5%) |
| Total | 1,955 (100.0%) | 2,000 (100.0%) |
Real Estate & Mortgages in Rochelle
Real Estate and Mortgage Overview in Rochelle
| Characteristic | Without Mortgage | With Mortgage |
| Housing Units | 837 | 1,118 |
| Median Property Value | $136,100 | $140,500 |
| Median Household Income | $76,856 | $211 |
| Monthly Housing Costs | $617 | $0 |
| Real Estate Taxes | $3,148 | $9 |
Property Value by Mortgage Status in Rochelle
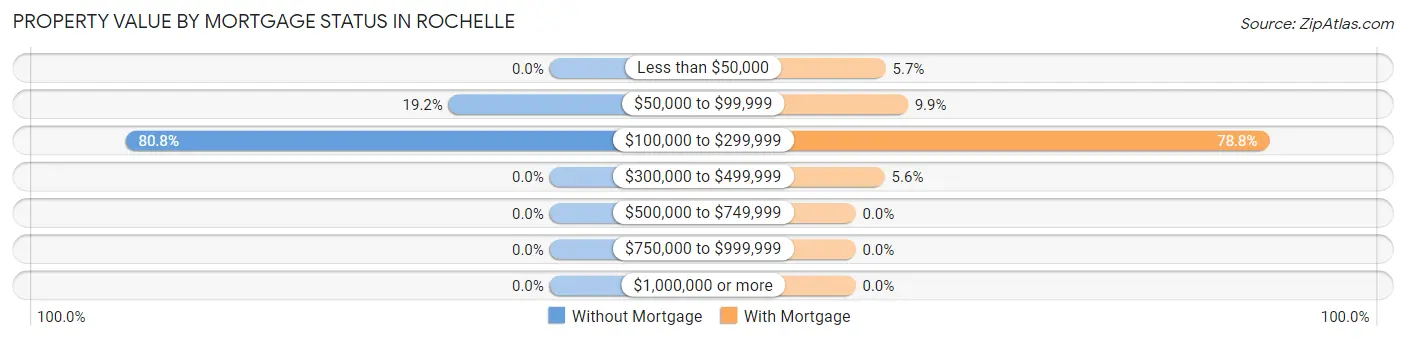
| Property Value | Without Mortgage | With Mortgage |
| Less than $50,000 | 0 (0.0%) | 64 (5.7%) |
| $50,000 to $99,999 | 161 (19.2%) | 111 (9.9%) |
| $100,000 to $299,999 | 676 (80.8%) | 881 (78.8%) |
| $300,000 to $499,999 | 0 (0.0%) | 62 (5.6%) |
| $500,000 to $749,999 | 0 (0.0%) | 0 (0.0%) |
| $750,000 to $999,999 | 0 (0.0%) | 0 (0.0%) |
| $1,000,000 or more | 0 (0.0%) | 0 (0.0%) |
| Total | 837 (100.0%) | 1,118 (100.0%) |
Household Income by Mortgage Status in Rochelle
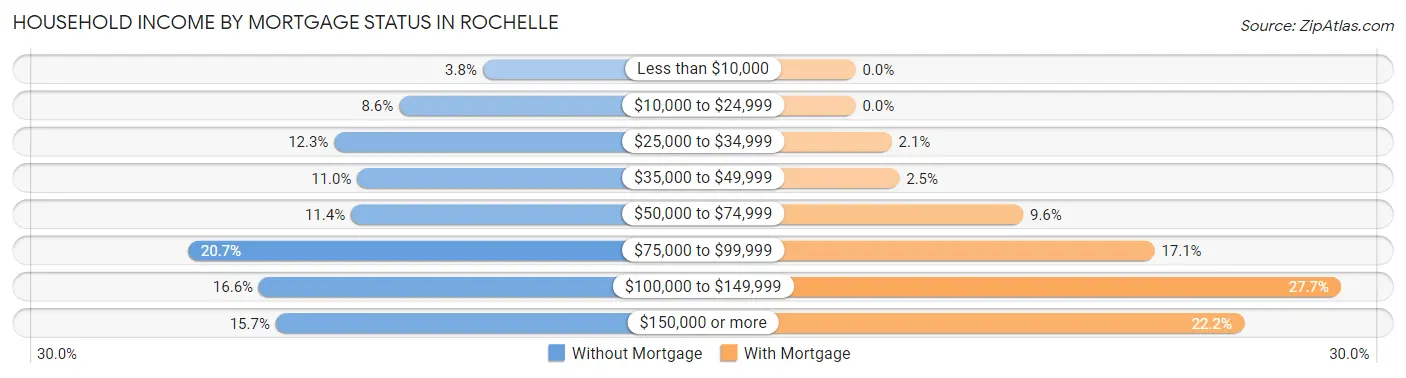
| Household Income | Without Mortgage | With Mortgage |
| Less than $10,000 | 32 (3.8%) | 0 (0.0%) |
| $10,000 to $24,999 | 72 (8.6%) | 0 (0.0%) |
| $25,000 to $34,999 | 103 (12.3%) | 23 (2.1%) |
| $35,000 to $49,999 | 92 (11.0%) | 28 (2.5%) |
| $50,000 to $74,999 | 95 (11.4%) | 107 (9.6%) |
| $75,000 to $99,999 | 173 (20.7%) | 191 (17.1%) |
| $100,000 to $149,999 | 139 (16.6%) | 310 (27.7%) |
| $150,000 or more | 131 (15.7%) | 248 (22.2%) |
| Total | 837 (100.0%) | 1,118 (100.0%) |
Property Value to Household Income Ratio in Rochelle
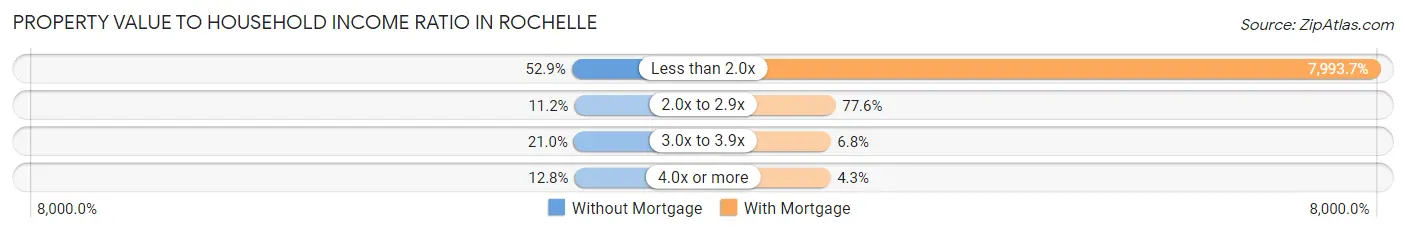
| Value-to-Income Ratio | Without Mortgage | With Mortgage |
| Less than 2.0x | 443 (52.9%) | 89,370 (7,993.7%) |
| 2.0x to 2.9x | 94 (11.2%) | 868 (77.6%) |
| 3.0x to 3.9x | 176 (21.0%) | 76 (6.8%) |
| 4.0x or more | 107 (12.8%) | 48 (4.3%) |
| Total | 837 (100.0%) | 1,118 (100.0%) |
Real Estate Taxes by Mortgage Status in Rochelle
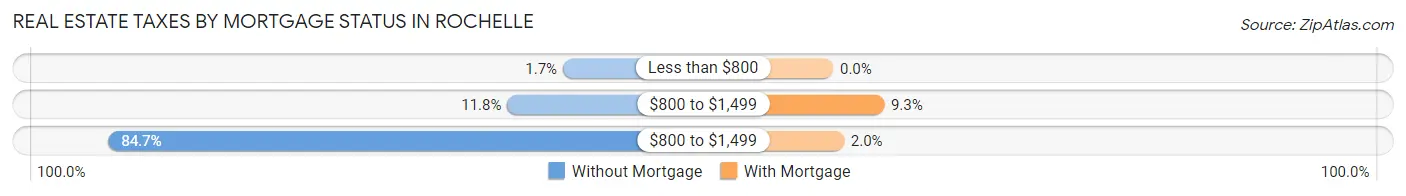
| Property Taxes | Without Mortgage | With Mortgage |
| Less than $800 | 14 (1.7%) | 0 (0.0%) |
| $800 to $1,499 | 99 (11.8%) | 104 (9.3%) |
| $800 to $1,499 | 709 (84.7%) | 22 (2.0%) |
| Total | 837 (100.0%) | 1,118 (100.0%) |
Health & Disability in Rochelle
Health Insurance Coverage by Age in Rochelle
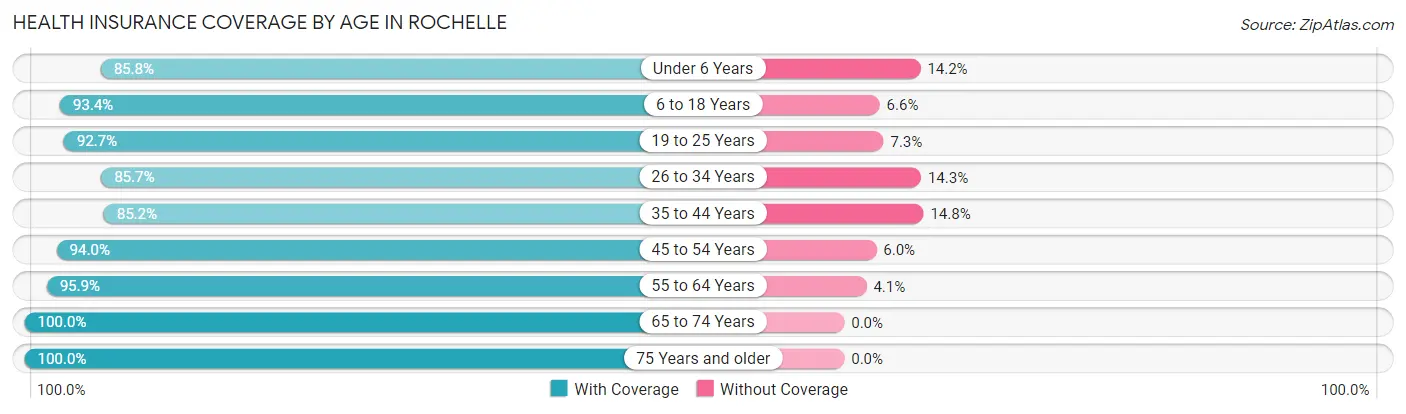
| Age Bracket | With Coverage | Without Coverage |
| Under 6 Years | 441 (85.8%) | 73 (14.2%) |
| 6 to 18 Years | 1,530 (93.4%) | 108 (6.6%) |
| 19 to 25 Years | 1,165 (92.7%) | 92 (7.3%) |
| 26 to 34 Years | 845 (85.7%) | 141 (14.3%) |
| 35 to 44 Years | 912 (85.2%) | 158 (14.8%) |
| 45 to 54 Years | 1,084 (94.0%) | 69 (6.0%) |
| 55 to 64 Years | 1,184 (95.9%) | 51 (4.1%) |
| 65 to 74 Years | 632 (100.0%) | 0 (0.0%) |
| 75 Years and older | 832 (100.0%) | 0 (0.0%) |
| Total | 8,625 (92.6%) | 692 (7.4%) |
Health Insurance Coverage by Citizenship Status in Rochelle
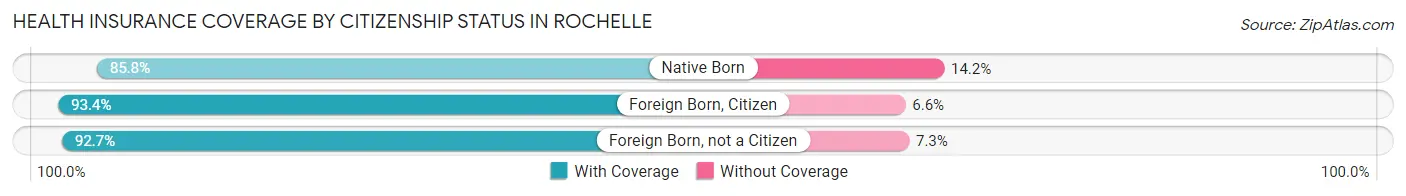
| Citizenship Status | With Coverage | Without Coverage |
| Native Born | 441 (85.8%) | 73 (14.2%) |
| Foreign Born, Citizen | 1,530 (93.4%) | 108 (6.6%) |
| Foreign Born, not a Citizen | 1,165 (92.7%) | 92 (7.3%) |
Health Insurance Coverage by Household Income in Rochelle
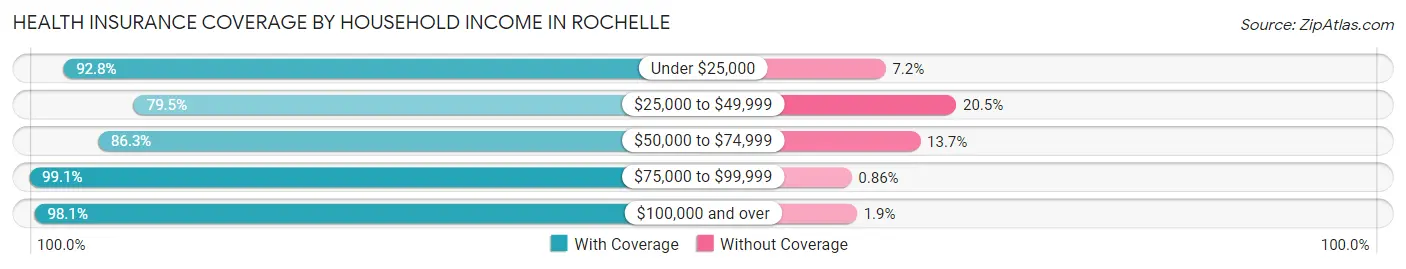
| Household Income | With Coverage | Without Coverage |
| Under $25,000 | 1,205 (92.8%) | 94 (7.2%) |
| $25,000 to $49,999 | 1,430 (79.5%) | 368 (20.5%) |
| $50,000 to $74,999 | 967 (86.3%) | 154 (13.7%) |
| $75,000 to $99,999 | 1,849 (99.1%) | 16 (0.9%) |
| $100,000 and over | 3,158 (98.1%) | 60 (1.9%) |
Public vs Private Health Insurance Coverage by Age in Rochelle
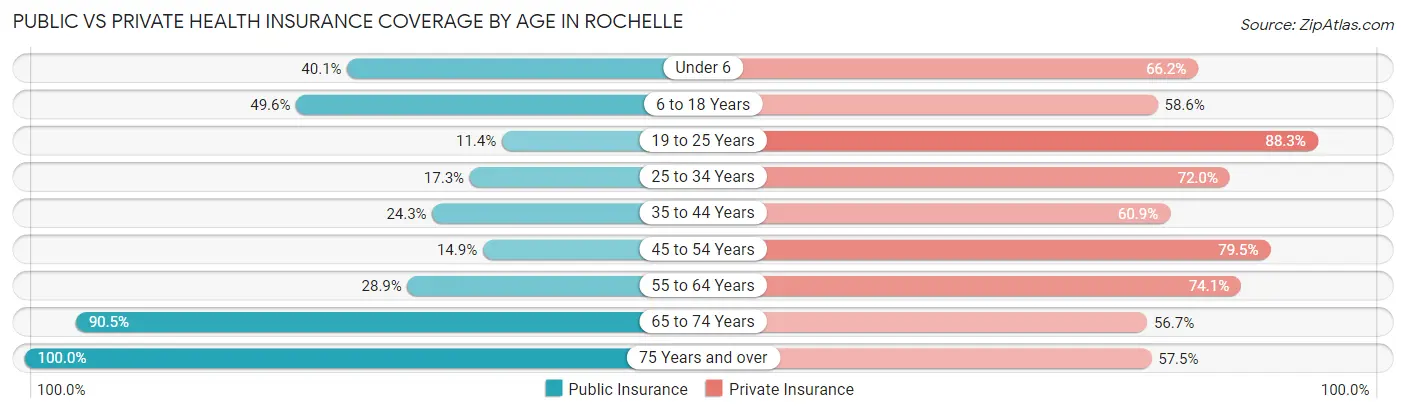
| Age Bracket | Public Insurance | Private Insurance |
| Under 6 | 206 (40.1%) | 340 (66.1%) |
| 6 to 18 Years | 812 (49.6%) | 960 (58.6%) |
| 19 to 25 Years | 143 (11.4%) | 1,110 (88.3%) |
| 25 to 34 Years | 171 (17.3%) | 710 (72.0%) |
| 35 to 44 Years | 260 (24.3%) | 652 (60.9%) |
| 45 to 54 Years | 172 (14.9%) | 917 (79.5%) |
| 55 to 64 Years | 357 (28.9%) | 915 (74.1%) |
| 65 to 74 Years | 572 (90.5%) | 358 (56.7%) |
| 75 Years and over | 832 (100.0%) | 478 (57.5%) |
| Total | 3,525 (37.8%) | 6,440 (69.1%) |
Disability Status by Sex by Age in Rochelle
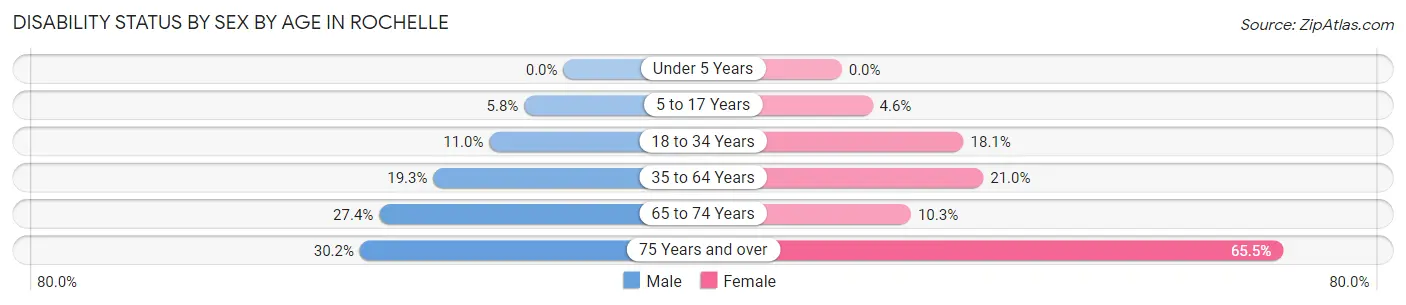
| Age Bracket | Male | Female |
| Under 5 Years | 0 (0.0%) | 0 (0.0%) |
| 5 to 17 Years | 48 (5.8%) | 31 (4.6%) |
| 18 to 34 Years | 137 (11.0%) | 223 (18.1%) |
| 35 to 64 Years | 323 (19.3%) | 375 (21.0%) |
| 65 to 74 Years | 93 (27.4%) | 30 (10.3%) |
| 75 Years and over | 78 (30.2%) | 376 (65.5%) |
Disability Class by Sex by Age in Rochelle
Disability Class: Hearing Difficulty
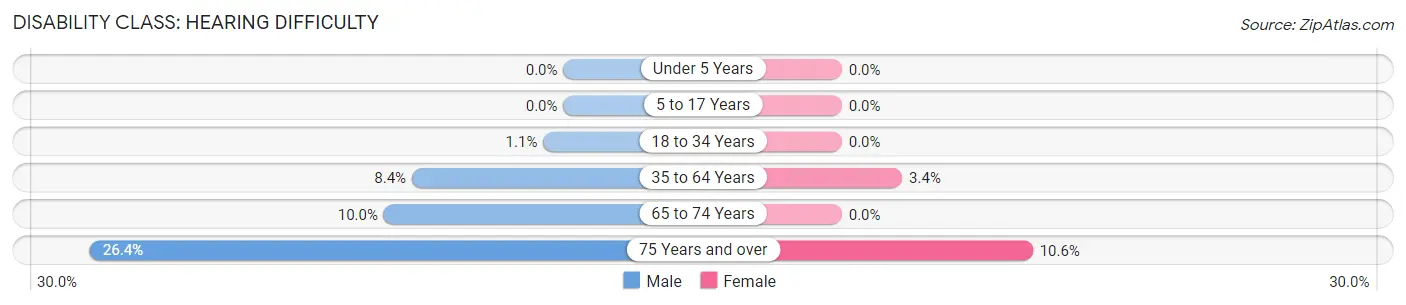
| Age Bracket | Male | Female |
| Under 5 Years | 0 (0.0%) | 0 (0.0%) |
| 5 to 17 Years | 0 (0.0%) | 0 (0.0%) |
| 18 to 34 Years | 14 (1.1%) | 0 (0.0%) |
| 35 to 64 Years | 141 (8.4%) | 60 (3.4%) |
| 65 to 74 Years | 34 (10.0%) | 0 (0.0%) |
| 75 Years and over | 68 (26.4%) | 61 (10.6%) |
Disability Class: Vision Difficulty
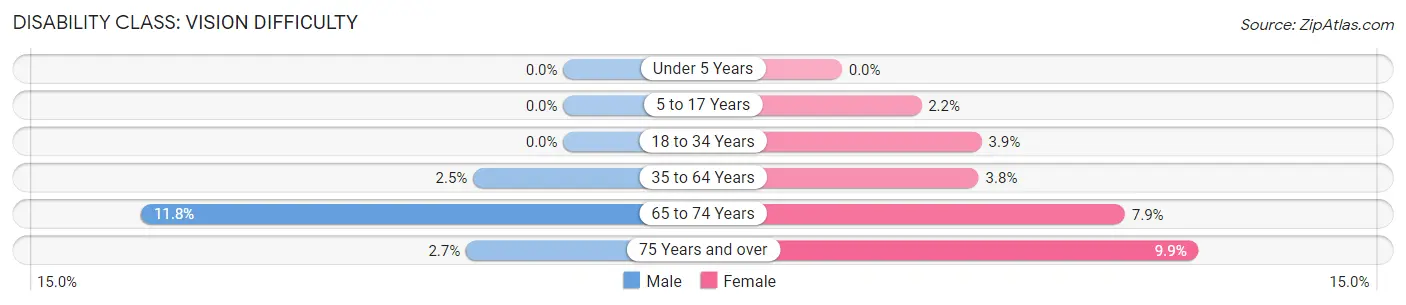
| Age Bracket | Male | Female |
| Under 5 Years | 0 (0.0%) | 0 (0.0%) |
| 5 to 17 Years | 0 (0.0%) | 15 (2.2%) |
| 18 to 34 Years | 0 (0.0%) | 48 (3.9%) |
| 35 to 64 Years | 42 (2.5%) | 68 (3.8%) |
| 65 to 74 Years | 40 (11.8%) | 23 (7.9%) |
| 75 Years and over | 7 (2.7%) | 57 (9.9%) |
Disability Class: Cognitive Difficulty
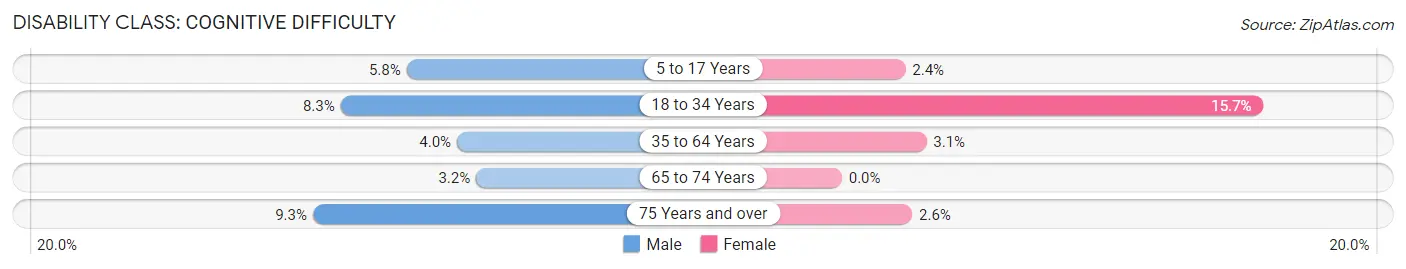
| Age Bracket | Male | Female |
| 5 to 17 Years | 48 (5.8%) | 16 (2.4%) |
| 18 to 34 Years | 103 (8.3%) | 193 (15.7%) |
| 35 to 64 Years | 66 (4.0%) | 56 (3.1%) |
| 65 to 74 Years | 11 (3.2%) | 0 (0.0%) |
| 75 Years and over | 24 (9.3%) | 15 (2.6%) |
Disability Class: Ambulatory Difficulty
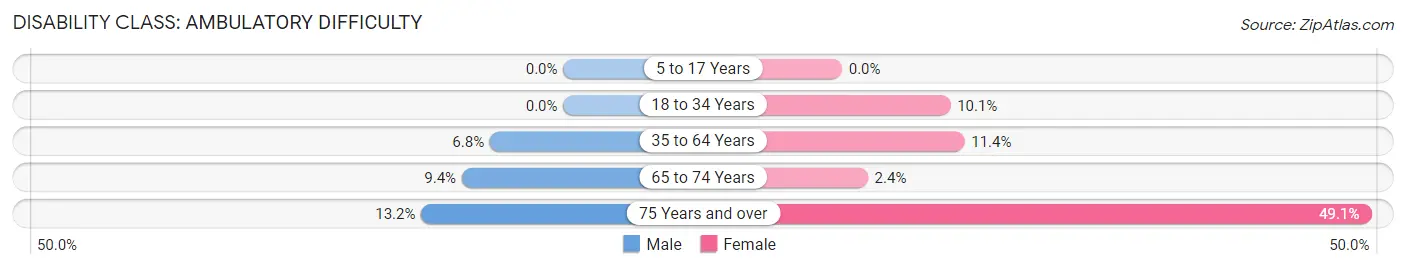
| Age Bracket | Male | Female |
| 5 to 17 Years | 0 (0.0%) | 0 (0.0%) |
| 18 to 34 Years | 0 (0.0%) | 124 (10.1%) |
| 35 to 64 Years | 114 (6.8%) | 203 (11.4%) |
| 65 to 74 Years | 32 (9.4%) | 7 (2.4%) |
| 75 Years and over | 34 (13.2%) | 282 (49.1%) |
Disability Class: Self-Care Difficulty
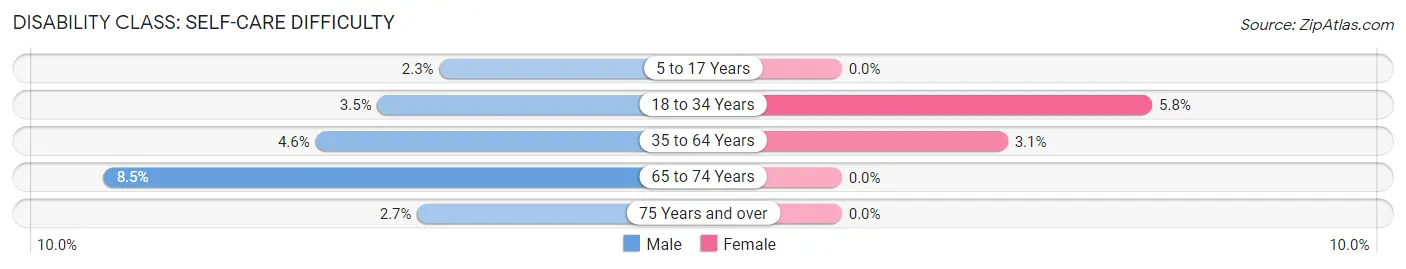
| Age Bracket | Male | Female |
| 5 to 17 Years | 19 (2.3%) | 0 (0.0%) |
| 18 to 34 Years | 43 (3.5%) | 71 (5.8%) |
| 35 to 64 Years | 77 (4.6%) | 55 (3.1%) |
| 65 to 74 Years | 29 (8.5%) | 0 (0.0%) |
| 75 Years and over | 7 (2.7%) | 0 (0.0%) |
Technology Access in Rochelle
Computing Device Access in Rochelle
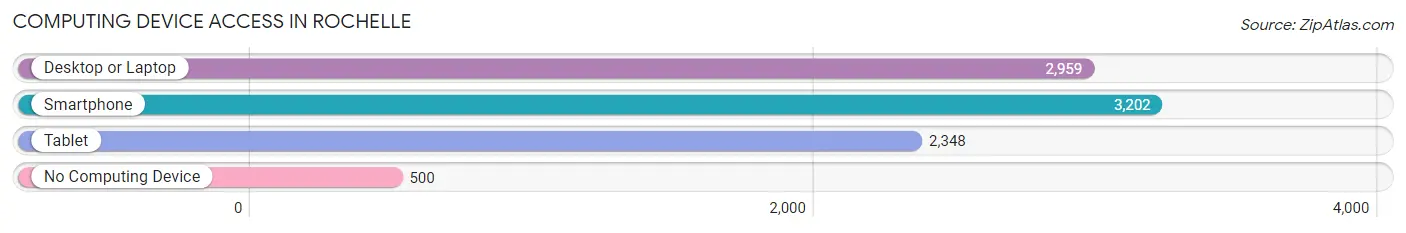
| Device Type | # Households | % Households |
| Desktop or Laptop | 2,959 | 74.8% |
| Smartphone | 3,202 | 81.0% |
| Tablet | 2,348 | 59.4% |
| No Computing Device | 500 | 12.6% |
| Total | 3,955 | 100.0% |
Internet Access in Rochelle
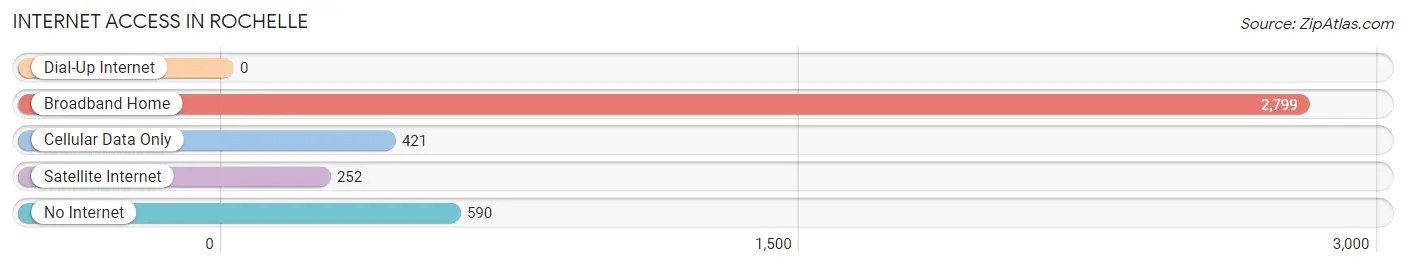
| Internet Type | # Households | % Households |
| Dial-Up Internet | 0 | 0.0% |
| Broadband Home | 2,799 | 70.8% |
| Cellular Data Only | 421 | 10.6% |
| Satellite Internet | 252 | 6.4% |
| No Internet | 590 | 14.9% |
| Total | 3,955 | 100.0% |
Rochelle Summary
Rochelle, Illinois is a small city located in Ogle County, Illinois, United States. It is situated about 80 miles west of Chicago and is part of the Rockford metropolitan area. The city has a population of 9,574 as of the 2010 census.
History
Rochelle was founded in 1856 by a group of settlers from New York. The city was named after the wife of one of the settlers, who was from Rochelle, France. The city was incorporated in 1872 and has since grown to become a major transportation hub in the region.
Geography
Rochelle is located at 41°59'N, 89°4'W (41.983, -89.067). According to the United States Census Bureau, the city has a total area of 5.2 square miles (13.4 km2), all of it land.
Economy
Rochelle is a major transportation hub in the region, with several major highways and railroads intersecting in the city. The city is home to several major employers, including the Union Pacific Railroad, Nestle USA, and the Rochelle Foods Corporation. The city also has a thriving agricultural sector, with several large farms located in the area.
Demographics
As of the 2010 census, there were 9,574 people, 3,717 households, and 2,521 families residing in the city. The population density was 1,845.3 people per square mile (715.2/km2). The racial makeup of the city was 87.2% White, 0.7% African American, 0.3% Native American, 0.7% Asian, 0.1% Pacific Islander, 9.2% from other races, and 2.0% from two or more races. Hispanic or Latino of any race were 18.2% of the population.
The median income for a household in the city was $45,945, and the median income for a family was $54,945. The per capita income for the city was $21,945. About 8.2% of families and 11.2% of the population were below the poverty line, including 15.2% of those under age 18 and 8.2% of those age 65 or over.
Rochelle is a diverse city, with a variety of cultures and backgrounds represented in the population. The city is home to a large Hispanic population, as well as a growing Asian population. The city also has a large number of immigrants from other countries, including Mexico, India, and the Philippines.
Common Questions
What is Per Capita Income in Rochelle?
Per Capita income in Rochelle is $30,949.
What is the Median Family Income in Rochelle?
Median Family Income in Rochelle is $76,924.
What is the Median Household income in Rochelle?
Median Household Income in Rochelle is $55,974.
What is Income or Wage Gap in Rochelle?
Income or Wage Gap in Rochelle is 42.0%.
Women in Rochelle earn 58.0 cents for every dollar earned by a man.
What is Inequality or Gini Index in Rochelle?
Inequality or Gini Index in Rochelle is 0.42.
What is the Total Population of Rochelle?
Total Population of Rochelle is 9,417.
What is the Total Male Population of Rochelle?
Total Male Population of Rochelle is 4,651.
What is the Total Female Population of Rochelle?
Total Female Population of Rochelle is 4,766.
What is the Ratio of Males per 100 Females in Rochelle?
There are 97.59 Males per 100 Females in Rochelle.
What is the Ratio of Females per 100 Males in Rochelle?
There are 102.47 Females per 100 Males in Rochelle.
What is the Median Population Age in Rochelle?
Median Population Age in Rochelle is 37.9 Years.
What is the Average Family Size in Rochelle
Average Family Size in Rochelle is 3.2 People.
What is the Average Household Size in Rochelle
Average Household Size in Rochelle is 2.4 People.
How Large is the Labor Force in Rochelle?
There are 5,285 People in the Labor Forcein in Rochelle.
What is the Percentage of People in the Labor Force in Rochelle?
68.0% of People are in the Labor Force in Rochelle.
What is the Unemployment Rate in Rochelle?
Unemployment Rate in Rochelle is 10.9%.