Flat Rock, IL Map & Demographics
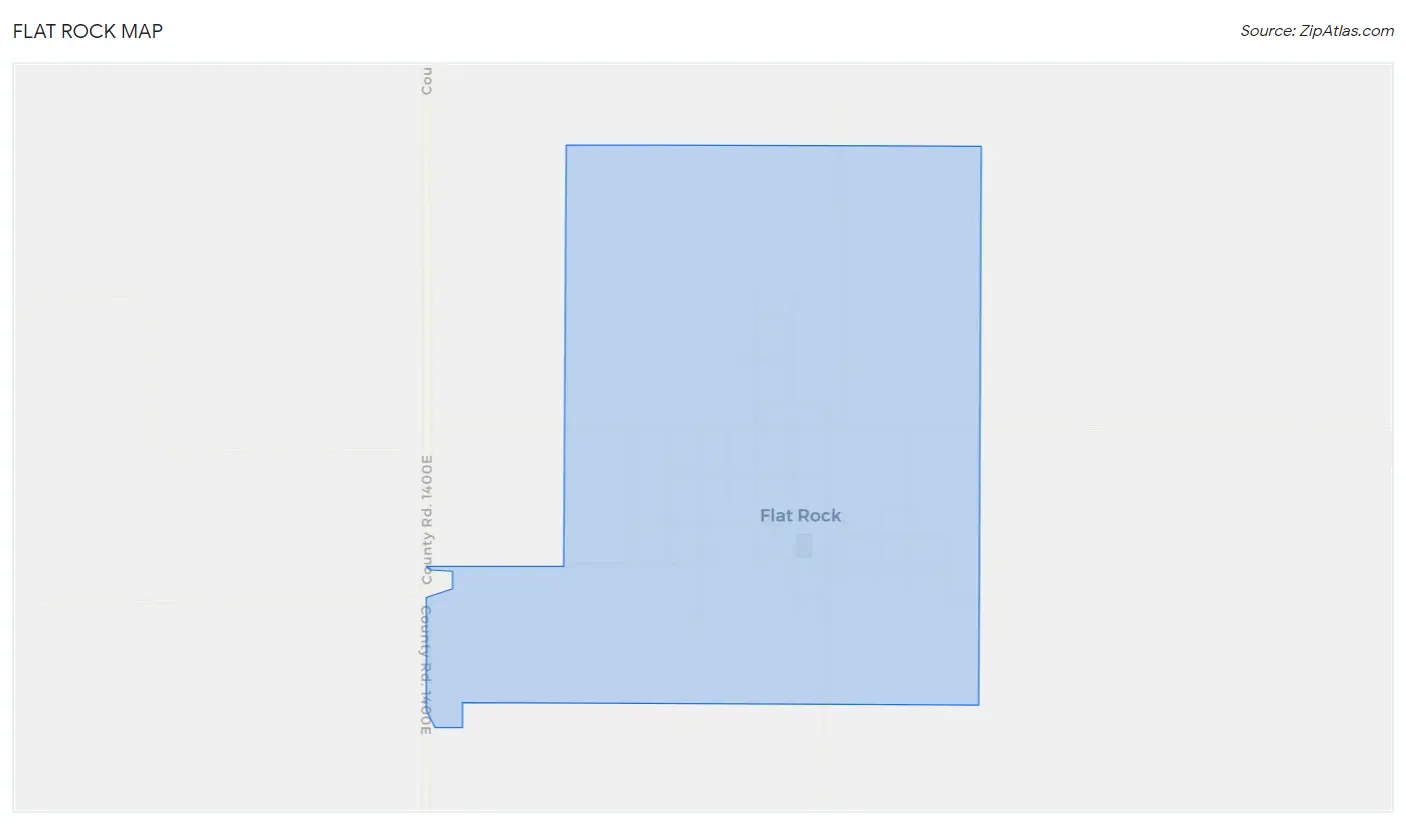
Flat Rock Map
Flat Rock Overview
$24,601
PER CAPITA INCOME
$57,045
AVG FAMILY INCOME
$52,625
AVG HOUSEHOLD INCOME
42.6%
WAGE / INCOME GAP [ % ]
57.4¢/ $1
WAGE / INCOME GAP [ $ ]
0.37
INEQUALITY / GINI INDEX
455
TOTAL POPULATION
230
MALE POPULATION
225
FEMALE POPULATION
102.22
MALES / 100 FEMALES
97.83
FEMALES / 100 MALES
34.1
MEDIAN AGE
3.3
AVG FAMILY SIZE
2.5
AVG HOUSEHOLD SIZE
209
LABOR FORCE [ PEOPLE ]
62.0%
PERCENT IN LABOR FORCE
7.2%
UNEMPLOYMENT RATE
Flat Rock Zip Codes
Flat Rock Area Codes
Income in Flat Rock
Income Overview in Flat Rock
Per Capita Income in Flat Rock is $24,601, while median incomes of families and households are $57,045 and $52,625 respectively.
| Characteristic | Number | Measure |
| Per Capita Income | 455 | $24,601 |
| Median Family Income | 112 | $57,045 |
| Mean Family Income | 112 | $66,088 |
| Median Household Income | 179 | $52,625 |
| Mean Household Income | 179 | $57,765 |
| Income Deficit | 112 | $0 |
| Wage / Income Gap (%) | 455 | 42.64% |
| Wage / Income Gap ($) | 455 | 57.36¢ per $1 |
| Gini / Inequality Index | 455 | 0.37 |
Earnings by Sex in Flat Rock
Average Earnings in Flat Rock are $37,857, $45,221 for men and $25,938 for women, a difference of 42.6%.
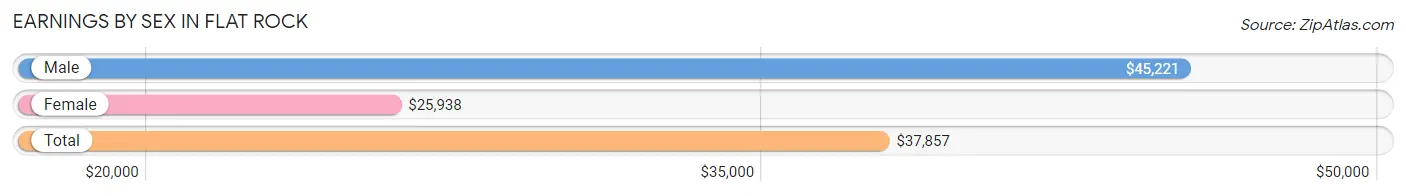
| Sex | Number | Average Earnings |
| Male | 123 (58.0%) | $45,221 |
| Female | 89 (42.0%) | $25,938 |
| Total | 212 (100.0%) | $37,857 |
Earnings by Sex by Income Bracket in Flat Rock
The most common earnings brackets in Flat Rock are $45,000 to $49,999 for men (22 | 17.9%) and $25,000 to $29,999 for women (14 | 15.7%).
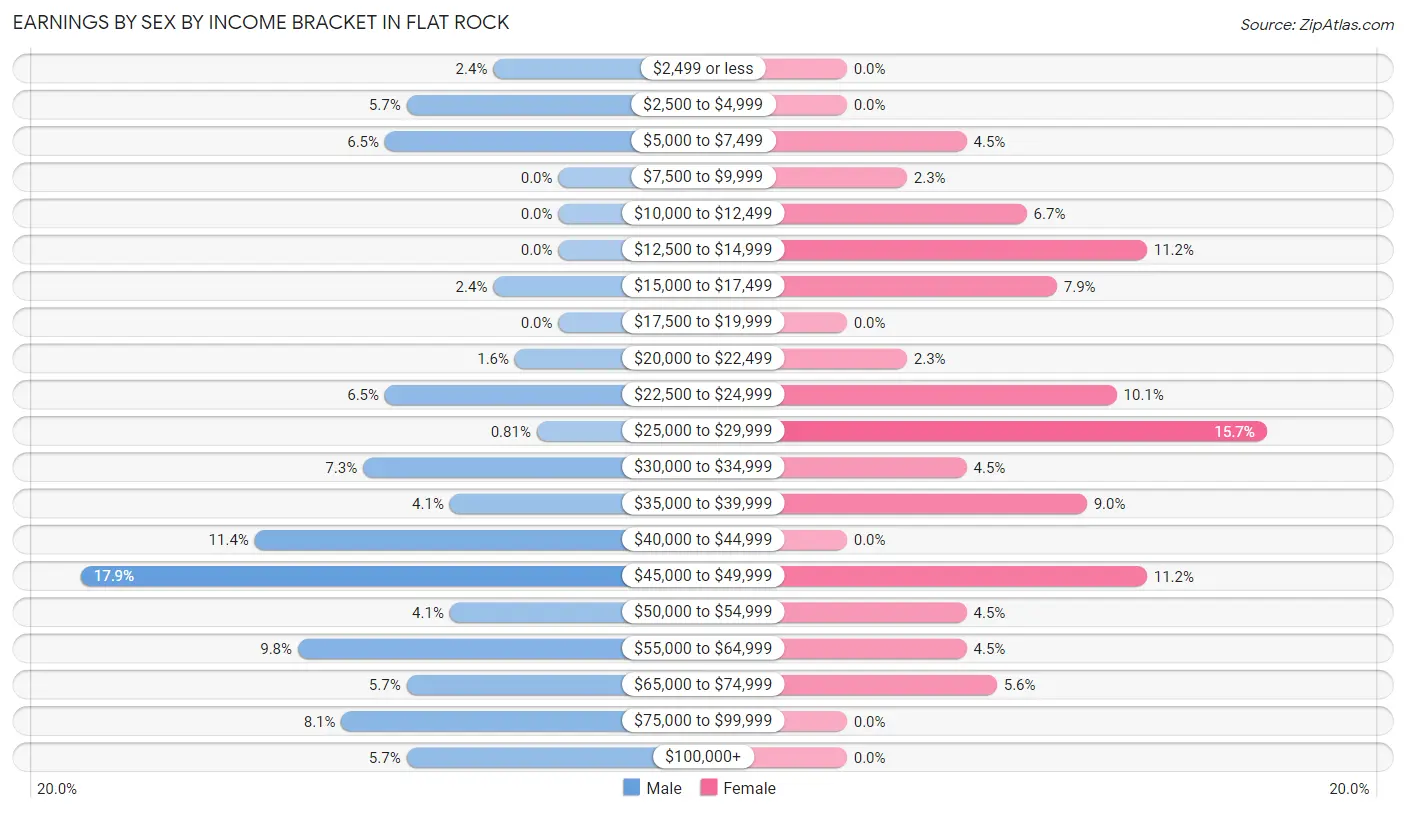
| Income | Male | Female |
| $2,499 or less | 3 (2.4%) | 0 (0.0%) |
| $2,500 to $4,999 | 7 (5.7%) | 0 (0.0%) |
| $5,000 to $7,499 | 8 (6.5%) | 4 (4.5%) |
| $7,500 to $9,999 | 0 (0.0%) | 2 (2.2%) |
| $10,000 to $12,499 | 0 (0.0%) | 6 (6.7%) |
| $12,500 to $14,999 | 0 (0.0%) | 10 (11.2%) |
| $15,000 to $17,499 | 3 (2.4%) | 7 (7.9%) |
| $17,500 to $19,999 | 0 (0.0%) | 0 (0.0%) |
| $20,000 to $22,499 | 2 (1.6%) | 2 (2.2%) |
| $22,500 to $24,999 | 8 (6.5%) | 9 (10.1%) |
| $25,000 to $29,999 | 1 (0.8%) | 14 (15.7%) |
| $30,000 to $34,999 | 9 (7.3%) | 4 (4.5%) |
| $35,000 to $39,999 | 5 (4.1%) | 8 (9.0%) |
| $40,000 to $44,999 | 14 (11.4%) | 0 (0.0%) |
| $45,000 to $49,999 | 22 (17.9%) | 10 (11.2%) |
| $50,000 to $54,999 | 5 (4.1%) | 4 (4.5%) |
| $55,000 to $64,999 | 12 (9.8%) | 4 (4.5%) |
| $65,000 to $74,999 | 7 (5.7%) | 5 (5.6%) |
| $75,000 to $99,999 | 10 (8.1%) | 0 (0.0%) |
| $100,000+ | 7 (5.7%) | 0 (0.0%) |
| Total | 123 (100.0%) | 89 (100.0%) |
Earnings by Sex by Educational Attainment in Flat Rock
Average earnings in Flat Rock are $46,765 for men and $25,625 for women, a difference of 45.2%. Men with an educational attainment of high school diploma enjoy the highest average annual earnings of $54,000, while those with bachelor's degree education earn the least with $43,125. Women with an educational attainment of bachelor's degree earn the most with the average annual earnings of $53,750, while those with college or associate's degree education have the smallest earnings of $25,417.
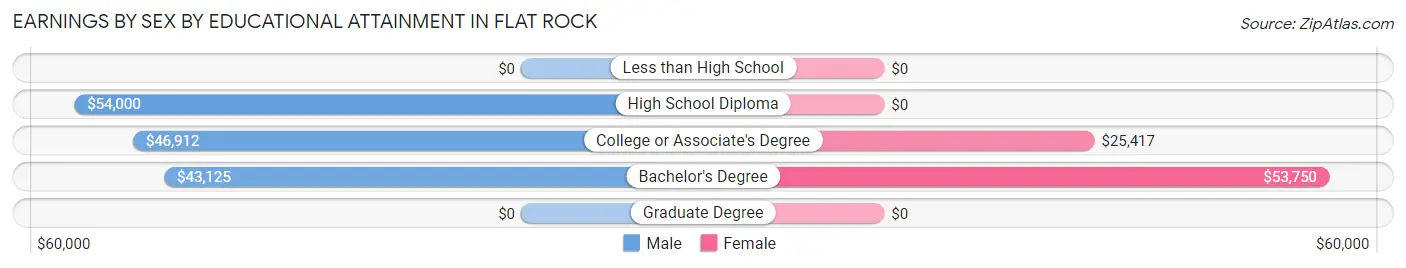
| Educational Attainment | Male Income | Female Income |
| Less than High School | - | - |
| High School Diploma | $54,000 | $0 |
| College or Associate's Degree | $46,912 | $25,417 |
| Bachelor's Degree | $43,125 | $53,750 |
| Graduate Degree | - | - |
| Total | $46,765 | $25,625 |
Family Income in Flat Rock
Family Income Brackets in Flat Rock
According to the Flat Rock family income data, there are 41 families falling into the $50,000 to $74,999 income range, which is the most common income bracket and makes up 36.6% of all families.
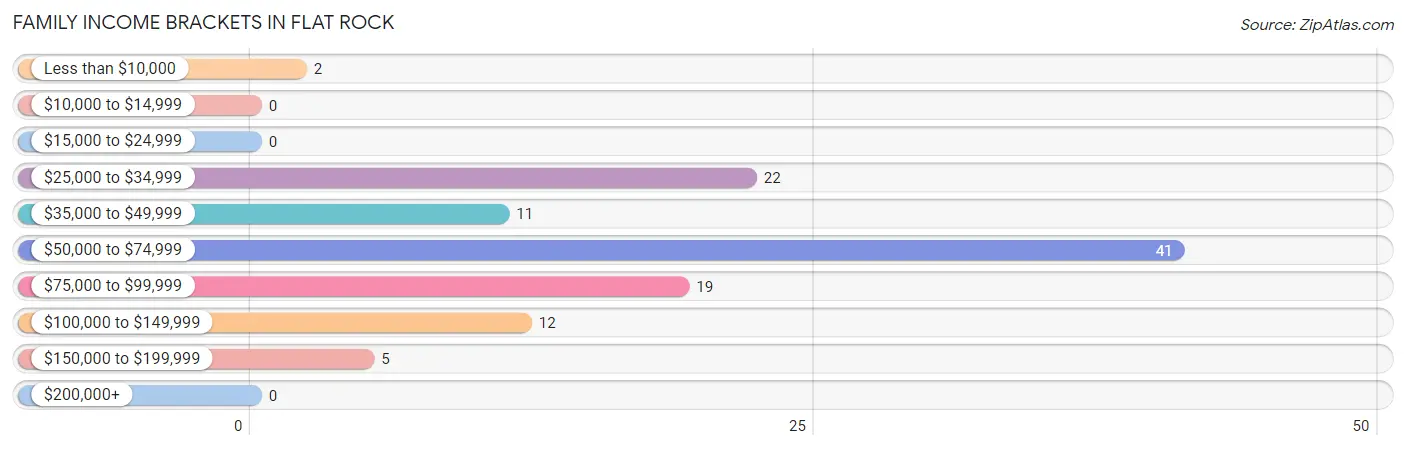
| Income Bracket | # Families | % Families |
| Less than $10,000 | 2 | 1.8% |
| $10,000 to $14,999 | 0 | 0.0% |
| $15,000 to $24,999 | 0 | 0.0% |
| $25,000 to $34,999 | 22 | 19.6% |
| $35,000 to $49,999 | 11 | 9.8% |
| $50,000 to $74,999 | 41 | 36.6% |
| $75,000 to $99,999 | 19 | 17.0% |
| $100,000 to $149,999 | 12 | 10.7% |
| $150,000 to $199,999 | 5 | 4.5% |
| $200,000+ | 0 | 0.0% |
Family Income by Famaliy Size in Flat Rock
3-person families (28 | 25.0%) account for the highest median family income in Flat Rock with $59,167 per family, while 2-person families (50 | 44.6%) have the highest median income of $27,500 per family member.
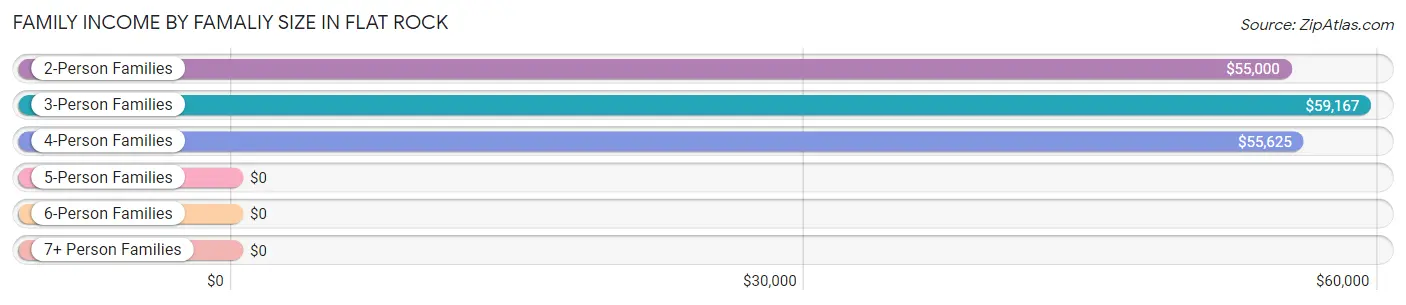
| Income Bracket | # Families | Median Income |
| 2-Person Families | 50 (44.6%) | $55,000 |
| 3-Person Families | 28 (25.0%) | $59,167 |
| 4-Person Families | 23 (20.5%) | $55,625 |
| 5-Person Families | 11 (9.8%) | $0 |
| 6-Person Families | 0 (0.0%) | $0 |
| 7+ Person Families | 0 (0.0%) | $0 |
| Total | 112 (100.0%) | $57,045 |
Family Income by Number of Earners in Flat Rock
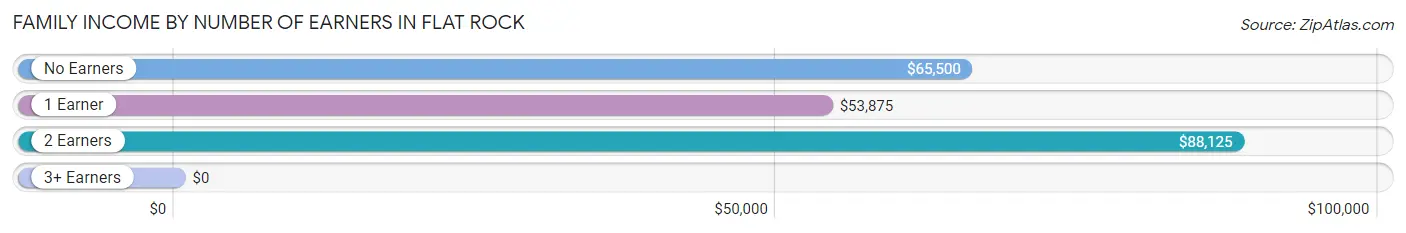
| Number of Earners | # Families | Median Income |
| No Earners | 16 (14.3%) | $65,500 |
| 1 Earner | 51 (45.5%) | $53,875 |
| 2 Earners | 42 (37.5%) | $88,125 |
| 3+ Earners | 3 (2.7%) | $0 |
| Total | 112 (100.0%) | $57,045 |
Household Income in Flat Rock
Household Income Brackets in Flat Rock
With 46 households falling in the category, the $50,000 to $74,999 income range is the most frequent in Flat Rock, accounting for 25.7% of all households. In contrast, only 2 households (1.1%) fall into the $200,000+ income bracket, making it the least populous group.
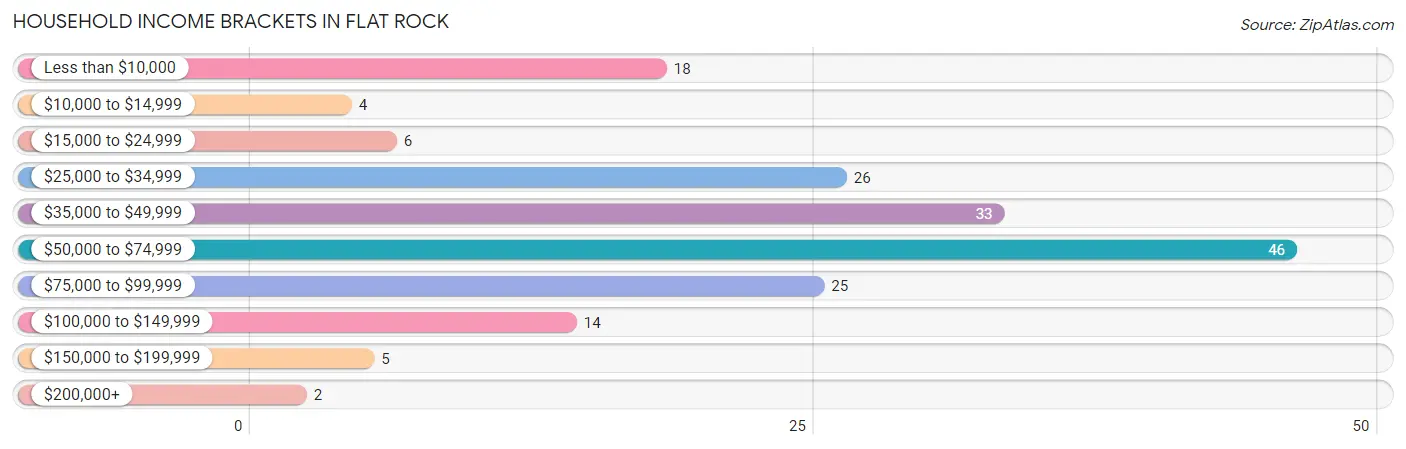
| Income Bracket | # Households | % Households |
| Less than $10,000 | 18 | 10.1% |
| $10,000 to $14,999 | 4 | 2.2% |
| $15,000 to $24,999 | 6 | 3.4% |
| $25,000 to $34,999 | 26 | 14.5% |
| $35,000 to $49,999 | 33 | 18.4% |
| $50,000 to $74,999 | 46 | 25.7% |
| $75,000 to $99,999 | 25 | 14.0% |
| $100,000 to $149,999 | 14 | 7.8% |
| $150,000 to $199,999 | 5 | 2.8% |
| $200,000+ | 2 | 1.1% |
Household Income by Householder Age in Flat Rock
The median household income in Flat Rock is $52,625, with the highest median household income of $55,000 found in the 25 to 44 years age bracket for the primary householder. A total of 68 households (38.0%) fall into this category. Meanwhile, the 15 to 24 years age bracket for the primary householder has the lowest median household income of $0, with 10 households (5.6%) in this group.
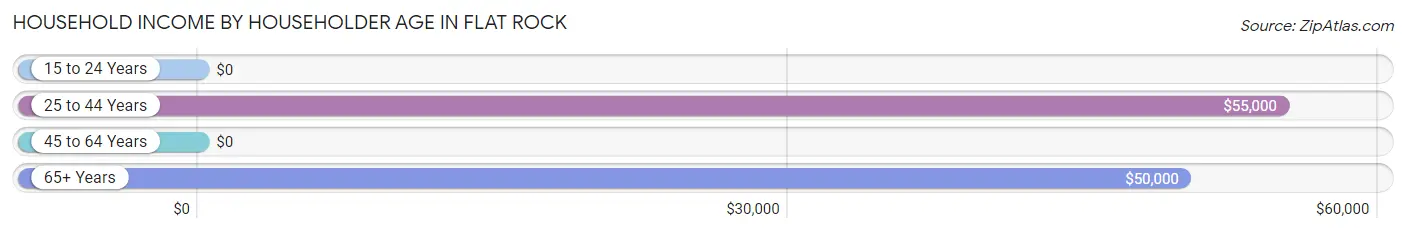
| Income Bracket | # Households | Median Income |
| 15 to 24 Years | 10 (5.6%) | $0 |
| 25 to 44 Years | 68 (38.0%) | $55,000 |
| 45 to 64 Years | 53 (29.6%) | $0 |
| 65+ Years | 48 (26.8%) | $50,000 |
| Total | 179 (100.0%) | $52,625 |
Poverty in Flat Rock
Income Below Poverty by Sex and Age in Flat Rock
With 17.5% poverty level for males and 9.3% for females among the residents of Flat Rock, 16 and 17 year old males and 45 to 54 year old females are the most vulnerable to poverty, with 5 males (100.0%) and 9 females (40.9%) in their respective age groups living below the poverty level.
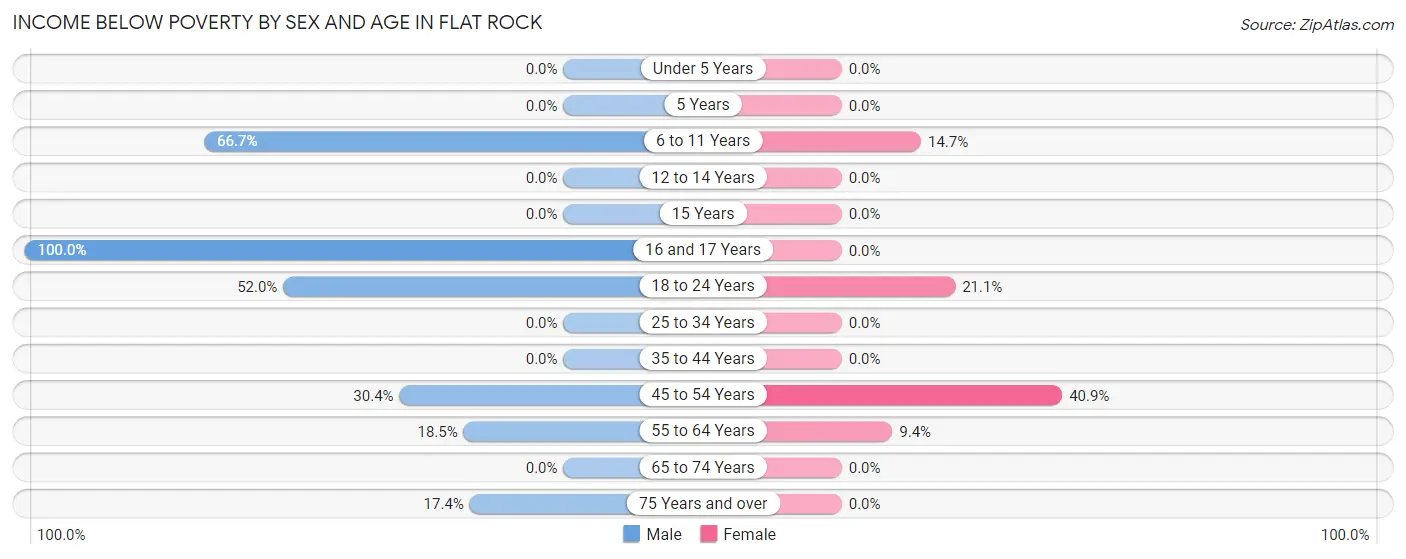
| Age Bracket | Male | Female |
| Under 5 Years | 0 (0.0%) | 0 (0.0%) |
| 5 Years | 0 (0.0%) | 0 (0.0%) |
| 6 to 11 Years | 6 (66.7%) | 5 (14.7%) |
| 12 to 14 Years | 0 (0.0%) | 0 (0.0%) |
| 15 Years | 0 (0.0%) | 0 (0.0%) |
| 16 and 17 Years | 5 (100.0%) | 0 (0.0%) |
| 18 to 24 Years | 13 (52.0%) | 4 (21.0%) |
| 25 to 34 Years | 0 (0.0%) | 0 (0.0%) |
| 35 to 44 Years | 0 (0.0%) | 0 (0.0%) |
| 45 to 54 Years | 7 (30.4%) | 9 (40.9%) |
| 55 to 64 Years | 5 (18.5%) | 3 (9.4%) |
| 65 to 74 Years | 0 (0.0%) | 0 (0.0%) |
| 75 Years and over | 4 (17.4%) | 0 (0.0%) |
| Total | 40 (17.5%) | 21 (9.3%) |
Income Above Poverty by Sex and Age in Flat Rock
According to the poverty statistics in Flat Rock, males aged under 5 years and females aged under 5 years are the age groups that are most secure financially, with 100.0% of males and 100.0% of females in these age groups living above the poverty line.
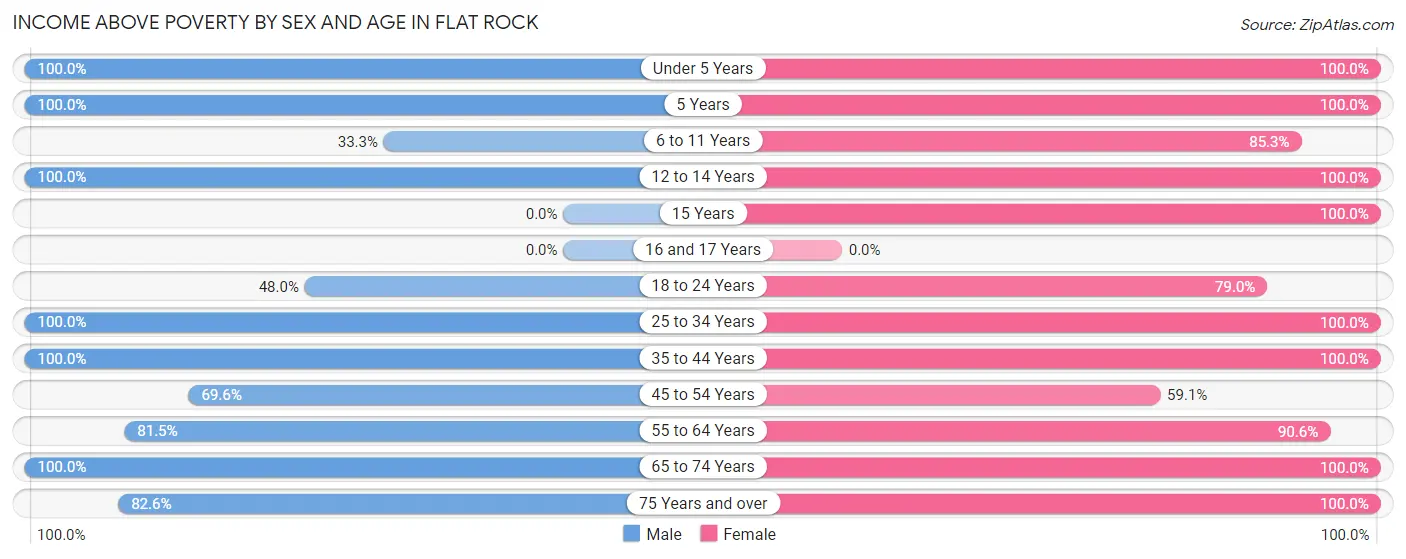
| Age Bracket | Male | Female |
| Under 5 Years | 28 (100.0%) | 12 (100.0%) |
| 5 Years | 3 (100.0%) | 23 (100.0%) |
| 6 to 11 Years | 3 (33.3%) | 29 (85.3%) |
| 12 to 14 Years | 4 (100.0%) | 2 (100.0%) |
| 15 Years | 0 (0.0%) | 1 (100.0%) |
| 16 and 17 Years | 0 (0.0%) | 0 (0.0%) |
| 18 to 24 Years | 12 (48.0%) | 15 (78.9%) |
| 25 to 34 Years | 50 (100.0%) | 30 (100.0%) |
| 35 to 44 Years | 22 (100.0%) | 17 (100.0%) |
| 45 to 54 Years | 16 (69.6%) | 13 (59.1%) |
| 55 to 64 Years | 22 (81.5%) | 29 (90.6%) |
| 65 to 74 Years | 9 (100.0%) | 7 (100.0%) |
| 75 Years and over | 19 (82.6%) | 26 (100.0%) |
| Total | 188 (82.5%) | 204 (90.7%) |
Income Below Poverty Among Married-Couple Families in Flat Rock
The poverty statistics for married-couple families in Flat Rock show that 7.2% or 7 of the total 97 families live below the poverty line. Families with 3 or 4 children have the highest poverty rate of 45.5%, comprising of 5 families. On the other hand, families with 1 or 2 children have the lowest poverty rate of 0.0%, which includes 0 families.
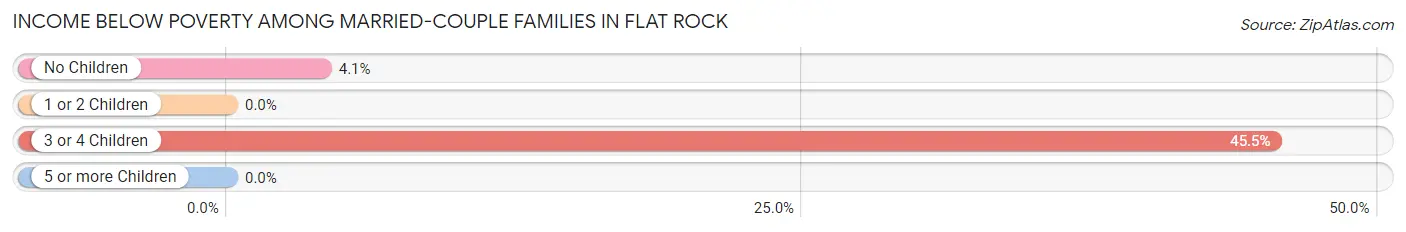
| Children | Above Poverty | Below Poverty |
| No Children | 47 (95.9%) | 2 (4.1%) |
| 1 or 2 Children | 37 (100.0%) | 0 (0.0%) |
| 3 or 4 Children | 6 (54.5%) | 5 (45.5%) |
| 5 or more Children | 0 (0.0%) | 0 (0.0%) |
| Total | 90 (92.8%) | 7 (7.2%) |
Income Below Poverty Among Single-Parent Households in Flat Rock

| Children | Single Father | Single Mother |
| No Children | 0 (0.0%) | 0 (0.0%) |
| 1 or 2 Children | 0 (0.0%) | 0 (0.0%) |
| 3 or 4 Children | 0 (0.0%) | 0 (0.0%) |
| 5 or more Children | 0 (0.0%) | 0 (0.0%) |
| Total | 0 (0.0%) | 0 (0.0%) |
Income Below Poverty Among Married-Couple vs Single-Parent Households in Flat Rock
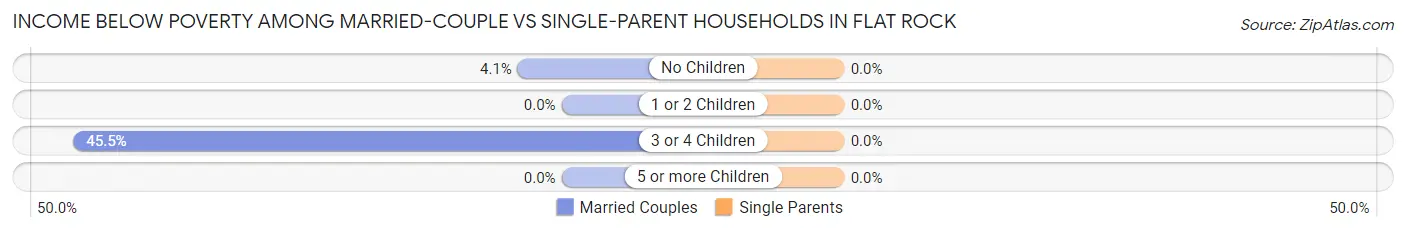
| Children | Married-Couple Families | Single-Parent Households |
| No Children | 2 (4.1%) | 0 (0.0%) |
| 1 or 2 Children | 0 (0.0%) | 0 (0.0%) |
| 3 or 4 Children | 5 (45.5%) | 0 (0.0%) |
| 5 or more Children | 0 (0.0%) | 0 (0.0%) |
| Total | 7 (7.2%) | 0 (0.0%) |
Race in Flat Rock
The most populous races in Flat Rock are White / Caucasian (445 | 97.8%), and Two or more Races (10 | 2.2%).
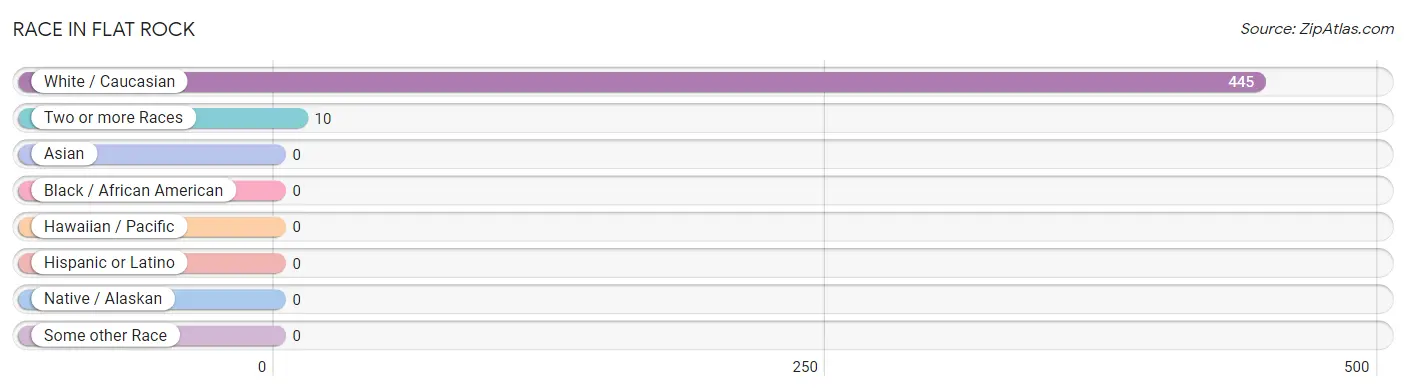
| Race | # Population | % Population |
| Asian | 0 | 0.0% |
| Black / African American | 0 | 0.0% |
| Hawaiian / Pacific | 0 | 0.0% |
| Hispanic or Latino | 0 | 0.0% |
| Native / Alaskan | 0 | 0.0% |
| White / Caucasian | 445 | 97.8% |
| Two or more Races | 10 | 2.2% |
| Some other Race | 0 | 0.0% |
| Total | 455 | 100.0% |
Ancestry in Flat Rock
The most populous ancestries reported in Flat Rock are German (133 | 29.2%), Irish (67 | 14.7%), English (48 | 10.5%), American (37 | 8.1%), and Norwegian (10 | 2.2%), together accounting for 64.8% of all Flat Rock residents.
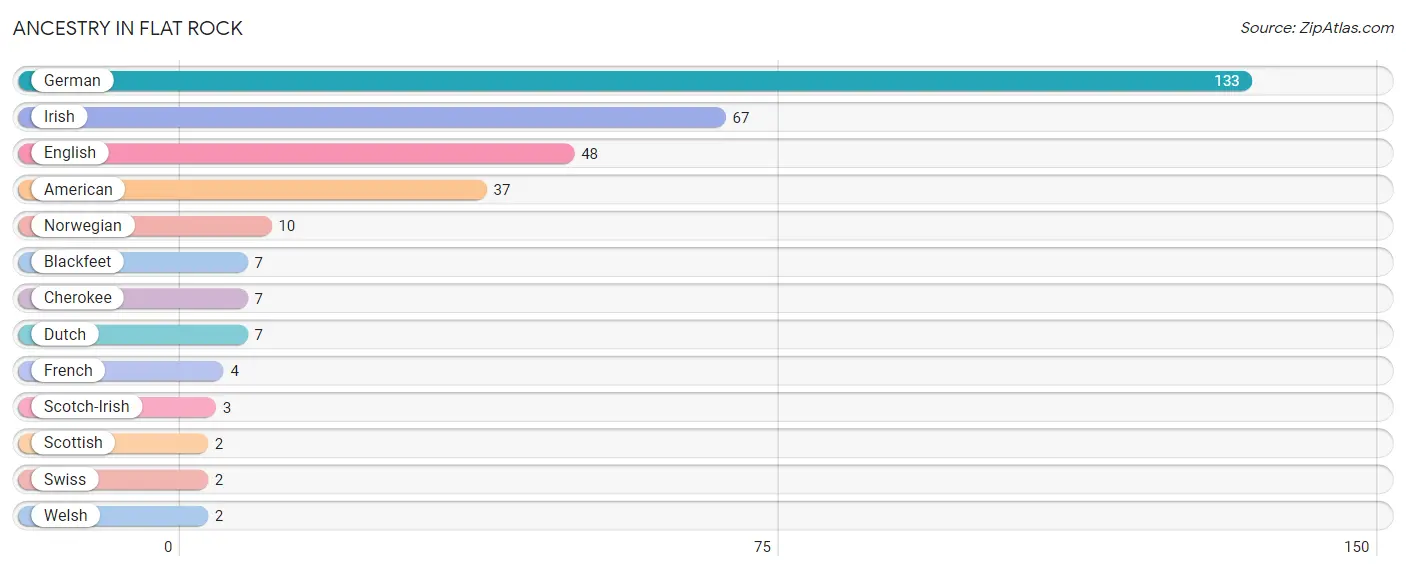
| Ancestry | # Population | % Population |
| American | 37 | 8.1% |
| Blackfeet | 7 | 1.5% |
| Cherokee | 7 | 1.5% |
| Dutch | 7 | 1.5% |
| English | 48 | 10.5% |
| French | 4 | 0.9% |
| German | 133 | 29.2% |
| Irish | 67 | 14.7% |
| Norwegian | 10 | 2.2% |
| Scotch-Irish | 3 | 0.7% |
| Scottish | 2 | 0.4% |
| Swiss | 2 | 0.4% |
| Welsh | 2 | 0.4% | View All 13 Rows |
Immigrants in Flat Rock

| Immigration Origin | # Population | % Population | View All 0 Rows |
Sex and Age in Flat Rock
Sex and Age in Flat Rock
The most populous age groups in Flat Rock are 30 to 34 Years (38 | 16.5%) for men and 5 to 9 Years (51 | 22.7%) for women.
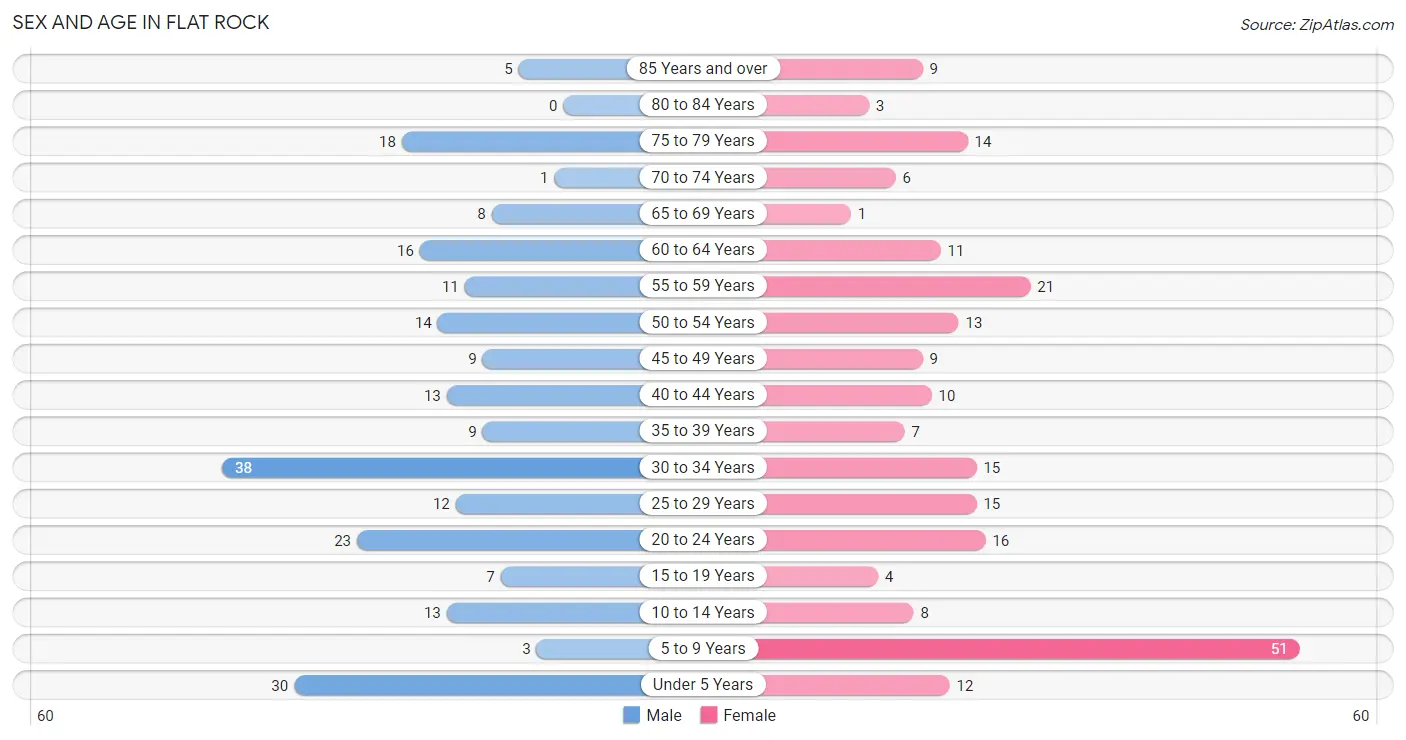
| Age Bracket | Male | Female |
| Under 5 Years | 30 (13.0%) | 12 (5.3%) |
| 5 to 9 Years | 3 (1.3%) | 51 (22.7%) |
| 10 to 14 Years | 13 (5.7%) | 8 (3.6%) |
| 15 to 19 Years | 7 (3.0%) | 4 (1.8%) |
| 20 to 24 Years | 23 (10.0%) | 16 (7.1%) |
| 25 to 29 Years | 12 (5.2%) | 15 (6.7%) |
| 30 to 34 Years | 38 (16.5%) | 15 (6.7%) |
| 35 to 39 Years | 9 (3.9%) | 7 (3.1%) |
| 40 to 44 Years | 13 (5.7%) | 10 (4.4%) |
| 45 to 49 Years | 9 (3.9%) | 9 (4.0%) |
| 50 to 54 Years | 14 (6.1%) | 13 (5.8%) |
| 55 to 59 Years | 11 (4.8%) | 21 (9.3%) |
| 60 to 64 Years | 16 (7.0%) | 11 (4.9%) |
| 65 to 69 Years | 8 (3.5%) | 1 (0.4%) |
| 70 to 74 Years | 1 (0.4%) | 6 (2.7%) |
| 75 to 79 Years | 18 (7.8%) | 14 (6.2%) |
| 80 to 84 Years | 0 (0.0%) | 3 (1.3%) |
| 85 Years and over | 5 (2.2%) | 9 (4.0%) |
| Total | 230 (100.0%) | 225 (100.0%) |
Families and Households in Flat Rock
Median Family Size in Flat Rock
The median family size in Flat Rock is 3.30 persons per family, with married-couple families (97 | 86.6%) accounting for the largest median family size of 3.45 persons per family. On the other hand, single female/mother families (6 | 5.4%) represent the smallest median family size with 2.17 persons per family.
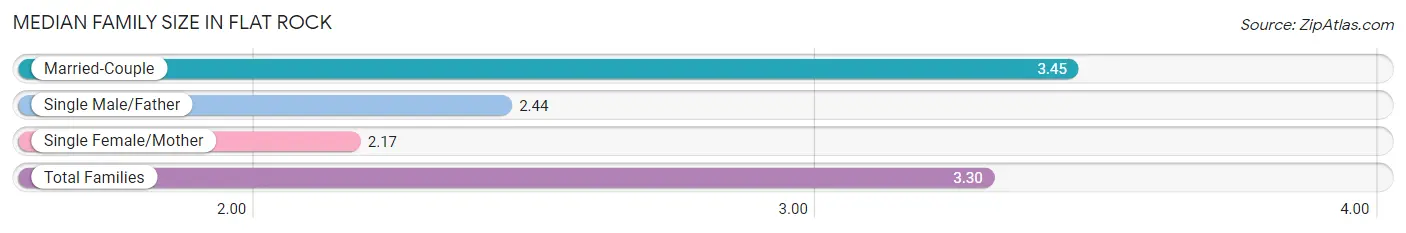
| Family Type | # Families | Family Size |
| Married-Couple | 97 (86.6%) | 3.45 |
| Single Male/Father | 9 (8.0%) | 2.44 |
| Single Female/Mother | 6 (5.4%) | 2.17 |
| Total Families | 112 (100.0%) | 3.30 |
Median Household Size in Flat Rock
The median household size in Flat Rock is 2.54 persons per household, with married-couple households (97 | 54.2%) accounting for the largest median household size of 3.47 persons per household. non-family households (67 | 37.4%) represent the smallest median household size with 1.10 persons per household.
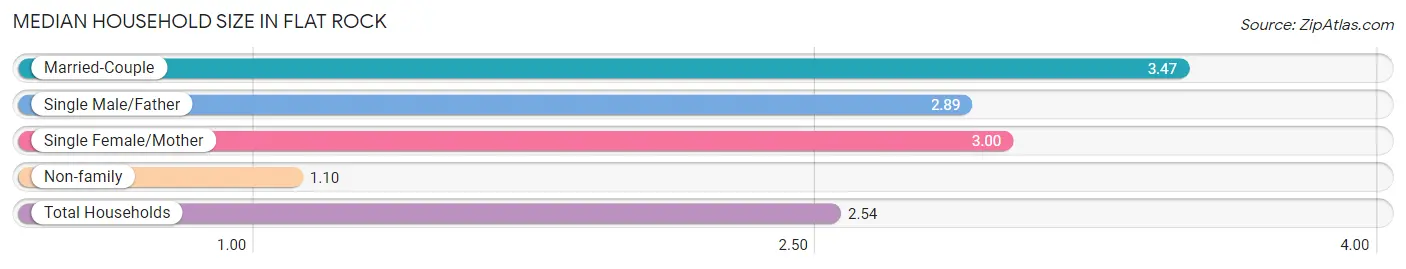
| Household Type | # Households | Household Size |
| Married-Couple | 97 (54.2%) | 3.47 |
| Single Male/Father | 9 (5.0%) | 2.89 |
| Single Female/Mother | 6 (3.4%) | 3.00 |
| Non-family | 67 (37.4%) | 1.10 |
| Total Households | 179 (100.0%) | 2.54 |
Household Size by Marriage Status in Flat Rock
Out of a total of 179 households in Flat Rock, 112 (62.6%) are family households, while 67 (37.4%) are nonfamily households. The most numerous type of family households are 2-person households, comprising 46, and the most common type of nonfamily households are 1-person households, comprising 61.
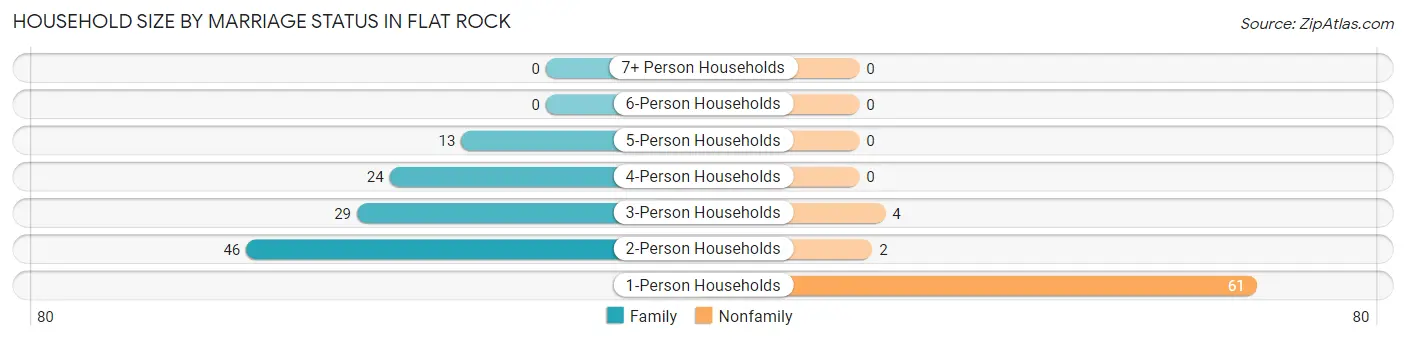
| Household Size | Family Households | Nonfamily Households |
| 1-Person Households | - | 61 (34.1%) |
| 2-Person Households | 46 (25.7%) | 2 (1.1%) |
| 3-Person Households | 29 (16.2%) | 4 (2.2%) |
| 4-Person Households | 24 (13.4%) | 0 (0.0%) |
| 5-Person Households | 13 (7.3%) | 0 (0.0%) |
| 6-Person Households | 0 (0.0%) | 0 (0.0%) |
| 7+ Person Households | 0 (0.0%) | 0 (0.0%) |
| Total | 112 (62.6%) | 67 (37.4%) |
Female Fertility in Flat Rock
Fertility by Age in Flat Rock
Average fertility rate in Flat Rock is 114.0 births per 1,000 women. Women in the age bracket of 20 to 34 years have the highest fertility rate with 196.0 births per 1,000 women. Women in the age bracket of 20 to 34 years acount for 100.0% of all women with births.
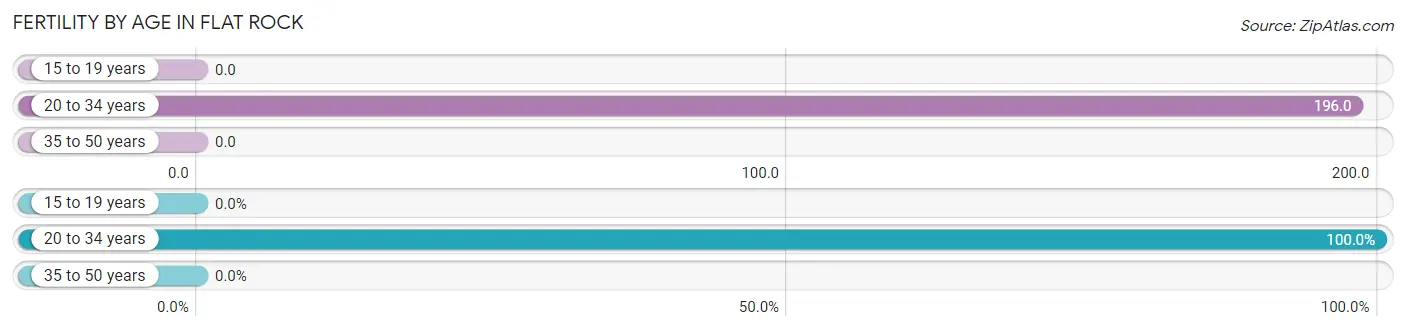
| Age Bracket | Women with Births | Births / 1,000 Women |
| 15 to 19 years | 0 (0.0%) | 0.0 |
| 20 to 34 years | 9 (100.0%) | 196.0 |
| 35 to 50 years | 0 (0.0%) | 0.0 |
| Total | 9 (100.0%) | 114.0 |
Fertility by Age by Marriage Status in Flat Rock
11.1% of women with births (9) in Flat Rock are married. The highest percentage of unmarried women with births falls into 20 to 34 years age bracket with 88.9% of them unmarried at the time of birth, while the lowest percentage of unmarried women with births belong to 20 to 34 years age bracket with 88.9% of them unmarried.
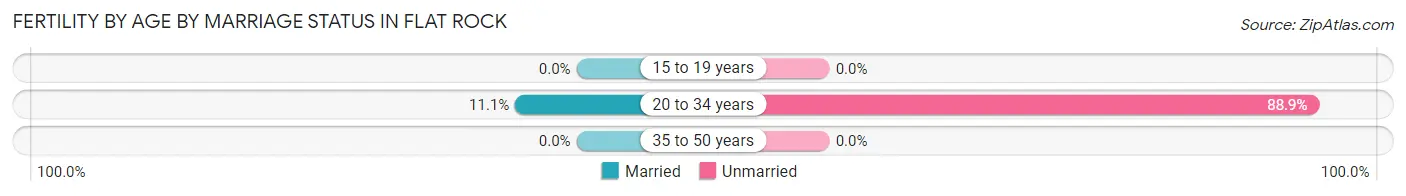
| Age Bracket | Married | Unmarried |
| 15 to 19 years | 0 (0.0%) | 0 (0.0%) |
| 20 to 34 years | 1 (11.1%) | 8 (88.9%) |
| 35 to 50 years | 0 (0.0%) | 0 (0.0%) |
| Total | 1 (11.1%) | 8 (88.9%) |
Fertility by Education in Flat Rock
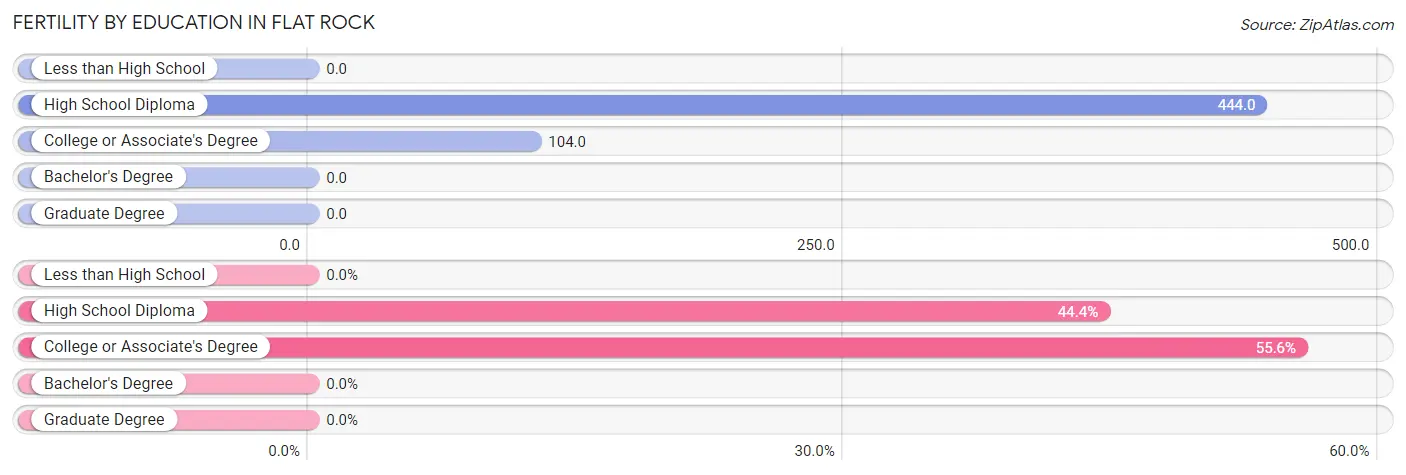
| Educational Attainment | Women with Births | Births / 1,000 Women |
| Less than High School | 0 (0.0%) | 0.0 |
| High School Diploma | 4 (44.4%) | 444.0 |
| College or Associate's Degree | 5 (55.6%) | 104.0 |
| Bachelor's Degree | 0 (0.0%) | 0.0 |
| Graduate Degree | 0 (0.0%) | 0.0 |
| Total | 9 (100.0%) | 114.0 |
Fertility by Education by Marriage Status in Flat Rock
88.9% of women with births in Flat Rock are unmarried. Women with the educational attainment of college or associate's degree are most likely to be married with 20.0% of them married at childbirth, while women with the educational attainment of high school diploma are least likely to be married with 100.0% of them unmarried at childbirth.
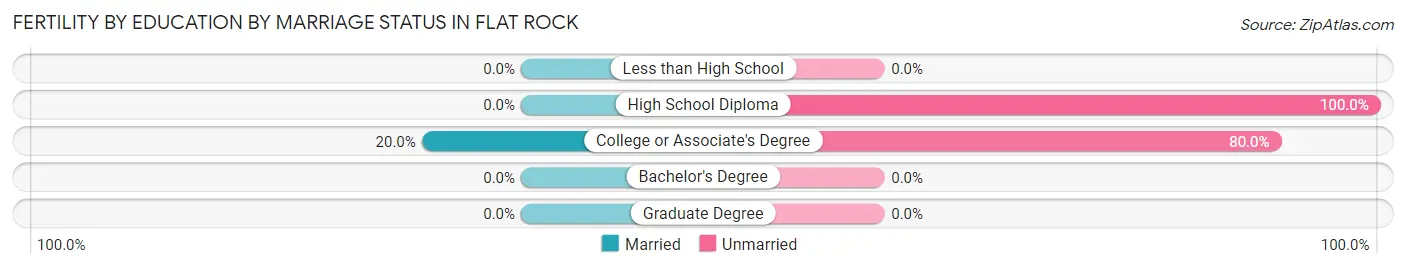
| Educational Attainment | Married | Unmarried |
| Less than High School | 0 (0.0%) | 0 (0.0%) |
| High School Diploma | 0 (0.0%) | 4 (100.0%) |
| College or Associate's Degree | 1 (20.0%) | 4 (80.0%) |
| Bachelor's Degree | 0 (0.0%) | 0 (0.0%) |
| Graduate Degree | 0 (0.0%) | 0 (0.0%) |
| Total | 1 (11.1%) | 8 (88.9%) |
Employment Characteristics in Flat Rock
Employment by Class of Employer in Flat Rock
Among the 192 employed individuals in Flat Rock, private company employees (124 | 64.6%), state government employees (37 | 19.3%), and self-employed (not incorporated) (13 | 6.8%) make up the most common classes of employment.
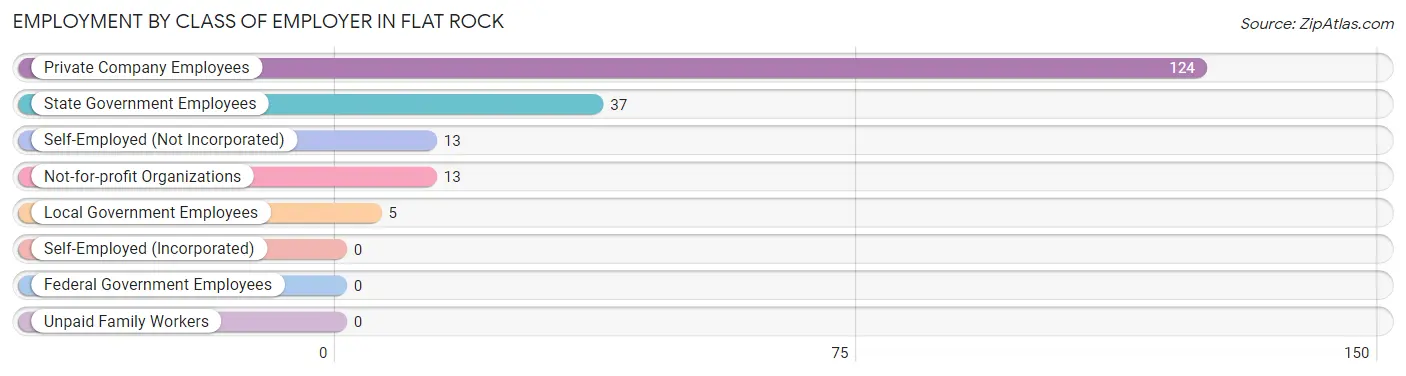
| Employer Class | # Employees | % Employees |
| Private Company Employees | 124 | 64.6% |
| Self-Employed (Incorporated) | 0 | 0.0% |
| Self-Employed (Not Incorporated) | 13 | 6.8% |
| Not-for-profit Organizations | 13 | 6.8% |
| Local Government Employees | 5 | 2.6% |
| State Government Employees | 37 | 19.3% |
| Federal Government Employees | 0 | 0.0% |
| Unpaid Family Workers | 0 | 0.0% |
| Total | 192 | 100.0% |
Employment Status by Age in Flat Rock
According to the labor force statistics for Flat Rock, out of the total population over 16 years of age (337), 62.0% or 209 individuals are in the labor force, with 7.2% or 15 of them unemployed. The age group with the highest labor force participation rate is 20 to 24 years, with 89.7% or 35 individuals in the labor force. Within the labor force, the 20 to 24 years age range has the highest percentage of unemployed individuals, with 31.4% or 11 of them being unemployed.
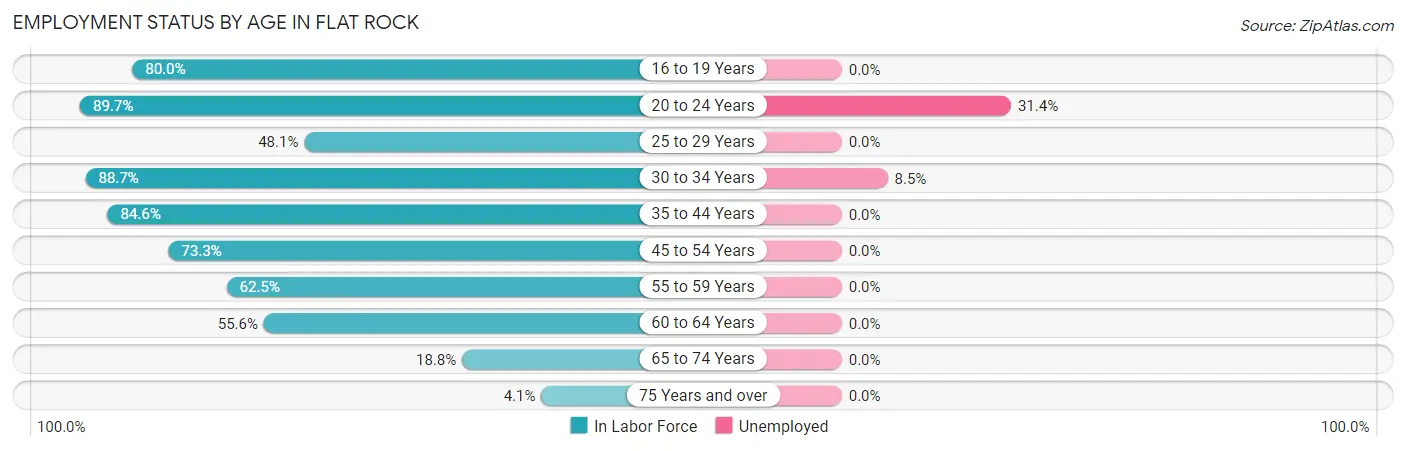
| Age Bracket | In Labor Force | Unemployed |
| 16 to 19 Years | 8 (80.0%) | 0 (0.0%) |
| 20 to 24 Years | 35 (89.7%) | 11 (31.4%) |
| 25 to 29 Years | 13 (48.1%) | 0 (0.0%) |
| 30 to 34 Years | 47 (88.7%) | 4 (8.5%) |
| 35 to 44 Years | 33 (84.6%) | 0 (0.0%) |
| 45 to 54 Years | 33 (73.3%) | 0 (0.0%) |
| 55 to 59 Years | 20 (62.5%) | 0 (0.0%) |
| 60 to 64 Years | 15 (55.6%) | 0 (0.0%) |
| 65 to 74 Years | 3 (18.8%) | 0 (0.0%) |
| 75 Years and over | 2 (4.1%) | 0 (0.0%) |
| Total | 209 (62.0%) | 15 (7.2%) |
Employment Status by Educational Attainment in Flat Rock
According to labor force statistics for Flat Rock, 72.2% of individuals (161) out of the total population between 25 and 64 years of age (223) are in the labor force, with 2.5% or 4 of them being unemployed. The group with the highest labor force participation rate are those with the educational attainment of bachelor's degree or higher, with 94.9% or 37 individuals in the labor force. Within the labor force, individuals with college / associate degree education have the highest percentage of unemployment, with 4.0% or 4 of them being unemployed.
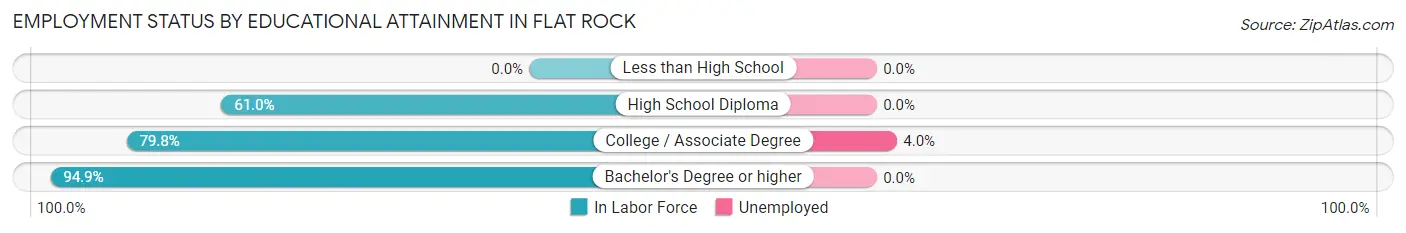
| Educational Attainment | In Labor Force | Unemployed |
| Less than High School | 0 (0.0%) | 0 (0.0%) |
| High School Diploma | 25 (61.0%) | 0 (0.0%) |
| College / Associate Degree | 99 (79.8%) | 5 (4.0%) |
| Bachelor's Degree or higher | 37 (94.9%) | 0 (0.0%) |
| Total | 161 (72.2%) | 6 (2.5%) |
Employment Occupations by Sex in Flat Rock
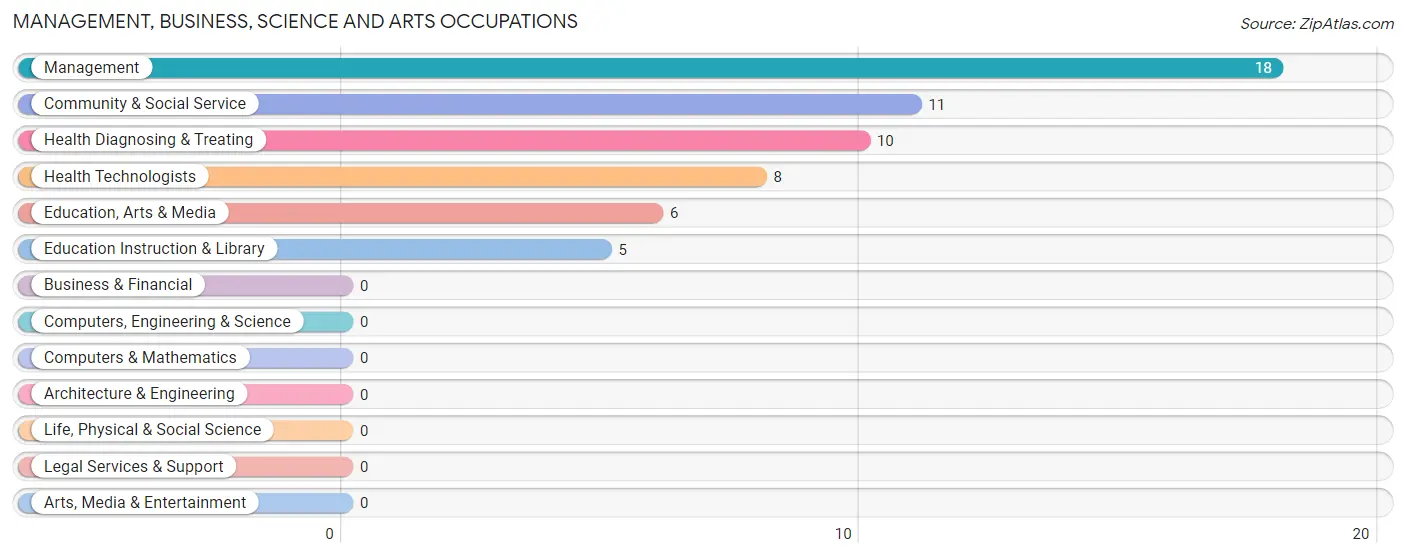
Management, Business, Science and Arts Occupations
The most common Management, Business, Science and Arts occupations in Flat Rock are Management (18 | 9.3%), Community & Social Service (11 | 5.7%), Health Diagnosing & Treating (10 | 5.1%), Health Technologists (8 | 4.1%), and Education, Arts & Media (6 | 3.1%).
Management, Business, Science and Arts Occupations by Sex
Within the Management, Business, Science and Arts occupations in Flat Rock, the most male-oriented occupations are Management (88.9%), Education, Arts & Media (50.0%), and Health Diagnosing & Treating (40.0%), while the most female-oriented occupations are Education Instruction & Library (100.0%), Health Technologists (75.0%), and Community & Social Service (72.7%).
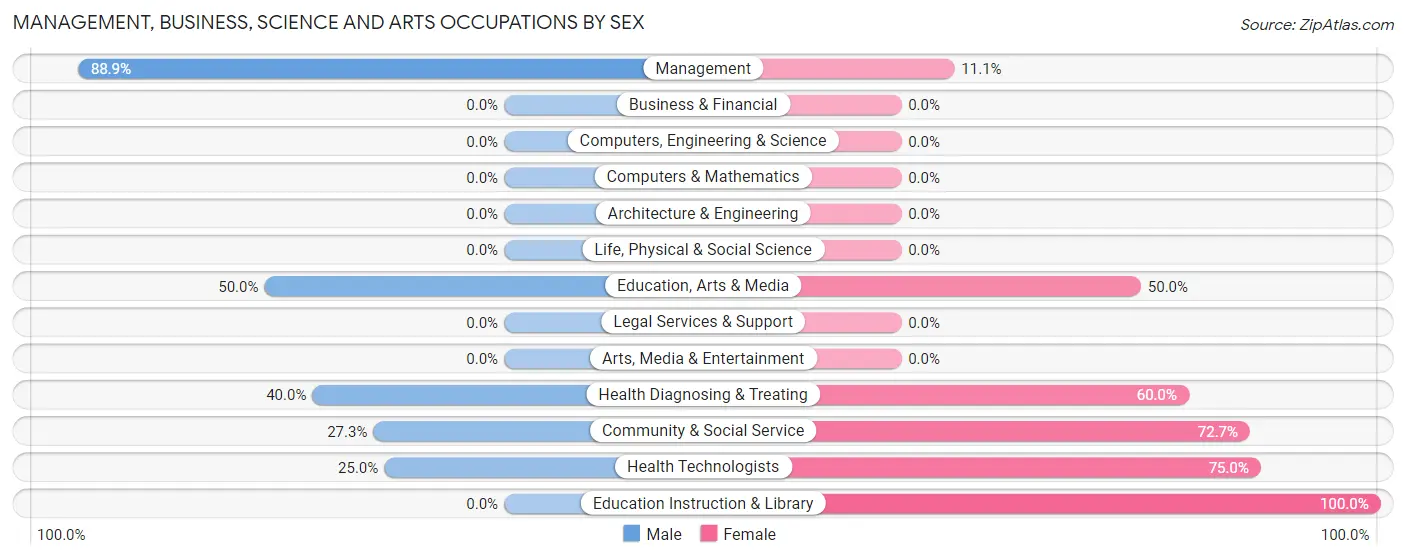
| Occupation | Male | Female |
| Management | 16 (88.9%) | 2 (11.1%) |
| Business & Financial | 0 (0.0%) | 0 (0.0%) |
| Computers, Engineering & Science | 0 (0.0%) | 0 (0.0%) |
| Computers & Mathematics | 0 (0.0%) | 0 (0.0%) |
| Architecture & Engineering | 0 (0.0%) | 0 (0.0%) |
| Life, Physical & Social Science | 0 (0.0%) | 0 (0.0%) |
| Community & Social Service | 3 (27.3%) | 8 (72.7%) |
| Education, Arts & Media | 3 (50.0%) | 3 (50.0%) |
| Legal Services & Support | 0 (0.0%) | 0 (0.0%) |
| Education Instruction & Library | 0 (0.0%) | 5 (100.0%) |
| Arts, Media & Entertainment | 0 (0.0%) | 0 (0.0%) |
| Health Diagnosing & Treating | 4 (40.0%) | 6 (60.0%) |
| Health Technologists | 2 (25.0%) | 6 (75.0%) |
| Total (Category) | 23 (59.0%) | 16 (41.0%) |
| Total (Overall) | 117 (60.3%) | 77 (39.7%) |
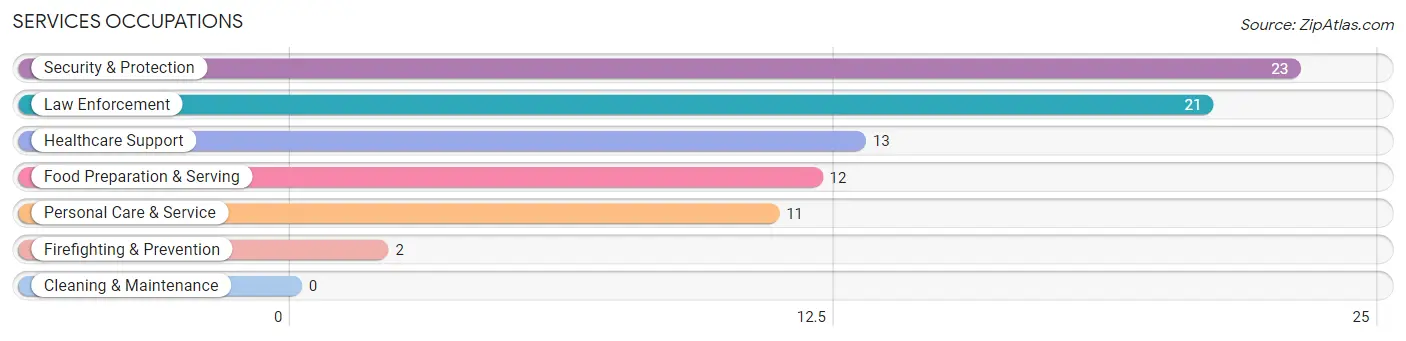
Services Occupations
The most common Services occupations in Flat Rock are Security & Protection (23 | 11.9%), Law Enforcement (21 | 10.8%), Healthcare Support (13 | 6.7%), Food Preparation & Serving (12 | 6.2%), and Personal Care & Service (11 | 5.7%).
Services Occupations by Sex
Within the Services occupations in Flat Rock, the most male-oriented occupations are Food Preparation & Serving (58.3%), Law Enforcement (52.4%), and Security & Protection (47.8%), while the most female-oriented occupations are Healthcare Support (100.0%), Firefighting & Prevention (100.0%), and Personal Care & Service (100.0%).
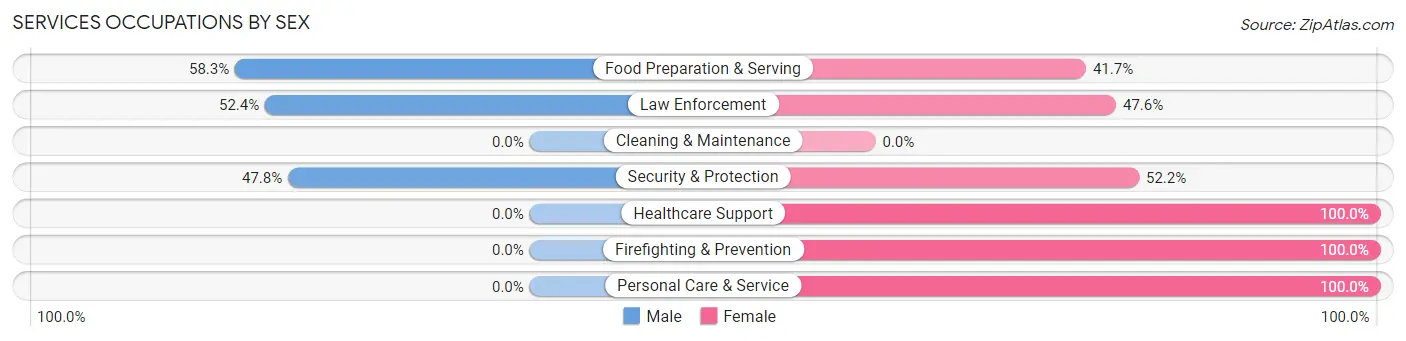
| Occupation | Male | Female |
| Healthcare Support | 0 (0.0%) | 13 (100.0%) |
| Security & Protection | 11 (47.8%) | 12 (52.2%) |
| Firefighting & Prevention | 0 (0.0%) | 2 (100.0%) |
| Law Enforcement | 11 (52.4%) | 10 (47.6%) |
| Food Preparation & Serving | 7 (58.3%) | 5 (41.7%) |
| Cleaning & Maintenance | 0 (0.0%) | 0 (0.0%) |
| Personal Care & Service | 0 (0.0%) | 11 (100.0%) |
| Total (Category) | 18 (30.5%) | 41 (69.5%) |
| Total (Overall) | 117 (60.3%) | 77 (39.7%) |
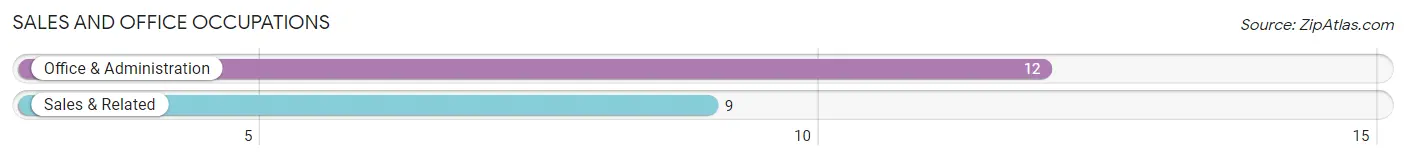
Sales and Office Occupations
The most common Sales and Office occupations in Flat Rock are Office & Administration (12 | 6.2%), and Sales & Related (9 | 4.6%).
Sales and Office Occupations by Sex
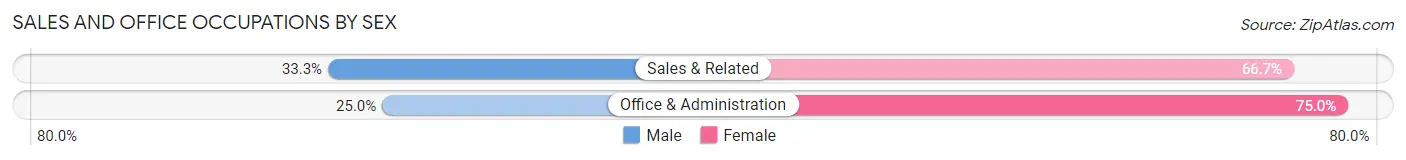
| Occupation | Male | Female |
| Sales & Related | 3 (33.3%) | 6 (66.7%) |
| Office & Administration | 3 (25.0%) | 9 (75.0%) |
| Total (Category) | 6 (28.6%) | 15 (71.4%) |
| Total (Overall) | 117 (60.3%) | 77 (39.7%) |
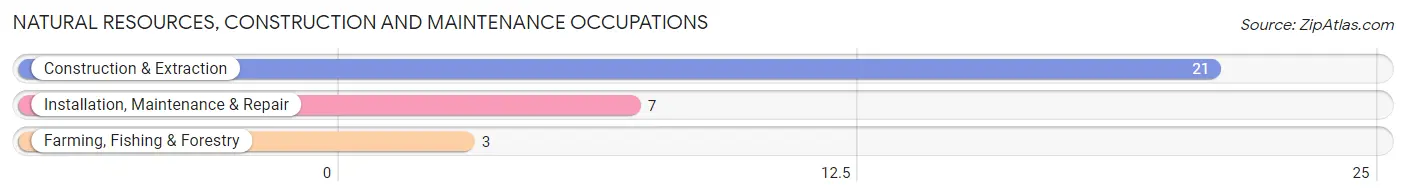
Natural Resources, Construction and Maintenance Occupations
The most common Natural Resources, Construction and Maintenance occupations in Flat Rock are Construction & Extraction (21 | 10.8%), Installation, Maintenance & Repair (7 | 3.6%), and Farming, Fishing & Forestry (3 | 1.5%).
Natural Resources, Construction and Maintenance Occupations by Sex
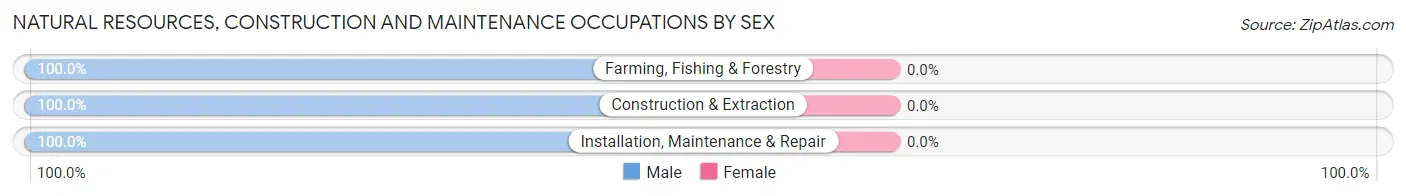
| Occupation | Male | Female |
| Farming, Fishing & Forestry | 3 (100.0%) | 0 (0.0%) |
| Construction & Extraction | 21 (100.0%) | 0 (0.0%) |
| Installation, Maintenance & Repair | 7 (100.0%) | 0 (0.0%) |
| Total (Category) | 31 (100.0%) | 0 (0.0%) |
| Total (Overall) | 117 (60.3%) | 77 (39.7%) |
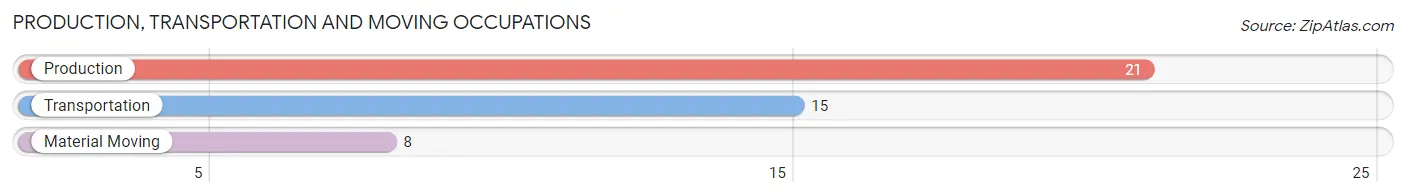
Production, Transportation and Moving Occupations
The most common Production, Transportation and Moving occupations in Flat Rock are Production (21 | 10.8%), Transportation (15 | 7.7%), and Material Moving (8 | 4.1%).
Production, Transportation and Moving Occupations by Sex
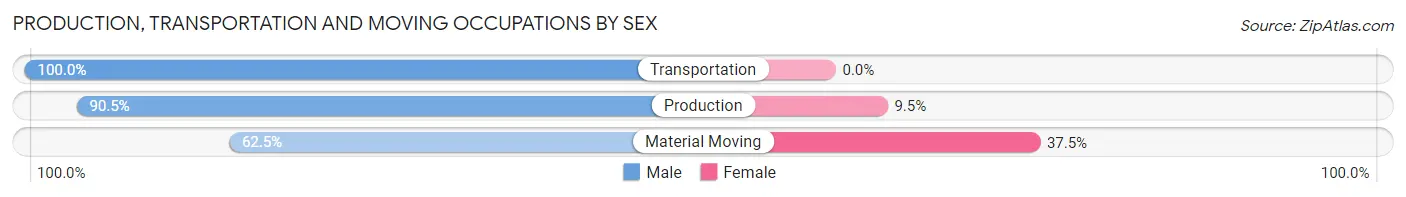
| Occupation | Male | Female |
| Production | 19 (90.5%) | 2 (9.5%) |
| Transportation | 15 (100.0%) | 0 (0.0%) |
| Material Moving | 5 (62.5%) | 3 (37.5%) |
| Total (Category) | 39 (88.6%) | 5 (11.4%) |
| Total (Overall) | 117 (60.3%) | 77 (39.7%) |
Employment Industries by Sex in Flat Rock
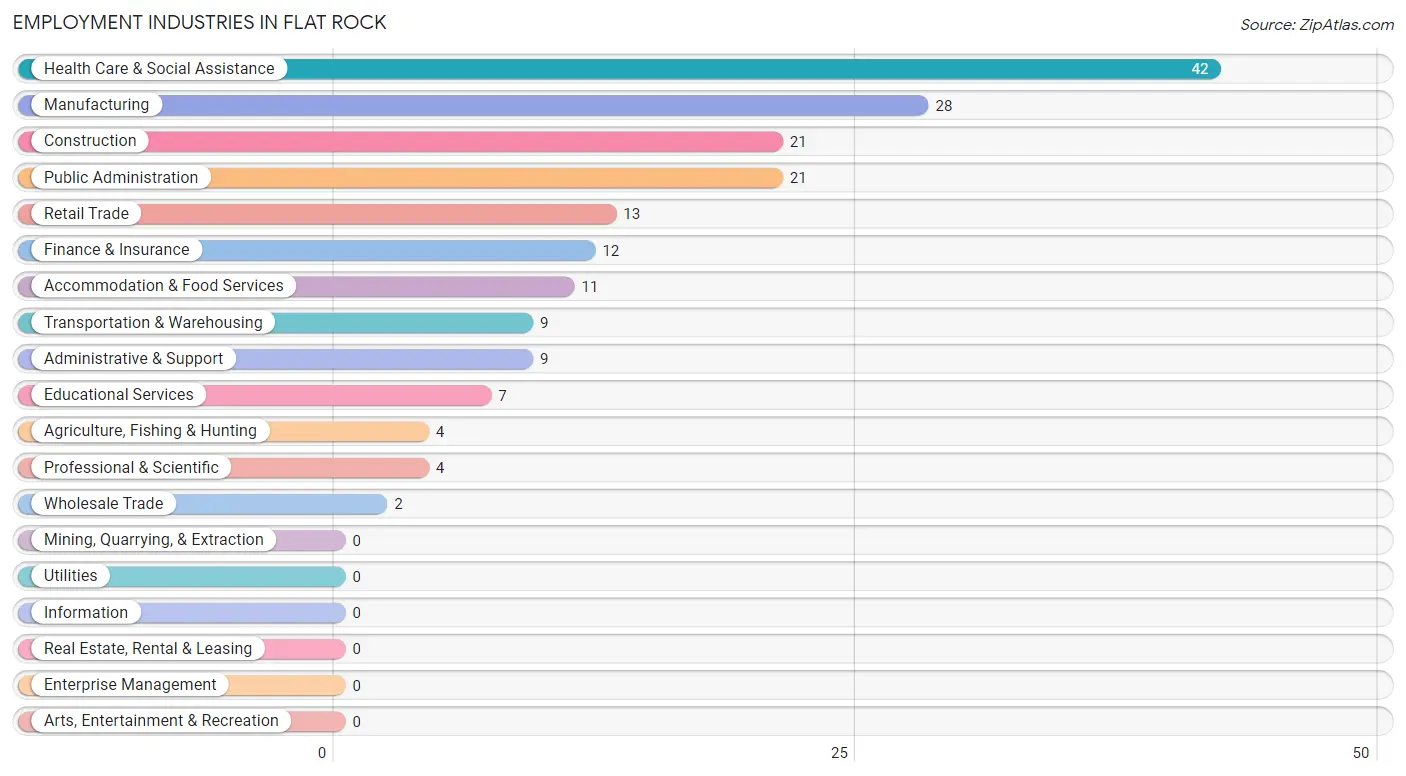
Employment Industries in Flat Rock
The major employment industries in Flat Rock include Health Care & Social Assistance (42 | 21.6%), Manufacturing (28 | 14.4%), Construction (21 | 10.8%), Public Administration (21 | 10.8%), and Retail Trade (13 | 6.7%).
Employment Industries by Sex in Flat Rock
The Flat Rock industries that see more men than women are Agriculture, Fishing & Hunting (100.0%), Construction (100.0%), and Transportation & Warehousing (100.0%), whereas the industries that tend to have a higher number of women are Wholesale Trade (100.0%), Health Care & Social Assistance (95.2%), and Professional & Scientific (50.0%).
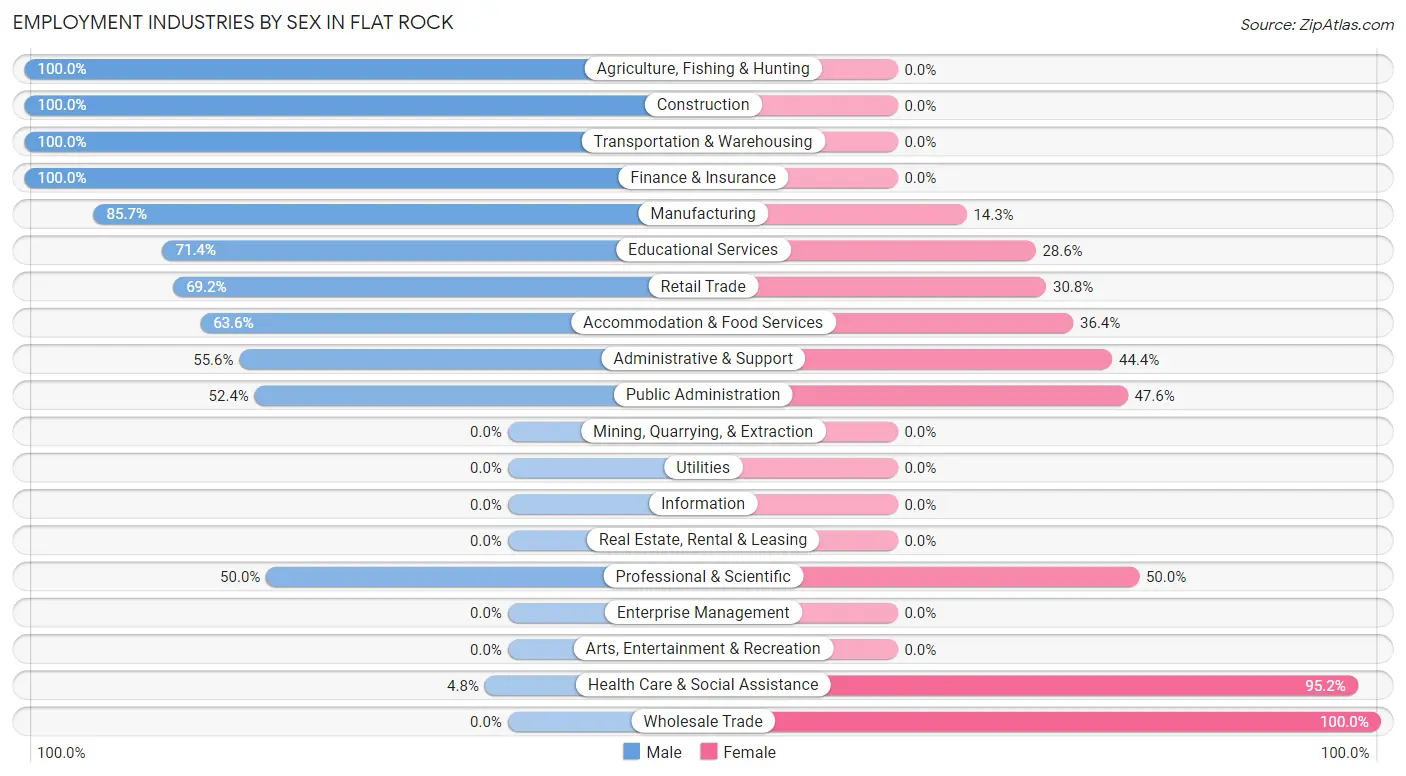
| Industry | Male | Female |
| Agriculture, Fishing & Hunting | 4 (100.0%) | 0 (0.0%) |
| Mining, Quarrying, & Extraction | 0 (0.0%) | 0 (0.0%) |
| Construction | 21 (100.0%) | 0 (0.0%) |
| Manufacturing | 24 (85.7%) | 4 (14.3%) |
| Wholesale Trade | 0 (0.0%) | 2 (100.0%) |
| Retail Trade | 9 (69.2%) | 4 (30.8%) |
| Transportation & Warehousing | 9 (100.0%) | 0 (0.0%) |
| Utilities | 0 (0.0%) | 0 (0.0%) |
| Information | 0 (0.0%) | 0 (0.0%) |
| Finance & Insurance | 12 (100.0%) | 0 (0.0%) |
| Real Estate, Rental & Leasing | 0 (0.0%) | 0 (0.0%) |
| Professional & Scientific | 2 (50.0%) | 2 (50.0%) |
| Enterprise Management | 0 (0.0%) | 0 (0.0%) |
| Administrative & Support | 5 (55.6%) | 4 (44.4%) |
| Educational Services | 5 (71.4%) | 2 (28.6%) |
| Health Care & Social Assistance | 2 (4.8%) | 40 (95.2%) |
| Arts, Entertainment & Recreation | 0 (0.0%) | 0 (0.0%) |
| Accommodation & Food Services | 7 (63.6%) | 4 (36.4%) |
| Public Administration | 11 (52.4%) | 10 (47.6%) |
| Total | 117 (60.3%) | 77 (39.7%) |
Education in Flat Rock
School Enrollment in Flat Rock
The most common levels of schooling among the 90 students in Flat Rock are elementary school (29 | 32.2%), middle school (20 | 22.2%), and kindergarten (18 | 20.0%).
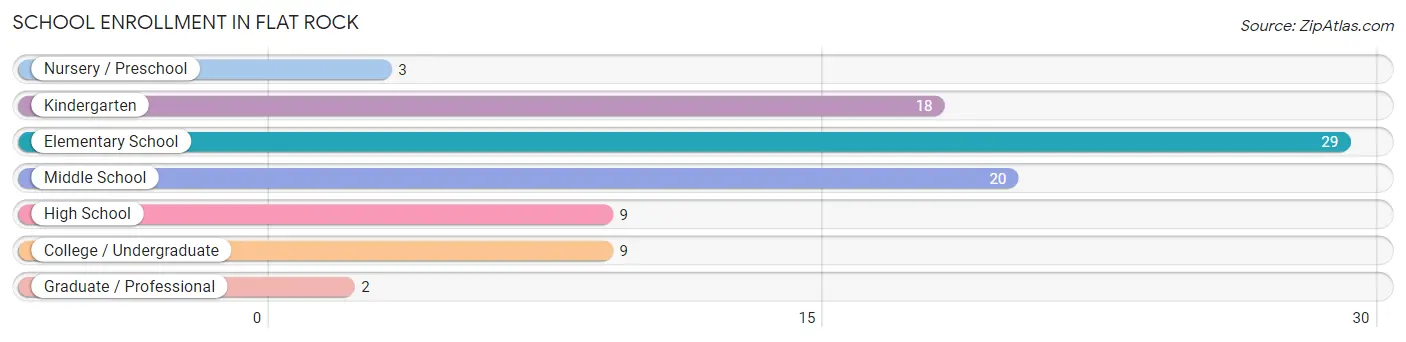
| School Level | # Students | % Students |
| Nursery / Preschool | 3 | 3.3% |
| Kindergarten | 18 | 20.0% |
| Elementary School | 29 | 32.2% |
| Middle School | 20 | 22.2% |
| High School | 9 | 10.0% |
| College / Undergraduate | 9 | 10.0% |
| Graduate / Professional | 2 | 2.2% |
| Total | 90 | 100.0% |
School Enrollment by Age by Funding Source in Flat Rock
Out of a total of 90 students who are enrolled in schools in Flat Rock, 3 (3.3%) attend a private institution, while the remaining 87 (96.7%) are enrolled in public schools. The age group of 5 to 9 year old has the highest likelihood of being enrolled in private schools, with 3 (6.5% in the age bracket) enrolled. Conversely, the age group of 3 to 4 year olds has the lowest likelihood of being enrolled in a private school, with 3 (100.0% in the age bracket) attending a public institution.
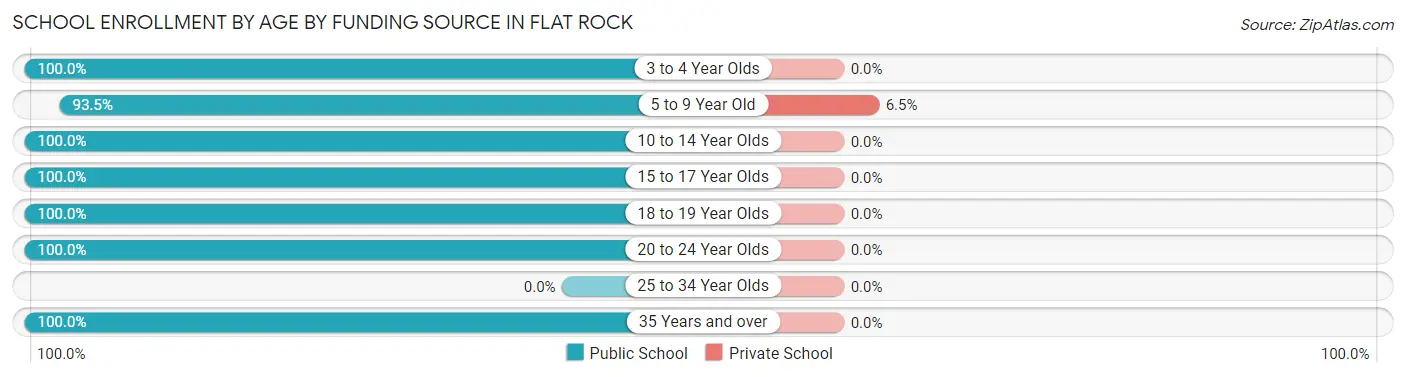
| Age Bracket | Public School | Private School |
| 3 to 4 Year Olds | 3 (100.0%) | 0 (0.0%) |
| 5 to 9 Year Old | 43 (93.5%) | 3 (6.5%) |
| 10 to 14 Year Olds | 21 (100.0%) | 0 (0.0%) |
| 15 to 17 Year Olds | 6 (100.0%) | 0 (0.0%) |
| 18 to 19 Year Olds | 5 (100.0%) | 0 (0.0%) |
| 20 to 24 Year Olds | 5 (100.0%) | 0 (0.0%) |
| 25 to 34 Year Olds | 0 (0.0%) | 0 (0.0%) |
| 35 Years and over | 4 (100.0%) | 0 (0.0%) |
| Total | 87 (96.7%) | 3 (3.3%) |
Educational Attainment by Field of Study in Flat Rock
Bio, nature & agricultural (12 | 30.8%), science & technology (7 | 17.9%), business (5 | 12.8%), education (5 | 12.8%), and psychology (3 | 7.7%) are the most common fields of study among 39 individuals in Flat Rock who have obtained a bachelor's degree or higher.
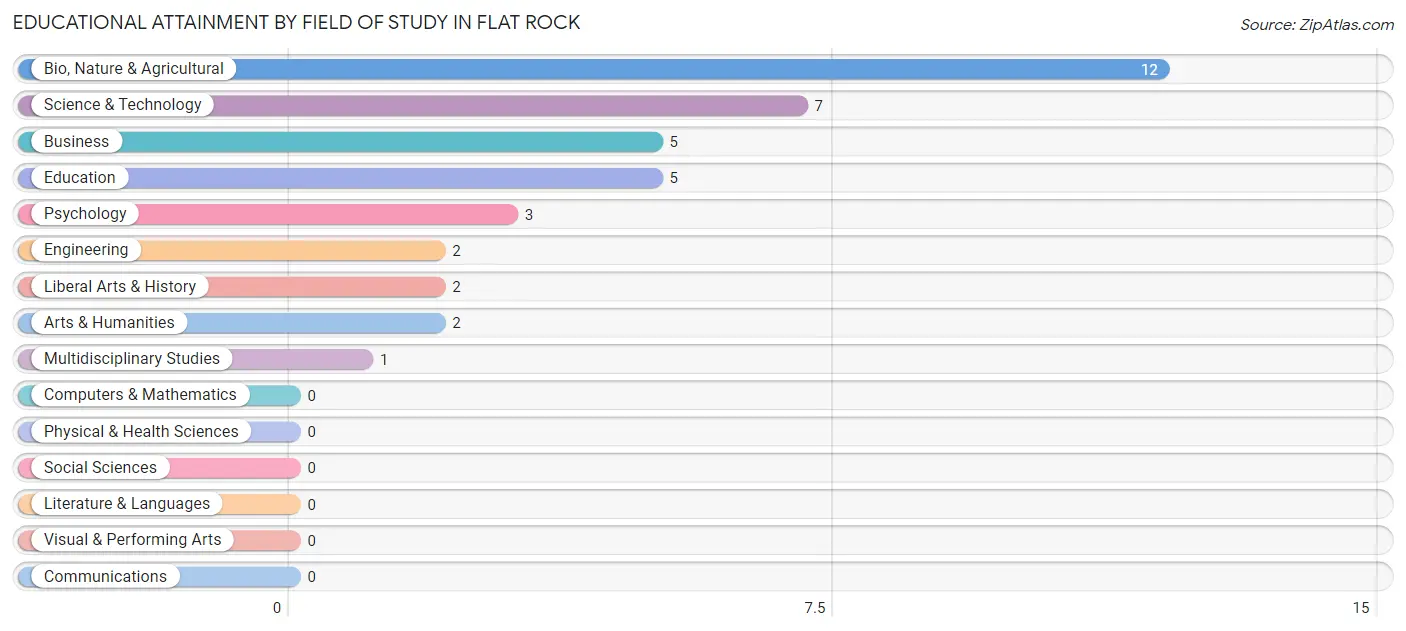
| Field of Study | # Graduates | % Graduates |
| Computers & Mathematics | 0 | 0.0% |
| Bio, Nature & Agricultural | 12 | 30.8% |
| Physical & Health Sciences | 0 | 0.0% |
| Psychology | 3 | 7.7% |
| Social Sciences | 0 | 0.0% |
| Engineering | 2 | 5.1% |
| Multidisciplinary Studies | 1 | 2.6% |
| Science & Technology | 7 | 17.9% |
| Business | 5 | 12.8% |
| Education | 5 | 12.8% |
| Literature & Languages | 0 | 0.0% |
| Liberal Arts & History | 2 | 5.1% |
| Visual & Performing Arts | 0 | 0.0% |
| Communications | 0 | 0.0% |
| Arts & Humanities | 2 | 5.1% |
| Total | 39 | 100.0% |
Transportation & Commute in Flat Rock
Vehicle Availability by Sex in Flat Rock
The most prevalent vehicle ownership categories in Flat Rock are males with 2 vehicles (37, accounting for 31.9%) and females with 2 vehicles (32, making up 48.7%).
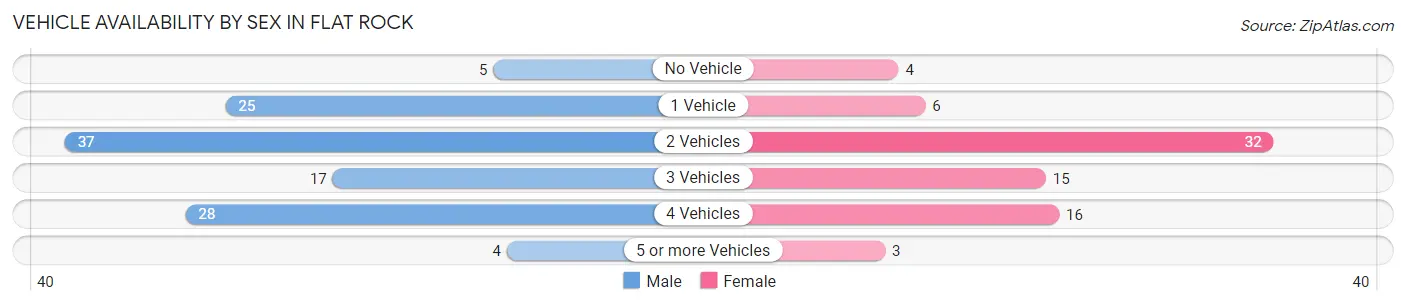
| Vehicles Available | Male | Female |
| No Vehicle | 5 (4.3%) | 4 (5.3%) |
| 1 Vehicle | 25 (21.5%) | 6 (7.9%) |
| 2 Vehicles | 37 (31.9%) | 32 (42.1%) |
| 3 Vehicles | 17 (14.7%) | 15 (19.7%) |
| 4 Vehicles | 28 (24.1%) | 16 (21.0%) |
| 5 or more Vehicles | 4 (3.5%) | 3 (4.0%) |
| Total | 116 (100.0%) | 76 (100.0%) |
Commute Time in Flat Rock
The most frequently occuring commute durations in Flat Rock are 15 to 19 minutes (42 commuters, 23.3%), 20 to 24 minutes (29 commuters, 16.1%), and 30 to 34 minutes (29 commuters, 16.1%).
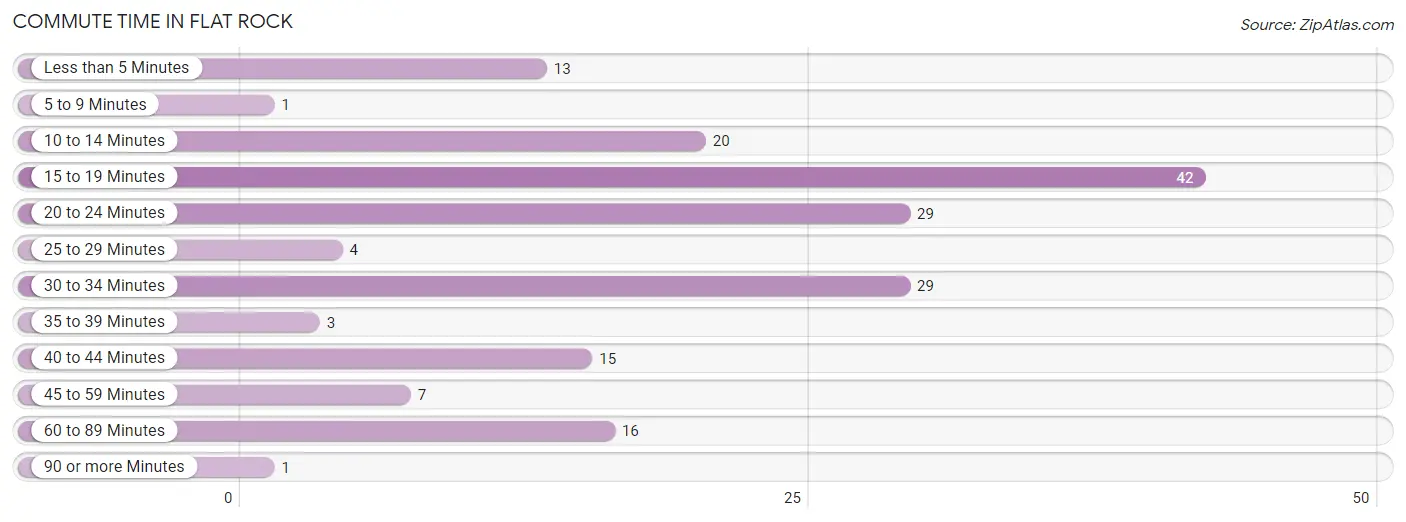
| Commute Time | # Commuters | % Commuters |
| Less than 5 Minutes | 13 | 7.2% |
| 5 to 9 Minutes | 1 | 0.6% |
| 10 to 14 Minutes | 20 | 11.1% |
| 15 to 19 Minutes | 42 | 23.3% |
| 20 to 24 Minutes | 29 | 16.1% |
| 25 to 29 Minutes | 4 | 2.2% |
| 30 to 34 Minutes | 29 | 16.1% |
| 35 to 39 Minutes | 3 | 1.7% |
| 40 to 44 Minutes | 15 | 8.3% |
| 45 to 59 Minutes | 7 | 3.9% |
| 60 to 89 Minutes | 16 | 8.9% |
| 90 or more Minutes | 1 | 0.6% |
Commute Time by Sex in Flat Rock
The most common commute times in Flat Rock are 15 to 19 minutes (31 commuters, 28.7%) for males and 30 to 34 minutes (23 commuters, 31.9%) for females.
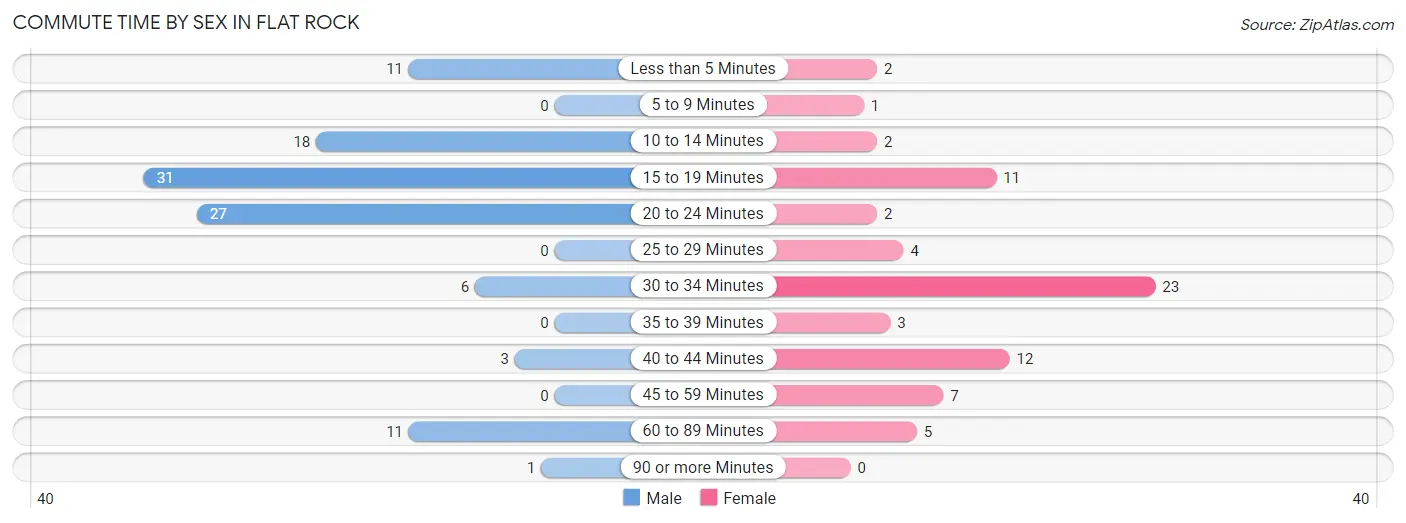
| Commute Time | Male | Female |
| Less than 5 Minutes | 11 (10.2%) | 2 (2.8%) |
| 5 to 9 Minutes | 0 (0.0%) | 1 (1.4%) |
| 10 to 14 Minutes | 18 (16.7%) | 2 (2.8%) |
| 15 to 19 Minutes | 31 (28.7%) | 11 (15.3%) |
| 20 to 24 Minutes | 27 (25.0%) | 2 (2.8%) |
| 25 to 29 Minutes | 0 (0.0%) | 4 (5.6%) |
| 30 to 34 Minutes | 6 (5.6%) | 23 (31.9%) |
| 35 to 39 Minutes | 0 (0.0%) | 3 (4.2%) |
| 40 to 44 Minutes | 3 (2.8%) | 12 (16.7%) |
| 45 to 59 Minutes | 0 (0.0%) | 7 (9.7%) |
| 60 to 89 Minutes | 11 (10.2%) | 5 (6.9%) |
| 90 or more Minutes | 1 (0.9%) | 0 (0.0%) |
Time of Departure to Work by Sex in Flat Rock
The most frequent times of departure to work in Flat Rock are 5:00 AM to 5:29 AM (29, 26.9%) for males and 12:00 PM to 3:59 PM (19, 26.4%) for females.
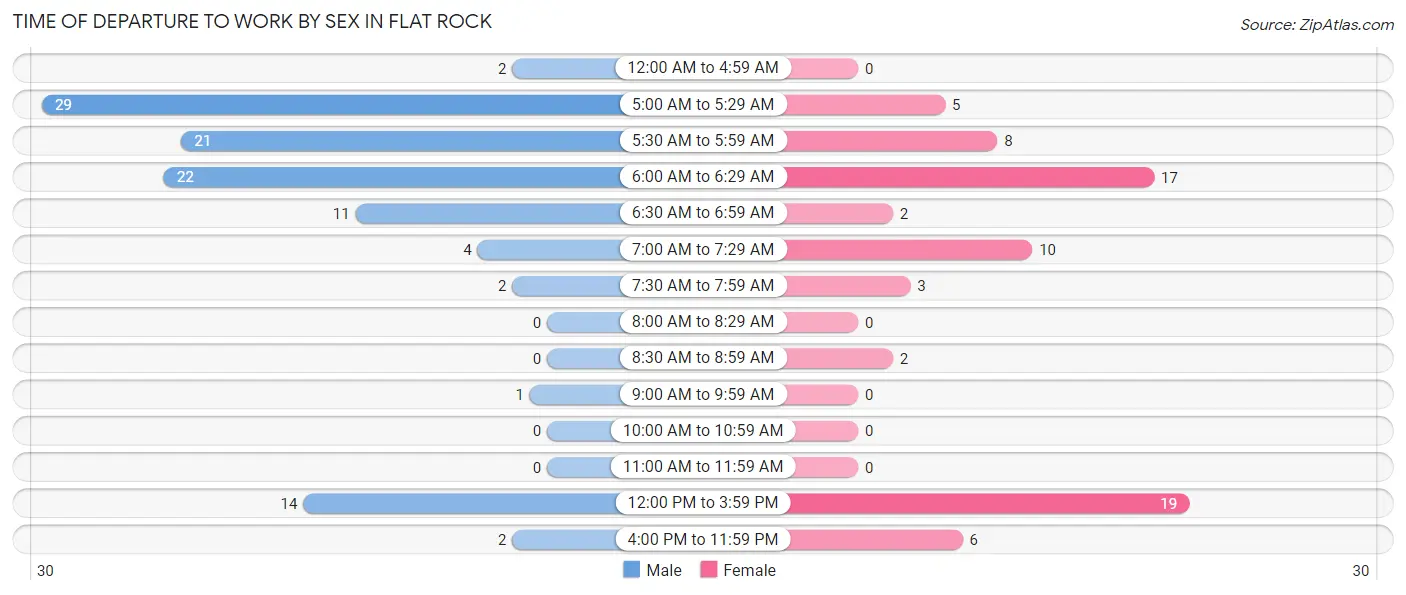
| Time of Departure | Male | Female |
| 12:00 AM to 4:59 AM | 2 (1.8%) | 0 (0.0%) |
| 5:00 AM to 5:29 AM | 29 (26.9%) | 5 (6.9%) |
| 5:30 AM to 5:59 AM | 21 (19.4%) | 8 (11.1%) |
| 6:00 AM to 6:29 AM | 22 (20.4%) | 17 (23.6%) |
| 6:30 AM to 6:59 AM | 11 (10.2%) | 2 (2.8%) |
| 7:00 AM to 7:29 AM | 4 (3.7%) | 10 (13.9%) |
| 7:30 AM to 7:59 AM | 2 (1.8%) | 3 (4.2%) |
| 8:00 AM to 8:29 AM | 0 (0.0%) | 0 (0.0%) |
| 8:30 AM to 8:59 AM | 0 (0.0%) | 2 (2.8%) |
| 9:00 AM to 9:59 AM | 1 (0.9%) | 0 (0.0%) |
| 10:00 AM to 10:59 AM | 0 (0.0%) | 0 (0.0%) |
| 11:00 AM to 11:59 AM | 0 (0.0%) | 0 (0.0%) |
| 12:00 PM to 3:59 PM | 14 (13.0%) | 19 (26.4%) |
| 4:00 PM to 11:59 PM | 2 (1.8%) | 6 (8.3%) |
| Total | 108 (100.0%) | 72 (100.0%) |
Housing Occupancy in Flat Rock
Occupancy by Ownership in Flat Rock
Of the total 179 dwellings in Flat Rock, owner-occupied units account for 156 (87.2%), while renter-occupied units make up 23 (12.9%).
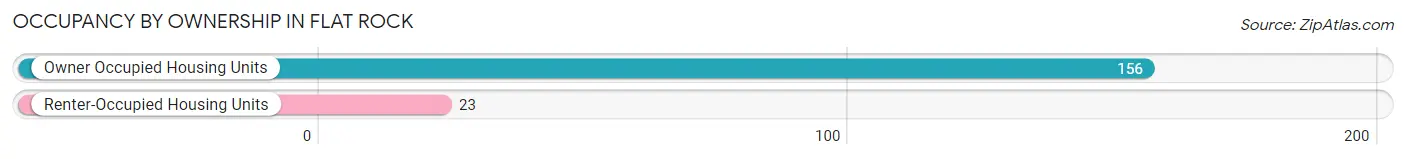
| Occupancy | # Housing Units | % Housing Units |
| Owner Occupied Housing Units | 156 | 87.2% |
| Renter-Occupied Housing Units | 23 | 12.9% |
| Total Occupied Housing Units | 179 | 100.0% |
Occupancy by Household Size in Flat Rock
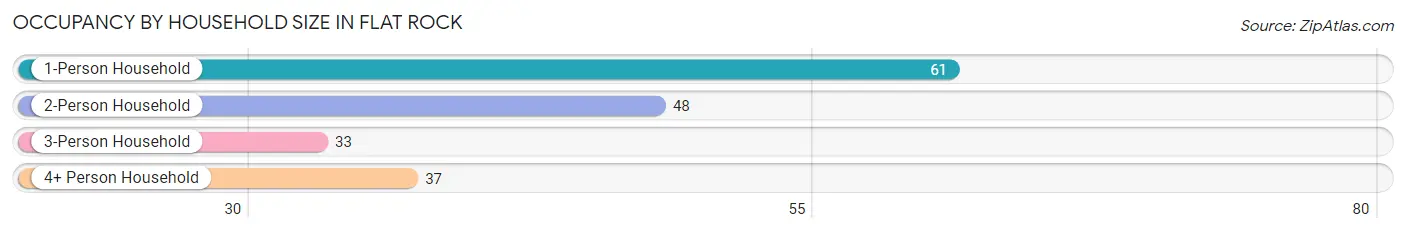
| Household Size | # Housing Units | % Housing Units |
| 1-Person Household | 61 | 34.1% |
| 2-Person Household | 48 | 26.8% |
| 3-Person Household | 33 | 18.4% |
| 4+ Person Household | 37 | 20.7% |
| Total Housing Units | 179 | 100.0% |
Occupancy by Ownership by Household Size in Flat Rock
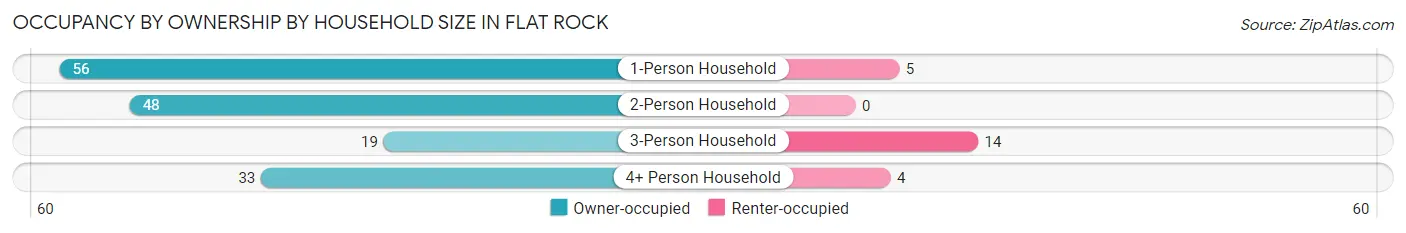
| Household Size | Owner-occupied | Renter-occupied |
| 1-Person Household | 56 (91.8%) | 5 (8.2%) |
| 2-Person Household | 48 (100.0%) | 0 (0.0%) |
| 3-Person Household | 19 (57.6%) | 14 (42.4%) |
| 4+ Person Household | 33 (89.2%) | 4 (10.8%) |
| Total Housing Units | 156 (87.2%) | 23 (12.9%) |
Occupancy by Educational Attainment in Flat Rock
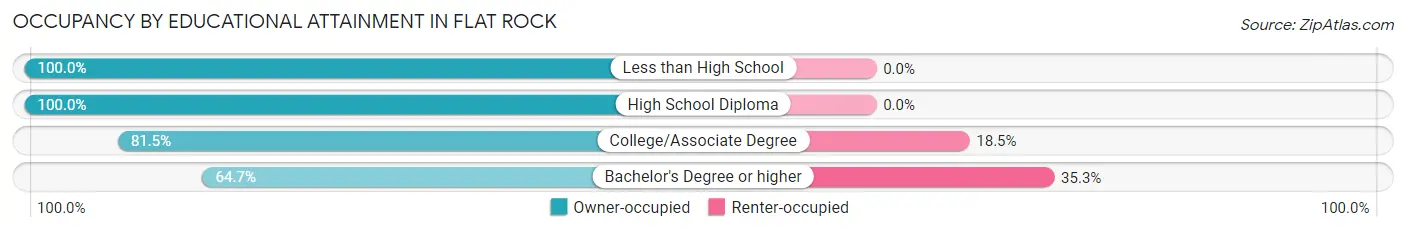
| Household Size | Owner-occupied | Renter-occupied |
| Less than High School | 17 (100.0%) | 0 (0.0%) |
| High School Diploma | 53 (100.0%) | 0 (0.0%) |
| College/Associate Degree | 75 (81.5%) | 17 (18.5%) |
| Bachelor's Degree or higher | 11 (64.7%) | 6 (35.3%) |
Occupancy by Age of Householder in Flat Rock
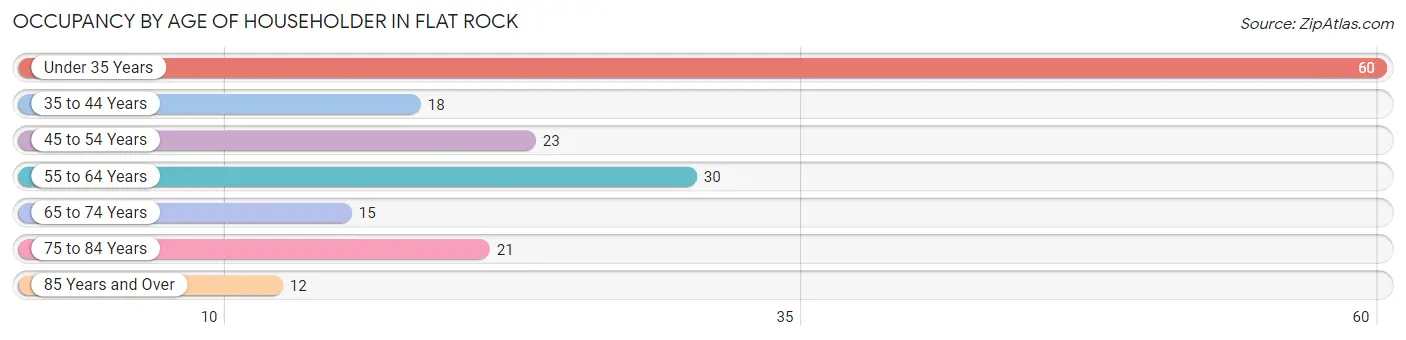
| Age Bracket | # Households | % Households |
| Under 35 Years | 60 | 33.5% |
| 35 to 44 Years | 18 | 10.1% |
| 45 to 54 Years | 23 | 12.9% |
| 55 to 64 Years | 30 | 16.8% |
| 65 to 74 Years | 15 | 8.4% |
| 75 to 84 Years | 21 | 11.7% |
| 85 Years and Over | 12 | 6.7% |
| Total | 179 | 100.0% |
Housing Finances in Flat Rock
Median Income by Occupancy in Flat Rock
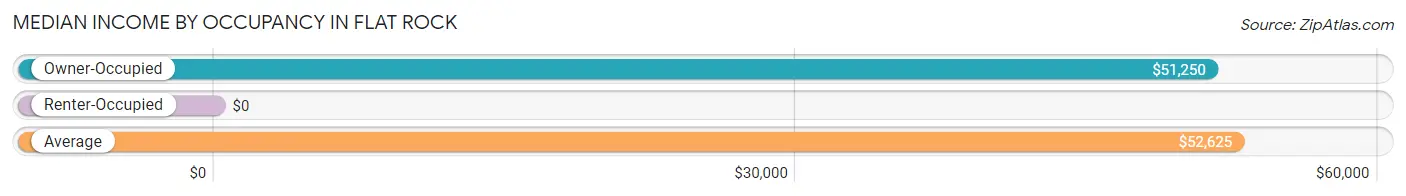
| Occupancy Type | # Households | Median Income |
| Owner-Occupied | 156 (87.2%) | $51,250 |
| Renter-Occupied | 23 (12.9%) | $0 |
| Average | 179 (100.0%) | $52,625 |
Occupancy by Householder Income Bracket in Flat Rock
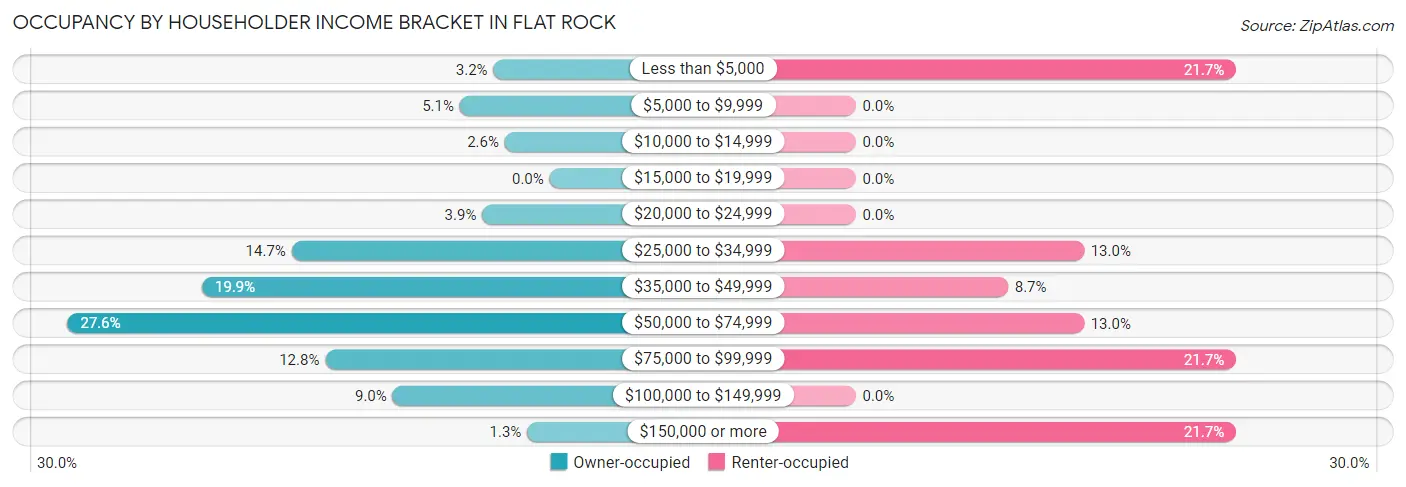
| Income Bracket | Owner-occupied | Renter-occupied |
| Less than $5,000 | 5 (3.2%) | 5 (21.7%) |
| $5,000 to $9,999 | 8 (5.1%) | 0 (0.0%) |
| $10,000 to $14,999 | 4 (2.6%) | 0 (0.0%) |
| $15,000 to $19,999 | 0 (0.0%) | 0 (0.0%) |
| $20,000 to $24,999 | 6 (3.8%) | 0 (0.0%) |
| $25,000 to $34,999 | 23 (14.7%) | 3 (13.0%) |
| $35,000 to $49,999 | 31 (19.9%) | 2 (8.7%) |
| $50,000 to $74,999 | 43 (27.6%) | 3 (13.0%) |
| $75,000 to $99,999 | 20 (12.8%) | 5 (21.7%) |
| $100,000 to $149,999 | 14 (9.0%) | 0 (0.0%) |
| $150,000 or more | 2 (1.3%) | 5 (21.7%) |
| Total | 156 (100.0%) | 23 (100.0%) |
Monthly Housing Cost Tiers in Flat Rock
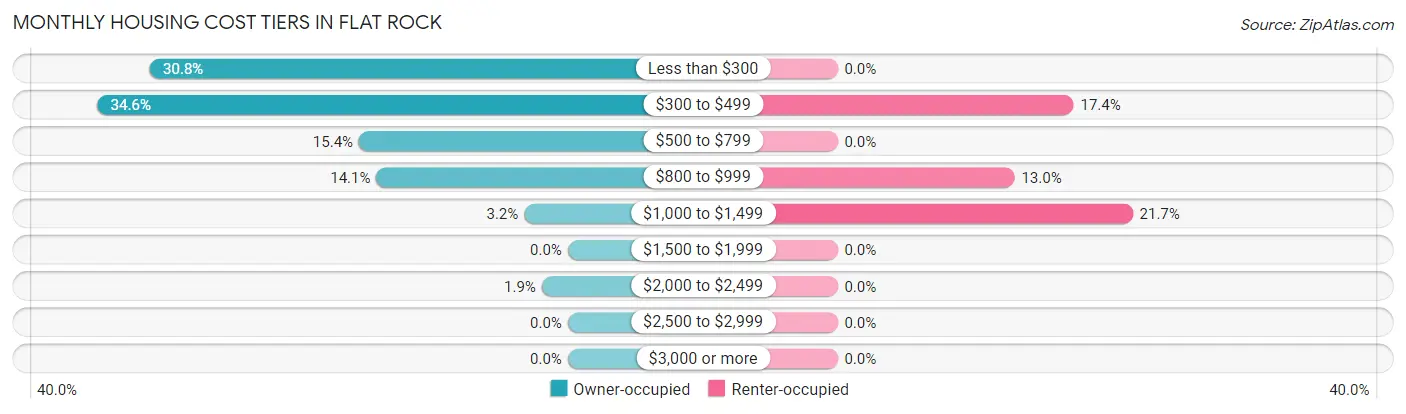
| Monthly Cost | Owner-occupied | Renter-occupied |
| Less than $300 | 48 (30.8%) | 0 (0.0%) |
| $300 to $499 | 54 (34.6%) | 4 (17.4%) |
| $500 to $799 | 24 (15.4%) | 0 (0.0%) |
| $800 to $999 | 22 (14.1%) | 3 (13.0%) |
| $1,000 to $1,499 | 5 (3.2%) | 5 (21.7%) |
| $1,500 to $1,999 | 0 (0.0%) | 0 (0.0%) |
| $2,000 to $2,499 | 3 (1.9%) | 0 (0.0%) |
| $2,500 to $2,999 | 0 (0.0%) | 0 (0.0%) |
| $3,000 or more | 0 (0.0%) | 0 (0.0%) |
| Total | 156 (100.0%) | 23 (100.0%) |
Physical Housing Characteristics in Flat Rock
Housing Structures in Flat Rock
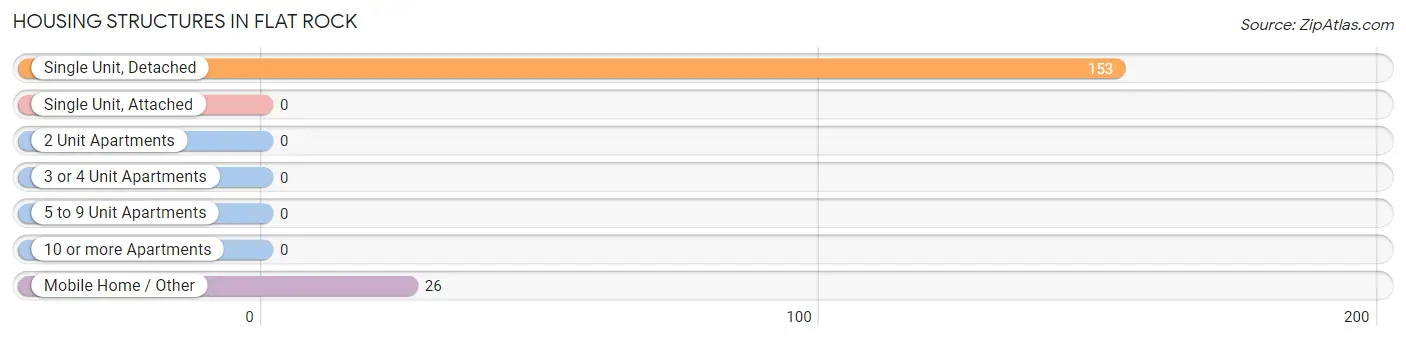
| Structure Type | # Housing Units | % Housing Units |
| Single Unit, Detached | 153 | 85.5% |
| Single Unit, Attached | 0 | 0.0% |
| 2 Unit Apartments | 0 | 0.0% |
| 3 or 4 Unit Apartments | 0 | 0.0% |
| 5 to 9 Unit Apartments | 0 | 0.0% |
| 10 or more Apartments | 0 | 0.0% |
| Mobile Home / Other | 26 | 14.5% |
| Total | 179 | 100.0% |
Housing Structures by Occupancy in Flat Rock
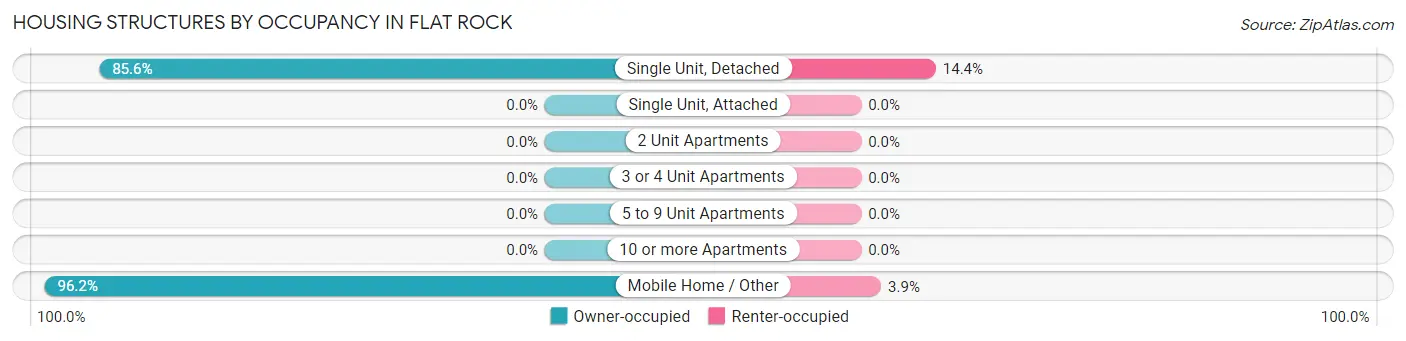
| Structure Type | Owner-occupied | Renter-occupied |
| Single Unit, Detached | 131 (85.6%) | 22 (14.4%) |
| Single Unit, Attached | 0 (0.0%) | 0 (0.0%) |
| 2 Unit Apartments | 0 (0.0%) | 0 (0.0%) |
| 3 or 4 Unit Apartments | 0 (0.0%) | 0 (0.0%) |
| 5 to 9 Unit Apartments | 0 (0.0%) | 0 (0.0%) |
| 10 or more Apartments | 0 (0.0%) | 0 (0.0%) |
| Mobile Home / Other | 25 (96.2%) | 1 (3.8%) |
| Total | 156 (87.2%) | 23 (12.9%) |
Housing Structures by Number of Rooms in Flat Rock
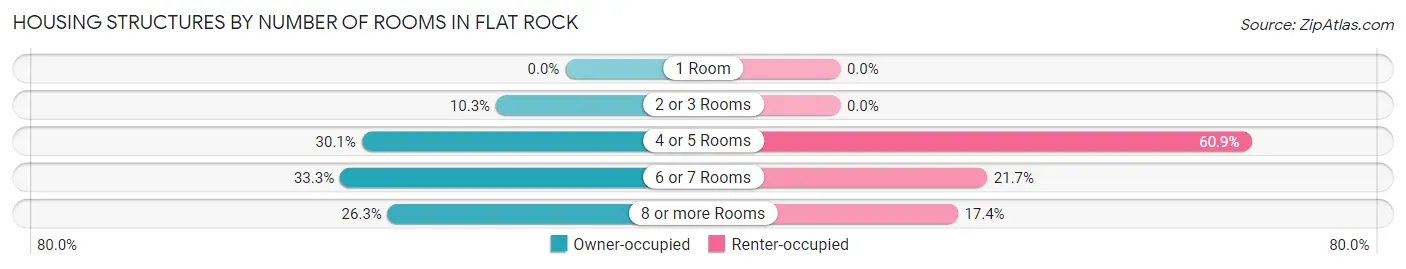
| Number of Rooms | Owner-occupied | Renter-occupied |
| 1 Room | 0 (0.0%) | 0 (0.0%) |
| 2 or 3 Rooms | 16 (10.3%) | 0 (0.0%) |
| 4 or 5 Rooms | 47 (30.1%) | 14 (60.9%) |
| 6 or 7 Rooms | 52 (33.3%) | 5 (21.7%) |
| 8 or more Rooms | 41 (26.3%) | 4 (17.4%) |
| Total | 156 (100.0%) | 23 (100.0%) |
Housing Structure by Heating Type in Flat Rock
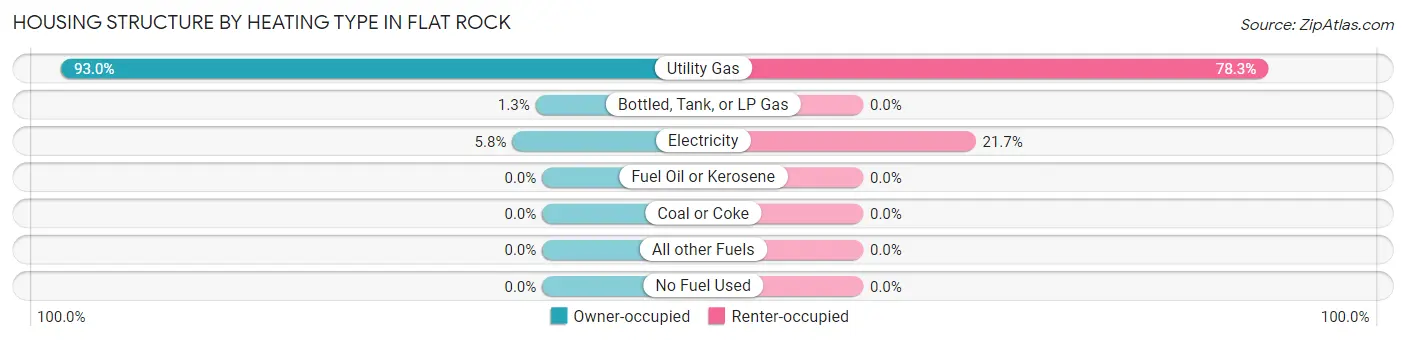
| Heating Type | Owner-occupied | Renter-occupied |
| Utility Gas | 145 (92.9%) | 18 (78.3%) |
| Bottled, Tank, or LP Gas | 2 (1.3%) | 0 (0.0%) |
| Electricity | 9 (5.8%) | 5 (21.7%) |
| Fuel Oil or Kerosene | 0 (0.0%) | 0 (0.0%) |
| Coal or Coke | 0 (0.0%) | 0 (0.0%) |
| All other Fuels | 0 (0.0%) | 0 (0.0%) |
| No Fuel Used | 0 (0.0%) | 0 (0.0%) |
| Total | 156 (100.0%) | 23 (100.0%) |
Household Vehicle Usage in Flat Rock
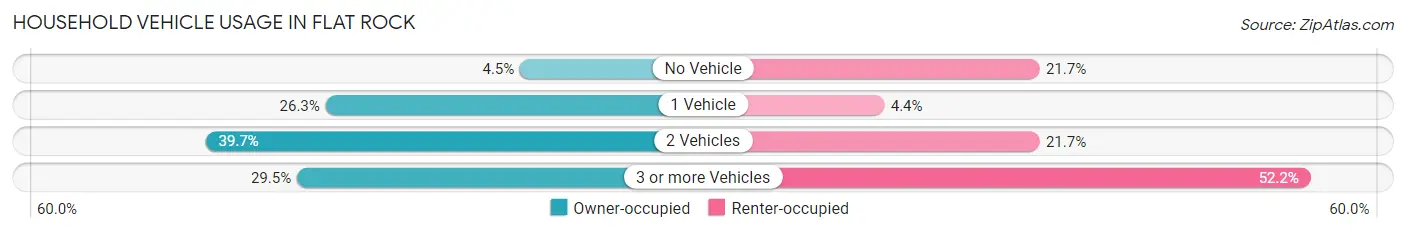
| Vehicles per Household | Owner-occupied | Renter-occupied |
| No Vehicle | 7 (4.5%) | 5 (21.7%) |
| 1 Vehicle | 41 (26.3%) | 1 (4.3%) |
| 2 Vehicles | 62 (39.7%) | 5 (21.7%) |
| 3 or more Vehicles | 46 (29.5%) | 12 (52.2%) |
| Total | 156 (100.0%) | 23 (100.0%) |
Real Estate & Mortgages in Flat Rock
Real Estate and Mortgage Overview in Flat Rock
| Characteristic | Without Mortgage | With Mortgage |
| Housing Units | 106 | 50 |
| Median Property Value | $54,100 | $70,000 |
| Median Household Income | $45,000 | $2 |
| Monthly Housing Costs | $316 | $0 |
| Real Estate Taxes | $505 | $0 |
Property Value by Mortgage Status in Flat Rock
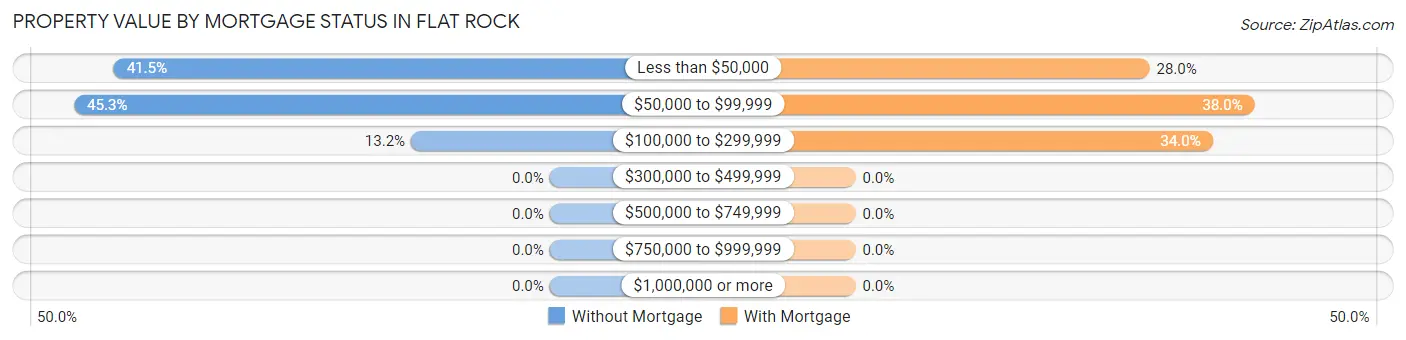
| Property Value | Without Mortgage | With Mortgage |
| Less than $50,000 | 44 (41.5%) | 14 (28.0%) |
| $50,000 to $99,999 | 48 (45.3%) | 19 (38.0%) |
| $100,000 to $299,999 | 14 (13.2%) | 17 (34.0%) |
| $300,000 to $499,999 | 0 (0.0%) | 0 (0.0%) |
| $500,000 to $749,999 | 0 (0.0%) | 0 (0.0%) |
| $750,000 to $999,999 | 0 (0.0%) | 0 (0.0%) |
| $1,000,000 or more | 0 (0.0%) | 0 (0.0%) |
| Total | 106 (100.0%) | 50 (100.0%) |
Household Income by Mortgage Status in Flat Rock
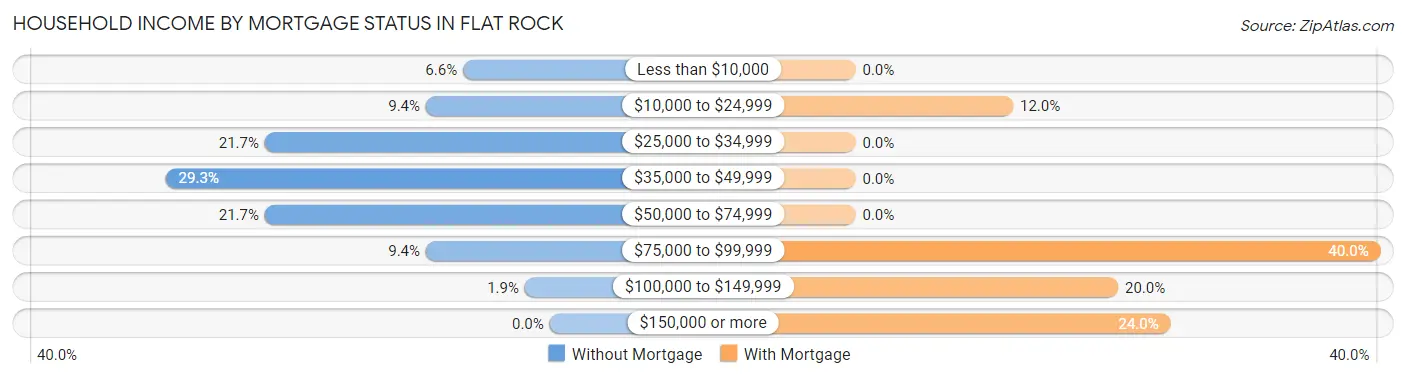
| Household Income | Without Mortgage | With Mortgage |
| Less than $10,000 | 7 (6.6%) | 0 (0.0%) |
| $10,000 to $24,999 | 10 (9.4%) | 6 (12.0%) |
| $25,000 to $34,999 | 23 (21.7%) | 0 (0.0%) |
| $35,000 to $49,999 | 31 (29.2%) | 0 (0.0%) |
| $50,000 to $74,999 | 23 (21.7%) | 0 (0.0%) |
| $75,000 to $99,999 | 10 (9.4%) | 20 (40.0%) |
| $100,000 to $149,999 | 2 (1.9%) | 10 (20.0%) |
| $150,000 or more | 0 (0.0%) | 12 (24.0%) |
| Total | 106 (100.0%) | 50 (100.0%) |
Property Value to Household Income Ratio in Flat Rock
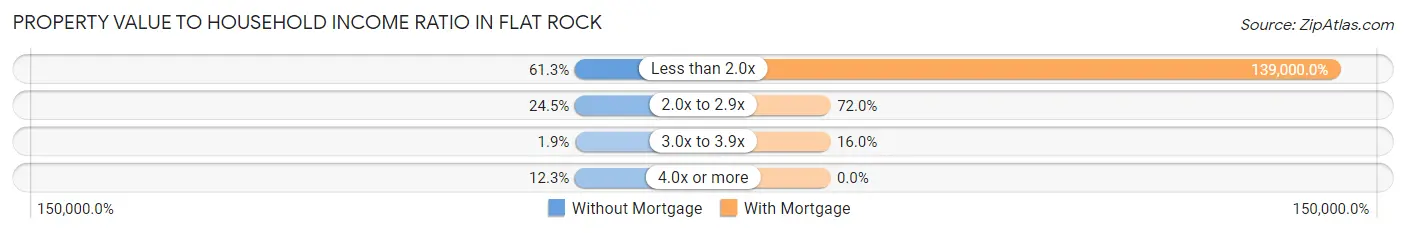
| Value-to-Income Ratio | Without Mortgage | With Mortgage |
| Less than 2.0x | 65 (61.3%) | 69,500 (139,000.0%) |
| 2.0x to 2.9x | 26 (24.5%) | 36 (72.0%) |
| 3.0x to 3.9x | 2 (1.9%) | 8 (16.0%) |
| 4.0x or more | 13 (12.3%) | 0 (0.0%) |
| Total | 106 (100.0%) | 50 (100.0%) |
Real Estate Taxes by Mortgage Status in Flat Rock
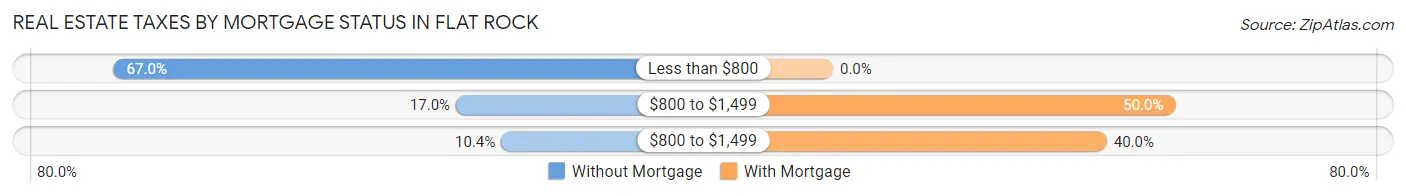
| Property Taxes | Without Mortgage | With Mortgage |
| Less than $800 | 71 (67.0%) | 0 (0.0%) |
| $800 to $1,499 | 18 (17.0%) | 25 (50.0%) |
| $800 to $1,499 | 11 (10.4%) | 20 (40.0%) |
| Total | 106 (100.0%) | 50 (100.0%) |
Health & Disability in Flat Rock
Health Insurance Coverage by Age in Flat Rock
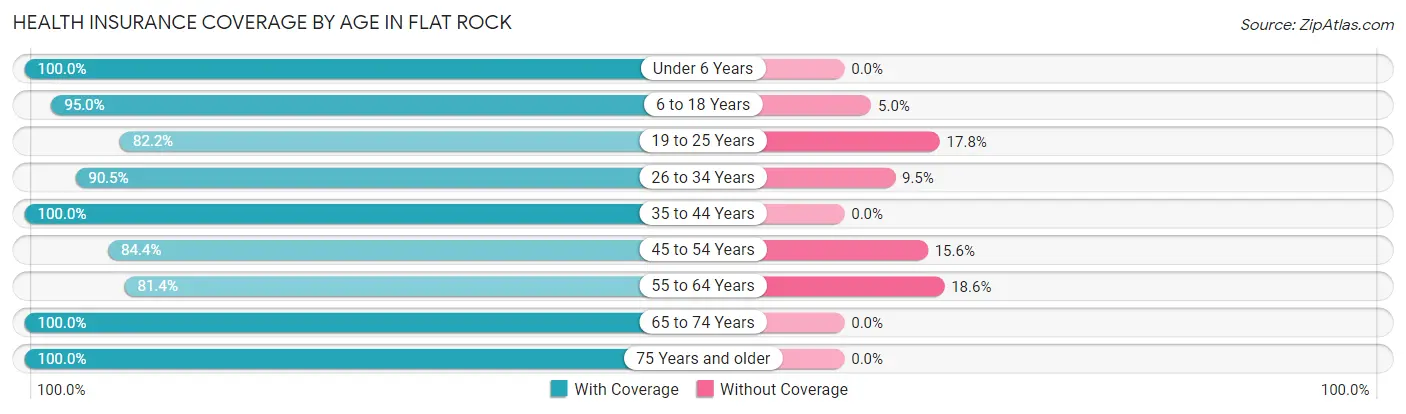
| Age Bracket | With Coverage | Without Coverage |
| Under 6 Years | 68 (100.0%) | 0 (0.0%) |
| 6 to 18 Years | 57 (95.0%) | 3 (5.0%) |
| 19 to 25 Years | 37 (82.2%) | 8 (17.8%) |
| 26 to 34 Years | 67 (90.5%) | 7 (9.5%) |
| 35 to 44 Years | 39 (100.0%) | 0 (0.0%) |
| 45 to 54 Years | 38 (84.4%) | 7 (15.6%) |
| 55 to 64 Years | 48 (81.4%) | 11 (18.6%) |
| 65 to 74 Years | 16 (100.0%) | 0 (0.0%) |
| 75 Years and older | 49 (100.0%) | 0 (0.0%) |
| Total | 419 (92.1%) | 36 (7.9%) |
Health Insurance Coverage by Citizenship Status in Flat Rock
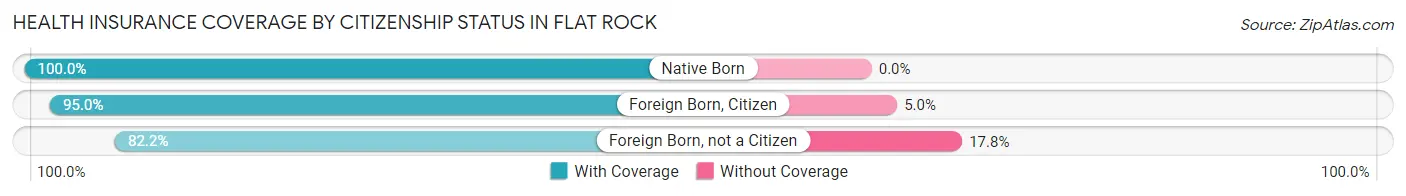
| Citizenship Status | With Coverage | Without Coverage |
| Native Born | 68 (100.0%) | 0 (0.0%) |
| Foreign Born, Citizen | 57 (95.0%) | 3 (5.0%) |
| Foreign Born, not a Citizen | 37 (82.2%) | 8 (17.8%) |
Health Insurance Coverage by Household Income in Flat Rock
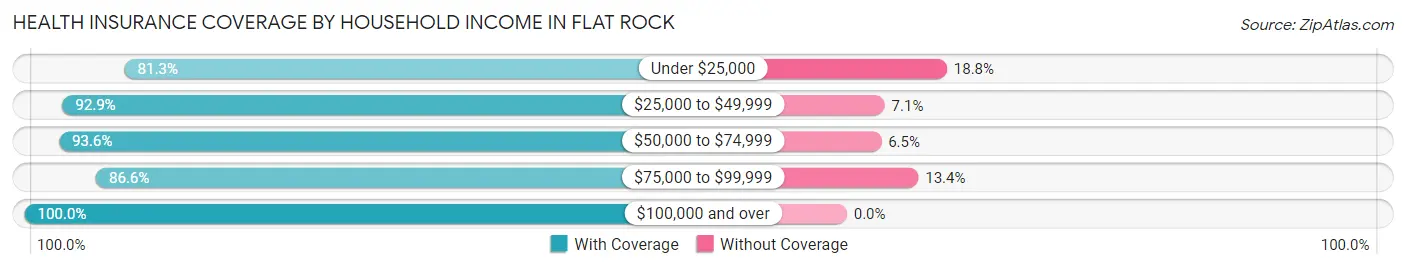
| Household Income | With Coverage | Without Coverage |
| Under $25,000 | 26 (81.2%) | 6 (18.8%) |
| $25,000 to $49,999 | 118 (92.9%) | 9 (7.1%) |
| $50,000 to $74,999 | 116 (93.5%) | 8 (6.5%) |
| $75,000 to $99,999 | 84 (86.6%) | 13 (13.4%) |
| $100,000 and over | 75 (100.0%) | 0 (0.0%) |
Public vs Private Health Insurance Coverage by Age in Flat Rock
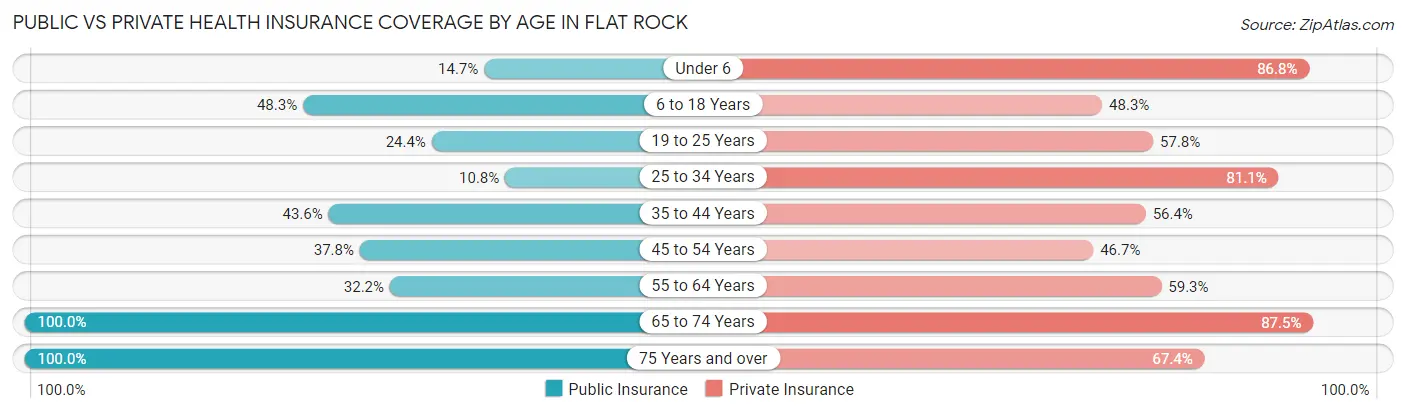
| Age Bracket | Public Insurance | Private Insurance |
| Under 6 | 10 (14.7%) | 59 (86.8%) |
| 6 to 18 Years | 29 (48.3%) | 29 (48.3%) |
| 19 to 25 Years | 11 (24.4%) | 26 (57.8%) |
| 25 to 34 Years | 8 (10.8%) | 60 (81.1%) |
| 35 to 44 Years | 17 (43.6%) | 22 (56.4%) |
| 45 to 54 Years | 17 (37.8%) | 21 (46.7%) |
| 55 to 64 Years | 19 (32.2%) | 35 (59.3%) |
| 65 to 74 Years | 16 (100.0%) | 14 (87.5%) |
| 75 Years and over | 49 (100.0%) | 33 (67.3%) |
| Total | 176 (38.7%) | 299 (65.7%) |
Disability Status by Sex by Age in Flat Rock
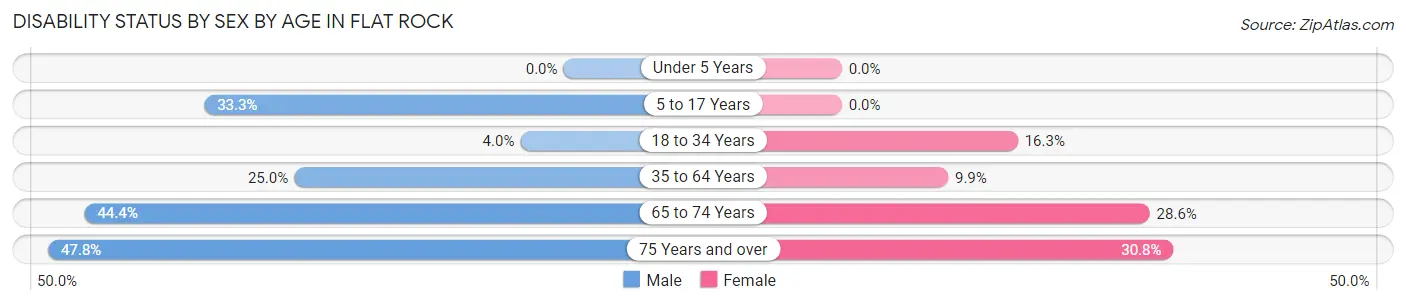
| Age Bracket | Male | Female |
| Under 5 Years | 0 (0.0%) | 0 (0.0%) |
| 5 to 17 Years | 7 (33.3%) | 0 (0.0%) |
| 18 to 34 Years | 3 (4.0%) | 8 (16.3%) |
| 35 to 64 Years | 18 (25.0%) | 7 (9.9%) |
| 65 to 74 Years | 4 (44.4%) | 2 (28.6%) |
| 75 Years and over | 11 (47.8%) | 8 (30.8%) |
Disability Class by Sex by Age in Flat Rock
Disability Class: Hearing Difficulty
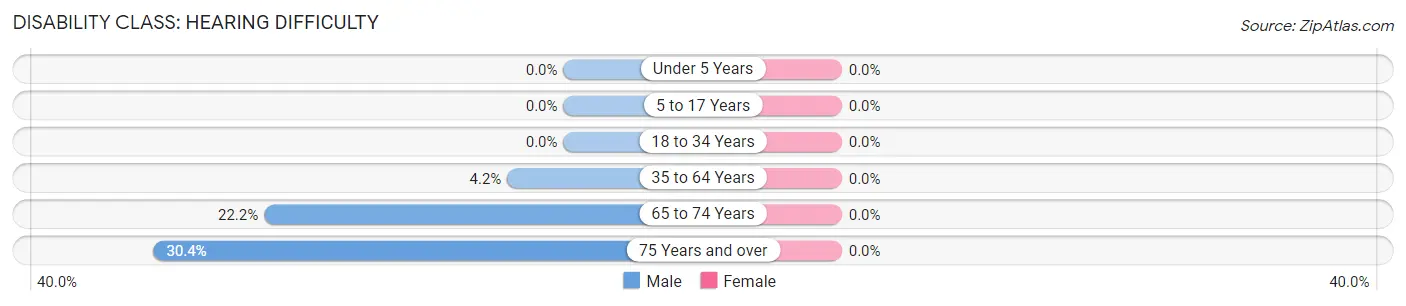
| Age Bracket | Male | Female |
| Under 5 Years | 0 (0.0%) | 0 (0.0%) |
| 5 to 17 Years | 0 (0.0%) | 0 (0.0%) |
| 18 to 34 Years | 0 (0.0%) | 0 (0.0%) |
| 35 to 64 Years | 3 (4.2%) | 0 (0.0%) |
| 65 to 74 Years | 2 (22.2%) | 0 (0.0%) |
| 75 Years and over | 7 (30.4%) | 0 (0.0%) |
Disability Class: Vision Difficulty
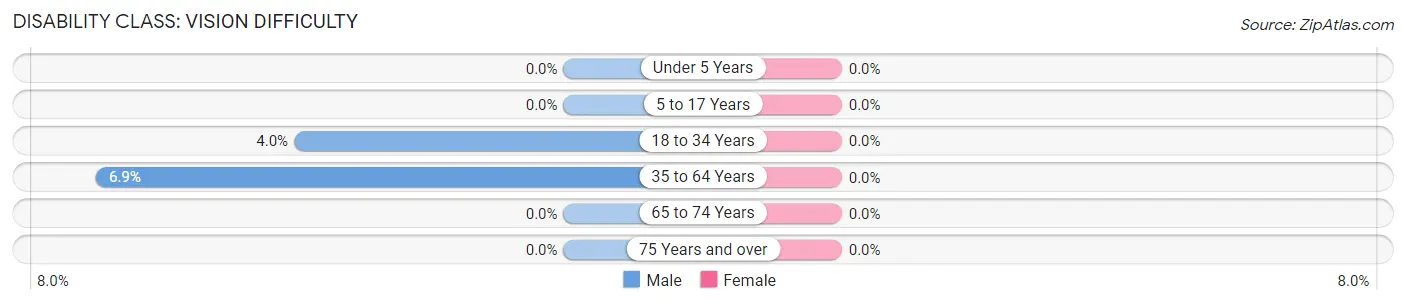
| Age Bracket | Male | Female |
| Under 5 Years | 0 (0.0%) | 0 (0.0%) |
| 5 to 17 Years | 0 (0.0%) | 0 (0.0%) |
| 18 to 34 Years | 3 (4.0%) | 0 (0.0%) |
| 35 to 64 Years | 5 (6.9%) | 0 (0.0%) |
| 65 to 74 Years | 0 (0.0%) | 0 (0.0%) |
| 75 Years and over | 0 (0.0%) | 0 (0.0%) |
Disability Class: Cognitive Difficulty
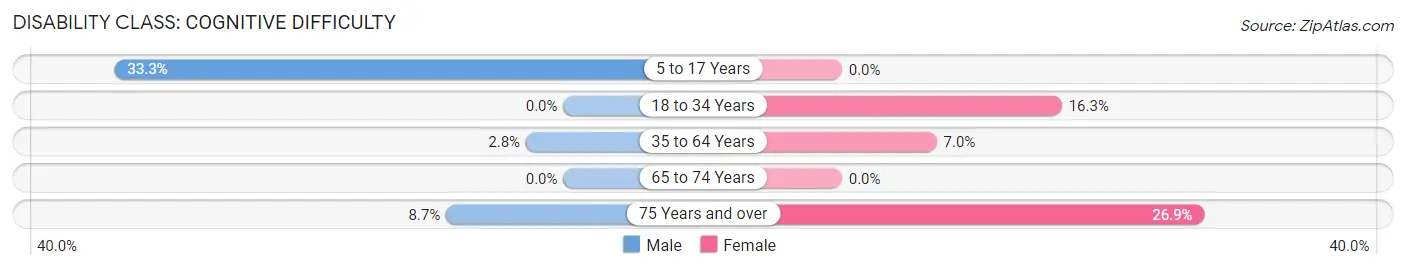
| Age Bracket | Male | Female |
| 5 to 17 Years | 7 (33.3%) | 0 (0.0%) |
| 18 to 34 Years | 0 (0.0%) | 8 (16.3%) |
| 35 to 64 Years | 2 (2.8%) | 5 (7.0%) |
| 65 to 74 Years | 0 (0.0%) | 0 (0.0%) |
| 75 Years and over | 2 (8.7%) | 7 (26.9%) |
Disability Class: Ambulatory Difficulty
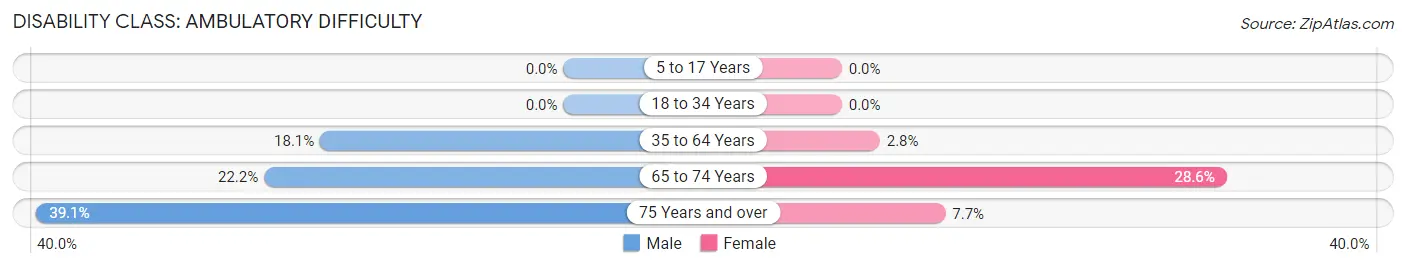
| Age Bracket | Male | Female |
| 5 to 17 Years | 0 (0.0%) | 0 (0.0%) |
| 18 to 34 Years | 0 (0.0%) | 0 (0.0%) |
| 35 to 64 Years | 13 (18.1%) | 2 (2.8%) |
| 65 to 74 Years | 2 (22.2%) | 2 (28.6%) |
| 75 Years and over | 9 (39.1%) | 2 (7.7%) |
Disability Class: Self-Care Difficulty
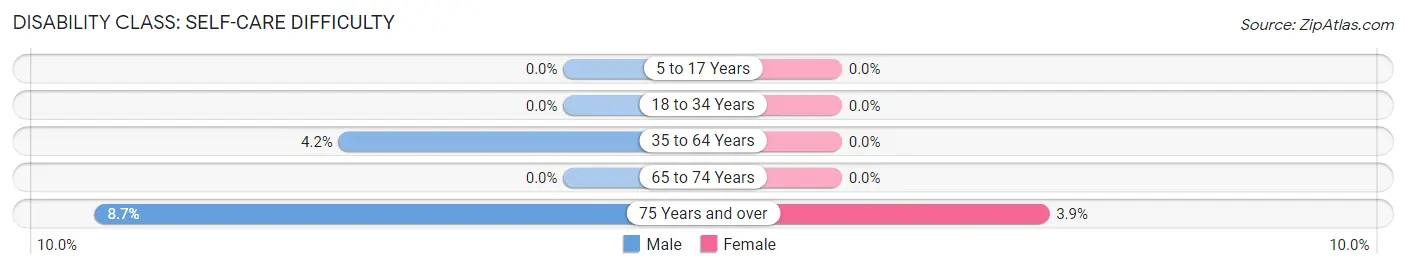
| Age Bracket | Male | Female |
| 5 to 17 Years | 0 (0.0%) | 0 (0.0%) |
| 18 to 34 Years | 0 (0.0%) | 0 (0.0%) |
| 35 to 64 Years | 3 (4.2%) | 0 (0.0%) |
| 65 to 74 Years | 0 (0.0%) | 0 (0.0%) |
| 75 Years and over | 2 (8.7%) | 1 (3.8%) |
Technology Access in Flat Rock
Computing Device Access in Flat Rock
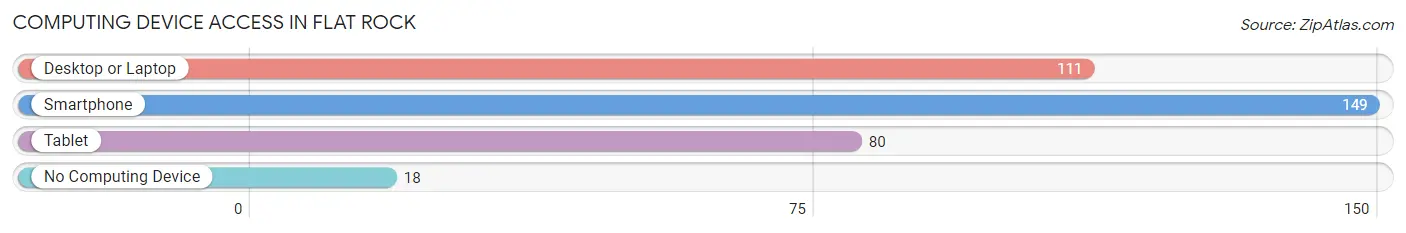
| Device Type | # Households | % Households |
| Desktop or Laptop | 111 | 62.0% |
| Smartphone | 149 | 83.2% |
| Tablet | 80 | 44.7% |
| No Computing Device | 18 | 10.1% |
| Total | 179 | 100.0% |
Internet Access in Flat Rock
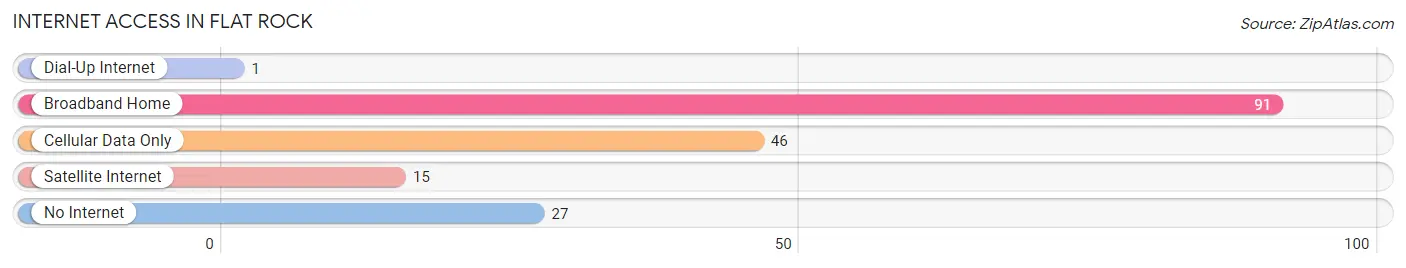
| Internet Type | # Households | % Households |
| Dial-Up Internet | 1 | 0.6% |
| Broadband Home | 91 | 50.8% |
| Cellular Data Only | 46 | 25.7% |
| Satellite Internet | 15 | 8.4% |
| No Internet | 27 | 15.1% |
| Total | 179 | 100.0% |
Flat Rock Summary
Flat Rock is a small village located in the state of Illinois, in the United States. It is situated in the southeastern part of the state, in the county of Lawrence. The village is located on the banks of the Embarras River, and is surrounded by rolling hills and farmland. The population of Flat Rock was estimated to be around 500 people in 2020.
History
Flat Rock was first settled in 1819 by a group of settlers from Kentucky. The village was originally known as “Flat Rock Station”, and was a stop on the stagecoach line that ran between Vincennes, Indiana and St. Louis, Missouri. The village was officially incorporated in 1837, and the name was changed to Flat Rock.
The village was a popular stop for travelers, and it was also a center of commerce for the surrounding area. The village was home to several stores, a post office, a blacksmith shop, and a hotel. The village also had a school, which was established in 1845.
Geography
Flat Rock is located in the southeastern part of the state of Illinois, in the county of Lawrence. The village is situated on the banks of the Embarras River, and is surrounded by rolling hills and farmland. The village is located about 25 miles south of the city of Vincennes, Indiana, and about 50 miles east of the city of St. Louis, Missouri.
The climate in Flat Rock is classified as humid continental, with hot summers and cold winters. The average temperature in the summer is around 80 degrees Fahrenheit, and the average temperature in the winter is around 30 degrees Fahrenheit. The average annual precipitation is around 40 inches.
Economy
The economy of Flat Rock is largely based on agriculture. The village is home to several farms, which produce a variety of crops, including corn, soybeans, wheat, and hay. The village also has several small businesses, including a grocery store, a hardware store, and a restaurant.
Demographics
As of 2020, the population of Flat Rock was estimated to be around 500 people. The racial makeup of the village is predominantly white, with a small percentage of African Americans and Native Americans. The median household income in the village is around $45,000, and the median home value is around $90,000. The village has a high rate of homeownership, with around 80% of the population owning their own homes.
Flat Rock is a small village with a rich history and a strong sense of community. The village is home to a variety of businesses and farms, and is a popular destination for travelers. The village has a diverse population, and is a great place to live and work.
Common Questions
What is Per Capita Income in Flat Rock?
Per Capita income in Flat Rock is $24,601.
What is the Median Family Income in Flat Rock?
Median Family Income in Flat Rock is $57,045.
What is the Median Household income in Flat Rock?
Median Household Income in Flat Rock is $52,625.
What is Income or Wage Gap in Flat Rock?
Income or Wage Gap in Flat Rock is 42.6%.
Women in Flat Rock earn 57.4 cents for every dollar earned by a man.
What is Inequality or Gini Index in Flat Rock?
Inequality or Gini Index in Flat Rock is 0.37.
What is the Total Population of Flat Rock?
Total Population of Flat Rock is 455.
What is the Total Male Population of Flat Rock?
Total Male Population of Flat Rock is 230.
What is the Total Female Population of Flat Rock?
Total Female Population of Flat Rock is 225.
What is the Ratio of Males per 100 Females in Flat Rock?
There are 102.22 Males per 100 Females in Flat Rock.
What is the Ratio of Females per 100 Males in Flat Rock?
There are 97.83 Females per 100 Males in Flat Rock.
What is the Median Population Age in Flat Rock?
Median Population Age in Flat Rock is 34.1 Years.
What is the Average Family Size in Flat Rock
Average Family Size in Flat Rock is 3.3 People.
What is the Average Household Size in Flat Rock
Average Household Size in Flat Rock is 2.5 People.
How Large is the Labor Force in Flat Rock?
There are 209 People in the Labor Forcein in Flat Rock.
What is the Percentage of People in the Labor Force in Flat Rock?
62.0% of People are in the Labor Force in Flat Rock.
What is the Unemployment Rate in Flat Rock?
Unemployment Rate in Flat Rock is 7.2%.