Buffalo, IL Map & Demographics
Buffalo Map
Buffalo Overview
$38,188
PER CAPITA INCOME
$93,750
AVG FAMILY INCOME
$71,250
AVG HOUSEHOLD INCOME
59.5%
WAGE / INCOME GAP [ % ]
40.5¢/ $1
WAGE / INCOME GAP [ $ ]
0.43
INEQUALITY / GINI INDEX
397
TOTAL POPULATION
195
MALE POPULATION
202
FEMALE POPULATION
96.53
MALES / 100 FEMALES
103.59
FEMALES / 100 MALES
48.6
MEDIAN AGE
2.9
AVG FAMILY SIZE
2.4
AVG HOUSEHOLD SIZE
196
LABOR FORCE [ PEOPLE ]
58.2%
PERCENT IN LABOR FORCE
0.5%
UNEMPLOYMENT RATE
Buffalo Zip Codes
Buffalo Area Codes
Income in Buffalo
Income Overview in Buffalo
Per Capita Income in Buffalo is $38,188, while median incomes of families and households are $93,750 and $71,250 respectively.
| Characteristic | Number | Measure |
| Per Capita Income | 397 | $38,188 |
| Median Family Income | 110 | $93,750 |
| Mean Family Income | 110 | $96,519 |
| Median Household Income | 166 | $71,250 |
| Mean Household Income | 166 | $81,245 |
| Income Deficit | 110 | $0 |
| Wage / Income Gap (%) | 397 | 59.54% |
| Wage / Income Gap ($) | 397 | 40.46¢ per $1 |
| Gini / Inequality Index | 397 | 0.43 |
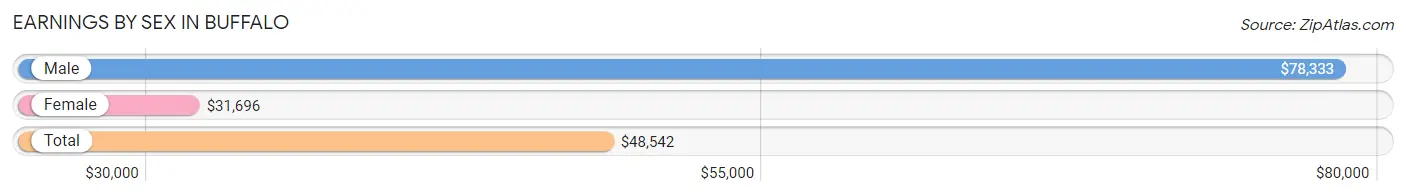
Earnings by Sex in Buffalo
Average Earnings in Buffalo are $48,542, $78,333 for men and $31,696 for women, a difference of 59.5%.
| Sex | Number | Average Earnings |
| Male | 112 (54.6%) | $78,333 |
| Female | 93 (45.4%) | $31,696 |
| Total | 205 (100.0%) | $48,542 |
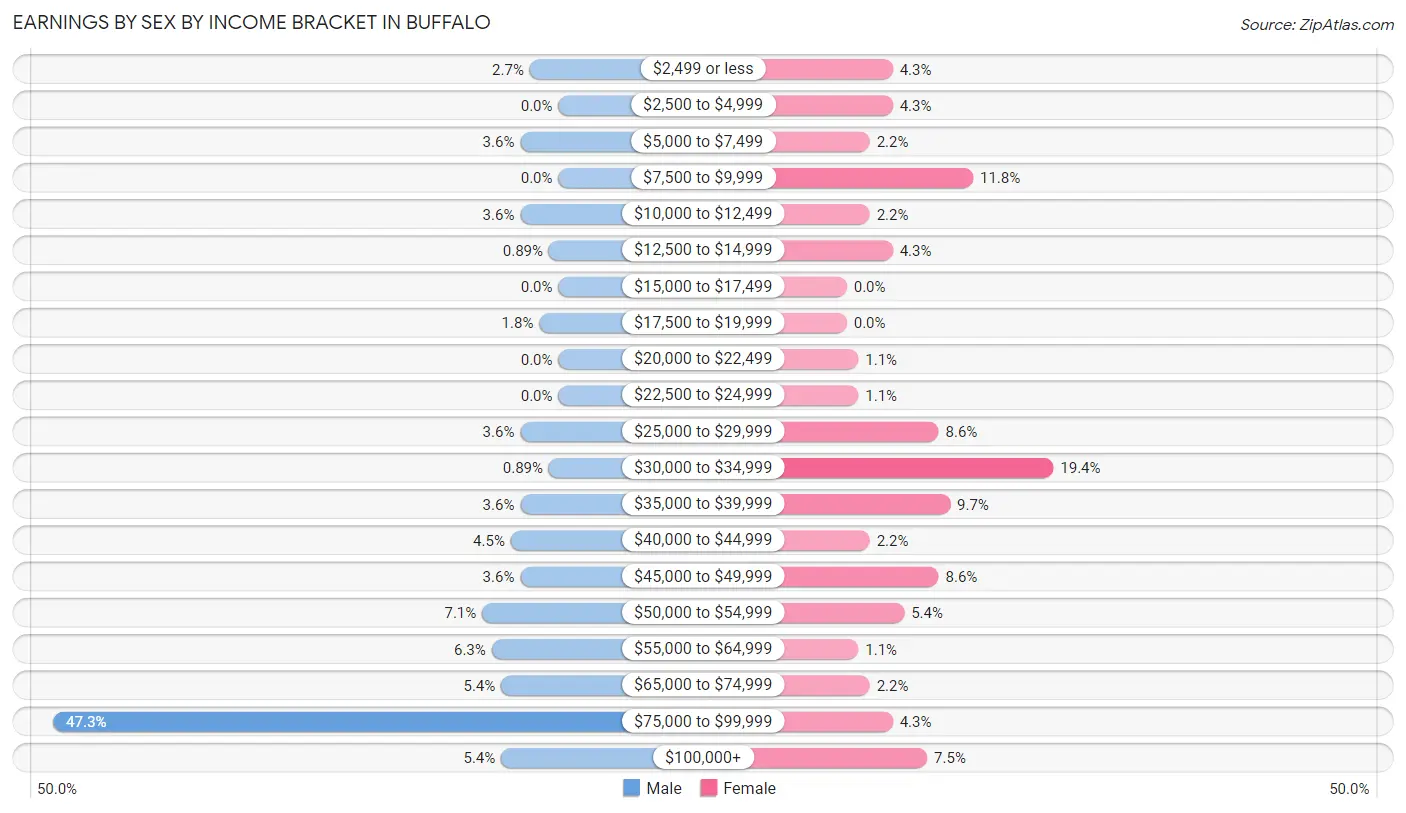
Earnings by Sex by Income Bracket in Buffalo
The most common earnings brackets in Buffalo are $75,000 to $99,999 for men (53 | 47.3%) and $30,000 to $34,999 for women (18 | 19.4%).
| Income | Male | Female |
| $2,499 or less | 3 (2.7%) | 4 (4.3%) |
| $2,500 to $4,999 | 0 (0.0%) | 4 (4.3%) |
| $5,000 to $7,499 | 4 (3.6%) | 2 (2.1%) |
| $7,500 to $9,999 | 0 (0.0%) | 11 (11.8%) |
| $10,000 to $12,499 | 4 (3.6%) | 2 (2.1%) |
| $12,500 to $14,999 | 1 (0.9%) | 4 (4.3%) |
| $15,000 to $17,499 | 0 (0.0%) | 0 (0.0%) |
| $17,500 to $19,999 | 2 (1.8%) | 0 (0.0%) |
| $20,000 to $22,499 | 0 (0.0%) | 1 (1.1%) |
| $22,500 to $24,999 | 0 (0.0%) | 1 (1.1%) |
| $25,000 to $29,999 | 4 (3.6%) | 8 (8.6%) |
| $30,000 to $34,999 | 1 (0.9%) | 18 (19.4%) |
| $35,000 to $39,999 | 4 (3.6%) | 9 (9.7%) |
| $40,000 to $44,999 | 5 (4.5%) | 2 (2.1%) |
| $45,000 to $49,999 | 4 (3.6%) | 8 (8.6%) |
| $50,000 to $54,999 | 8 (7.1%) | 5 (5.4%) |
| $55,000 to $64,999 | 7 (6.2%) | 1 (1.1%) |
| $65,000 to $74,999 | 6 (5.4%) | 2 (2.1%) |
| $75,000 to $99,999 | 53 (47.3%) | 4 (4.3%) |
| $100,000+ | 6 (5.4%) | 7 (7.5%) |
| Total | 112 (100.0%) | 93 (100.0%) |
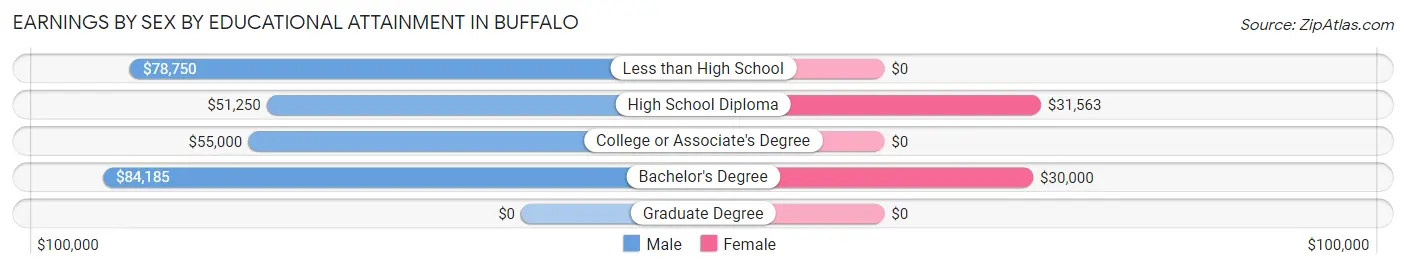
Earnings by Sex by Educational Attainment in Buffalo
Average earnings in Buffalo are $79,167 for men and $31,818 for women, a difference of 59.8%. Men with an educational attainment of bachelor's degree enjoy the highest average annual earnings of $84,185, while those with high school diploma education earn the least with $51,250. Women with an educational attainment of high school diploma earn the most with the average annual earnings of $31,563, while those with bachelor's degree education have the smallest earnings of $30,000.
| Educational Attainment | Male Income | Female Income |
| Less than High School | $78,750 | $0 |
| High School Diploma | $51,250 | $31,563 |
| College or Associate's Degree | $55,000 | $0 |
| Bachelor's Degree | $84,185 | $30,000 |
| Graduate Degree | - | - |
| Total | $79,167 | $31,818 |
Family Income in Buffalo
Family Income Brackets in Buffalo
According to the Buffalo family income data, there are 24 families falling into the $75,000 to $99,999 income range, which is the most common income bracket and makes up 21.8% of all families. Conversely, the less than $10,000 income bracket is the least frequent group with only 3 families (2.7%) belonging to this category.
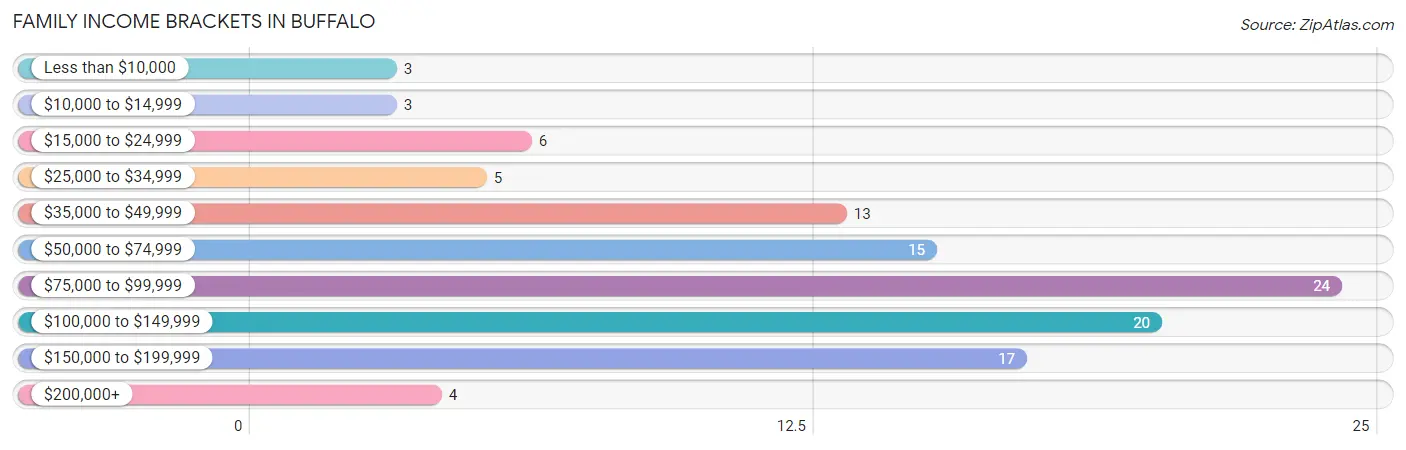
| Income Bracket | # Families | % Families |
| Less than $10,000 | 3 | 2.7% |
| $10,000 to $14,999 | 3 | 2.7% |
| $15,000 to $24,999 | 6 | 5.5% |
| $25,000 to $34,999 | 5 | 4.5% |
| $35,000 to $49,999 | 13 | 11.8% |
| $50,000 to $74,999 | 15 | 13.6% |
| $75,000 to $99,999 | 24 | 21.8% |
| $100,000 to $149,999 | 20 | 18.2% |
| $150,000 to $199,999 | 17 | 15.5% |
| $200,000+ | 4 | 3.6% |
Family Income by Famaliy Size in Buffalo
5-person families (6 | 5.4%) account for the highest median family income in Buffalo with $133,750 per family, while 2-person families (66 | 60.0%) have the highest median income of $45,625 per family member.
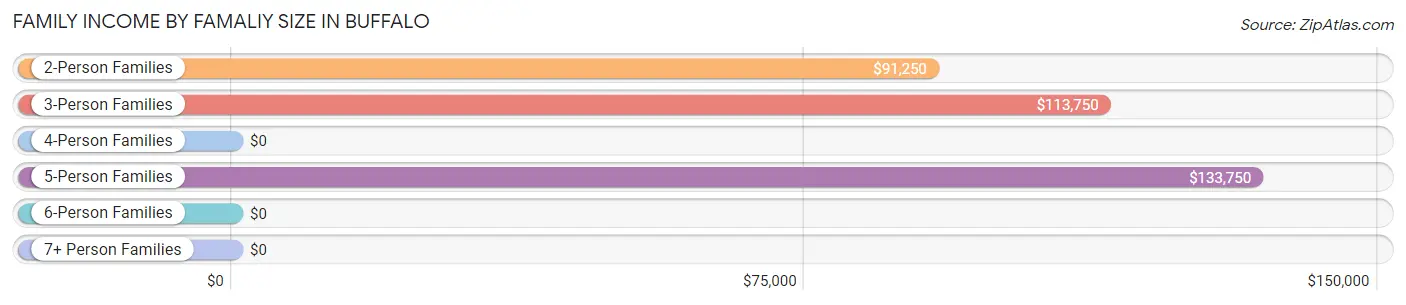
| Income Bracket | # Families | Median Income |
| 2-Person Families | 66 (60.0%) | $91,250 |
| 3-Person Families | 10 (9.1%) | $113,750 |
| 4-Person Families | 28 (25.5%) | $0 |
| 5-Person Families | 6 (5.4%) | $133,750 |
| 6-Person Families | 0 (0.0%) | $0 |
| 7+ Person Families | 0 (0.0%) | $0 |
| Total | 110 (100.0%) | $93,750 |
Family Income by Number of Earners in Buffalo
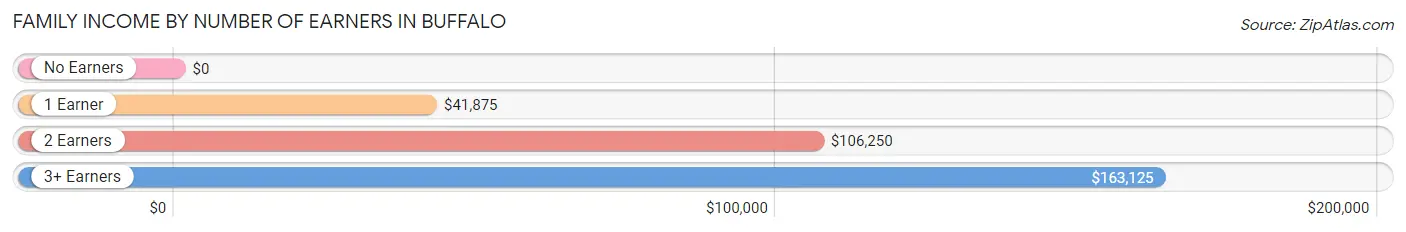
| Number of Earners | # Families | Median Income |
| No Earners | 27 (24.5%) | $0 |
| 1 Earner | 24 (21.8%) | $41,875 |
| 2 Earners | 52 (47.3%) | $106,250 |
| 3+ Earners | 7 (6.4%) | $163,125 |
| Total | 110 (100.0%) | $93,750 |
Household Income in Buffalo
Household Income Brackets in Buffalo
With 31 households falling in the category, the $100,000 to $149,999 income range is the most frequent in Buffalo, accounting for 18.7% of all households. In contrast, only 6 households (3.6%) fall into the $200,000+ income bracket, making it the least populous group.
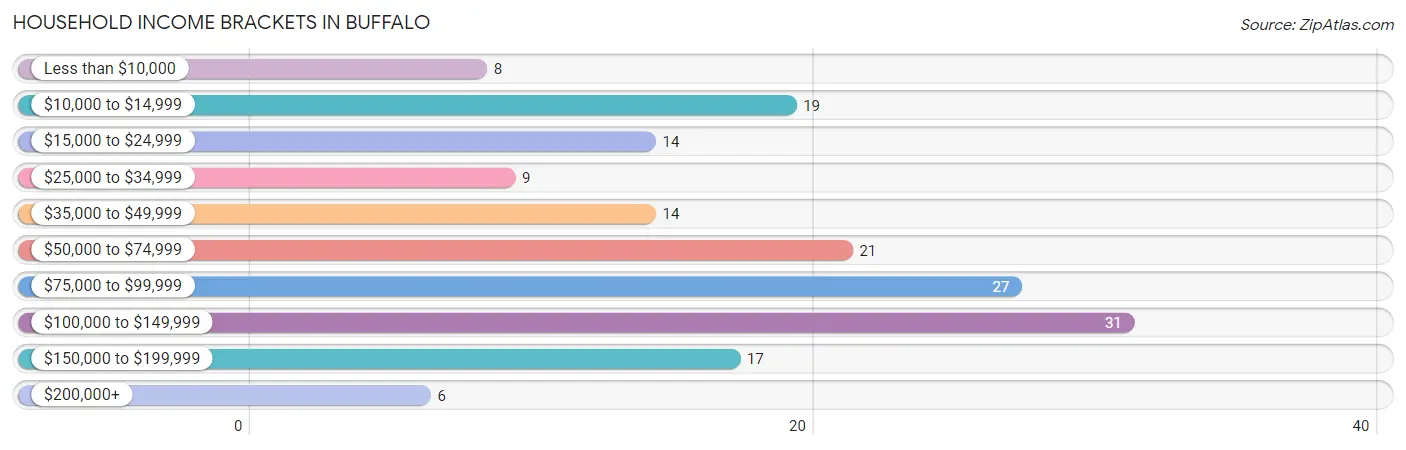
| Income Bracket | # Households | % Households |
| Less than $10,000 | 8 | 4.8% |
| $10,000 to $14,999 | 19 | 11.4% |
| $15,000 to $24,999 | 14 | 8.4% |
| $25,000 to $34,999 | 9 | 5.4% |
| $35,000 to $49,999 | 14 | 8.4% |
| $50,000 to $74,999 | 21 | 12.7% |
| $75,000 to $99,999 | 27 | 16.3% |
| $100,000 to $149,999 | 31 | 18.7% |
| $150,000 to $199,999 | 17 | 10.2% |
| $200,000+ | 6 | 3.6% |
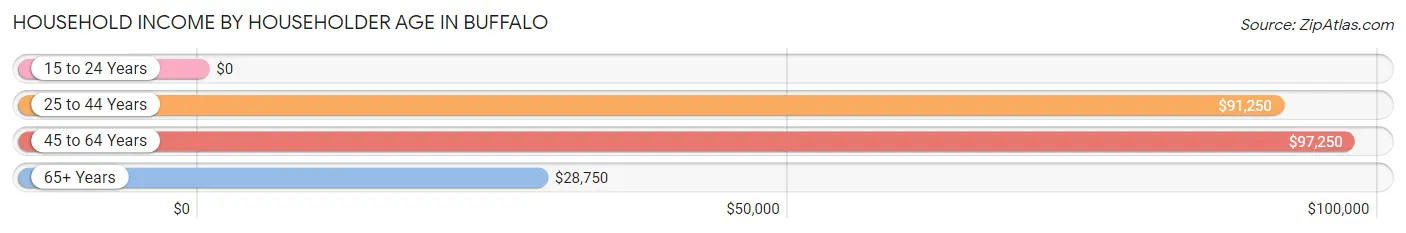
Household Income by Householder Age in Buffalo
The median household income in Buffalo is $71,250, with the highest median household income of $97,250 found in the 45 to 64 years age bracket for the primary householder. A total of 70 households (42.2%) fall into this category.
| Income Bracket | # Households | Median Income |
| 15 to 24 Years | 0 (0.0%) | $0 |
| 25 to 44 Years | 34 (20.5%) | $91,250 |
| 45 to 64 Years | 70 (42.2%) | $97,250 |
| 65+ Years | 62 (37.3%) | $28,750 |
| Total | 166 (100.0%) | $71,250 |
Poverty in Buffalo
Income Below Poverty by Sex and Age in Buffalo
With 8.7% poverty level for males and 11.4% for females among the residents of Buffalo, under 5 year old males and 12 to 14 year old females are the most vulnerable to poverty, with 4 males (100.0%) and 2 females (40.0%) in their respective age groups living below the poverty level.
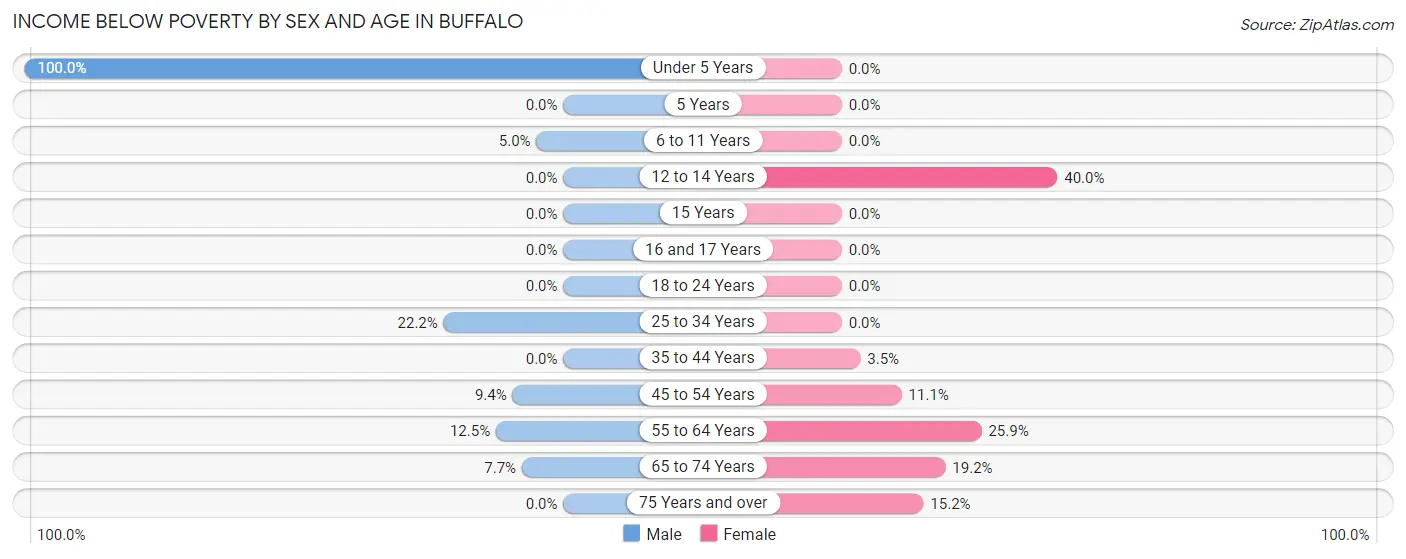
| Age Bracket | Male | Female |
| Under 5 Years | 4 (100.0%) | 0 (0.0%) |
| 5 Years | 0 (0.0%) | 0 (0.0%) |
| 6 to 11 Years | 1 (5.0%) | 0 (0.0%) |
| 12 to 14 Years | 0 (0.0%) | 2 (40.0%) |
| 15 Years | 0 (0.0%) | 0 (0.0%) |
| 16 and 17 Years | 0 (0.0%) | 0 (0.0%) |
| 18 to 24 Years | 0 (0.0%) | 0 (0.0%) |
| 25 to 34 Years | 2 (22.2%) | 0 (0.0%) |
| 35 to 44 Years | 0 (0.0%) | 1 (3.5%) |
| 45 to 54 Years | 5 (9.4%) | 3 (11.1%) |
| 55 to 64 Years | 3 (12.5%) | 7 (25.9%) |
| 65 to 74 Years | 2 (7.7%) | 5 (19.2%) |
| 75 Years and over | 0 (0.0%) | 5 (15.1%) |
| Total | 17 (8.7%) | 23 (11.4%) |
Income Above Poverty by Sex and Age in Buffalo
According to the poverty statistics in Buffalo, males aged 12 to 14 years and females aged 5 years are the age groups that are most secure financially, with 100.0% of males and 100.0% of females in these age groups living above the poverty line.
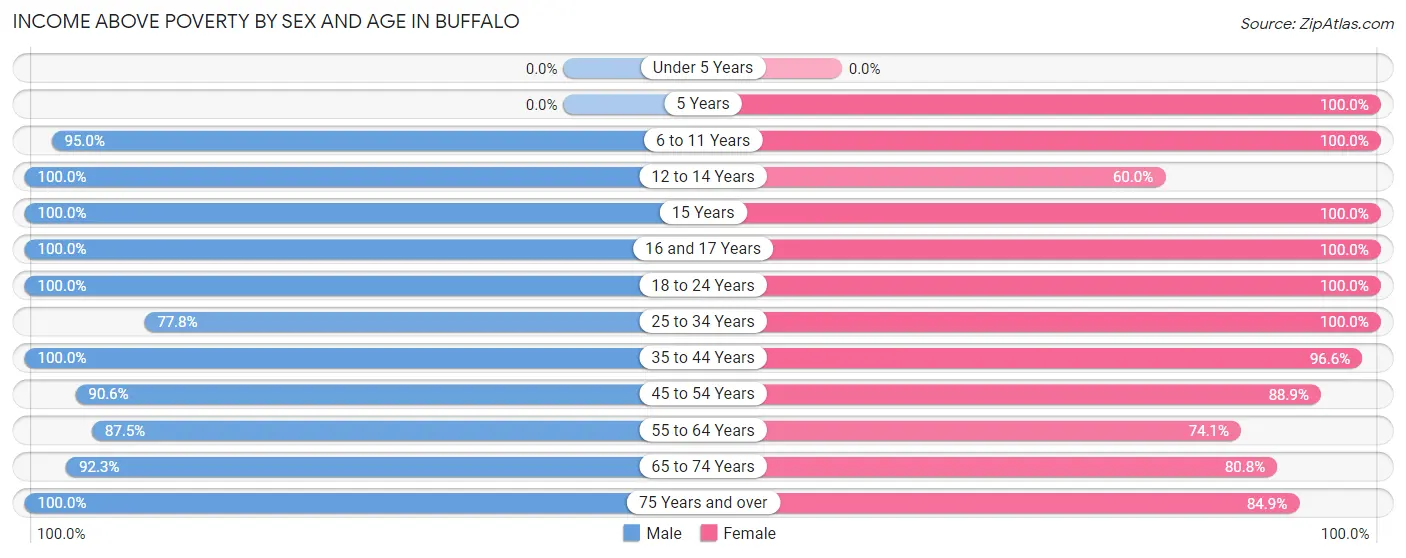
| Age Bracket | Male | Female |
| Under 5 Years | 0 (0.0%) | 0 (0.0%) |
| 5 Years | 0 (0.0%) | 4 (100.0%) |
| 6 to 11 Years | 19 (95.0%) | 19 (100.0%) |
| 12 to 14 Years | 4 (100.0%) | 3 (60.0%) |
| 15 Years | 2 (100.0%) | 2 (100.0%) |
| 16 and 17 Years | 17 (100.0%) | 8 (100.0%) |
| 18 to 24 Years | 6 (100.0%) | 3 (100.0%) |
| 25 to 34 Years | 7 (77.8%) | 19 (100.0%) |
| 35 to 44 Years | 16 (100.0%) | 28 (96.6%) |
| 45 to 54 Years | 48 (90.6%) | 24 (88.9%) |
| 55 to 64 Years | 21 (87.5%) | 20 (74.1%) |
| 65 to 74 Years | 24 (92.3%) | 21 (80.8%) |
| 75 Years and over | 14 (100.0%) | 28 (84.9%) |
| Total | 178 (91.3%) | 179 (88.6%) |
Income Below Poverty Among Married-Couple Families in Buffalo
The poverty statistics for married-couple families in Buffalo show that 3.5% or 3 of the total 86 families live below the poverty line. Families with no children have the highest poverty rate of 3.7%, comprising of 2 families. On the other hand, families with 3 or 4 children have the lowest poverty rate of 0.0%, which includes 0 families.
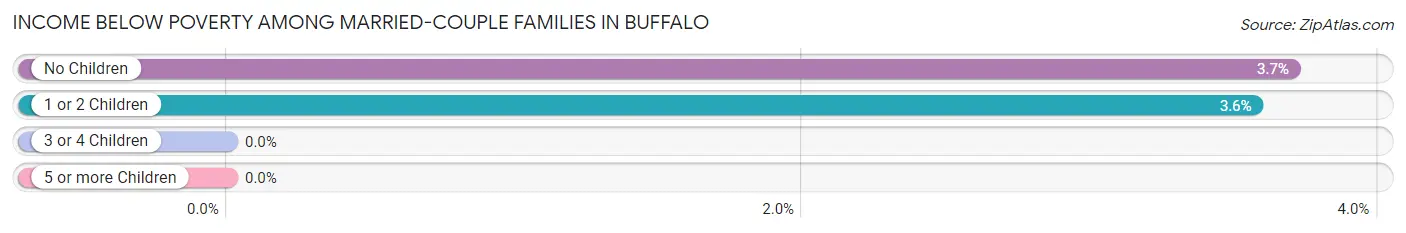
| Children | Above Poverty | Below Poverty |
| No Children | 52 (96.3%) | 2 (3.7%) |
| 1 or 2 Children | 27 (96.4%) | 1 (3.6%) |
| 3 or 4 Children | 4 (100.0%) | 0 (0.0%) |
| 5 or more Children | 0 (0.0%) | 0 (0.0%) |
| Total | 83 (96.5%) | 3 (3.5%) |
Income Below Poverty Among Single-Parent Households in Buffalo
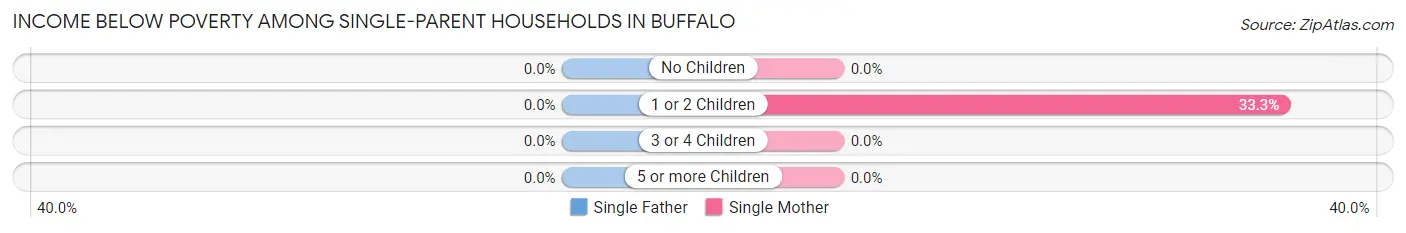
| Children | Single Father | Single Mother |
| No Children | 0 (0.0%) | 0 (0.0%) |
| 1 or 2 Children | 0 (0.0%) | 3 (33.3%) |
| 3 or 4 Children | 0 (0.0%) | 0 (0.0%) |
| 5 or more Children | 0 (0.0%) | 0 (0.0%) |
| Total | 0 (0.0%) | 3 (14.3%) |
Income Below Poverty Among Married-Couple vs Single-Parent Households in Buffalo
The poverty data for Buffalo shows that 3 of the married-couple family households (3.5%) and 3 of the single-parent households (12.5%) are living below the poverty level. Within the married-couple family households, those with no children have the highest poverty rate, with 2 households (3.7%) falling below the poverty line. Among the single-parent households, those with 1 or 2 children have the highest poverty rate, with 3 household (25.0%) living below poverty.
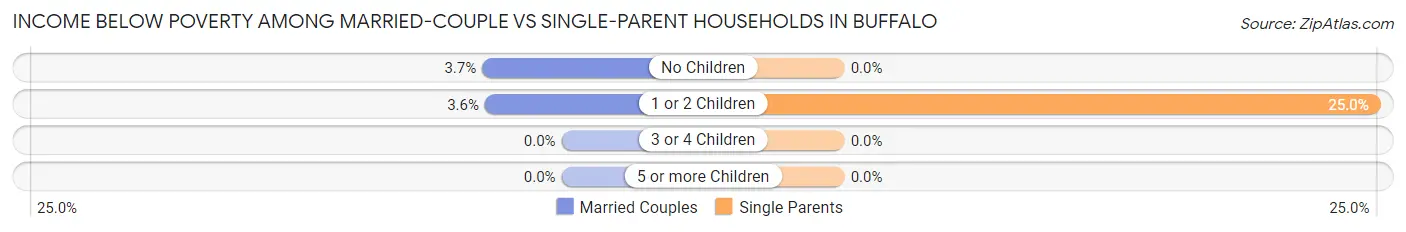
| Children | Married-Couple Families | Single-Parent Households |
| No Children | 2 (3.7%) | 0 (0.0%) |
| 1 or 2 Children | 1 (3.6%) | 3 (25.0%) |
| 3 or 4 Children | 0 (0.0%) | 0 (0.0%) |
| 5 or more Children | 0 (0.0%) | 0 (0.0%) |
| Total | 3 (3.5%) | 3 (12.5%) |
Race in Buffalo
The most populous races in Buffalo are White / Caucasian (355 | 89.4%), Two or more Races (33 | 8.3%), and Asian (9 | 2.3%).
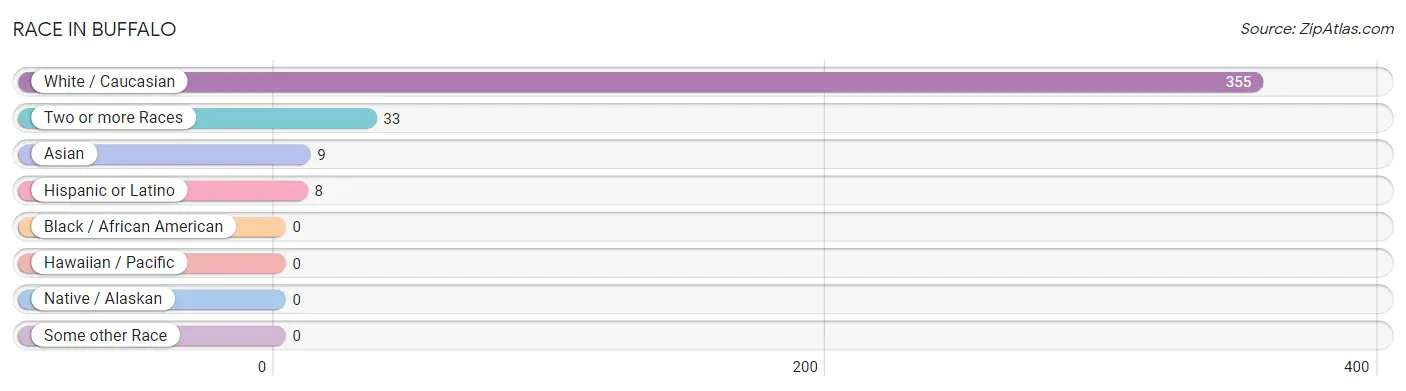
| Race | # Population | % Population |
| Asian | 9 | 2.3% |
| Black / African American | 0 | 0.0% |
| Hawaiian / Pacific | 0 | 0.0% |
| Hispanic or Latino | 8 | 2.0% |
| Native / Alaskan | 0 | 0.0% |
| White / Caucasian | 355 | 89.4% |
| Two or more Races | 33 | 8.3% |
| Some other Race | 0 | 0.0% |
| Total | 397 | 100.0% |
Ancestry in Buffalo
The most populous ancestries reported in Buffalo are German (98 | 24.7%), English (92 | 23.2%), Irish (63 | 15.9%), American (35 | 8.8%), and Norwegian (26 | 6.6%), together accounting for 79.1% of all Buffalo residents.
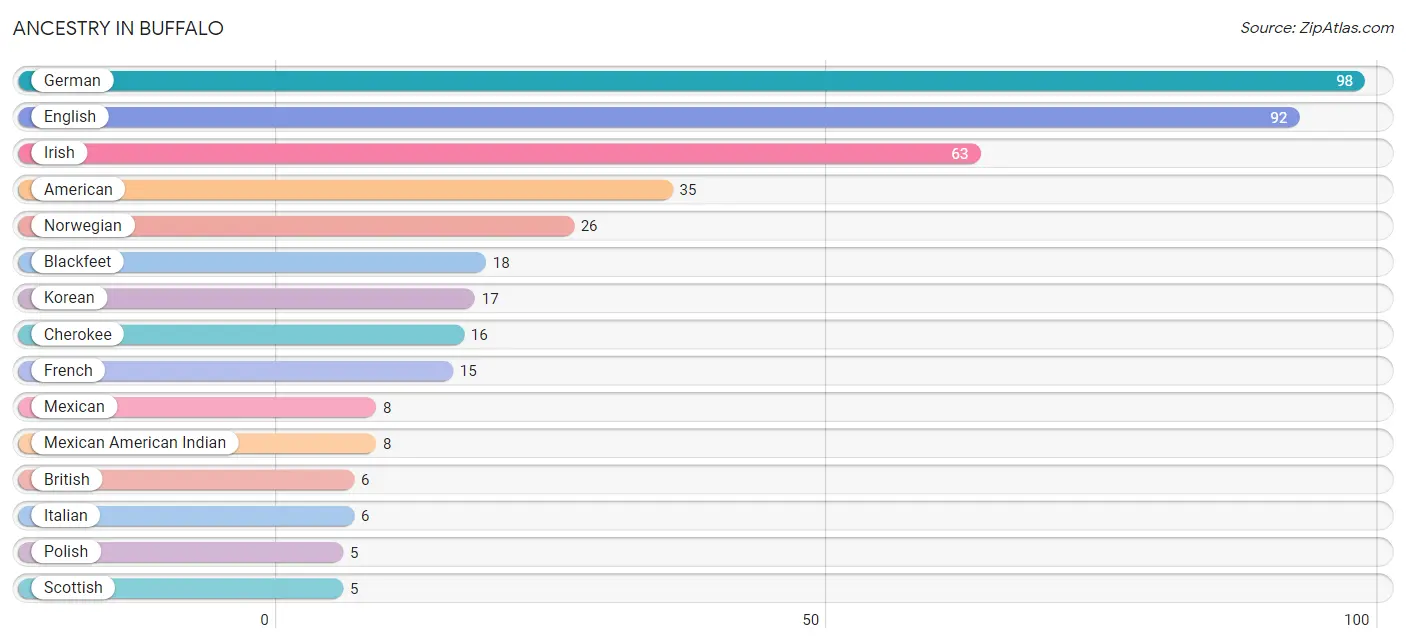
| Ancestry | # Population | % Population |
| American | 35 | 8.8% |
| Blackfeet | 18 | 4.5% |
| British | 6 | 1.5% |
| Cherokee | 16 | 4.0% |
| Czech | 2 | 0.5% |
| English | 92 | 23.2% |
| French | 15 | 3.8% |
| German | 98 | 24.7% |
| Irish | 63 | 15.9% |
| Italian | 6 | 1.5% |
| Korean | 17 | 4.3% |
| Mexican | 8 | 2.0% |
| Mexican American Indian | 8 | 2.0% |
| Norwegian | 26 | 6.6% |
| Polish | 5 | 1.3% |
| Scandinavian | 1 | 0.3% |
| Scotch-Irish | 2 | 0.5% |
| Scottish | 5 | 1.3% |
| Welsh | 2 | 0.5% | View All 19 Rows |
Immigrants in Buffalo
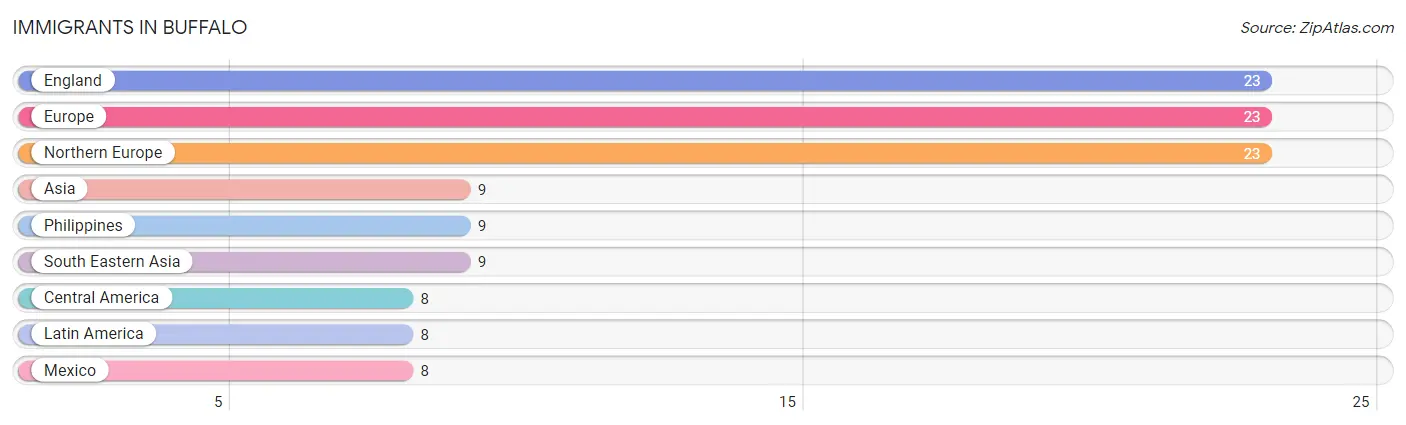
The most numerous immigrant groups reported in Buffalo came from England (23 | 5.8%), Europe (23 | 5.8%), Northern Europe (23 | 5.8%), Asia (9 | 2.3%), and Philippines (9 | 2.3%), together accounting for 21.9% of all Buffalo residents.
| Immigration Origin | # Population | % Population |
| Asia | 9 | 2.3% |
| Central America | 8 | 2.0% |
| England | 23 | 5.8% |
| Europe | 23 | 5.8% |
| Latin America | 8 | 2.0% |
| Mexico | 8 | 2.0% |
| Northern Europe | 23 | 5.8% |
| Philippines | 9 | 2.3% |
| South Eastern Asia | 9 | 2.3% | View All 9 Rows |
Sex and Age in Buffalo
Sex and Age in Buffalo
The most populous age groups in Buffalo are 45 to 49 Years (37 | 19.0%) for men and 35 to 39 Years (23 | 11.4%) for women.
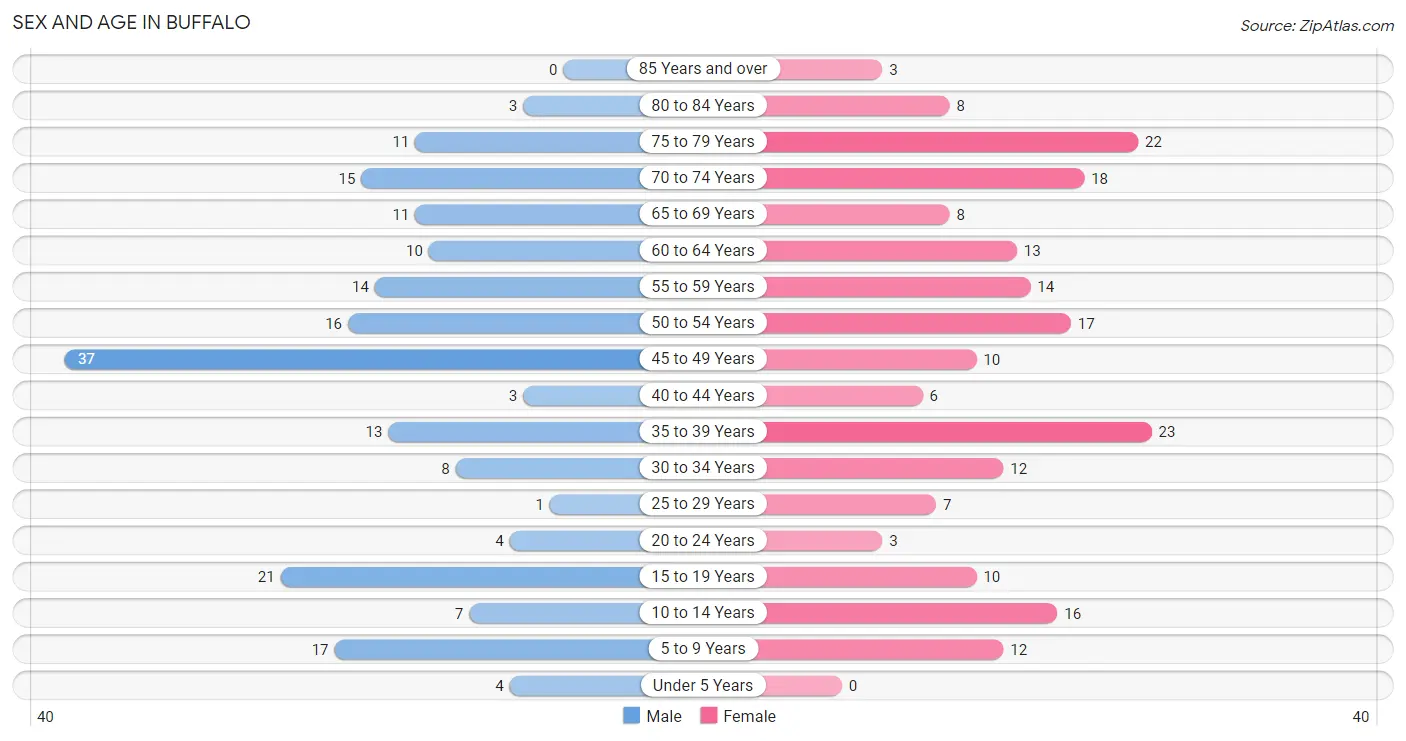
| Age Bracket | Male | Female |
| Under 5 Years | 4 (2.1%) | 0 (0.0%) |
| 5 to 9 Years | 17 (8.7%) | 12 (5.9%) |
| 10 to 14 Years | 7 (3.6%) | 16 (7.9%) |
| 15 to 19 Years | 21 (10.8%) | 10 (5.0%) |
| 20 to 24 Years | 4 (2.1%) | 3 (1.5%) |
| 25 to 29 Years | 1 (0.5%) | 7 (3.5%) |
| 30 to 34 Years | 8 (4.1%) | 12 (5.9%) |
| 35 to 39 Years | 13 (6.7%) | 23 (11.4%) |
| 40 to 44 Years | 3 (1.5%) | 6 (3.0%) |
| 45 to 49 Years | 37 (19.0%) | 10 (5.0%) |
| 50 to 54 Years | 16 (8.2%) | 17 (8.4%) |
| 55 to 59 Years | 14 (7.2%) | 14 (6.9%) |
| 60 to 64 Years | 10 (5.1%) | 13 (6.4%) |
| 65 to 69 Years | 11 (5.6%) | 8 (4.0%) |
| 70 to 74 Years | 15 (7.7%) | 18 (8.9%) |
| 75 to 79 Years | 11 (5.6%) | 22 (10.9%) |
| 80 to 84 Years | 3 (1.5%) | 8 (4.0%) |
| 85 Years and over | 0 (0.0%) | 3 (1.5%) |
| Total | 195 (100.0%) | 202 (100.0%) |
Families and Households in Buffalo
Median Family Size in Buffalo
The median family size in Buffalo is 2.94 persons per family, with married-couple families (86 | 78.2%) accounting for the largest median family size of 3 persons per family. On the other hand, single male/father families (3 | 2.7%) represent the smallest median family size with 2.67 persons per family.
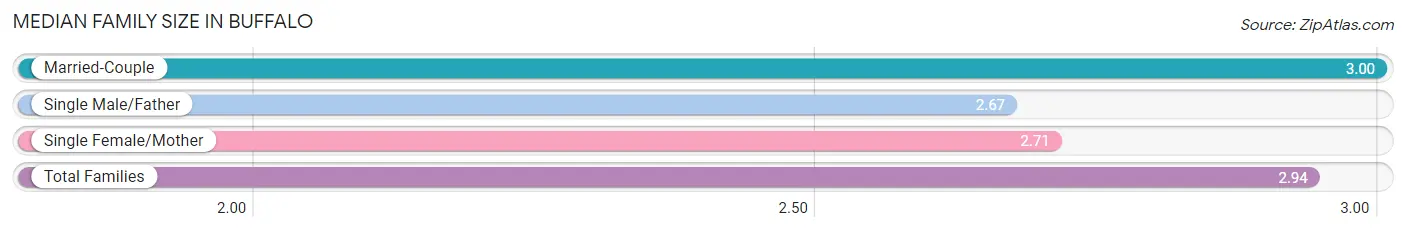
| Family Type | # Families | Family Size |
| Married-Couple | 86 (78.2%) | 3.00 |
| Single Male/Father | 3 (2.7%) | 2.67 |
| Single Female/Mother | 21 (19.1%) | 2.71 |
| Total Families | 110 (100.0%) | 2.94 |
Median Household Size in Buffalo
The median household size in Buffalo is 2.39 persons per household, with single female/mother households (21 | 12.7%) accounting for the largest median household size of 3.33 persons per household. non-family households (56 | 33.7%) represent the smallest median household size with 1.09 persons per household.
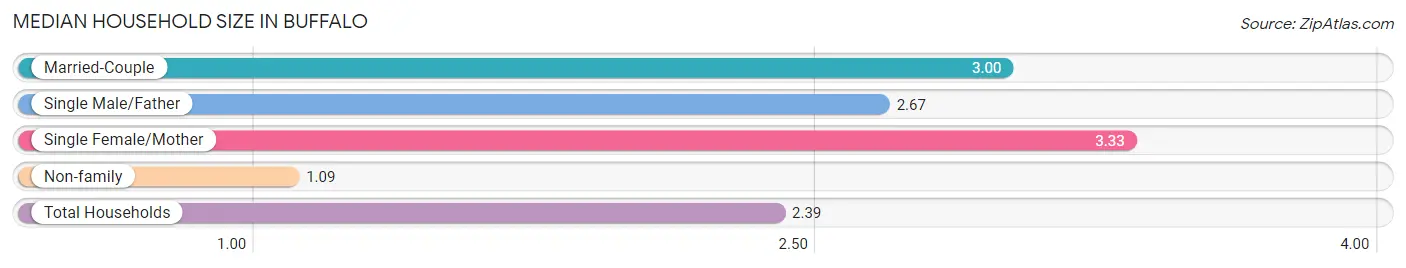
| Household Type | # Households | Household Size |
| Married-Couple | 86 (51.8%) | 3.00 |
| Single Male/Father | 3 (1.8%) | 2.67 |
| Single Female/Mother | 21 (12.7%) | 3.33 |
| Non-family | 56 (33.7%) | 1.09 |
| Total Households | 166 (100.0%) | 2.39 |
Household Size by Marriage Status in Buffalo
Out of a total of 166 households in Buffalo, 110 (66.3%) are family households, while 56 (33.7%) are nonfamily households. The most numerous type of family households are 2-person households, comprising 63, and the most common type of nonfamily households are 1-person households, comprising 50.
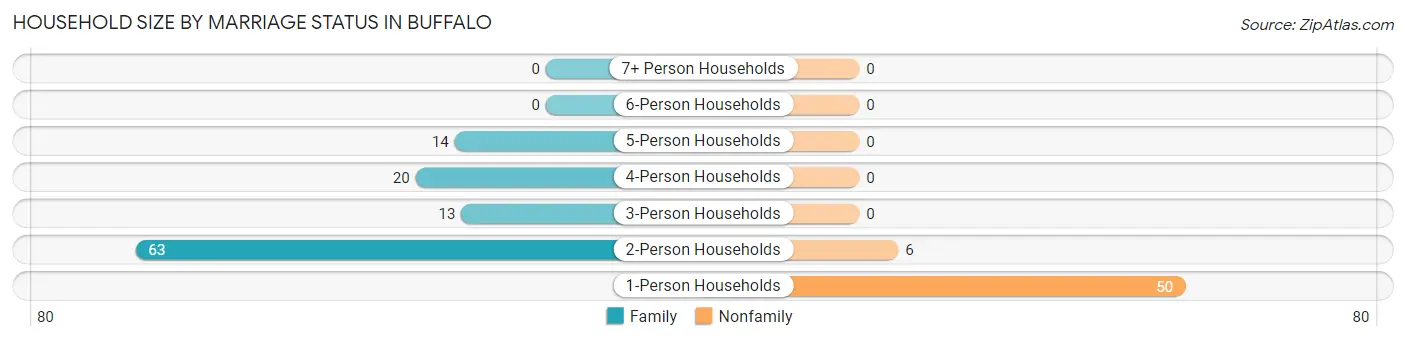
| Household Size | Family Households | Nonfamily Households |
| 1-Person Households | - | 50 (30.1%) |
| 2-Person Households | 63 (38.0%) | 6 (3.6%) |
| 3-Person Households | 13 (7.8%) | 0 (0.0%) |
| 4-Person Households | 20 (12.0%) | 0 (0.0%) |
| 5-Person Households | 14 (8.4%) | 0 (0.0%) |
| 6-Person Households | 0 (0.0%) | 0 (0.0%) |
| 7+ Person Households | 0 (0.0%) | 0 (0.0%) |
| Total | 110 (66.3%) | 56 (33.7%) |
Female Fertility in Buffalo
Fertility by Age in Buffalo
| Age Bracket | Women with Births | Births / 1,000 Women |
| 15 to 19 years | 0 (0.0%) | 0.0 |
| 20 to 34 years | 0 (0.0%) | 0.0 |
| 35 to 50 years | 0 (0.0%) | 0.0 |
| Total | 0 (0.0%) | 0.0 |
Fertility by Age by Marriage Status in Buffalo
| Age Bracket | Married | Unmarried |
| 15 to 19 years | 0 (0.0%) | 0 (0.0%) |
| 20 to 34 years | 0 (0.0%) | 0 (0.0%) |
| 35 to 50 years | 0 (0.0%) | 0 (0.0%) |
| Total | 0 (0.0%) | 0 (0.0%) |
Fertility by Education in Buffalo
| Educational Attainment | Women with Births | Births / 1,000 Women |
| Less than High School | 0 (0.0%) | 0.0 |
| High School Diploma | 0 (0.0%) | 0.0 |
| College or Associate's Degree | 0 (0.0%) | 0.0 |
| Bachelor's Degree | 0 (0.0%) | 0.0 |
| Graduate Degree | 0 (0.0%) | 0.0 |
| Total | 0 (0.0%) | 0.0 |
Fertility by Education by Marriage Status in Buffalo
| Educational Attainment | Married | Unmarried |
| Less than High School | 0 (0.0%) | 0 (0.0%) |
| High School Diploma | 0 (0.0%) | 0 (0.0%) |
| College or Associate's Degree | 0 (0.0%) | 0 (0.0%) |
| Bachelor's Degree | 0 (0.0%) | 0 (0.0%) |
| Graduate Degree | 0 (0.0%) | 0 (0.0%) |
| Total | 0 (0.0%) | 0 (0.0%) |
Employment Characteristics in Buffalo
Employment by Class of Employer in Buffalo
Among the 195 employed individuals in Buffalo, private company employees (116 | 59.5%), state government employees (30 | 15.4%), and local government employees (19 | 9.7%) make up the most common classes of employment.
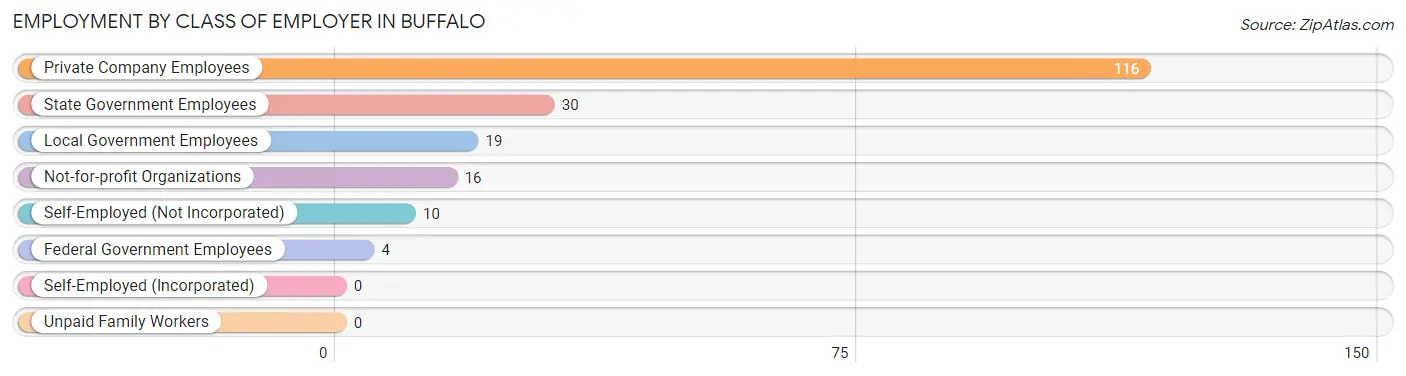
| Employer Class | # Employees | % Employees |
| Private Company Employees | 116 | 59.5% |
| Self-Employed (Incorporated) | 0 | 0.0% |
| Self-Employed (Not Incorporated) | 10 | 5.1% |
| Not-for-profit Organizations | 16 | 8.2% |
| Local Government Employees | 19 | 9.7% |
| State Government Employees | 30 | 15.4% |
| Federal Government Employees | 4 | 2.1% |
| Unpaid Family Workers | 0 | 0.0% |
| Total | 195 | 100.0% |
Employment Status by Age in Buffalo
According to the labor force statistics for Buffalo, out of the total population over 16 years of age (337), 58.2% or 196 individuals are in the labor force, with 0.5% or 1 of them unemployed. The age group with the highest labor force participation rate is 20 to 24 years, with 100.0% or 7 individuals in the labor force. Within the labor force, the 45 to 54 years age range has the highest percentage of unemployed individuals, with 1.4% or 1 of them being unemployed.
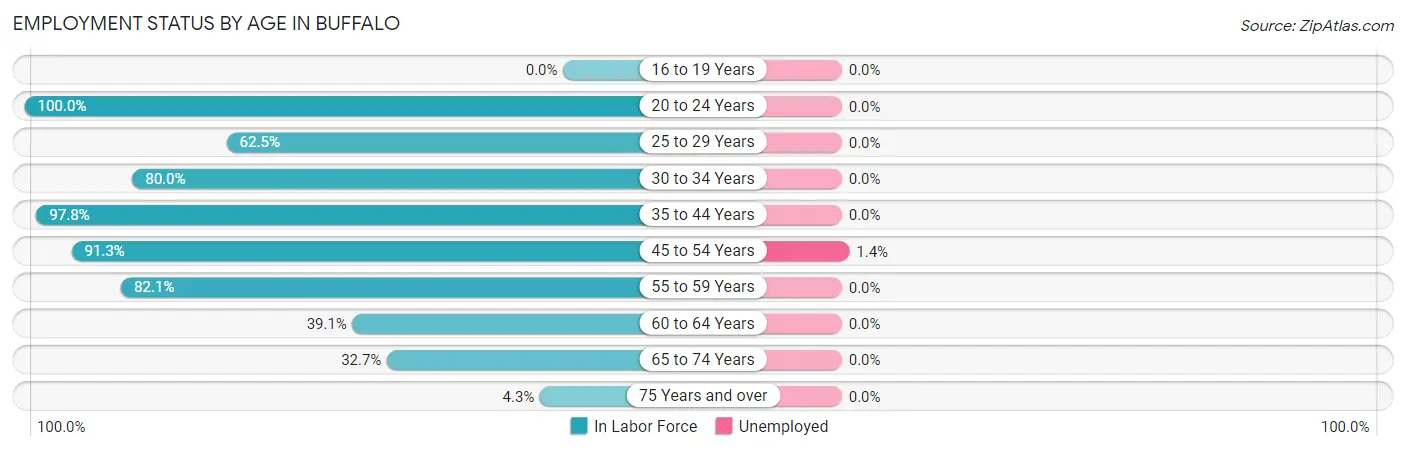
| Age Bracket | In Labor Force | Unemployed |
| 16 to 19 Years | 0 (0.0%) | 0 (0.0%) |
| 20 to 24 Years | 7 (100.0%) | 0 (0.0%) |
| 25 to 29 Years | 5 (62.5%) | 0 (0.0%) |
| 30 to 34 Years | 16 (80.0%) | 0 (0.0%) |
| 35 to 44 Years | 44 (97.8%) | 0 (0.0%) |
| 45 to 54 Years | 73 (91.3%) | 1 (1.4%) |
| 55 to 59 Years | 23 (82.1%) | 0 (0.0%) |
| 60 to 64 Years | 9 (39.1%) | 0 (0.0%) |
| 65 to 74 Years | 17 (32.7%) | 0 (0.0%) |
| 75 Years and over | 2 (4.3%) | 0 (0.0%) |
| Total | 196 (58.2%) | 1 (0.5%) |
Employment Status by Educational Attainment in Buffalo
According to labor force statistics for Buffalo, 83.3% of individuals (170) out of the total population between 25 and 64 years of age (204) are in the labor force, with 0.6% or 1 of them being unemployed. The group with the highest labor force participation rate are those with the educational attainment of bachelor's degree or higher, with 97.0% or 65 individuals in the labor force. Within the labor force, individuals with high school diploma education have the highest percentage of unemployment, with 3.3% or 1 of them being unemployed.
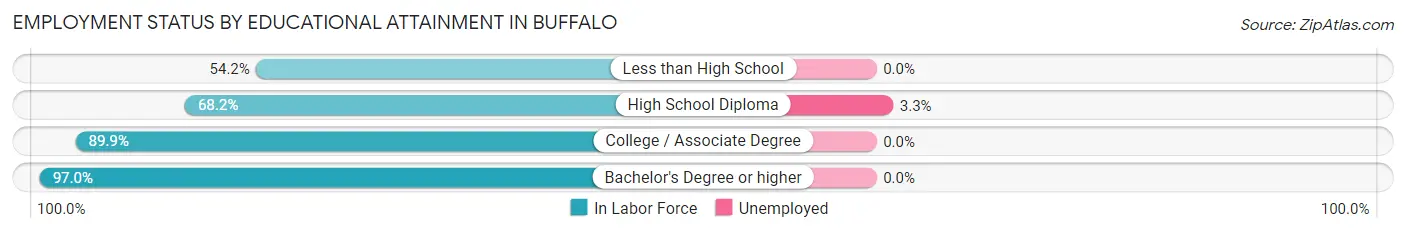
| Educational Attainment | In Labor Force | Unemployed |
| Less than High School | 13 (54.2%) | 0 (0.0%) |
| High School Diploma | 30 (68.2%) | 1 (3.3%) |
| College / Associate Degree | 62 (89.9%) | 0 (0.0%) |
| Bachelor's Degree or higher | 65 (97.0%) | 0 (0.0%) |
| Total | 170 (83.3%) | 1 (0.6%) |
Employment Occupations by Sex in Buffalo
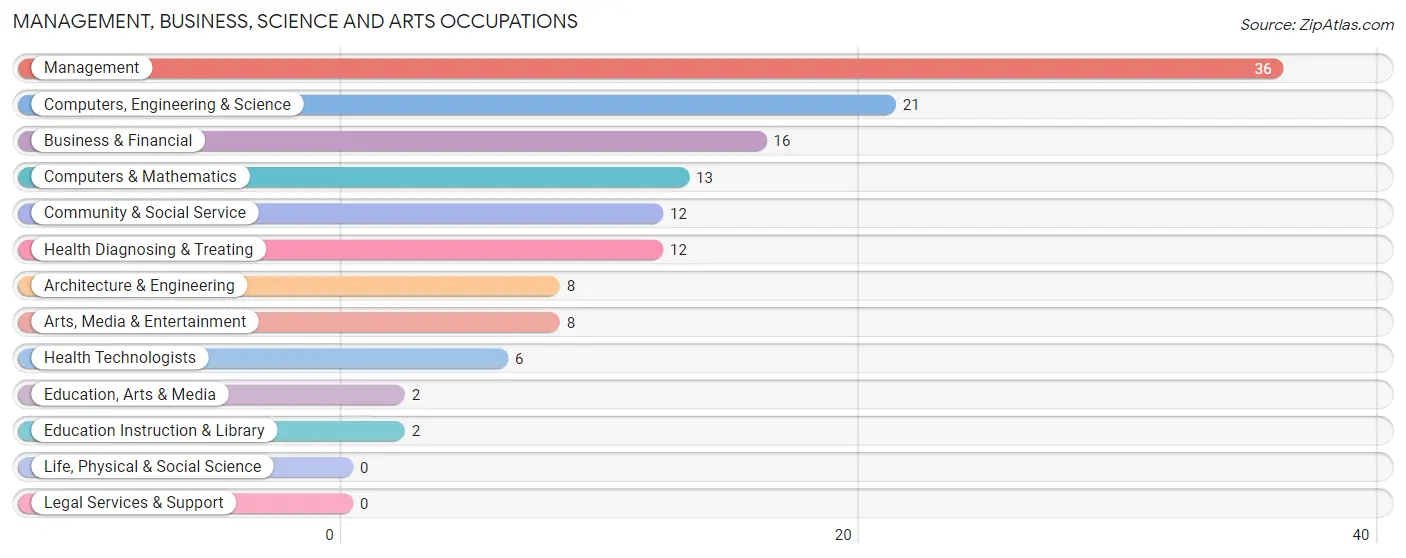
Management, Business, Science and Arts Occupations
The most common Management, Business, Science and Arts occupations in Buffalo are Management (36 | 18.5%), Computers, Engineering & Science (21 | 10.8%), Business & Financial (16 | 8.2%), Computers & Mathematics (13 | 6.7%), and Community & Social Service (12 | 6.1%).
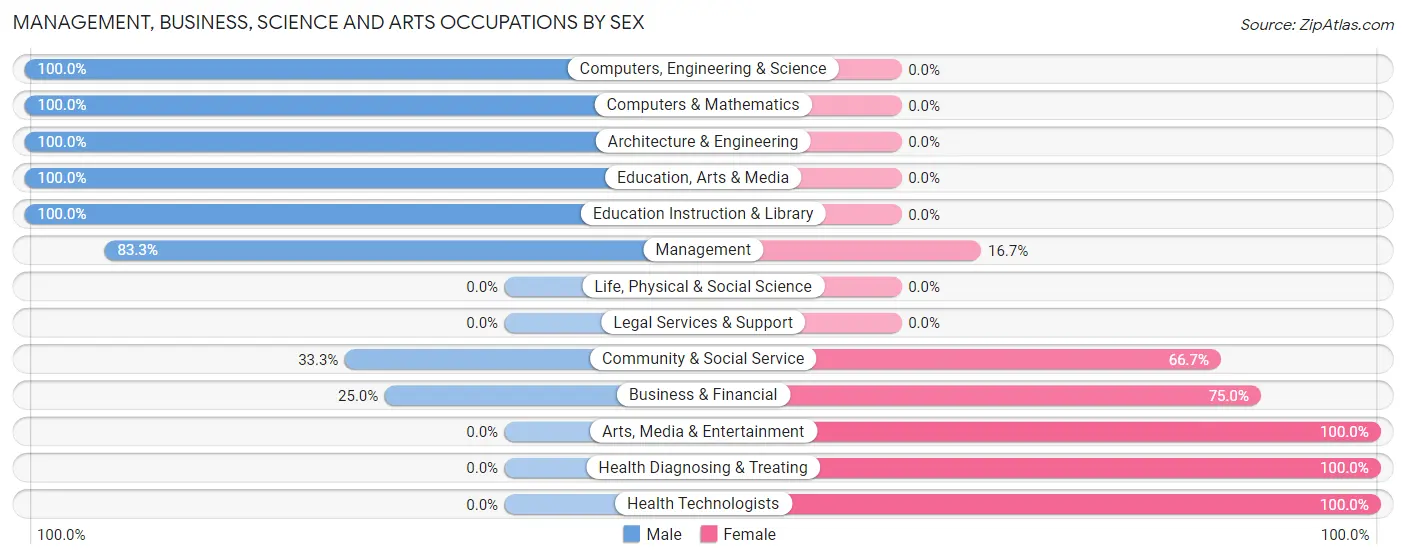
Management, Business, Science and Arts Occupations by Sex
Within the Management, Business, Science and Arts occupations in Buffalo, the most male-oriented occupations are Computers, Engineering & Science (100.0%), Computers & Mathematics (100.0%), and Architecture & Engineering (100.0%), while the most female-oriented occupations are Arts, Media & Entertainment (100.0%), Health Diagnosing & Treating (100.0%), and Health Technologists (100.0%).
| Occupation | Male | Female |
| Management | 30 (83.3%) | 6 (16.7%) |
| Business & Financial | 4 (25.0%) | 12 (75.0%) |
| Computers, Engineering & Science | 21 (100.0%) | 0 (0.0%) |
| Computers & Mathematics | 13 (100.0%) | 0 (0.0%) |
| Architecture & Engineering | 8 (100.0%) | 0 (0.0%) |
| Life, Physical & Social Science | 0 (0.0%) | 0 (0.0%) |
| Community & Social Service | 4 (33.3%) | 8 (66.7%) |
| Education, Arts & Media | 2 (100.0%) | 0 (0.0%) |
| Legal Services & Support | 0 (0.0%) | 0 (0.0%) |
| Education Instruction & Library | 2 (100.0%) | 0 (0.0%) |
| Arts, Media & Entertainment | 0 (0.0%) | 8 (100.0%) |
| Health Diagnosing & Treating | 0 (0.0%) | 12 (100.0%) |
| Health Technologists | 0 (0.0%) | 6 (100.0%) |
| Total (Category) | 59 (60.8%) | 38 (39.2%) |
| Total (Overall) | 103 (52.8%) | 92 (47.2%) |
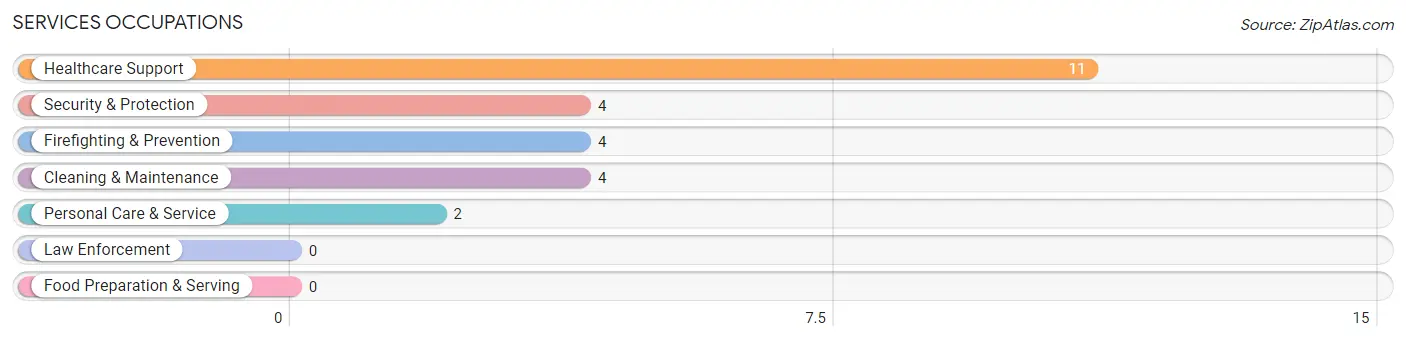
Services Occupations
The most common Services occupations in Buffalo are Healthcare Support (11 | 5.6%), Security & Protection (4 | 2.1%), Firefighting & Prevention (4 | 2.1%), Cleaning & Maintenance (4 | 2.1%), and Personal Care & Service (2 | 1.0%).
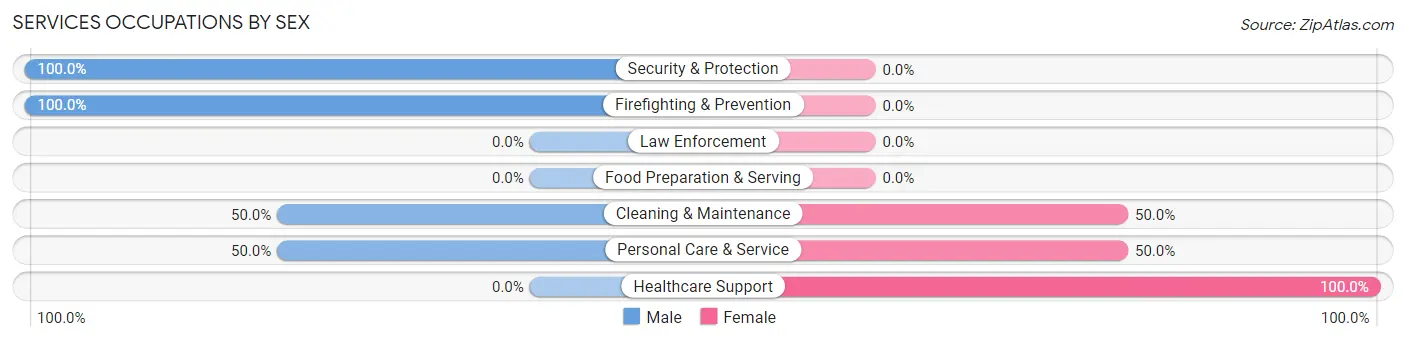
Services Occupations by Sex
Within the Services occupations in Buffalo, the most male-oriented occupations are Security & Protection (100.0%), Firefighting & Prevention (100.0%), and Cleaning & Maintenance (50.0%), while the most female-oriented occupations are Healthcare Support (100.0%), Cleaning & Maintenance (50.0%), and Personal Care & Service (50.0%).
| Occupation | Male | Female |
| Healthcare Support | 0 (0.0%) | 11 (100.0%) |
| Security & Protection | 4 (100.0%) | 0 (0.0%) |
| Firefighting & Prevention | 4 (100.0%) | 0 (0.0%) |
| Law Enforcement | 0 (0.0%) | 0 (0.0%) |
| Food Preparation & Serving | 0 (0.0%) | 0 (0.0%) |
| Cleaning & Maintenance | 2 (50.0%) | 2 (50.0%) |
| Personal Care & Service | 1 (50.0%) | 1 (50.0%) |
| Total (Category) | 7 (33.3%) | 14 (66.7%) |
| Total (Overall) | 103 (52.8%) | 92 (47.2%) |
Sales and Office Occupations
The most common Sales and Office occupations in Buffalo are Office & Administration (30 | 15.4%), and Sales & Related (17 | 8.7%).
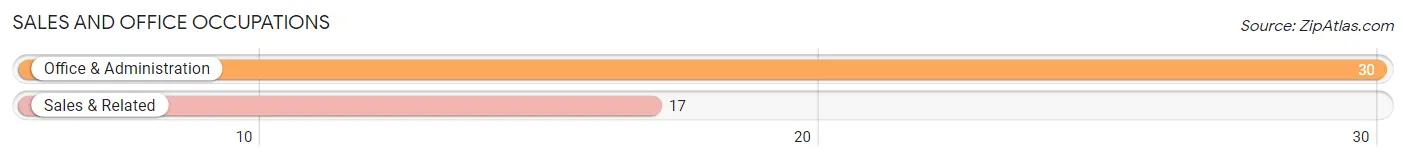
Sales and Office Occupations by Sex

| Occupation | Male | Female |
| Sales & Related | 8 (47.1%) | 9 (52.9%) |
| Office & Administration | 0 (0.0%) | 30 (100.0%) |
| Total (Category) | 8 (17.0%) | 39 (83.0%) |
| Total (Overall) | 103 (52.8%) | 92 (47.2%) |
Natural Resources, Construction and Maintenance Occupations
The most common Natural Resources, Construction and Maintenance occupations in Buffalo are Construction & Extraction (11 | 5.6%), and Installation, Maintenance & Repair (6 | 3.1%).

Natural Resources, Construction and Maintenance Occupations by Sex

| Occupation | Male | Female |
| Farming, Fishing & Forestry | 0 (0.0%) | 0 (0.0%) |
| Construction & Extraction | 11 (100.0%) | 0 (0.0%) |
| Installation, Maintenance & Repair | 6 (100.0%) | 0 (0.0%) |
| Total (Category) | 17 (100.0%) | 0 (0.0%) |
| Total (Overall) | 103 (52.8%) | 92 (47.2%) |
Production, Transportation and Moving Occupations
The most common Production, Transportation and Moving occupations in Buffalo are Transportation (7 | 3.6%), Production (4 | 2.1%), and Material Moving (2 | 1.0%).
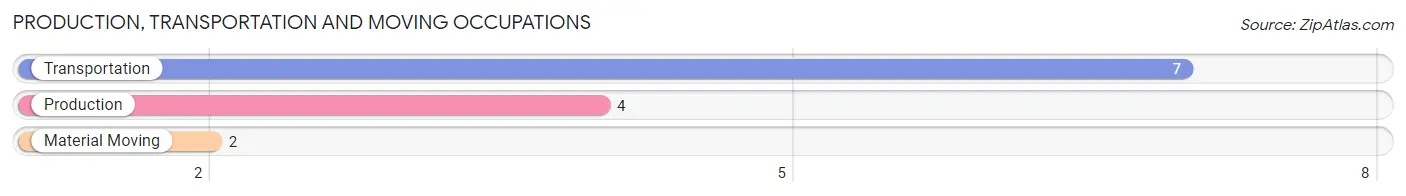
Production, Transportation and Moving Occupations by Sex
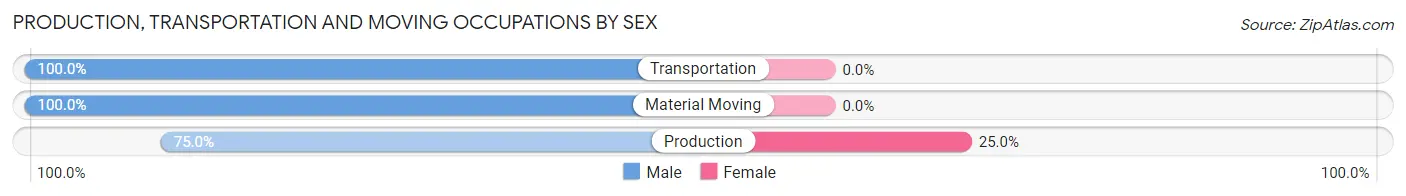
| Occupation | Male | Female |
| Production | 3 (75.0%) | 1 (25.0%) |
| Transportation | 7 (100.0%) | 0 (0.0%) |
| Material Moving | 2 (100.0%) | 0 (0.0%) |
| Total (Category) | 12 (92.3%) | 1 (7.7%) |
| Total (Overall) | 103 (52.8%) | 92 (47.2%) |
Employment Industries by Sex in Buffalo
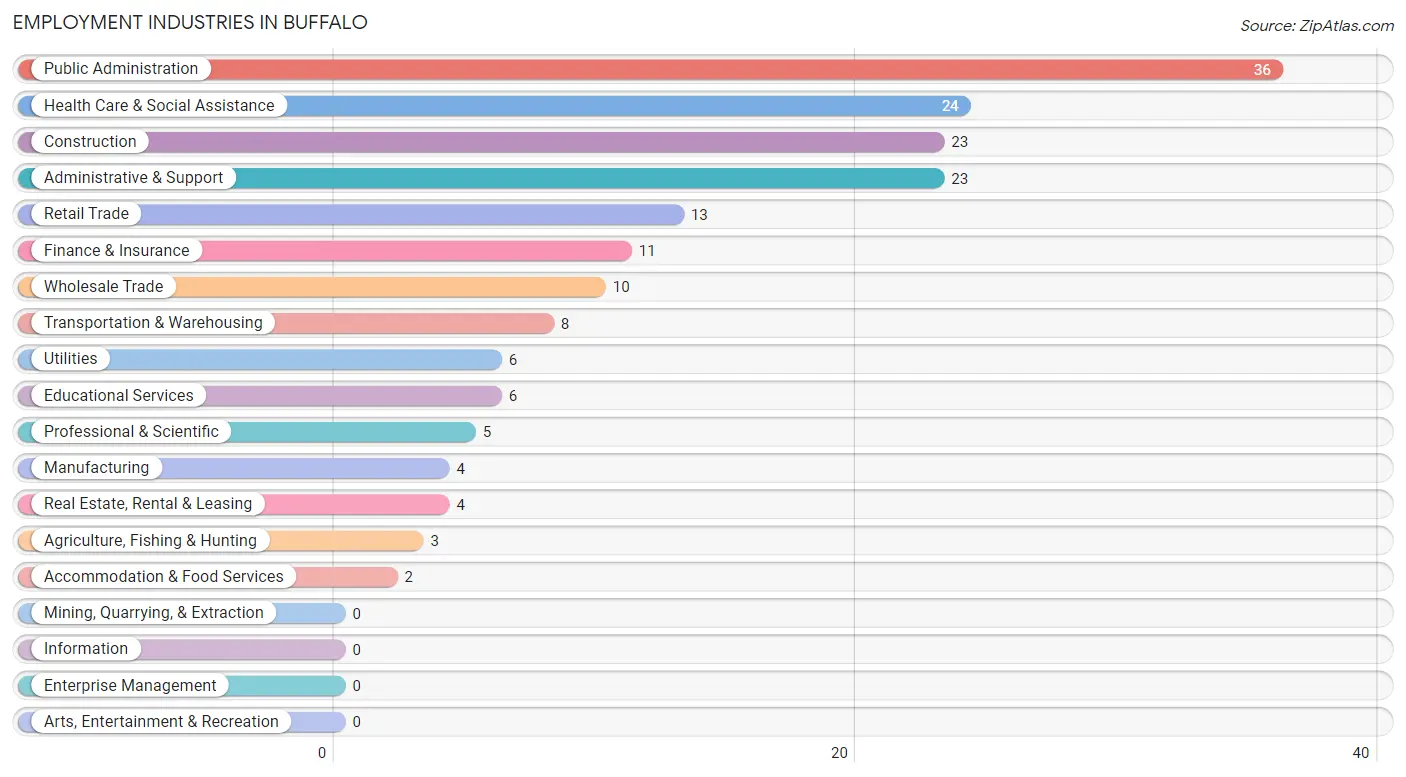
Employment Industries in Buffalo
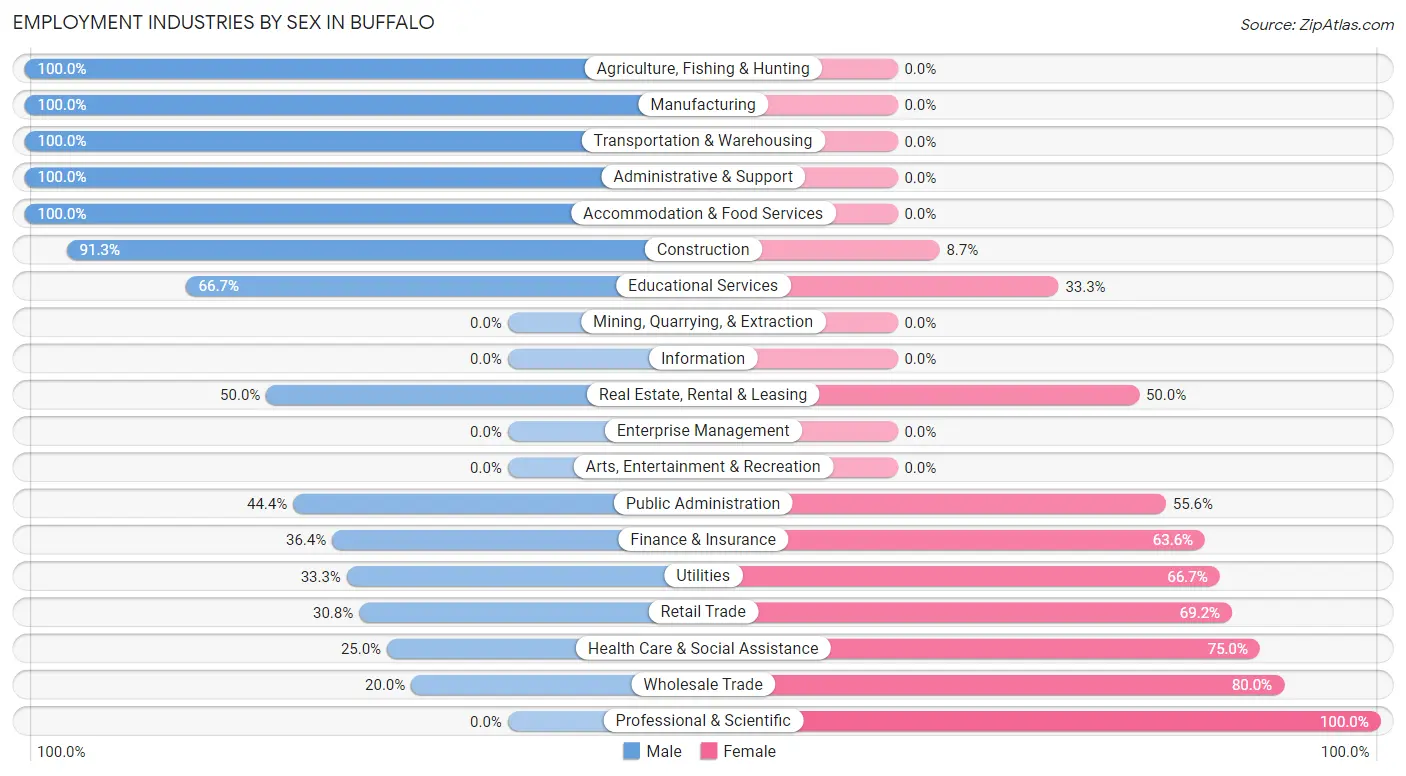
The major employment industries in Buffalo include Public Administration (36 | 18.5%), Health Care & Social Assistance (24 | 12.3%), Construction (23 | 11.8%), Administrative & Support (23 | 11.8%), and Retail Trade (13 | 6.7%).
Employment Industries by Sex in Buffalo
The Buffalo industries that see more men than women are Agriculture, Fishing & Hunting (100.0%), Manufacturing (100.0%), and Transportation & Warehousing (100.0%), whereas the industries that tend to have a higher number of women are Professional & Scientific (100.0%), Wholesale Trade (80.0%), and Health Care & Social Assistance (75.0%).
| Industry | Male | Female |
| Agriculture, Fishing & Hunting | 3 (100.0%) | 0 (0.0%) |
| Mining, Quarrying, & Extraction | 0 (0.0%) | 0 (0.0%) |
| Construction | 21 (91.3%) | 2 (8.7%) |
| Manufacturing | 4 (100.0%) | 0 (0.0%) |
| Wholesale Trade | 2 (20.0%) | 8 (80.0%) |
| Retail Trade | 4 (30.8%) | 9 (69.2%) |
| Transportation & Warehousing | 8 (100.0%) | 0 (0.0%) |
| Utilities | 2 (33.3%) | 4 (66.7%) |
| Information | 0 (0.0%) | 0 (0.0%) |
| Finance & Insurance | 4 (36.4%) | 7 (63.6%) |
| Real Estate, Rental & Leasing | 2 (50.0%) | 2 (50.0%) |
| Professional & Scientific | 0 (0.0%) | 5 (100.0%) |
| Enterprise Management | 0 (0.0%) | 0 (0.0%) |
| Administrative & Support | 23 (100.0%) | 0 (0.0%) |
| Educational Services | 4 (66.7%) | 2 (33.3%) |
| Health Care & Social Assistance | 6 (25.0%) | 18 (75.0%) |
| Arts, Entertainment & Recreation | 0 (0.0%) | 0 (0.0%) |
| Accommodation & Food Services | 2 (100.0%) | 0 (0.0%) |
| Public Administration | 16 (44.4%) | 20 (55.6%) |
| Total | 103 (52.8%) | 92 (47.2%) |
Education in Buffalo
School Enrollment in Buffalo
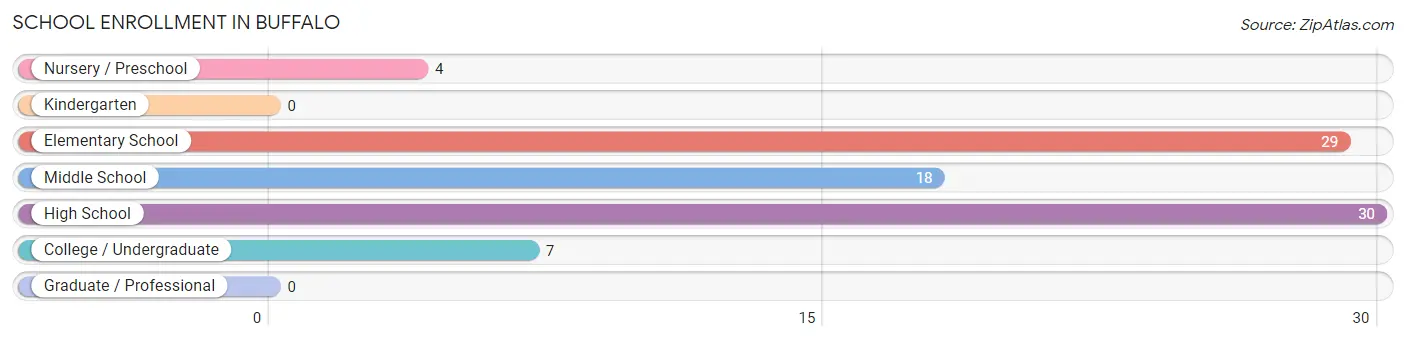
The most common levels of schooling among the 88 students in Buffalo are high school (30 | 34.1%), elementary school (29 | 33.0%), and middle school (18 | 20.4%).
| School Level | # Students | % Students |
| Nursery / Preschool | 4 | 4.5% |
| Kindergarten | 0 | 0.0% |
| Elementary School | 29 | 33.0% |
| Middle School | 18 | 20.4% |
| High School | 30 | 34.1% |
| College / Undergraduate | 7 | 8.0% |
| Graduate / Professional | 0 | 0.0% |
| Total | 88 | 100.0% |
School Enrollment by Age by Funding Source in Buffalo
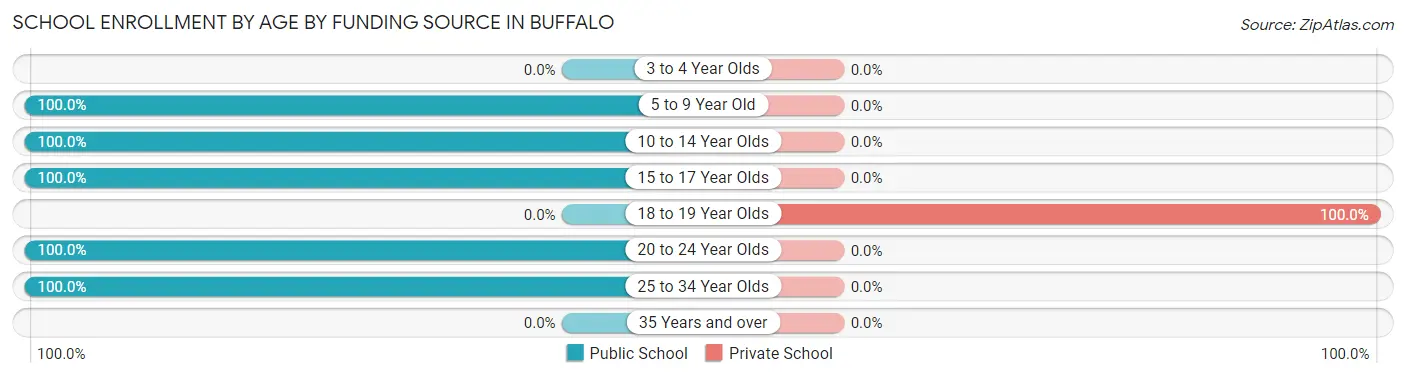
Out of a total of 88 students who are enrolled in schools in Buffalo, 2 (2.3%) attend a private institution, while the remaining 86 (97.7%) are enrolled in public schools. The age group of 18 to 19 year olds has the highest likelihood of being enrolled in private schools, with 2 (100.0% in the age bracket) enrolled. Conversely, the age group of 5 to 9 year old has the lowest likelihood of being enrolled in a private school, with 29 (100.0% in the age bracket) attending a public institution.
| Age Bracket | Public School | Private School |
| 3 to 4 Year Olds | 0 (0.0%) | 0 (0.0%) |
| 5 to 9 Year Old | 29 (100.0%) | 0 (0.0%) |
| 10 to 14 Year Olds | 23 (100.0%) | 0 (0.0%) |
| 15 to 17 Year Olds | 29 (100.0%) | 0 (0.0%) |
| 18 to 19 Year Olds | 0 (0.0%) | 2 (100.0%) |
| 20 to 24 Year Olds | 3 (100.0%) | 0 (0.0%) |
| 25 to 34 Year Olds | 2 (100.0%) | 0 (0.0%) |
| 35 Years and over | 0 (0.0%) | 0 (0.0%) |
| Total | 86 (97.7%) | 2 (2.3%) |
Educational Attainment by Field of Study in Buffalo
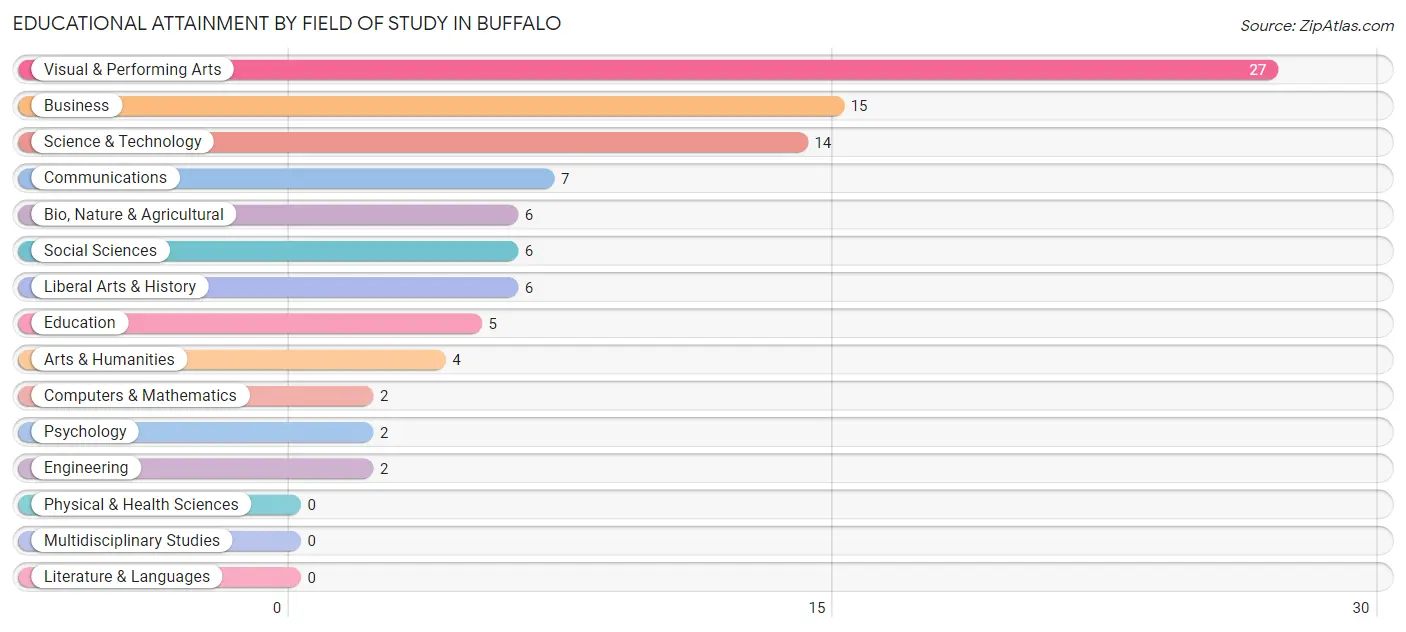
Visual & performing arts (27 | 28.1%), business (15 | 15.6%), science & technology (14 | 14.6%), communications (7 | 7.3%), and bio, nature & agricultural (6 | 6.2%) are the most common fields of study among 96 individuals in Buffalo who have obtained a bachelor's degree or higher.
| Field of Study | # Graduates | % Graduates |
| Computers & Mathematics | 2 | 2.1% |
| Bio, Nature & Agricultural | 6 | 6.2% |
| Physical & Health Sciences | 0 | 0.0% |
| Psychology | 2 | 2.1% |
| Social Sciences | 6 | 6.2% |
| Engineering | 2 | 2.1% |
| Multidisciplinary Studies | 0 | 0.0% |
| Science & Technology | 14 | 14.6% |
| Business | 15 | 15.6% |
| Education | 5 | 5.2% |
| Literature & Languages | 0 | 0.0% |
| Liberal Arts & History | 6 | 6.2% |
| Visual & Performing Arts | 27 | 28.1% |
| Communications | 7 | 7.3% |
| Arts & Humanities | 4 | 4.2% |
| Total | 96 | 100.0% |
Transportation & Commute in Buffalo
Vehicle Availability by Sex in Buffalo
The most prevalent vehicle ownership categories in Buffalo are males with 2 vehicles (69, accounting for 67.0%) and females with 2 vehicles (52, making up 75.0%).
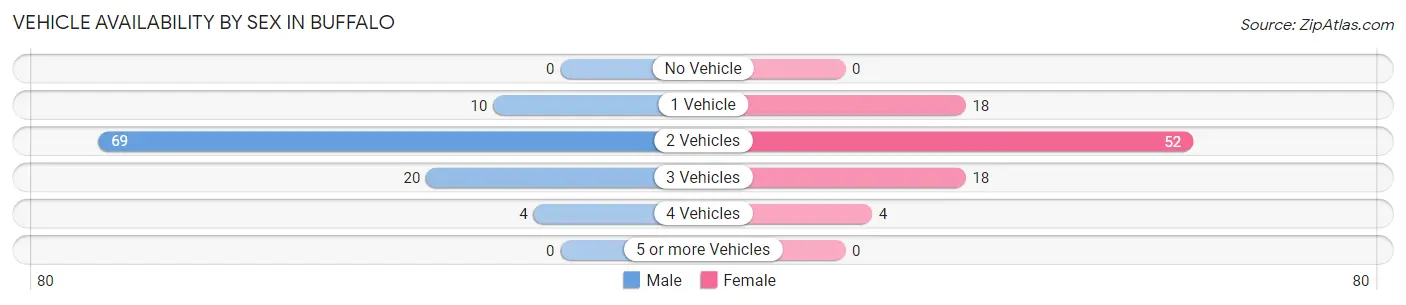
| Vehicles Available | Male | Female |
| No Vehicle | 0 (0.0%) | 0 (0.0%) |
| 1 Vehicle | 10 (9.7%) | 18 (19.6%) |
| 2 Vehicles | 69 (67.0%) | 52 (56.5%) |
| 3 Vehicles | 20 (19.4%) | 18 (19.6%) |
| 4 Vehicles | 4 (3.9%) | 4 (4.3%) |
| 5 or more Vehicles | 0 (0.0%) | 0 (0.0%) |
| Total | 103 (100.0%) | 92 (100.0%) |
Commute Time in Buffalo
The most frequently occuring commute durations in Buffalo are 30 to 34 minutes (66 commuters, 38.4%), 15 to 19 minutes (27 commuters, 15.7%), and 20 to 24 minutes (22 commuters, 12.8%).
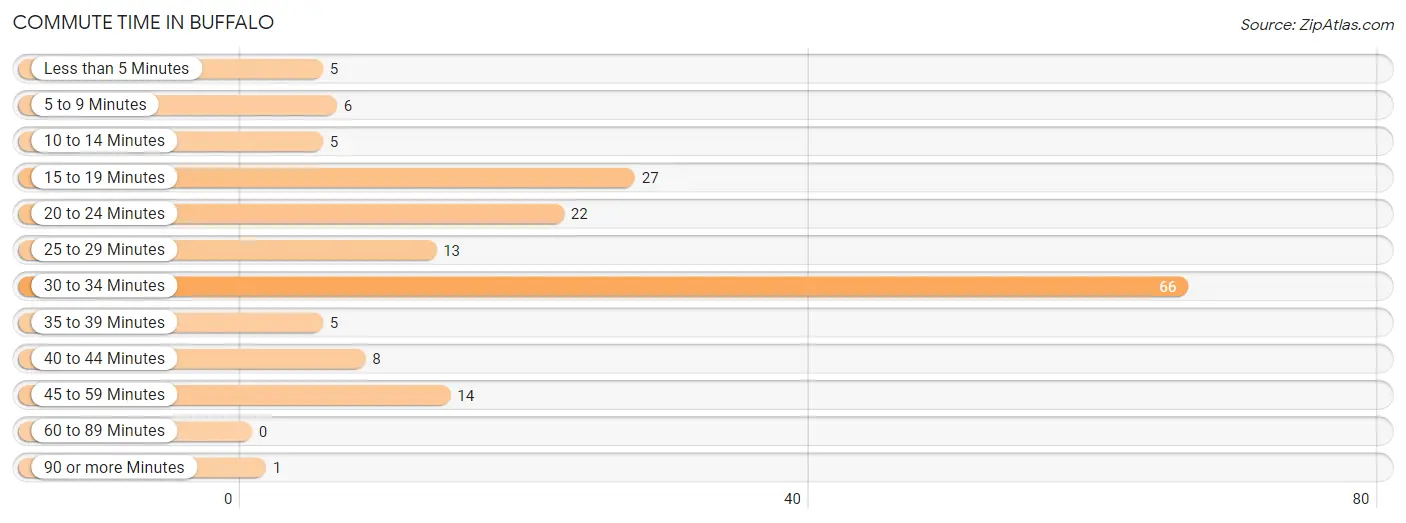
| Commute Time | # Commuters | % Commuters |
| Less than 5 Minutes | 5 | 2.9% |
| 5 to 9 Minutes | 6 | 3.5% |
| 10 to 14 Minutes | 5 | 2.9% |
| 15 to 19 Minutes | 27 | 15.7% |
| 20 to 24 Minutes | 22 | 12.8% |
| 25 to 29 Minutes | 13 | 7.6% |
| 30 to 34 Minutes | 66 | 38.4% |
| 35 to 39 Minutes | 5 | 2.9% |
| 40 to 44 Minutes | 8 | 4.6% |
| 45 to 59 Minutes | 14 | 8.1% |
| 60 to 89 Minutes | 0 | 0.0% |
| 90 or more Minutes | 1 | 0.6% |
Commute Time by Sex in Buffalo
The most common commute times in Buffalo are 30 to 34 minutes (46 commuters, 47.4%) for males and 30 to 34 minutes (20 commuters, 26.7%) for females.
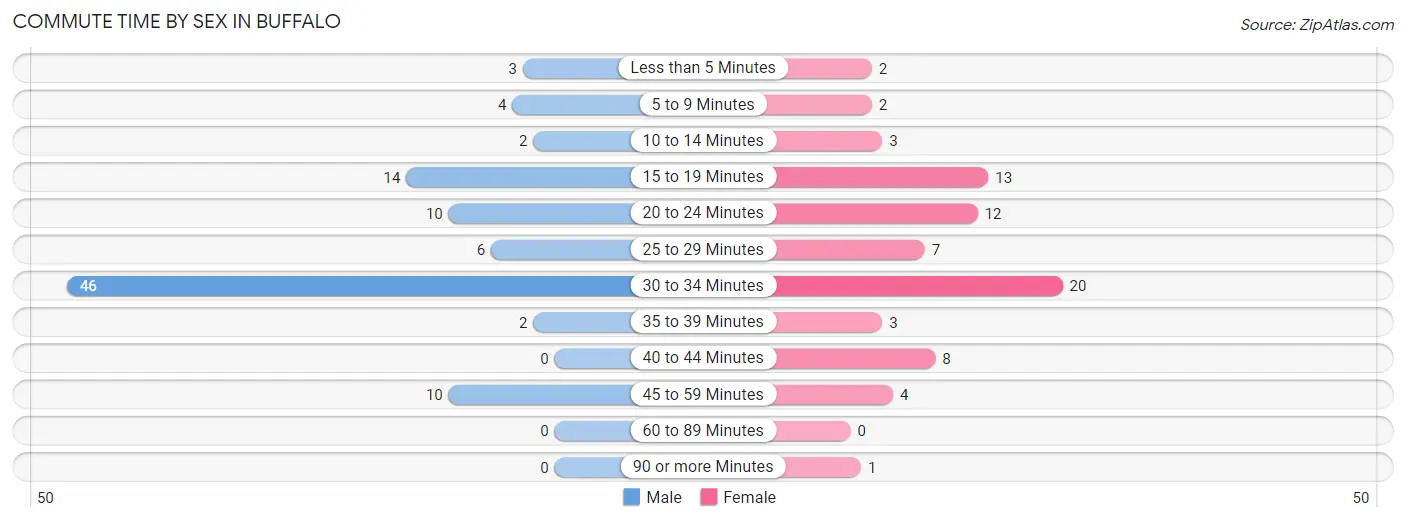
| Commute Time | Male | Female |
| Less than 5 Minutes | 3 (3.1%) | 2 (2.7%) |
| 5 to 9 Minutes | 4 (4.1%) | 2 (2.7%) |
| 10 to 14 Minutes | 2 (2.1%) | 3 (4.0%) |
| 15 to 19 Minutes | 14 (14.4%) | 13 (17.3%) |
| 20 to 24 Minutes | 10 (10.3%) | 12 (16.0%) |
| 25 to 29 Minutes | 6 (6.2%) | 7 (9.3%) |
| 30 to 34 Minutes | 46 (47.4%) | 20 (26.7%) |
| 35 to 39 Minutes | 2 (2.1%) | 3 (4.0%) |
| 40 to 44 Minutes | 0 (0.0%) | 8 (10.7%) |
| 45 to 59 Minutes | 10 (10.3%) | 4 (5.3%) |
| 60 to 89 Minutes | 0 (0.0%) | 0 (0.0%) |
| 90 or more Minutes | 0 (0.0%) | 1 (1.3%) |
Time of Departure to Work by Sex in Buffalo
The most frequent times of departure to work in Buffalo are 8:30 AM to 8:59 AM (25, 25.8%) for males and 7:00 AM to 7:29 AM (23, 30.7%) for females.
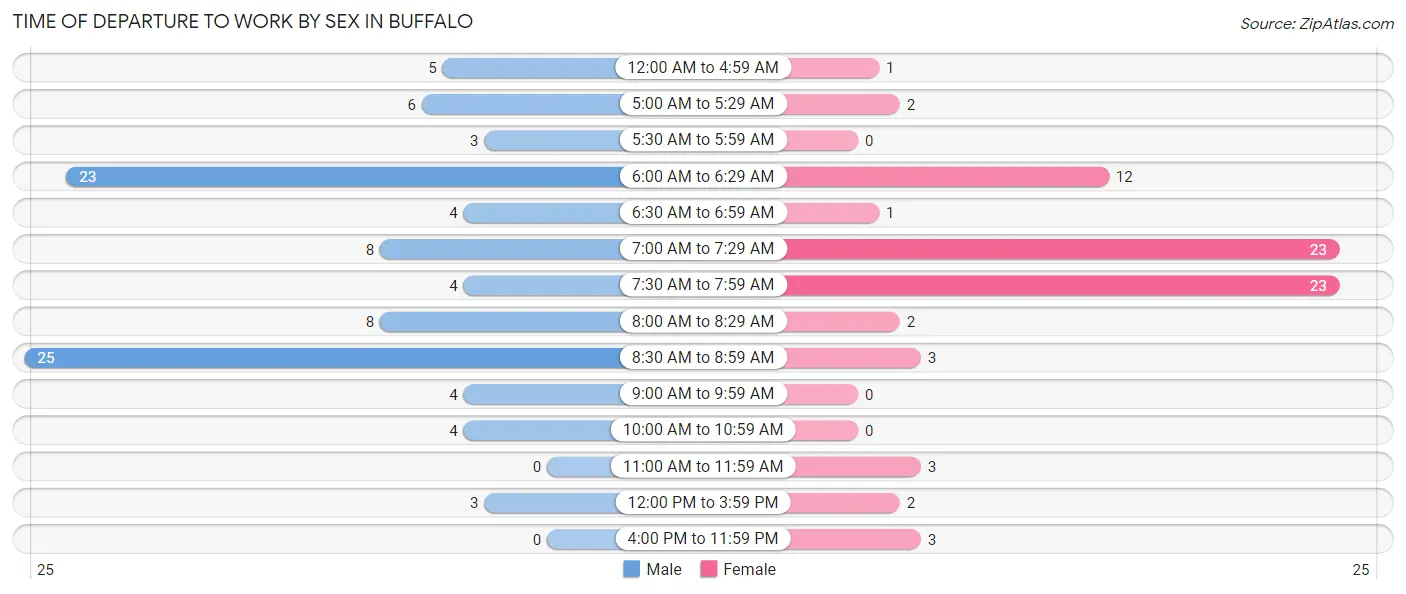
| Time of Departure | Male | Female |
| 12:00 AM to 4:59 AM | 5 (5.1%) | 1 (1.3%) |
| 5:00 AM to 5:29 AM | 6 (6.2%) | 2 (2.7%) |
| 5:30 AM to 5:59 AM | 3 (3.1%) | 0 (0.0%) |
| 6:00 AM to 6:29 AM | 23 (23.7%) | 12 (16.0%) |
| 6:30 AM to 6:59 AM | 4 (4.1%) | 1 (1.3%) |
| 7:00 AM to 7:29 AM | 8 (8.3%) | 23 (30.7%) |
| 7:30 AM to 7:59 AM | 4 (4.1%) | 23 (30.7%) |
| 8:00 AM to 8:29 AM | 8 (8.3%) | 2 (2.7%) |
| 8:30 AM to 8:59 AM | 25 (25.8%) | 3 (4.0%) |
| 9:00 AM to 9:59 AM | 4 (4.1%) | 0 (0.0%) |
| 10:00 AM to 10:59 AM | 4 (4.1%) | 0 (0.0%) |
| 11:00 AM to 11:59 AM | 0 (0.0%) | 3 (4.0%) |
| 12:00 PM to 3:59 PM | 3 (3.1%) | 2 (2.7%) |
| 4:00 PM to 11:59 PM | 0 (0.0%) | 3 (4.0%) |
| Total | 97 (100.0%) | 75 (100.0%) |
Housing Occupancy in Buffalo
Occupancy by Ownership in Buffalo
Of the total 166 dwellings in Buffalo, owner-occupied units account for 106 (63.9%), while renter-occupied units make up 60 (36.1%).
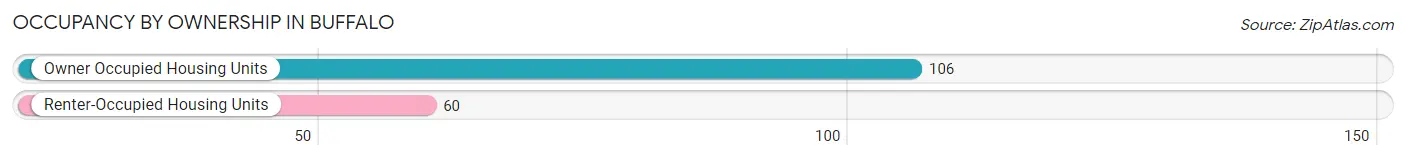
| Occupancy | # Housing Units | % Housing Units |
| Owner Occupied Housing Units | 106 | 63.9% |
| Renter-Occupied Housing Units | 60 | 36.1% |
| Total Occupied Housing Units | 166 | 100.0% |
Occupancy by Household Size in Buffalo
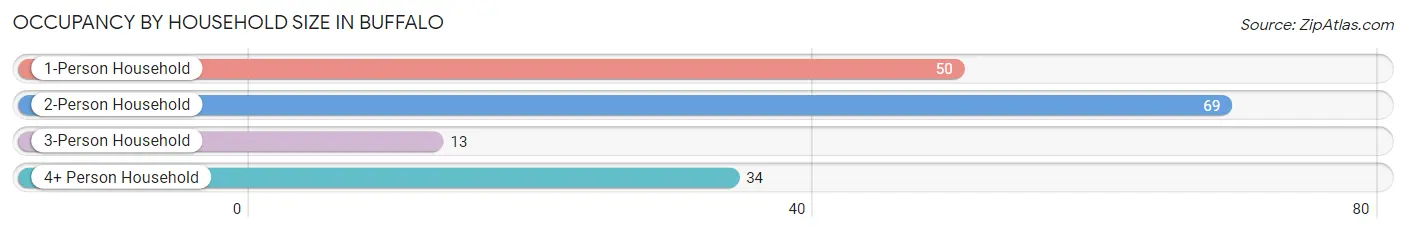
| Household Size | # Housing Units | % Housing Units |
| 1-Person Household | 50 | 30.1% |
| 2-Person Household | 69 | 41.6% |
| 3-Person Household | 13 | 7.8% |
| 4+ Person Household | 34 | 20.5% |
| Total Housing Units | 166 | 100.0% |
Occupancy by Ownership by Household Size in Buffalo
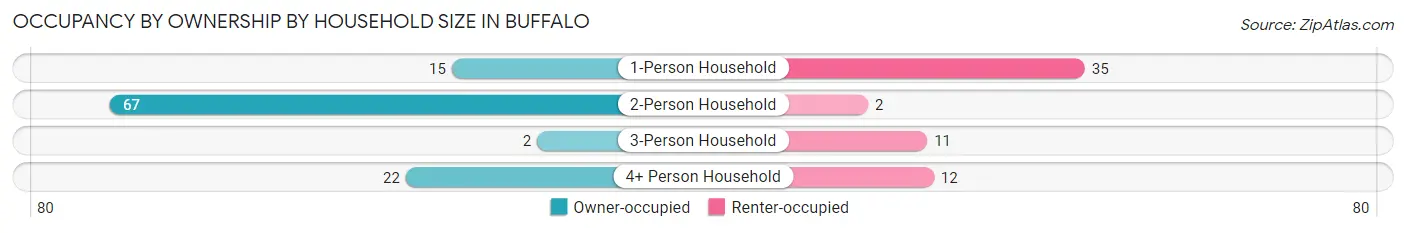
| Household Size | Owner-occupied | Renter-occupied |
| 1-Person Household | 15 (30.0%) | 35 (70.0%) |
| 2-Person Household | 67 (97.1%) | 2 (2.9%) |
| 3-Person Household | 2 (15.4%) | 11 (84.6%) |
| 4+ Person Household | 22 (64.7%) | 12 (35.3%) |
| Total Housing Units | 106 (63.9%) | 60 (36.1%) |
Occupancy by Educational Attainment in Buffalo
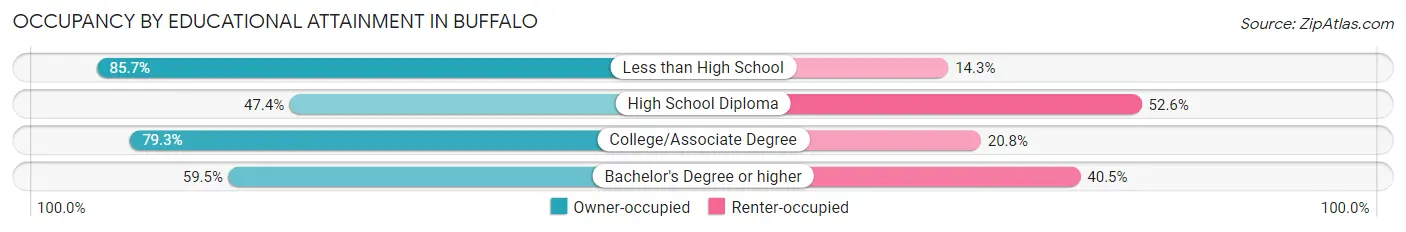
| Household Size | Owner-occupied | Renter-occupied |
| Less than High School | 12 (85.7%) | 2 (14.3%) |
| High School Diploma | 27 (47.4%) | 30 (52.6%) |
| College/Associate Degree | 42 (79.2%) | 11 (20.7%) |
| Bachelor's Degree or higher | 25 (59.5%) | 17 (40.5%) |
Occupancy by Age of Householder in Buffalo
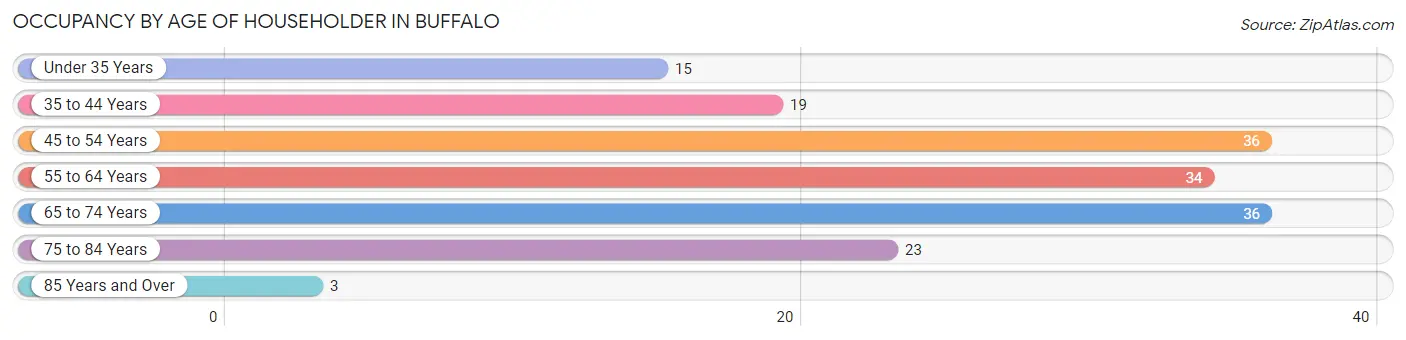
| Age Bracket | # Households | % Households |
| Under 35 Years | 15 | 9.0% |
| 35 to 44 Years | 19 | 11.5% |
| 45 to 54 Years | 36 | 21.7% |
| 55 to 64 Years | 34 | 20.5% |
| 65 to 74 Years | 36 | 21.7% |
| 75 to 84 Years | 23 | 13.9% |
| 85 Years and Over | 3 | 1.8% |
| Total | 166 | 100.0% |
Housing Finances in Buffalo
Median Income by Occupancy in Buffalo
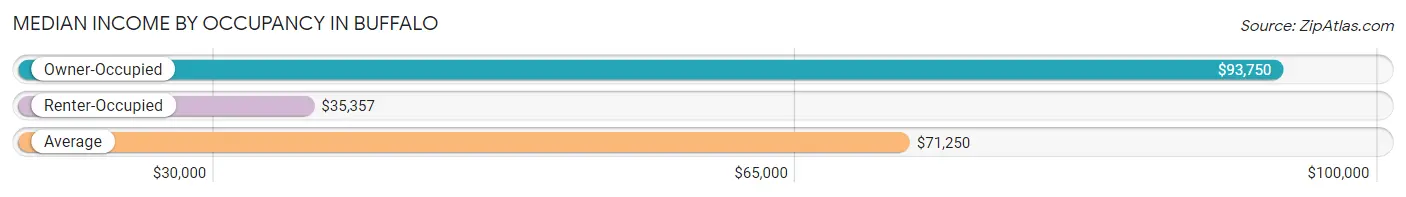
| Occupancy Type | # Households | Median Income |
| Owner-Occupied | 106 (63.9%) | $93,750 |
| Renter-Occupied | 60 (36.1%) | $35,357 |
| Average | 166 (100.0%) | $71,250 |
Occupancy by Householder Income Bracket in Buffalo
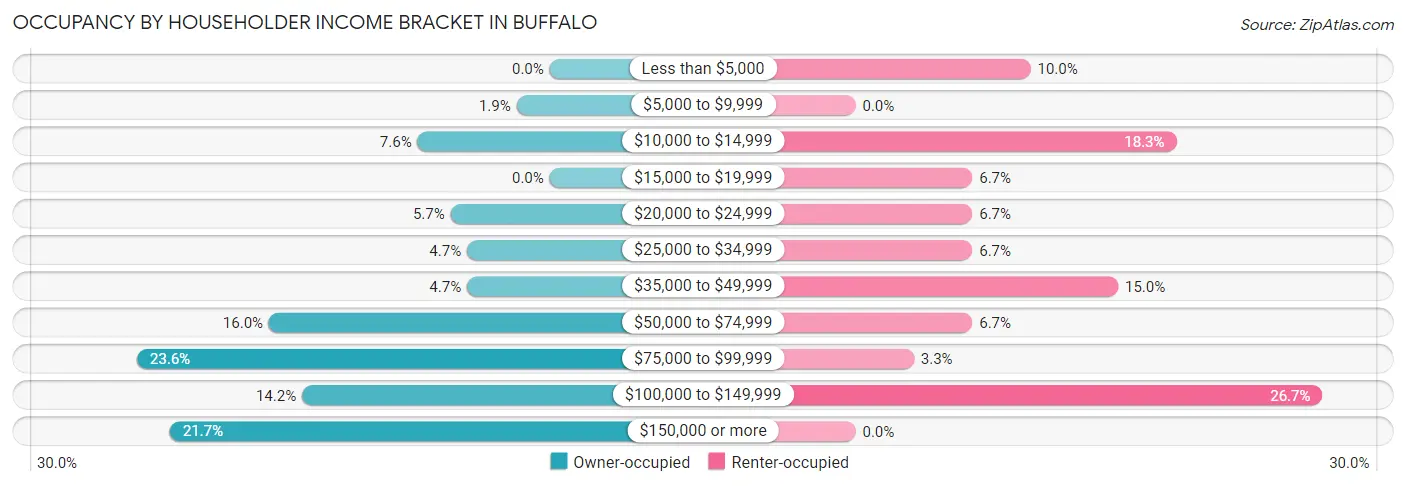
| Income Bracket | Owner-occupied | Renter-occupied |
| Less than $5,000 | 0 (0.0%) | 6 (10.0%) |
| $5,000 to $9,999 | 2 (1.9%) | 0 (0.0%) |
| $10,000 to $14,999 | 8 (7.5%) | 11 (18.3%) |
| $15,000 to $19,999 | 0 (0.0%) | 4 (6.7%) |
| $20,000 to $24,999 | 6 (5.7%) | 4 (6.7%) |
| $25,000 to $34,999 | 5 (4.7%) | 4 (6.7%) |
| $35,000 to $49,999 | 5 (4.7%) | 9 (15.0%) |
| $50,000 to $74,999 | 17 (16.0%) | 4 (6.7%) |
| $75,000 to $99,999 | 25 (23.6%) | 2 (3.3%) |
| $100,000 to $149,999 | 15 (14.1%) | 16 (26.7%) |
| $150,000 or more | 23 (21.7%) | 0 (0.0%) |
| Total | 106 (100.0%) | 60 (100.0%) |
Monthly Housing Cost Tiers in Buffalo
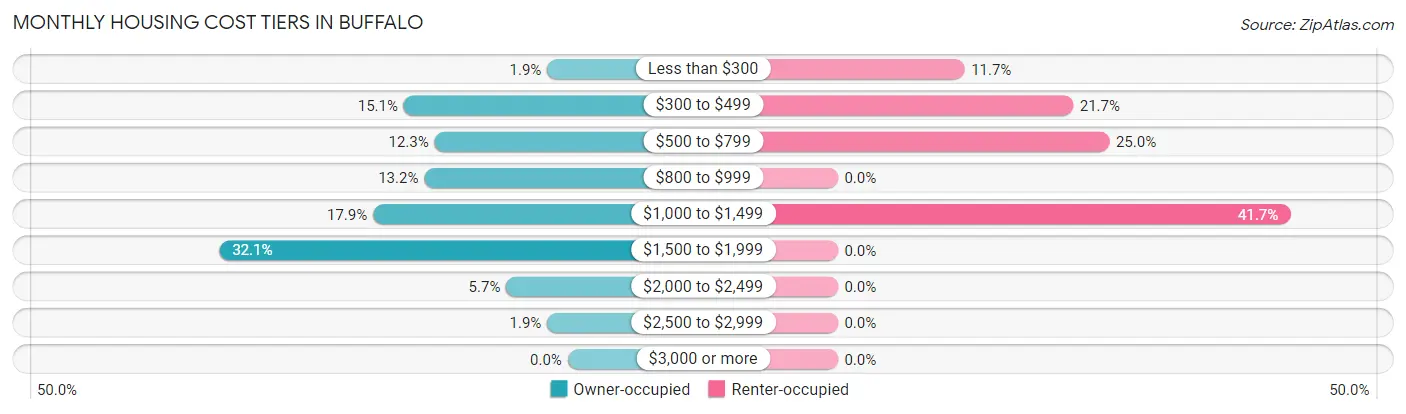
| Monthly Cost | Owner-occupied | Renter-occupied |
| Less than $300 | 2 (1.9%) | 7 (11.7%) |
| $300 to $499 | 16 (15.1%) | 13 (21.7%) |
| $500 to $799 | 13 (12.3%) | 15 (25.0%) |
| $800 to $999 | 14 (13.2%) | 0 (0.0%) |
| $1,000 to $1,499 | 19 (17.9%) | 25 (41.7%) |
| $1,500 to $1,999 | 34 (32.1%) | 0 (0.0%) |
| $2,000 to $2,499 | 6 (5.7%) | 0 (0.0%) |
| $2,500 to $2,999 | 2 (1.9%) | 0 (0.0%) |
| $3,000 or more | 0 (0.0%) | 0 (0.0%) |
| Total | 106 (100.0%) | 60 (100.0%) |
Physical Housing Characteristics in Buffalo
Housing Structures in Buffalo
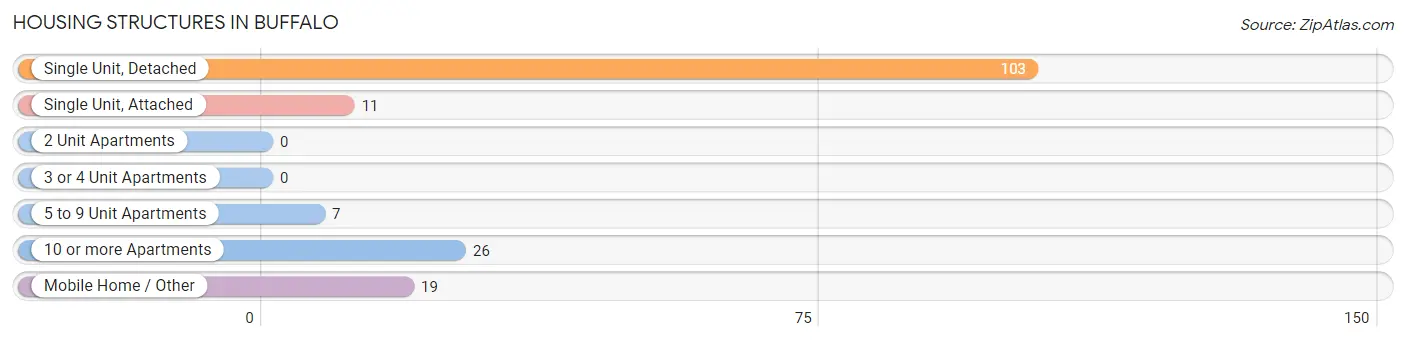
| Structure Type | # Housing Units | % Housing Units |
| Single Unit, Detached | 103 | 62.1% |
| Single Unit, Attached | 11 | 6.6% |
| 2 Unit Apartments | 0 | 0.0% |
| 3 or 4 Unit Apartments | 0 | 0.0% |
| 5 to 9 Unit Apartments | 7 | 4.2% |
| 10 or more Apartments | 26 | 15.7% |
| Mobile Home / Other | 19 | 11.5% |
| Total | 166 | 100.0% |
Housing Structures by Occupancy in Buffalo
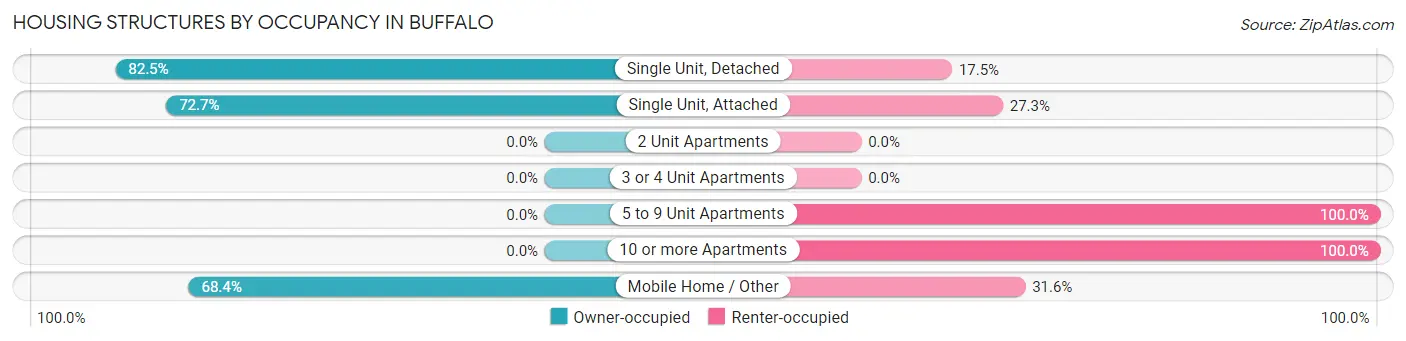
| Structure Type | Owner-occupied | Renter-occupied |
| Single Unit, Detached | 85 (82.5%) | 18 (17.5%) |
| Single Unit, Attached | 8 (72.7%) | 3 (27.3%) |
| 2 Unit Apartments | 0 (0.0%) | 0 (0.0%) |
| 3 or 4 Unit Apartments | 0 (0.0%) | 0 (0.0%) |
| 5 to 9 Unit Apartments | 0 (0.0%) | 7 (100.0%) |
| 10 or more Apartments | 0 (0.0%) | 26 (100.0%) |
| Mobile Home / Other | 13 (68.4%) | 6 (31.6%) |
| Total | 106 (63.9%) | 60 (36.1%) |
Housing Structures by Number of Rooms in Buffalo
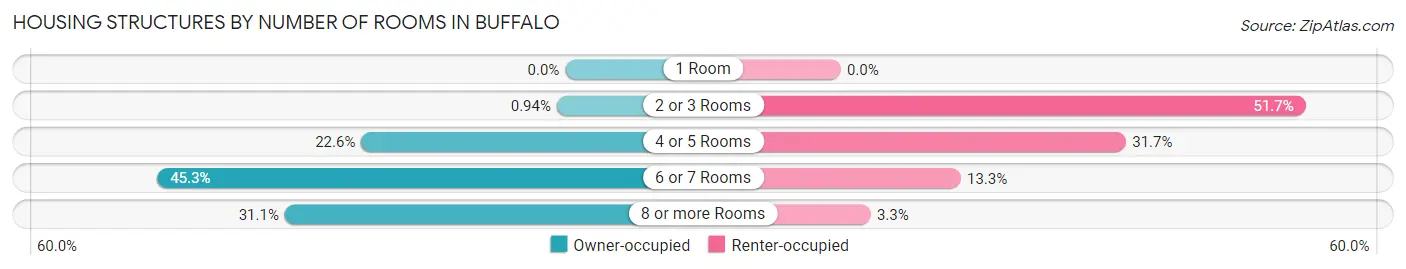
| Number of Rooms | Owner-occupied | Renter-occupied |
| 1 Room | 0 (0.0%) | 0 (0.0%) |
| 2 or 3 Rooms | 1 (0.9%) | 31 (51.7%) |
| 4 or 5 Rooms | 24 (22.6%) | 19 (31.7%) |
| 6 or 7 Rooms | 48 (45.3%) | 8 (13.3%) |
| 8 or more Rooms | 33 (31.1%) | 2 (3.3%) |
| Total | 106 (100.0%) | 60 (100.0%) |
Housing Structure by Heating Type in Buffalo
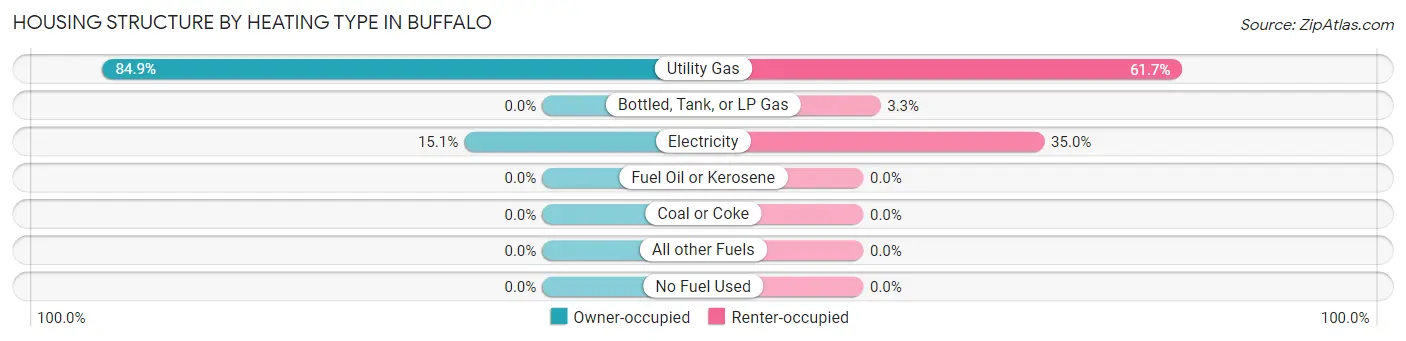
| Heating Type | Owner-occupied | Renter-occupied |
| Utility Gas | 90 (84.9%) | 37 (61.7%) |
| Bottled, Tank, or LP Gas | 0 (0.0%) | 2 (3.3%) |
| Electricity | 16 (15.1%) | 21 (35.0%) |
| Fuel Oil or Kerosene | 0 (0.0%) | 0 (0.0%) |
| Coal or Coke | 0 (0.0%) | 0 (0.0%) |
| All other Fuels | 0 (0.0%) | 0 (0.0%) |
| No Fuel Used | 0 (0.0%) | 0 (0.0%) |
| Total | 106 (100.0%) | 60 (100.0%) |
Household Vehicle Usage in Buffalo
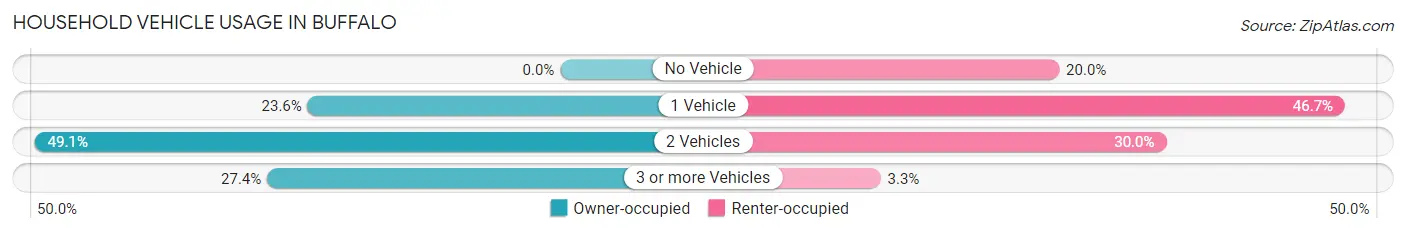
| Vehicles per Household | Owner-occupied | Renter-occupied |
| No Vehicle | 0 (0.0%) | 12 (20.0%) |
| 1 Vehicle | 25 (23.6%) | 28 (46.7%) |
| 2 Vehicles | 52 (49.1%) | 18 (30.0%) |
| 3 or more Vehicles | 29 (27.4%) | 2 (3.3%) |
| Total | 106 (100.0%) | 60 (100.0%) |
Real Estate & Mortgages in Buffalo
Real Estate and Mortgage Overview in Buffalo
| Characteristic | Without Mortgage | With Mortgage |
| Housing Units | 33 | 73 |
| Median Property Value | $92,500 | $120,800 |
| Median Household Income | $83,750 | $17 |
| Monthly Housing Costs | $486 | $0 |
| Real Estate Taxes | $2,056 | $9 |
Property Value by Mortgage Status in Buffalo
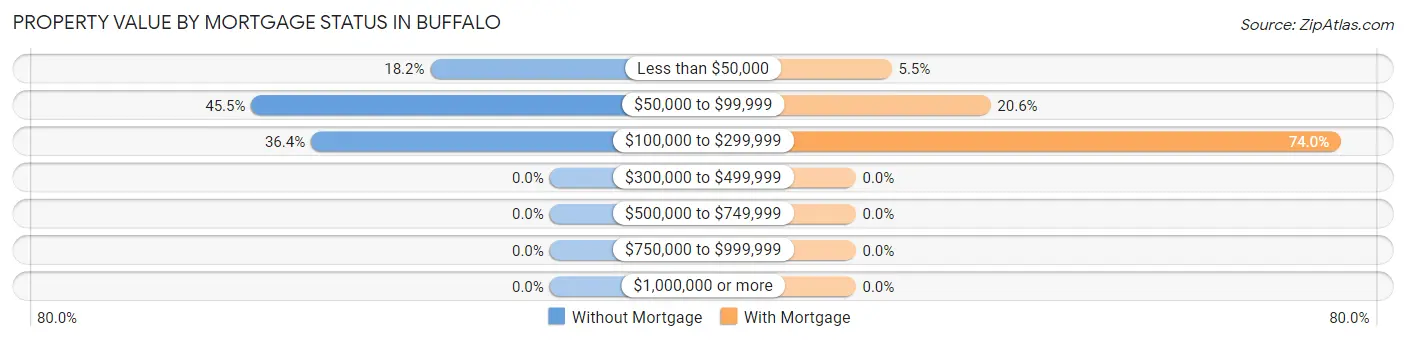
| Property Value | Without Mortgage | With Mortgage |
| Less than $50,000 | 6 (18.2%) | 4 (5.5%) |
| $50,000 to $99,999 | 15 (45.5%) | 15 (20.5%) |
| $100,000 to $299,999 | 12 (36.4%) | 54 (74.0%) |
| $300,000 to $499,999 | 0 (0.0%) | 0 (0.0%) |
| $500,000 to $749,999 | 0 (0.0%) | 0 (0.0%) |
| $750,000 to $999,999 | 0 (0.0%) | 0 (0.0%) |
| $1,000,000 or more | 0 (0.0%) | 0 (0.0%) |
| Total | 33 (100.0%) | 73 (100.0%) |
Household Income by Mortgage Status in Buffalo
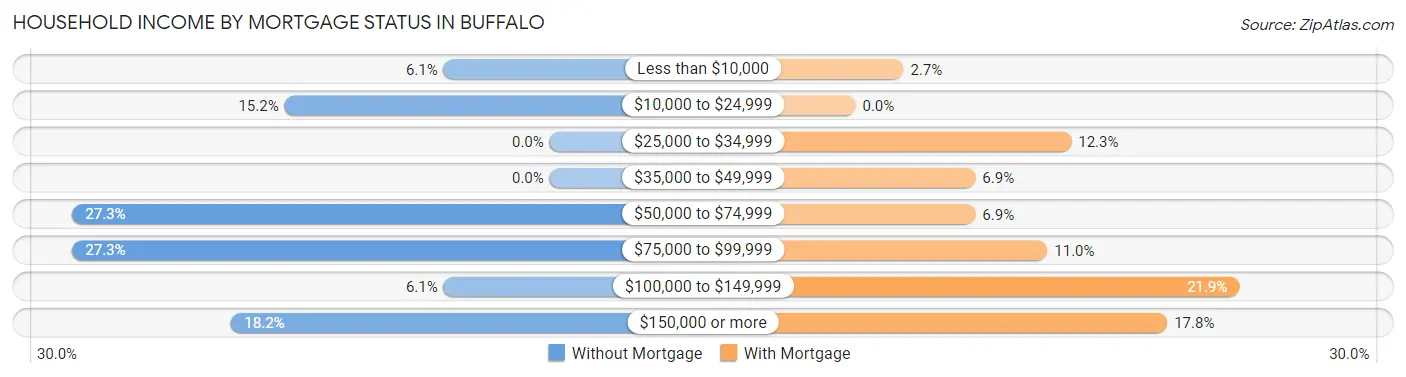
| Household Income | Without Mortgage | With Mortgage |
| Less than $10,000 | 2 (6.1%) | 2 (2.7%) |
| $10,000 to $24,999 | 5 (15.1%) | 0 (0.0%) |
| $25,000 to $34,999 | 0 (0.0%) | 9 (12.3%) |
| $35,000 to $49,999 | 0 (0.0%) | 5 (6.9%) |
| $50,000 to $74,999 | 9 (27.3%) | 5 (6.9%) |
| $75,000 to $99,999 | 9 (27.3%) | 8 (11.0%) |
| $100,000 to $149,999 | 2 (6.1%) | 16 (21.9%) |
| $150,000 or more | 6 (18.2%) | 13 (17.8%) |
| Total | 33 (100.0%) | 73 (100.0%) |
Property Value to Household Income Ratio in Buffalo
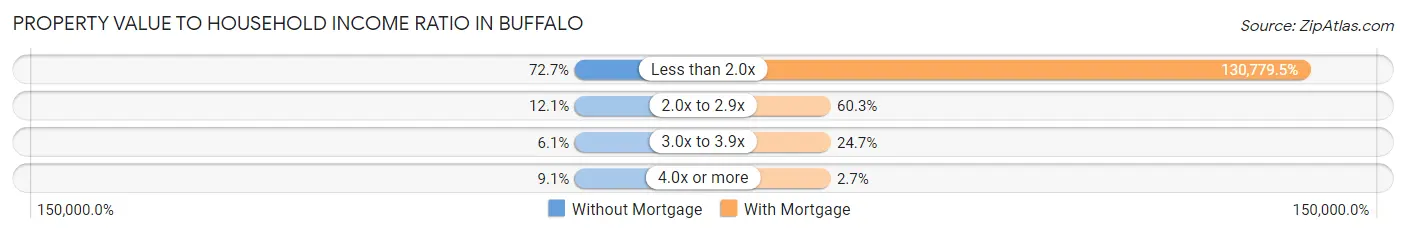
| Value-to-Income Ratio | Without Mortgage | With Mortgage |
| Less than 2.0x | 24 (72.7%) | 95,469 (130,779.4%) |
| 2.0x to 2.9x | 4 (12.1%) | 44 (60.3%) |
| 3.0x to 3.9x | 2 (6.1%) | 18 (24.7%) |
| 4.0x or more | 3 (9.1%) | 2 (2.7%) |
| Total | 33 (100.0%) | 73 (100.0%) |
Real Estate Taxes by Mortgage Status in Buffalo
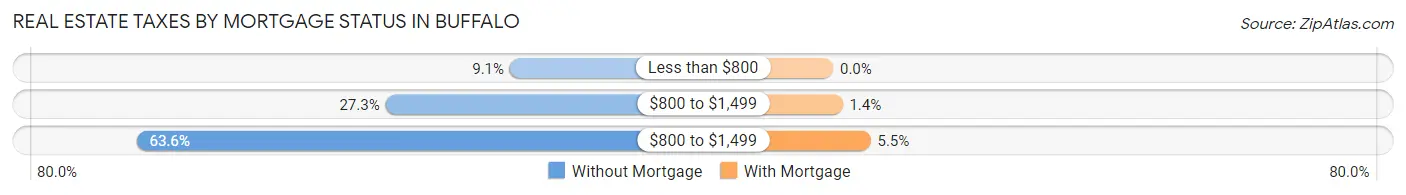
| Property Taxes | Without Mortgage | With Mortgage |
| Less than $800 | 3 (9.1%) | 0 (0.0%) |
| $800 to $1,499 | 9 (27.3%) | 1 (1.4%) |
| $800 to $1,499 | 21 (63.6%) | 4 (5.5%) |
| Total | 33 (100.0%) | 73 (100.0%) |
Health & Disability in Buffalo
Health Insurance Coverage by Age in Buffalo
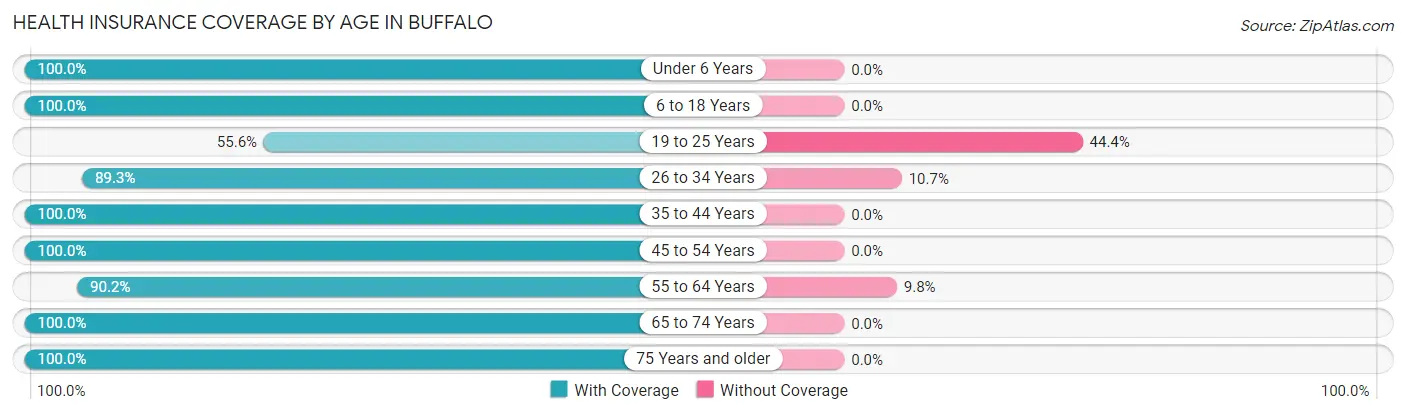
| Age Bracket | With Coverage | Without Coverage |
| Under 6 Years | 8 (100.0%) | 0 (0.0%) |
| 6 to 18 Years | 77 (100.0%) | 0 (0.0%) |
| 19 to 25 Years | 5 (55.6%) | 4 (44.4%) |
| 26 to 34 Years | 25 (89.3%) | 3 (10.7%) |
| 35 to 44 Years | 45 (100.0%) | 0 (0.0%) |
| 45 to 54 Years | 80 (100.0%) | 0 (0.0%) |
| 55 to 64 Years | 46 (90.2%) | 5 (9.8%) |
| 65 to 74 Years | 52 (100.0%) | 0 (0.0%) |
| 75 Years and older | 47 (100.0%) | 0 (0.0%) |
| Total | 385 (97.0%) | 12 (3.0%) |
Health Insurance Coverage by Citizenship Status in Buffalo
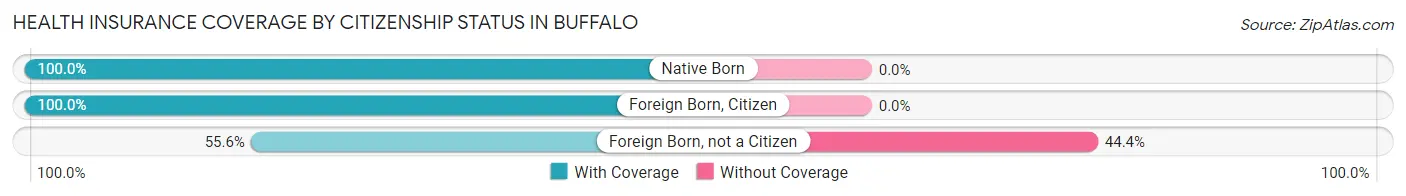
| Citizenship Status | With Coverage | Without Coverage |
| Native Born | 8 (100.0%) | 0 (0.0%) |
| Foreign Born, Citizen | 77 (100.0%) | 0 (0.0%) |
| Foreign Born, not a Citizen | 5 (55.6%) | 4 (44.4%) |
Health Insurance Coverage by Household Income in Buffalo
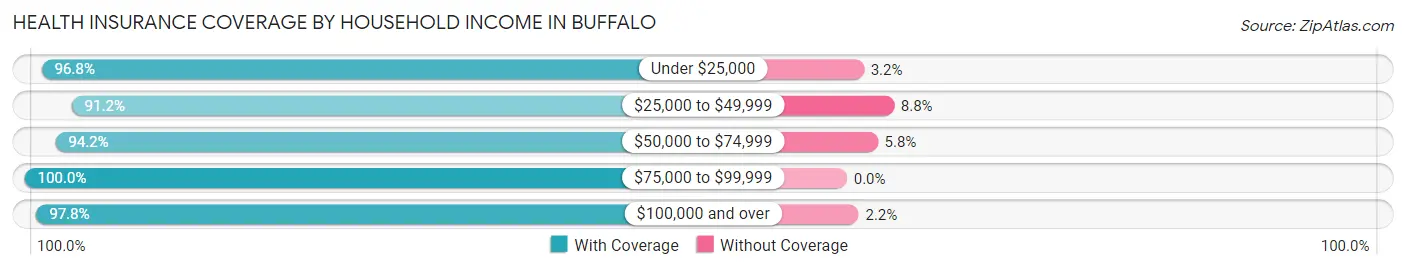
| Household Income | With Coverage | Without Coverage |
| Under $25,000 | 61 (96.8%) | 2 (3.2%) |
| $25,000 to $49,999 | 31 (91.2%) | 3 (8.8%) |
| $50,000 to $74,999 | 49 (94.2%) | 3 (5.8%) |
| $75,000 to $99,999 | 66 (100.0%) | 0 (0.0%) |
| $100,000 and over | 178 (97.8%) | 4 (2.2%) |
Public vs Private Health Insurance Coverage by Age in Buffalo
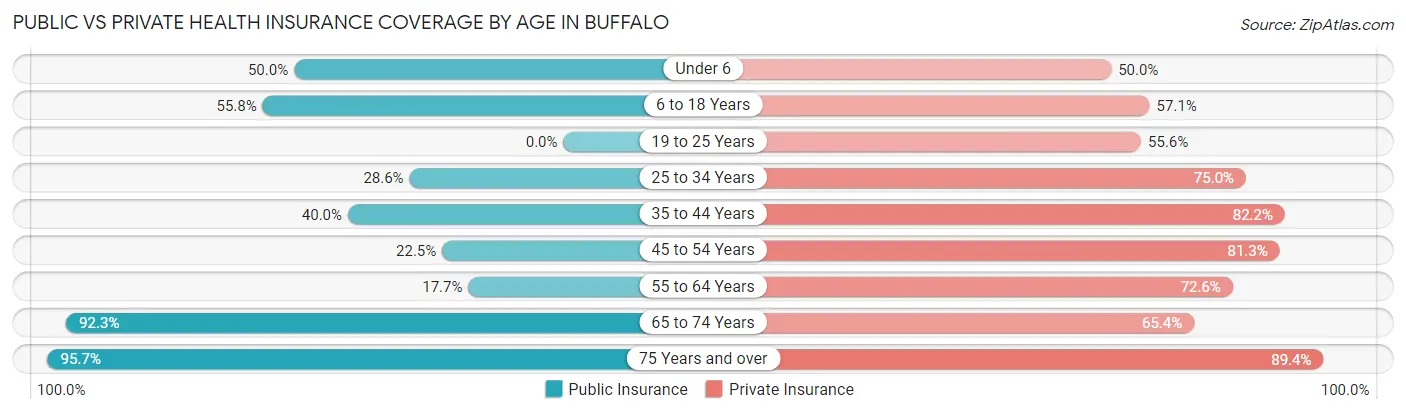
| Age Bracket | Public Insurance | Private Insurance |
| Under 6 | 4 (50.0%) | 4 (50.0%) |
| 6 to 18 Years | 43 (55.8%) | 44 (57.1%) |
| 19 to 25 Years | 0 (0.0%) | 5 (55.6%) |
| 25 to 34 Years | 8 (28.6%) | 21 (75.0%) |
| 35 to 44 Years | 18 (40.0%) | 37 (82.2%) |
| 45 to 54 Years | 18 (22.5%) | 65 (81.2%) |
| 55 to 64 Years | 9 (17.6%) | 37 (72.6%) |
| 65 to 74 Years | 48 (92.3%) | 34 (65.4%) |
| 75 Years and over | 45 (95.7%) | 42 (89.4%) |
| Total | 193 (48.6%) | 289 (72.8%) |
Disability Status by Sex by Age in Buffalo
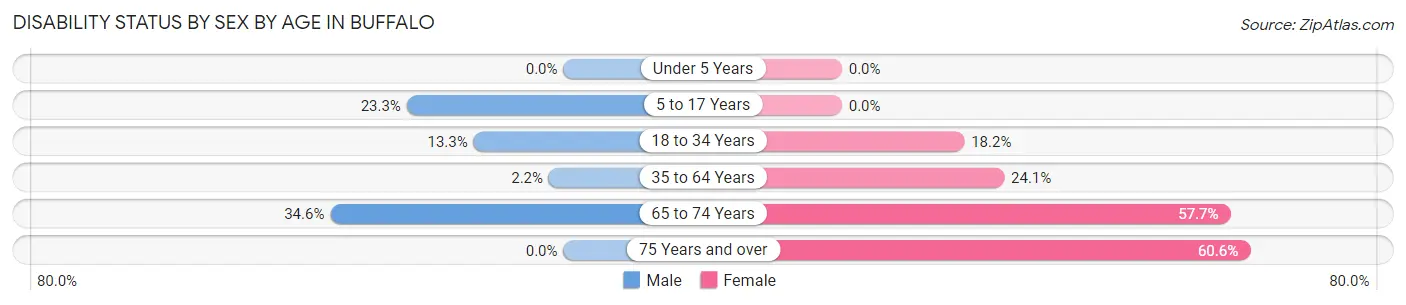
| Age Bracket | Male | Female |
| Under 5 Years | 0 (0.0%) | 0 (0.0%) |
| 5 to 17 Years | 10 (23.3%) | 0 (0.0%) |
| 18 to 34 Years | 2 (13.3%) | 4 (18.2%) |
| 35 to 64 Years | 2 (2.1%) | 20 (24.1%) |
| 65 to 74 Years | 9 (34.6%) | 15 (57.7%) |
| 75 Years and over | 0 (0.0%) | 20 (60.6%) |
Disability Class by Sex by Age in Buffalo
Disability Class: Hearing Difficulty
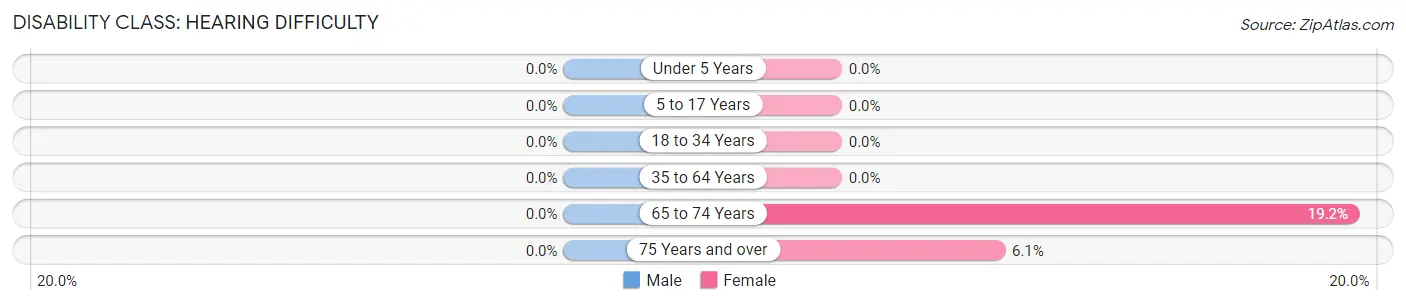
| Age Bracket | Male | Female |
| Under 5 Years | 0 (0.0%) | 0 (0.0%) |
| 5 to 17 Years | 0 (0.0%) | 0 (0.0%) |
| 18 to 34 Years | 0 (0.0%) | 0 (0.0%) |
| 35 to 64 Years | 0 (0.0%) | 0 (0.0%) |
| 65 to 74 Years | 0 (0.0%) | 5 (19.2%) |
| 75 Years and over | 0 (0.0%) | 2 (6.1%) |
Disability Class: Vision Difficulty
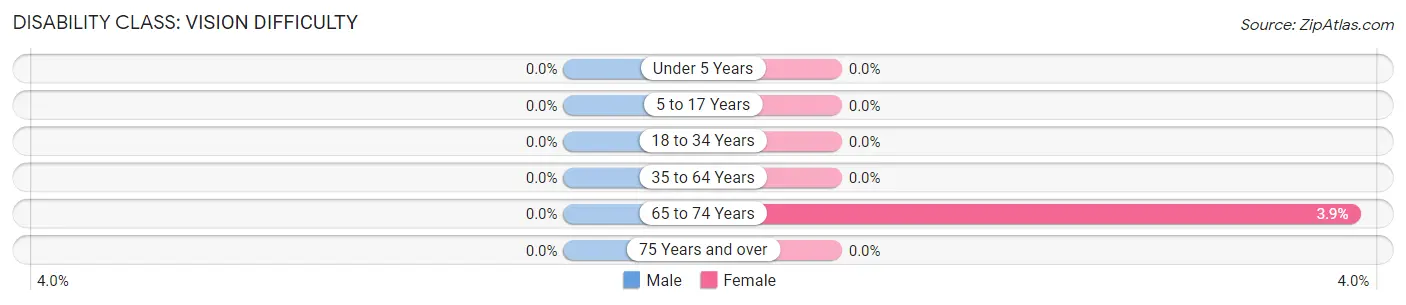
| Age Bracket | Male | Female |
| Under 5 Years | 0 (0.0%) | 0 (0.0%) |
| 5 to 17 Years | 0 (0.0%) | 0 (0.0%) |
| 18 to 34 Years | 0 (0.0%) | 0 (0.0%) |
| 35 to 64 Years | 0 (0.0%) | 0 (0.0%) |
| 65 to 74 Years | 0 (0.0%) | 1 (3.8%) |
| 75 Years and over | 0 (0.0%) | 0 (0.0%) |
Disability Class: Cognitive Difficulty
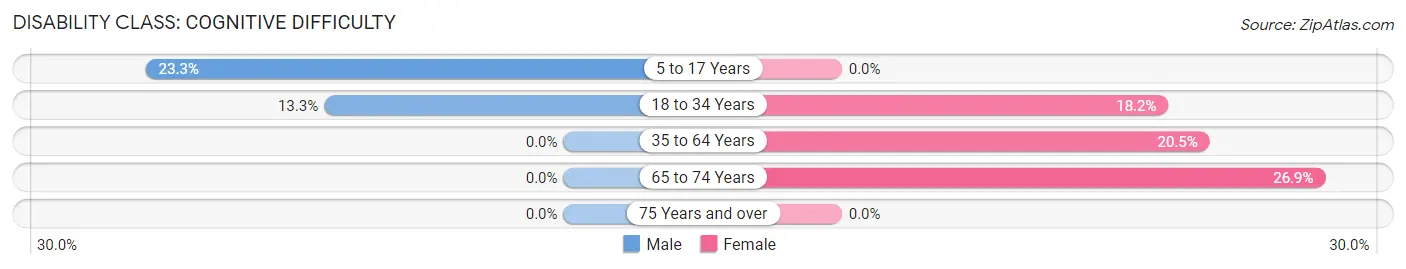
| Age Bracket | Male | Female |
| 5 to 17 Years | 10 (23.3%) | 0 (0.0%) |
| 18 to 34 Years | 2 (13.3%) | 4 (18.2%) |
| 35 to 64 Years | 0 (0.0%) | 17 (20.5%) |
| 65 to 74 Years | 0 (0.0%) | 7 (26.9%) |
| 75 Years and over | 0 (0.0%) | 0 (0.0%) |
Disability Class: Ambulatory Difficulty
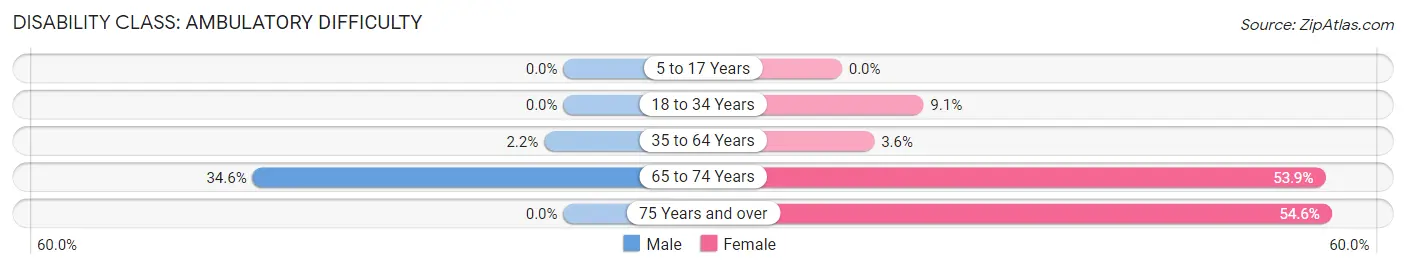
| Age Bracket | Male | Female |
| 5 to 17 Years | 0 (0.0%) | 0 (0.0%) |
| 18 to 34 Years | 0 (0.0%) | 2 (9.1%) |
| 35 to 64 Years | 2 (2.1%) | 3 (3.6%) |
| 65 to 74 Years | 9 (34.6%) | 14 (53.8%) |
| 75 Years and over | 0 (0.0%) | 18 (54.5%) |
Disability Class: Self-Care Difficulty
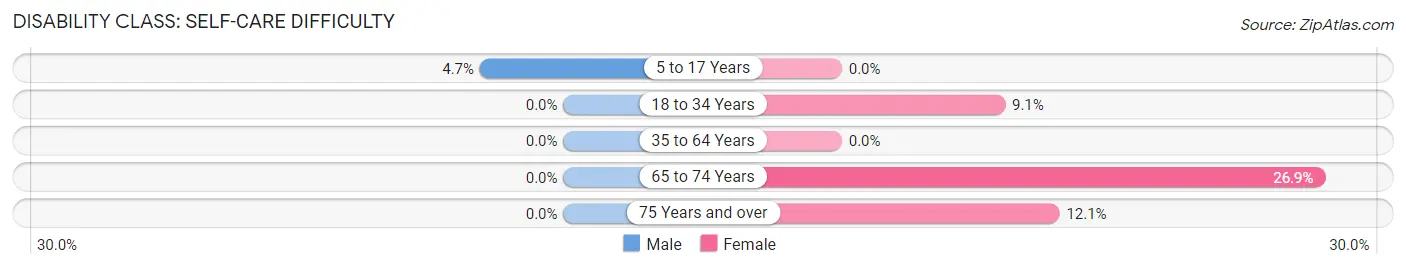
| Age Bracket | Male | Female |
| 5 to 17 Years | 2 (4.6%) | 0 (0.0%) |
| 18 to 34 Years | 0 (0.0%) | 2 (9.1%) |
| 35 to 64 Years | 0 (0.0%) | 0 (0.0%) |
| 65 to 74 Years | 0 (0.0%) | 7 (26.9%) |
| 75 Years and over | 0 (0.0%) | 4 (12.1%) |
Technology Access in Buffalo
Computing Device Access in Buffalo
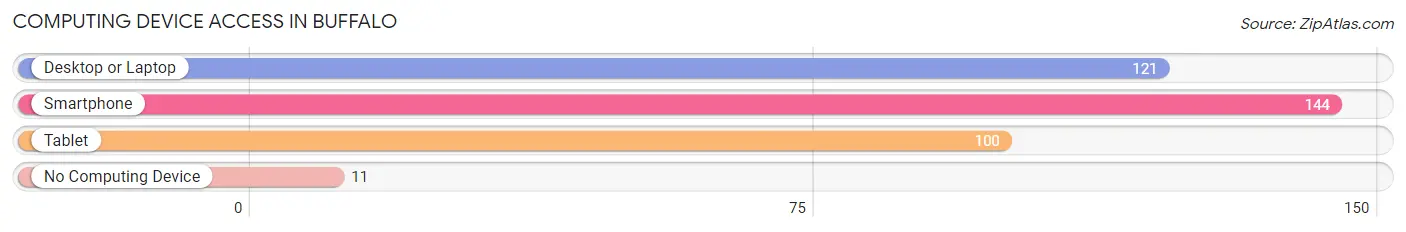
| Device Type | # Households | % Households |
| Desktop or Laptop | 121 | 72.9% |
| Smartphone | 144 | 86.8% |
| Tablet | 100 | 60.2% |
| No Computing Device | 11 | 6.6% |
| Total | 166 | 100.0% |
Internet Access in Buffalo
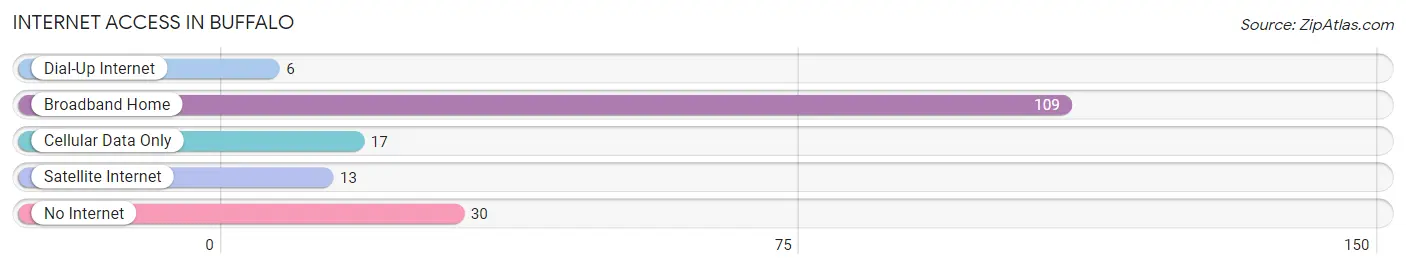
| Internet Type | # Households | % Households |
| Dial-Up Internet | 6 | 3.6% |
| Broadband Home | 109 | 65.7% |
| Cellular Data Only | 17 | 10.2% |
| Satellite Internet | 13 | 7.8% |
| No Internet | 30 | 18.1% |
| Total | 166 | 100.0% |
Buffalo Summary
Buffalo, Illinois is a small village located in Sangamon County, Illinois. It is situated on the Sangamon River, approximately 10 miles south of Springfield, the state capital. The population of Buffalo was 1,845 at the 2010 census.
History
Buffalo was first settled in 1819 by a group of settlers from Kentucky. The village was named after the nearby Buffalo Creek. The first post office was established in 1837. The village was incorporated in 1867.
In the late 19th century, Buffalo was a thriving agricultural community. The village was home to several grain elevators, a flour mill, a sawmill, and a brickyard. The village also had a railroad station, which connected it to the rest of the state.
Geography
Buffalo is located at 39°45'25"N 89°30'45"W (39.7569, -89.5125). According to the 2010 census, the village has a total area of 0.9 square miles, all land.
Economy
The economy of Buffalo is largely based on agriculture. The village is home to several grain elevators, a flour mill, and a sawmill. The village also has a few small businesses, including a grocery store, a hardware store, and a restaurant.
Demographics
As of the 2010 census, there were 1,845 people, 745 households, and 486 families residing in the village. The population density was 2,039.2 people per square mile. The racial makeup of the village was 97.2% White, 0.7% African American, 0.2% Native American, 0.2% Asian, 0.2% from other races, and 1.7% from two or more races. Hispanic or Latino of any race were 1.2% of the population.
There were 745 households, out of which 28.3% had children under the age of 18 living with them, 48.2% were married couples living together, 11.2% had a female householder with no husband present, and 36.2% were non-families. 32.2% of all households were made up of individuals, and 15.2% had someone living alone who was 65 years of age or older. The average household size was 2.37 and the average family size was 2.97.
In the village, the population was spread out, with 24.2% under the age of 18, 8.2% from 18 to 24, 25.7% from 25 to 44, 24.2% from 45 to 64, and 17.7% who were 65 years of age or older. The median age was 39 years. For every 100 females, there were 91.2 males. For every 100 females age 18 and over, there were 87.2 males.
The median income for a household in the village was $37,500, and the median income for a family was $45,000. Males had a median income of $35,000 versus $25,000 for females. The per capita income for the village was $18,845. About 8.2% of families and 10.2% of the population were below the poverty line, including 14.2% of those under age 18 and 8.2% of those age 65 or over.
Common Questions
What is Per Capita Income in Buffalo?
Per Capita income in Buffalo is $38,188.
What is the Median Family Income in Buffalo?
Median Family Income in Buffalo is $93,750.
What is the Median Household income in Buffalo?
Median Household Income in Buffalo is $71,250.
What is Income or Wage Gap in Buffalo?
Income or Wage Gap in Buffalo is 59.5%.
Women in Buffalo earn 40.5 cents for every dollar earned by a man.
What is Inequality or Gini Index in Buffalo?
Inequality or Gini Index in Buffalo is 0.43.
What is the Total Population of Buffalo?
Total Population of Buffalo is 397.
What is the Total Male Population of Buffalo?
Total Male Population of Buffalo is 195.
What is the Total Female Population of Buffalo?
Total Female Population of Buffalo is 202.
What is the Ratio of Males per 100 Females in Buffalo?
There are 96.53 Males per 100 Females in Buffalo.
What is the Ratio of Females per 100 Males in Buffalo?
There are 103.59 Females per 100 Males in Buffalo.
What is the Median Population Age in Buffalo?
Median Population Age in Buffalo is 48.6 Years.
What is the Average Family Size in Buffalo
Average Family Size in Buffalo is 2.9 People.
What is the Average Household Size in Buffalo
Average Household Size in Buffalo is 2.4 People.
How Large is the Labor Force in Buffalo?
There are 196 People in the Labor Forcein in Buffalo.
What is the Percentage of People in the Labor Force in Buffalo?
58.2% of People are in the Labor Force in Buffalo.
What is the Unemployment Rate in Buffalo?
Unemployment Rate in Buffalo is 0.5%.