Grayville, IL Map & Demographics
Grayville Map
Grayville Overview
$26,450
PER CAPITA INCOME
$70,375
AVG FAMILY INCOME
$53,977
AVG HOUSEHOLD INCOME
47.1%
WAGE / INCOME GAP [ % ]
52.9¢/ $1
WAGE / INCOME GAP [ $ ]
0.44
INEQUALITY / GINI INDEX
1,542
TOTAL POPULATION
724
MALE POPULATION
818
FEMALE POPULATION
88.51
MALES / 100 FEMALES
112.98
FEMALES / 100 MALES
40.8
MEDIAN AGE
2.9
AVG FAMILY SIZE
2.3
AVG HOUSEHOLD SIZE
763
LABOR FORCE [ PEOPLE ]
62.2%
PERCENT IN LABOR FORCE
5.4%
UNEMPLOYMENT RATE
Grayville Zip Codes
Grayville Area Codes
Income in Grayville
Income Overview in Grayville
Per Capita Income in Grayville is $26,450, while median incomes of families and households are $70,375 and $53,977 respectively.
| Characteristic | Number | Measure |
| Per Capita Income | 1,542 | $26,450 |
| Median Family Income | 385 | $70,375 |
| Mean Family Income | 385 | $79,215 |
| Median Household Income | 643 | $53,977 |
| Mean Household Income | 643 | $64,110 |
| Income Deficit | 385 | $0 |
| Wage / Income Gap (%) | 1,542 | 47.14% |
| Wage / Income Gap ($) | 1,542 | 52.86¢ per $1 |
| Gini / Inequality Index | 1,542 | 0.44 |
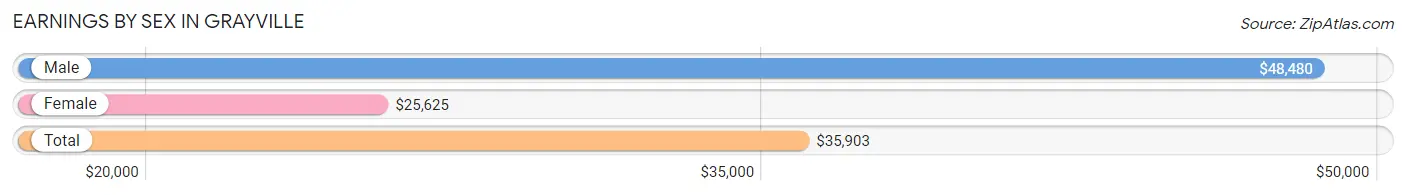
Earnings by Sex in Grayville
Average Earnings in Grayville are $35,903, $48,480 for men and $25,625 for women, a difference of 47.1%.
| Sex | Number | Average Earnings |
| Male | 404 (52.4%) | $48,480 |
| Female | 367 (47.6%) | $25,625 |
| Total | 771 (100.0%) | $35,903 |
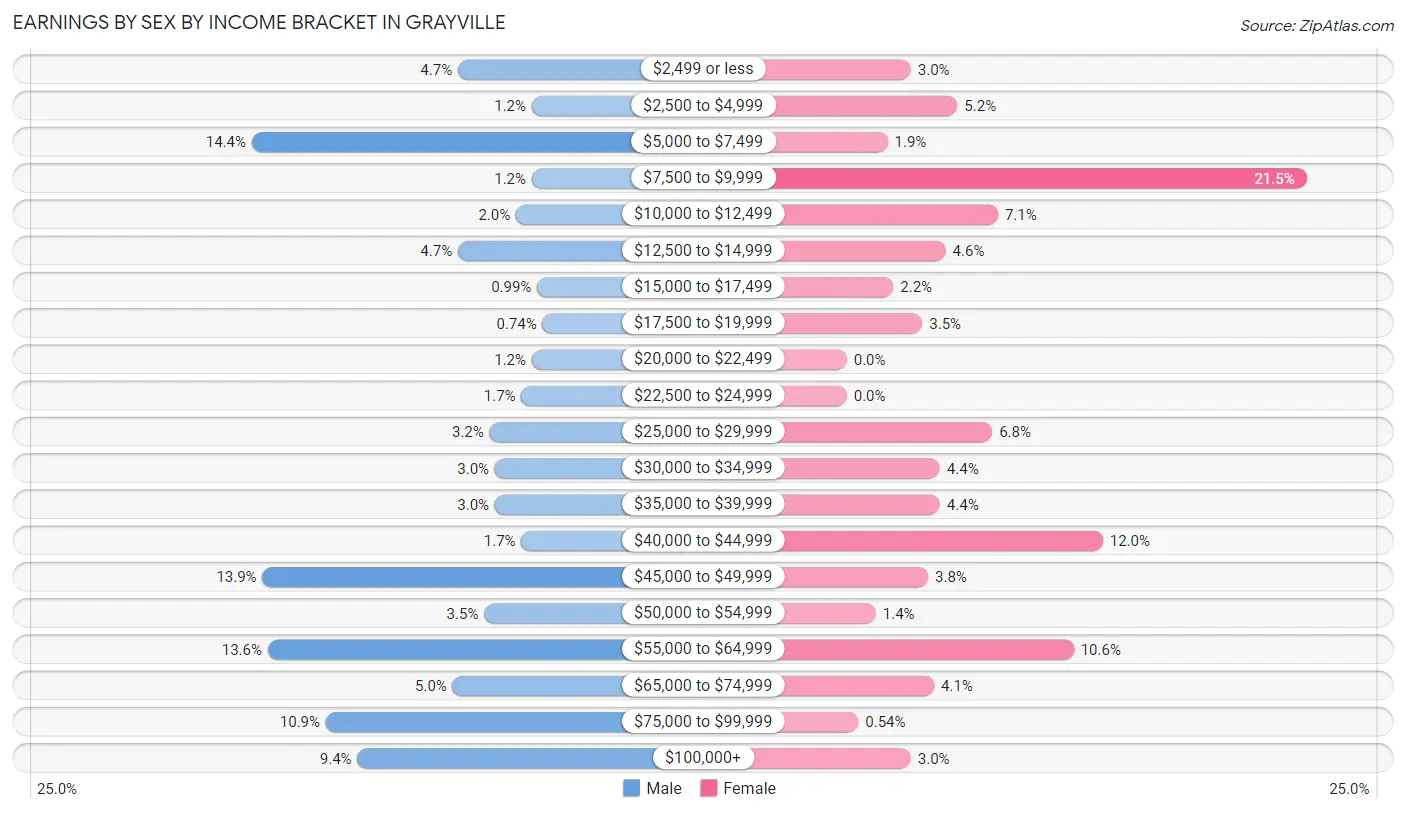
Earnings by Sex by Income Bracket in Grayville
The most common earnings brackets in Grayville are $5,000 to $7,499 for men (58 | 14.4%) and $7,500 to $9,999 for women (79 | 21.5%).
| Income | Male | Female |
| $2,499 or less | 19 (4.7%) | 11 (3.0%) |
| $2,500 to $4,999 | 5 (1.2%) | 19 (5.2%) |
| $5,000 to $7,499 | 58 (14.4%) | 7 (1.9%) |
| $7,500 to $9,999 | 5 (1.2%) | 79 (21.5%) |
| $10,000 to $12,499 | 8 (2.0%) | 26 (7.1%) |
| $12,500 to $14,999 | 19 (4.7%) | 17 (4.6%) |
| $15,000 to $17,499 | 4 (1.0%) | 8 (2.2%) |
| $17,500 to $19,999 | 3 (0.7%) | 13 (3.5%) |
| $20,000 to $22,499 | 5 (1.2%) | 0 (0.0%) |
| $22,500 to $24,999 | 7 (1.7%) | 0 (0.0%) |
| $25,000 to $29,999 | 13 (3.2%) | 25 (6.8%) |
| $30,000 to $34,999 | 12 (3.0%) | 16 (4.4%) |
| $35,000 to $39,999 | 12 (3.0%) | 16 (4.4%) |
| $40,000 to $44,999 | 7 (1.7%) | 44 (12.0%) |
| $45,000 to $49,999 | 56 (13.9%) | 14 (3.8%) |
| $50,000 to $54,999 | 14 (3.5%) | 5 (1.4%) |
| $55,000 to $64,999 | 55 (13.6%) | 39 (10.6%) |
| $65,000 to $74,999 | 20 (5.0%) | 15 (4.1%) |
| $75,000 to $99,999 | 44 (10.9%) | 2 (0.5%) |
| $100,000+ | 38 (9.4%) | 11 (3.0%) |
| Total | 404 (100.0%) | 367 (100.0%) |
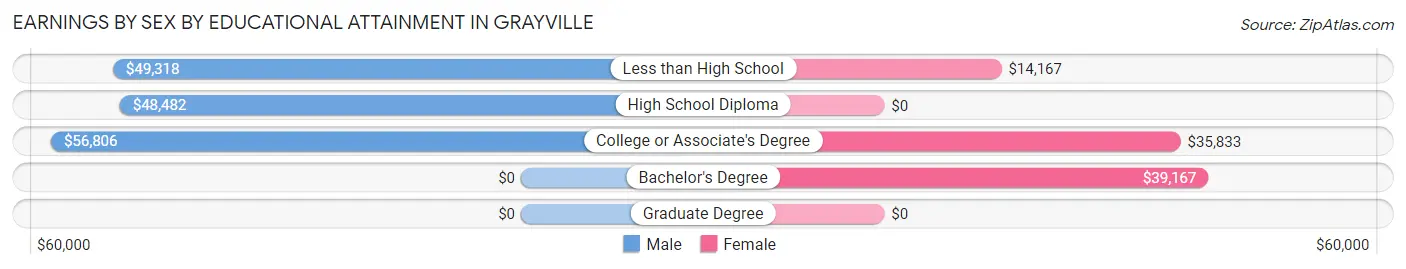
Earnings by Sex by Educational Attainment in Grayville
Average earnings in Grayville are $54,063 for men and $28,636 for women, a difference of 47.0%. Men with an educational attainment of college or associate's degree enjoy the highest average annual earnings of $56,806, while those with high school diploma education earn the least with $48,482. Women with an educational attainment of bachelor's degree earn the most with the average annual earnings of $39,167, while those with less than high school education have the smallest earnings of $14,167.
| Educational Attainment | Male Income | Female Income |
| Less than High School | $49,318 | $14,167 |
| High School Diploma | $48,482 | $0 |
| College or Associate's Degree | $56,806 | $35,833 |
| Bachelor's Degree | - | - |
| Graduate Degree | - | - |
| Total | $54,063 | $28,636 |
Family Income in Grayville
Family Income Brackets in Grayville
According to the Grayville family income data, there are 83 families falling into the $100,000 to $149,999 income range, which is the most common income bracket and makes up 21.6% of all families. Conversely, the less than $10,000 income bracket is the least frequent group with only 3 families (0.8%) belonging to this category.
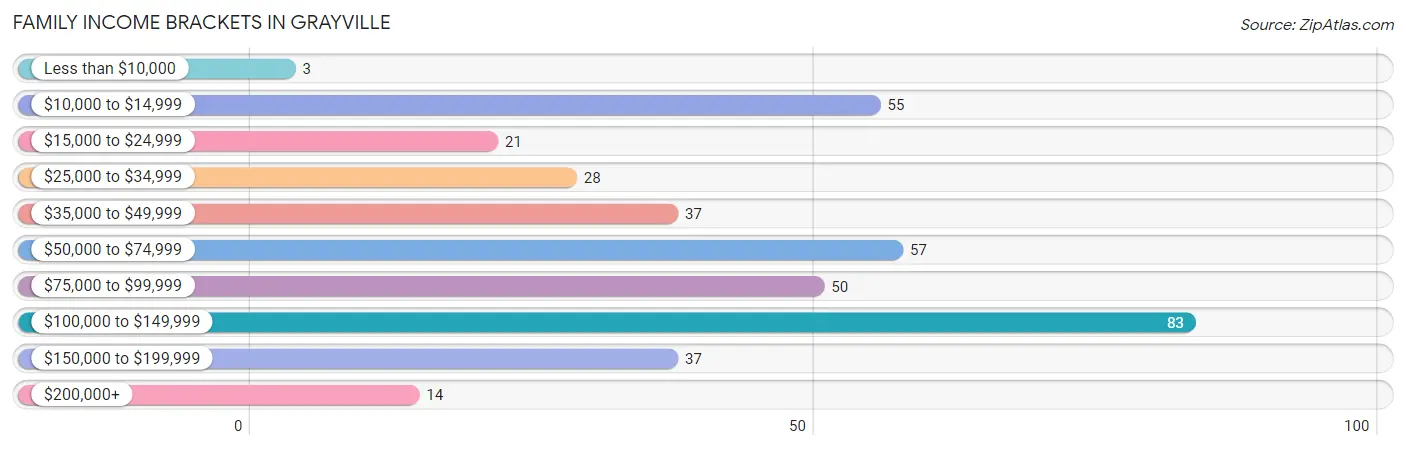
| Income Bracket | # Families | % Families |
| Less than $10,000 | 3 | 0.8% |
| $10,000 to $14,999 | 55 | 14.3% |
| $15,000 to $24,999 | 21 | 5.5% |
| $25,000 to $34,999 | 28 | 7.3% |
| $35,000 to $49,999 | 37 | 9.6% |
| $50,000 to $74,999 | 57 | 14.8% |
| $75,000 to $99,999 | 50 | 13.0% |
| $100,000 to $149,999 | 83 | 21.6% |
| $150,000 to $199,999 | 37 | 9.6% |
| $200,000+ | 14 | 3.6% |
Family Income by Famaliy Size in Grayville
2-person families (171 | 44.4%) account for the highest median family income in Grayville with $76,250 per family, while 2-person families (171 | 44.4%) have the highest median income of $38,125 per family member.
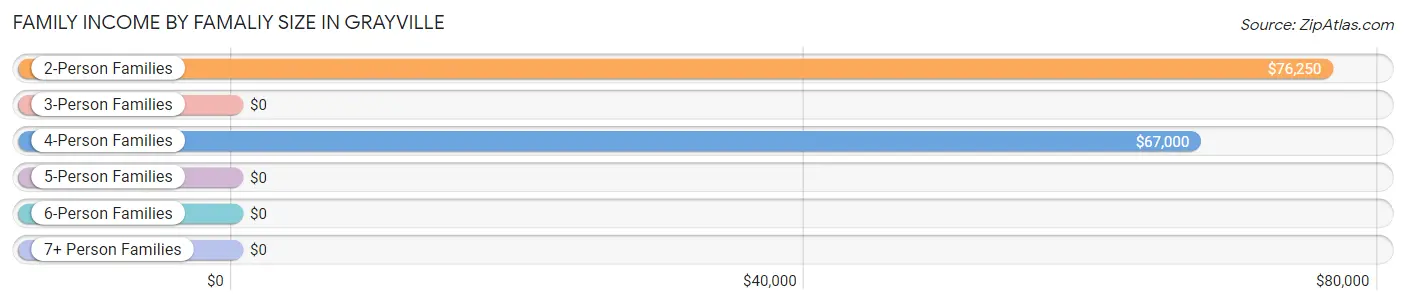
| Income Bracket | # Families | Median Income |
| 2-Person Families | 171 (44.4%) | $76,250 |
| 3-Person Families | 127 (33.0%) | $0 |
| 4-Person Families | 40 (10.4%) | $67,000 |
| 5-Person Families | 37 (9.6%) | $0 |
| 6-Person Families | 4 (1.0%) | $0 |
| 7+ Person Families | 6 (1.6%) | $0 |
| Total | 385 (100.0%) | $70,375 |
Family Income by Number of Earners in Grayville
The median family income in Grayville is $70,375, with families comprising 3+ earners (52) having the highest median family income of $126,500, while families with no earners (43) have the lowest median family income of $45,114, accounting for 13.5% and 11.2% of families, respectively.
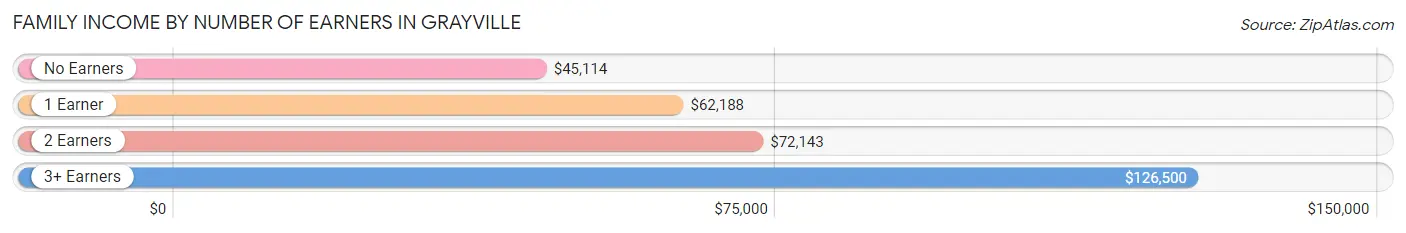
| Number of Earners | # Families | Median Income |
| No Earners | 43 (11.2%) | $45,114 |
| 1 Earner | 134 (34.8%) | $62,188 |
| 2 Earners | 156 (40.5%) | $72,143 |
| 3+ Earners | 52 (13.5%) | $126,500 |
| Total | 385 (100.0%) | $70,375 |
Household Income in Grayville
Household Income Brackets in Grayville
With 121 households falling in the category, the $50,000 to $74,999 income range is the most frequent in Grayville, accounting for 18.8% of all households. In contrast, only 14 households (2.2%) fall into the $200,000+ income bracket, making it the least populous group.
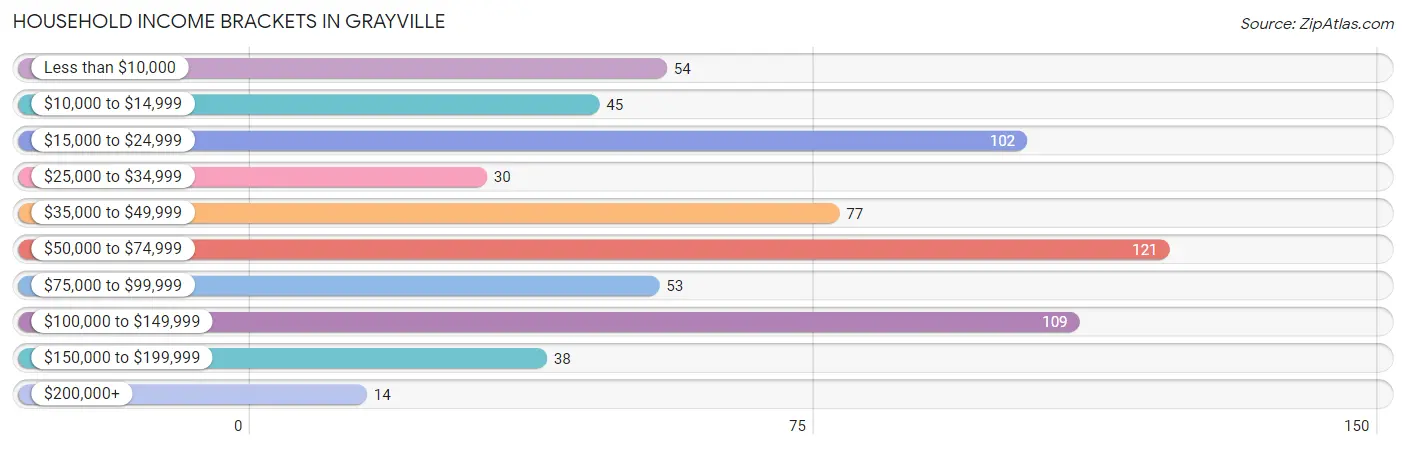
| Income Bracket | # Households | % Households |
| Less than $10,000 | 54 | 8.4% |
| $10,000 to $14,999 | 45 | 7.0% |
| $15,000 to $24,999 | 102 | 15.9% |
| $25,000 to $34,999 | 30 | 4.7% |
| $35,000 to $49,999 | 77 | 12.0% |
| $50,000 to $74,999 | 121 | 18.8% |
| $75,000 to $99,999 | 53 | 8.2% |
| $100,000 to $149,999 | 109 | 17.0% |
| $150,000 to $199,999 | 38 | 5.9% |
| $200,000+ | 14 | 2.2% |
Household Income by Householder Age in Grayville
The median household income in Grayville is $53,977, with the highest median household income of $66,250 found in the 15 to 24 years age bracket for the primary householder. A total of 10 households (1.6%) fall into this category. Meanwhile, the 65+ years age bracket for the primary householder has the lowest median household income of $28,333, with 214 households (33.3%) in this group.
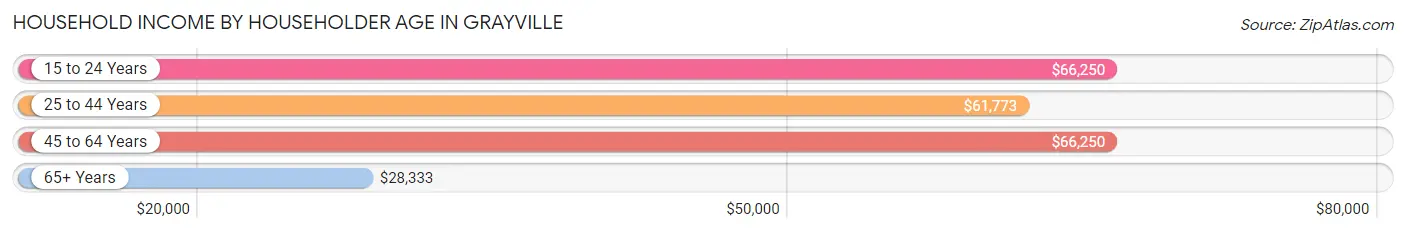
| Income Bracket | # Households | Median Income |
| 15 to 24 Years | 10 (1.6%) | $66,250 |
| 25 to 44 Years | 223 (34.7%) | $61,773 |
| 45 to 64 Years | 196 (30.5%) | $66,250 |
| 65+ Years | 214 (33.3%) | $28,333 |
| Total | 643 (100.0%) | $53,977 |
Poverty in Grayville
Income Below Poverty by Sex and Age in Grayville
With 19.4% poverty level for males and 32.6% for females among the residents of Grayville, 16 and 17 year old males and 6 to 11 year old females are the most vulnerable to poverty, with 39 males (78.0%) and 94 females (71.2%) in their respective age groups living below the poverty level.
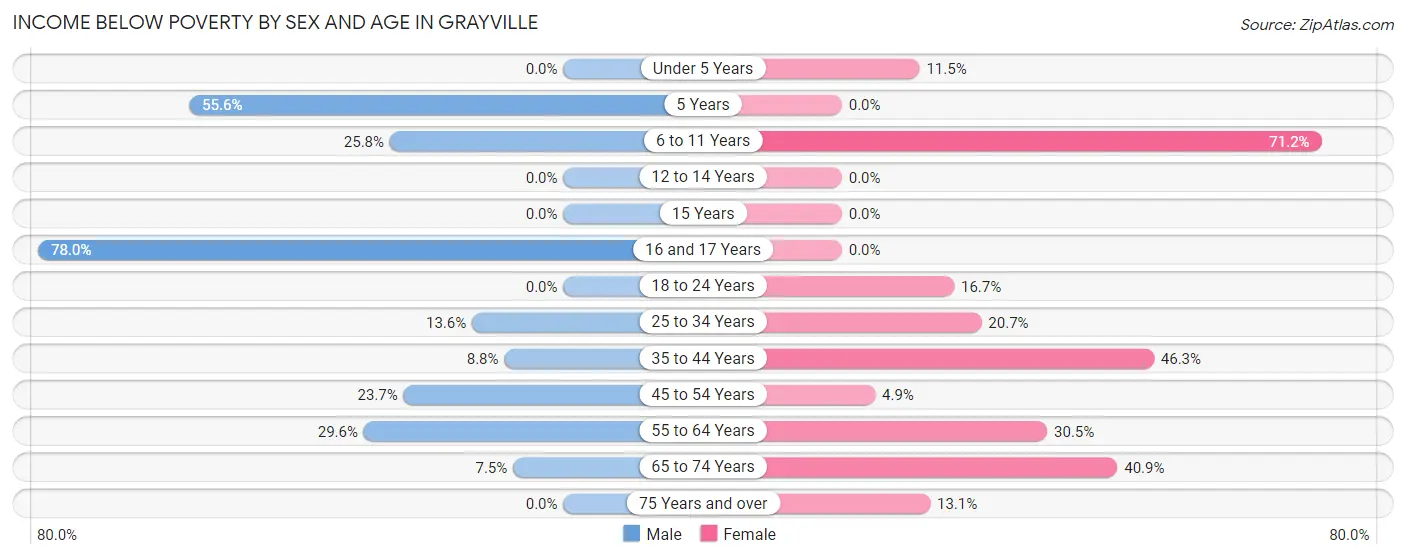
| Age Bracket | Male | Female |
| Under 5 Years | 0 (0.0%) | 3 (11.5%) |
| 5 Years | 5 (55.6%) | 0 (0.0%) |
| 6 to 11 Years | 17 (25.8%) | 94 (71.2%) |
| 12 to 14 Years | 0 (0.0%) | 0 (0.0%) |
| 15 Years | 0 (0.0%) | 0 (0.0%) |
| 16 and 17 Years | 39 (78.0%) | 0 (0.0%) |
| 18 to 24 Years | 0 (0.0%) | 7 (16.7%) |
| 25 to 34 Years | 8 (13.6%) | 17 (20.7%) |
| 35 to 44 Years | 12 (8.8%) | 57 (46.3%) |
| 45 to 54 Years | 14 (23.7%) | 4 (4.9%) |
| 55 to 64 Years | 32 (29.6%) | 25 (30.5%) |
| 65 to 74 Years | 5 (7.5%) | 45 (40.9%) |
| 75 Years and over | 0 (0.0%) | 11 (13.1%) |
| Total | 132 (19.4%) | 263 (32.6%) |
Income Above Poverty by Sex and Age in Grayville
According to the poverty statistics in Grayville, males aged under 5 years and females aged 5 years are the age groups that are most secure financially, with 100.0% of males and 100.0% of females in these age groups living above the poverty line.
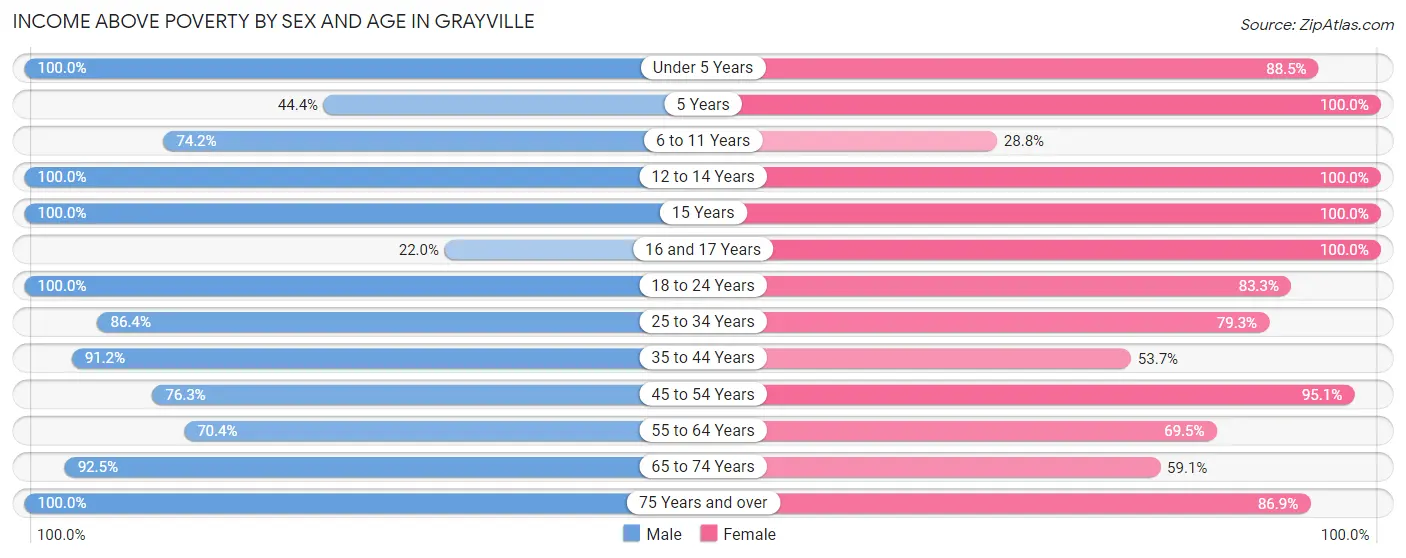
| Age Bracket | Male | Female |
| Under 5 Years | 17 (100.0%) | 23 (88.5%) |
| 5 Years | 4 (44.4%) | 2 (100.0%) |
| 6 to 11 Years | 49 (74.2%) | 38 (28.8%) |
| 12 to 14 Years | 10 (100.0%) | 25 (100.0%) |
| 15 Years | 16 (100.0%) | 4 (100.0%) |
| 16 and 17 Years | 11 (22.0%) | 13 (100.0%) |
| 18 to 24 Years | 59 (100.0%) | 35 (83.3%) |
| 25 to 34 Years | 51 (86.4%) | 65 (79.3%) |
| 35 to 44 Years | 125 (91.2%) | 66 (53.7%) |
| 45 to 54 Years | 45 (76.3%) | 77 (95.1%) |
| 55 to 64 Years | 76 (70.4%) | 57 (69.5%) |
| 65 to 74 Years | 62 (92.5%) | 65 (59.1%) |
| 75 Years and over | 23 (100.0%) | 73 (86.9%) |
| Total | 548 (80.6%) | 543 (67.4%) |
Income Below Poverty Among Married-Couple Families in Grayville
The poverty statistics for married-couple families in Grayville show that 1.5% or 4 of the total 264 families live below the poverty line. Families with 3 or 4 children have the highest poverty rate of 18.2%, comprising of 4 families. On the other hand, families with no children have the lowest poverty rate of 0.0%, which includes 0 families.
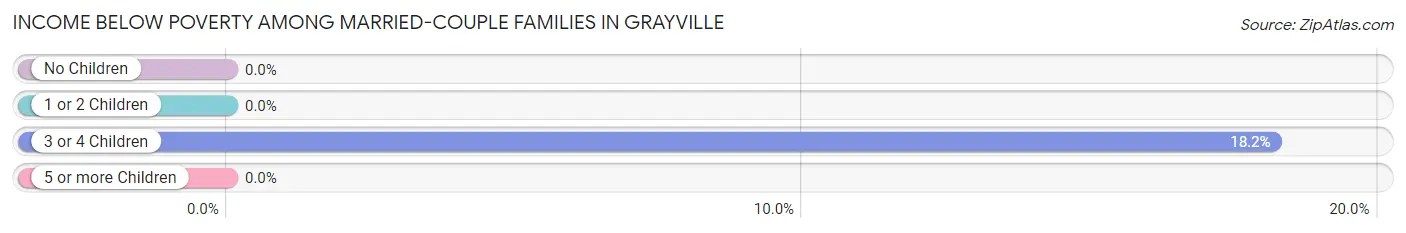
| Children | Above Poverty | Below Poverty |
| No Children | 172 (100.0%) | 0 (0.0%) |
| 1 or 2 Children | 70 (100.0%) | 0 (0.0%) |
| 3 or 4 Children | 18 (81.8%) | 4 (18.2%) |
| 5 or more Children | 0 (0.0%) | 0 (0.0%) |
| Total | 260 (98.5%) | 4 (1.5%) |
Income Below Poverty Among Single-Parent Households in Grayville
According to the poverty data in Grayville, 40.0% or 8 single-father households and 63.4% or 64 single-mother households are living below the poverty line. Among single-father households, those with 3 or 4 children have the highest poverty rate, with 8 households (100.0%) experiencing poverty. Likewise, among single-mother households, those with 1 or 2 children have the highest poverty rate, with 64 households (88.9%) falling below the poverty line.
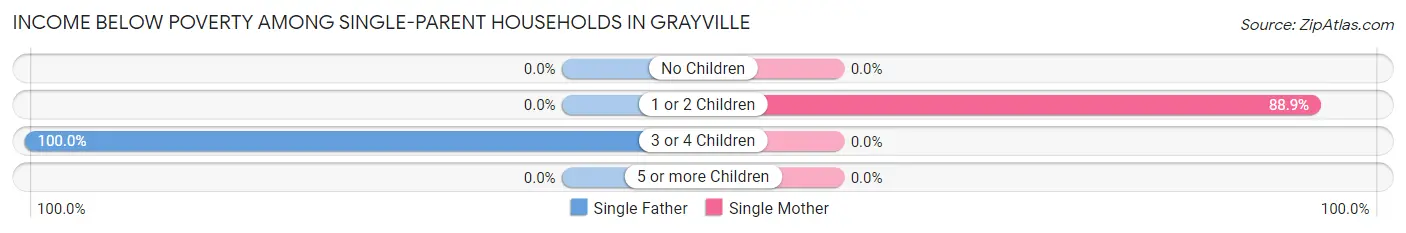
| Children | Single Father | Single Mother |
| No Children | 0 (0.0%) | 0 (0.0%) |
| 1 or 2 Children | 0 (0.0%) | 64 (88.9%) |
| 3 or 4 Children | 8 (100.0%) | 0 (0.0%) |
| 5 or more Children | 0 (0.0%) | 0 (0.0%) |
| Total | 8 (40.0%) | 64 (63.4%) |
Income Below Poverty Among Married-Couple vs Single-Parent Households in Grayville
The poverty data for Grayville shows that 4 of the married-couple family households (1.5%) and 72 of the single-parent households (59.5%) are living below the poverty level. Within the married-couple family households, those with 3 or 4 children have the highest poverty rate, with 4 households (18.2%) falling below the poverty line. Among the single-parent households, those with 1 or 2 children have the highest poverty rate, with 64 household (82.1%) living below poverty.
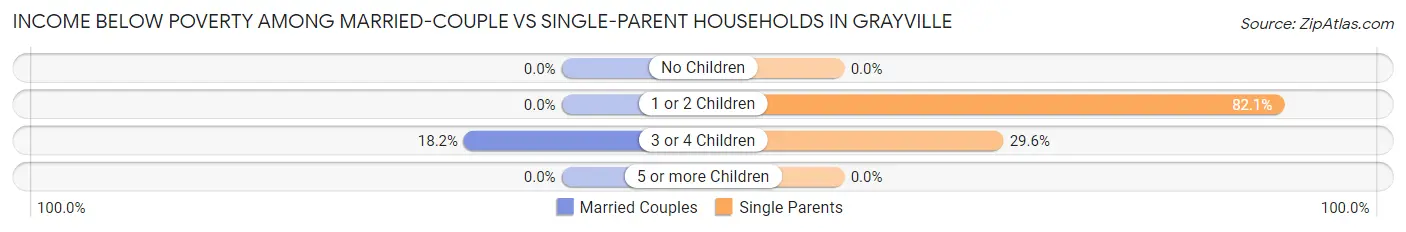
| Children | Married-Couple Families | Single-Parent Households |
| No Children | 0 (0.0%) | 0 (0.0%) |
| 1 or 2 Children | 0 (0.0%) | 64 (82.1%) |
| 3 or 4 Children | 4 (18.2%) | 8 (29.6%) |
| 5 or more Children | 0 (0.0%) | 0 (0.0%) |
| Total | 4 (1.5%) | 72 (59.5%) |
Race in Grayville
The most populous races in Grayville are White / Caucasian (1,467 | 95.1%), Two or more Races (41 | 2.7%), and Black / African American (22 | 1.4%).
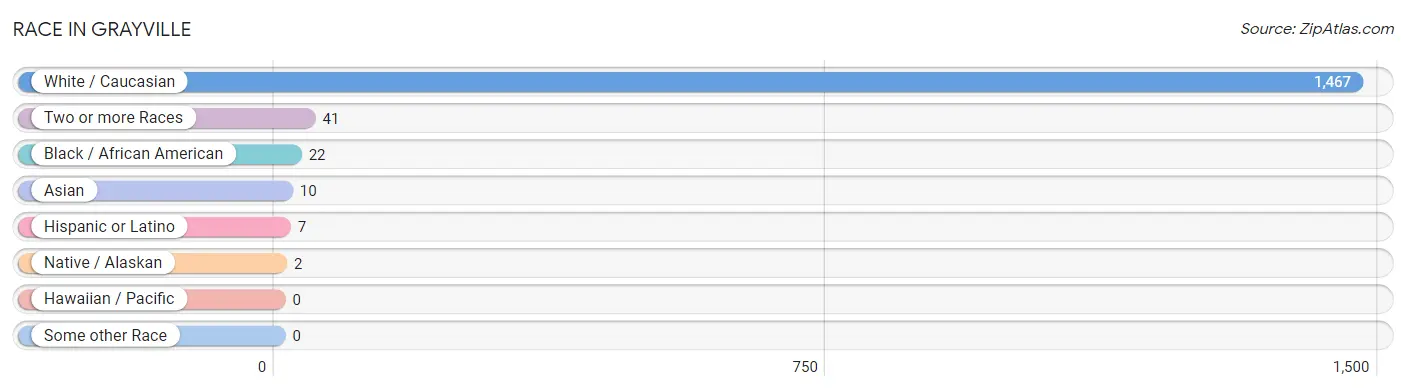
| Race | # Population | % Population |
| Asian | 10 | 0.6% |
| Black / African American | 22 | 1.4% |
| Hawaiian / Pacific | 0 | 0.0% |
| Hispanic or Latino | 7 | 0.4% |
| Native / Alaskan | 2 | 0.1% |
| White / Caucasian | 1,467 | 95.1% |
| Two or more Races | 41 | 2.7% |
| Some other Race | 0 | 0.0% |
| Total | 1,542 | 100.0% |
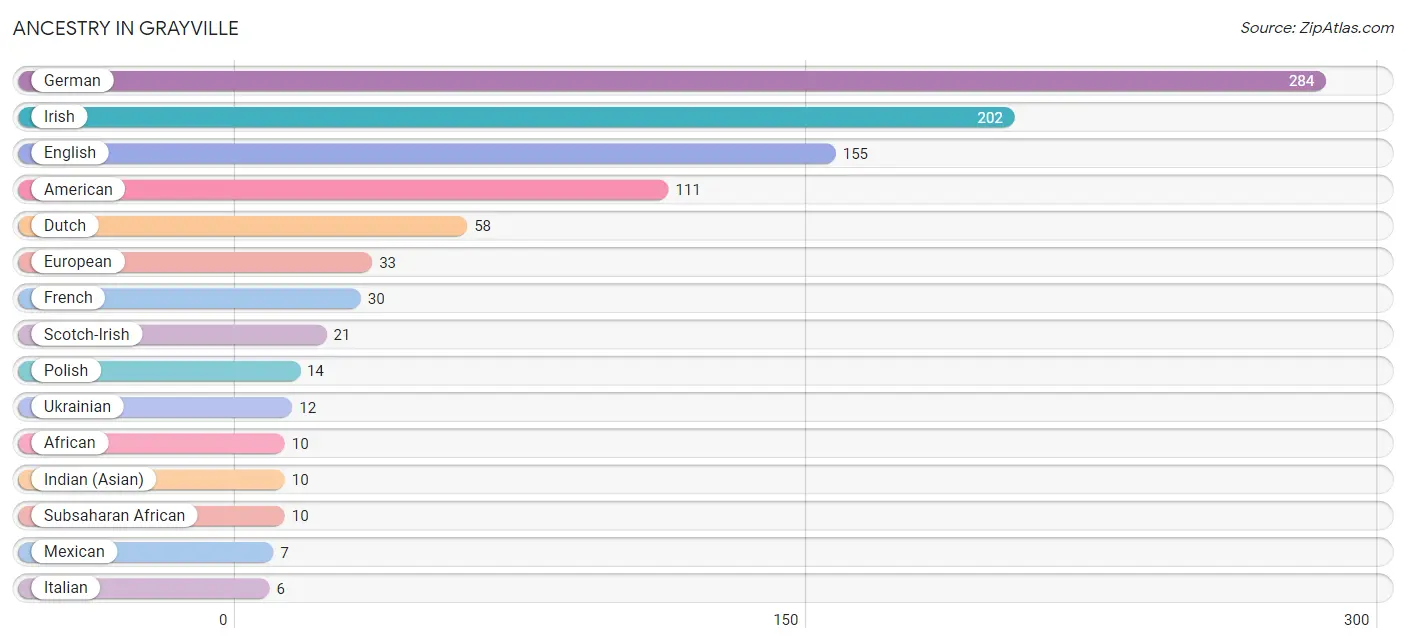
Ancestry in Grayville
The most populous ancestries reported in Grayville are German (284 | 18.4%), Irish (202 | 13.1%), English (155 | 10.1%), American (111 | 7.2%), and Dutch (58 | 3.8%), together accounting for 52.5% of all Grayville residents.
| Ancestry | # Population | % Population |
| African | 10 | 0.6% |
| American | 111 | 7.2% |
| Blackfeet | 5 | 0.3% |
| Brazilian | 1 | 0.1% |
| Burmese | 3 | 0.2% |
| Cherokee | 2 | 0.1% |
| Creek | 2 | 0.1% |
| Dutch | 58 | 3.8% |
| English | 155 | 10.1% |
| European | 33 | 2.1% |
| French | 30 | 1.9% |
| French Canadian | 4 | 0.3% |
| German | 284 | 18.4% |
| Indian (Asian) | 10 | 0.6% |
| Irish | 202 | 13.1% |
| Italian | 6 | 0.4% |
| Mexican | 7 | 0.4% |
| Polish | 14 | 0.9% |
| Scotch-Irish | 21 | 1.4% |
| Scottish | 2 | 0.1% |
| Subsaharan African | 10 | 0.6% |
| Swiss | 5 | 0.3% |
| Ukrainian | 12 | 0.8% | View All 23 Rows |
Immigrants in Grayville
The most numerous immigrant groups reported in Grayville came from Africa (10 | 0.6%), Asia (10 | 0.6%), China (10 | 0.6%), Eastern Africa (10 | 0.6%), and Eastern Asia (10 | 0.6%), together accounting for 3.3% of all Grayville residents.
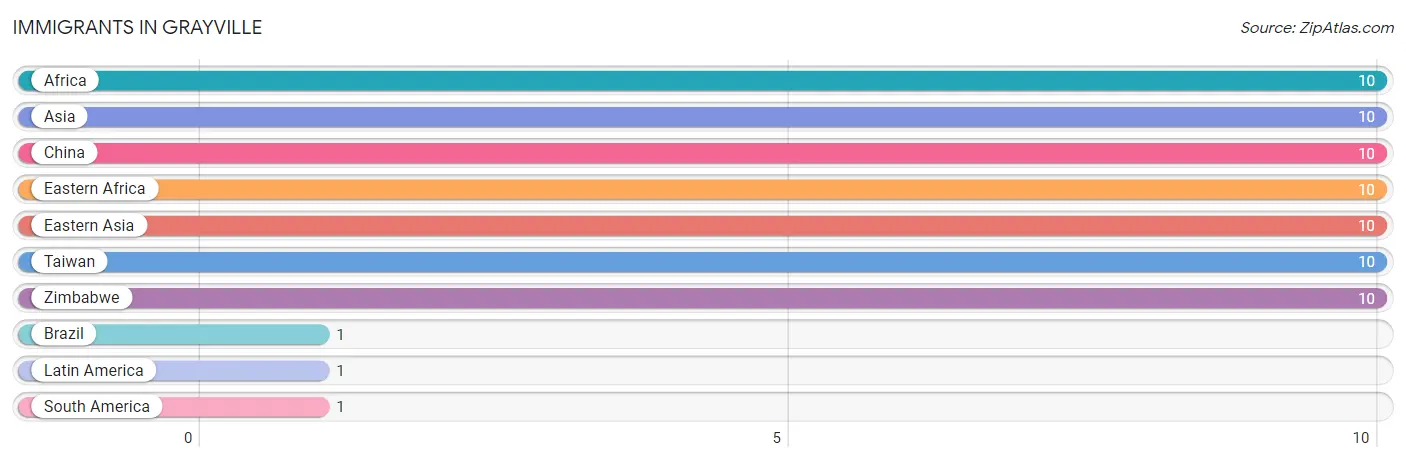
| Immigration Origin | # Population | % Population |
| Africa | 10 | 0.6% |
| Asia | 10 | 0.6% |
| Brazil | 1 | 0.1% |
| China | 10 | 0.6% |
| Eastern Africa | 10 | 0.6% |
| Eastern Asia | 10 | 0.6% |
| Latin America | 1 | 0.1% |
| South America | 1 | 0.1% |
| Taiwan | 10 | 0.6% |
| Zimbabwe | 10 | 0.6% | View All 10 Rows |
Sex and Age in Grayville
Sex and Age in Grayville
The most populous age groups in Grayville are 15 to 19 Years (94 | 13.0%) for men and 40 to 44 Years (91 | 11.1%) for women.
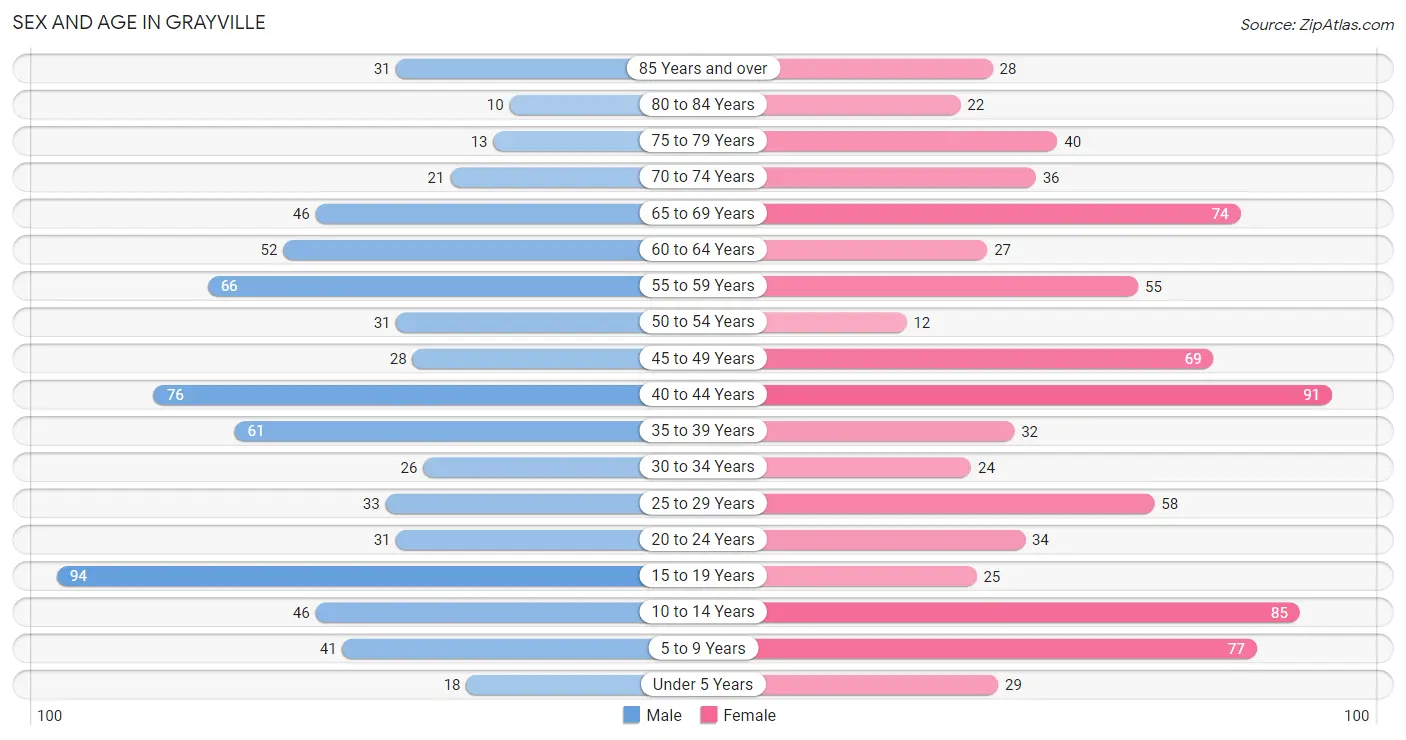
| Age Bracket | Male | Female |
| Under 5 Years | 18 (2.5%) | 29 (3.5%) |
| 5 to 9 Years | 41 (5.7%) | 77 (9.4%) |
| 10 to 14 Years | 46 (6.4%) | 85 (10.4%) |
| 15 to 19 Years | 94 (13.0%) | 25 (3.1%) |
| 20 to 24 Years | 31 (4.3%) | 34 (4.2%) |
| 25 to 29 Years | 33 (4.6%) | 58 (7.1%) |
| 30 to 34 Years | 26 (3.6%) | 24 (2.9%) |
| 35 to 39 Years | 61 (8.4%) | 32 (3.9%) |
| 40 to 44 Years | 76 (10.5%) | 91 (11.1%) |
| 45 to 49 Years | 28 (3.9%) | 69 (8.4%) |
| 50 to 54 Years | 31 (4.3%) | 12 (1.5%) |
| 55 to 59 Years | 66 (9.1%) | 55 (6.7%) |
| 60 to 64 Years | 52 (7.2%) | 27 (3.3%) |
| 65 to 69 Years | 46 (6.4%) | 74 (9.0%) |
| 70 to 74 Years | 21 (2.9%) | 36 (4.4%) |
| 75 to 79 Years | 13 (1.8%) | 40 (4.9%) |
| 80 to 84 Years | 10 (1.4%) | 22 (2.7%) |
| 85 Years and over | 31 (4.3%) | 28 (3.4%) |
| Total | 724 (100.0%) | 818 (100.0%) |
Families and Households in Grayville
Median Family Size in Grayville
The median family size in Grayville is 2.90 persons per family, with single male/father families (20 | 5.2%) accounting for the largest median family size of 3.65 persons per family. On the other hand, married-couple families (264 | 68.6%) represent the smallest median family size with 2.82 persons per family.
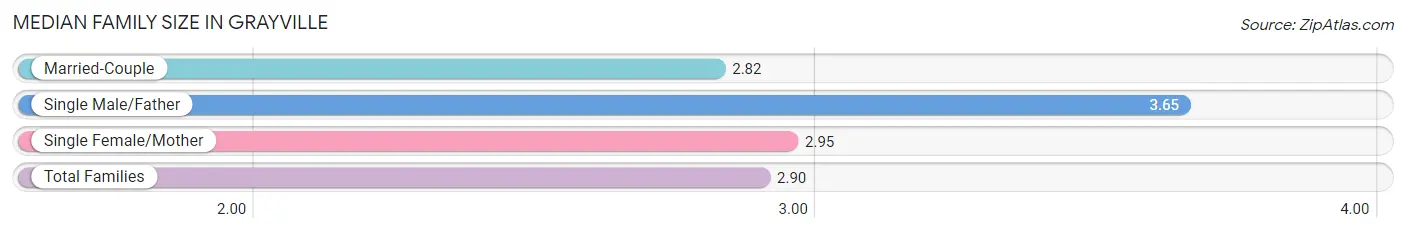
| Family Type | # Families | Family Size |
| Married-Couple | 264 (68.6%) | 2.82 |
| Single Male/Father | 20 (5.2%) | 3.65 |
| Single Female/Mother | 101 (26.2%) | 2.95 |
| Total Families | 385 (100.0%) | 2.90 |
Median Household Size in Grayville
The median household size in Grayville is 2.33 persons per household, with single male/father households (20 | 3.1%) accounting for the largest median household size of 4.25 persons per household. non-family households (258 | 40.1%) represent the smallest median household size with 1.19 persons per household.
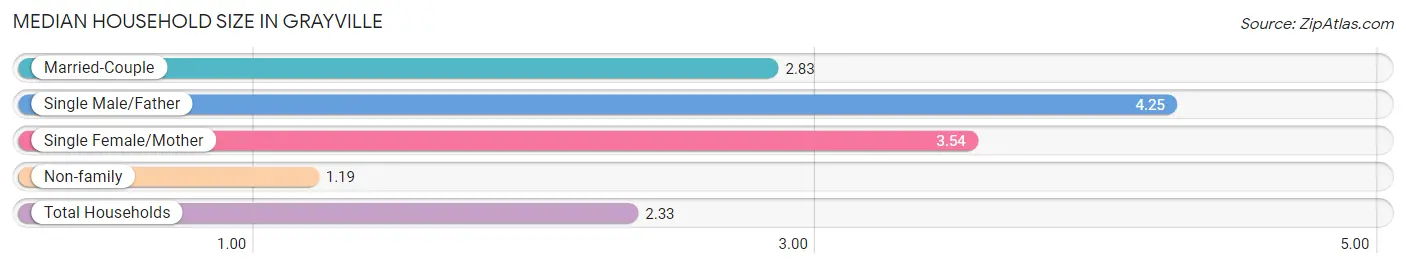
| Household Type | # Households | Household Size |
| Married-Couple | 264 (41.1%) | 2.83 |
| Single Male/Father | 20 (3.1%) | 4.25 |
| Single Female/Mother | 101 (15.7%) | 3.54 |
| Non-family | 258 (40.1%) | 1.19 |
| Total Households | 643 (100.0%) | 2.33 |
Household Size by Marriage Status in Grayville
Out of a total of 643 households in Grayville, 385 (59.9%) are family households, while 258 (40.1%) are nonfamily households. The most numerous type of family households are 2-person households, comprising 161, and the most common type of nonfamily households are 1-person households, comprising 211.
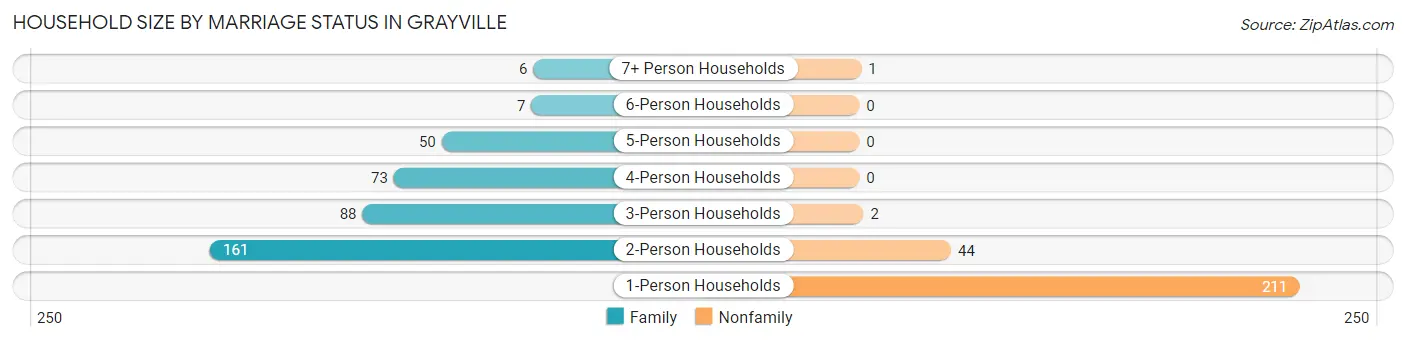
| Household Size | Family Households | Nonfamily Households |
| 1-Person Households | - | 211 (32.8%) |
| 2-Person Households | 161 (25.0%) | 44 (6.8%) |
| 3-Person Households | 88 (13.7%) | 2 (0.3%) |
| 4-Person Households | 73 (11.4%) | 0 (0.0%) |
| 5-Person Households | 50 (7.8%) | 0 (0.0%) |
| 6-Person Households | 7 (1.1%) | 0 (0.0%) |
| 7+ Person Households | 6 (0.9%) | 1 (0.2%) |
| Total | 385 (59.9%) | 258 (40.1%) |
Female Fertility in Grayville
Fertility by Age in Grayville
Average fertility rate in Grayville is 21.0 births per 1,000 women. Women in the age bracket of 20 to 34 years have the highest fertility rate with 34.0 births per 1,000 women. Women in the age bracket of 20 to 34 years acount for 57.1% of all women with births.
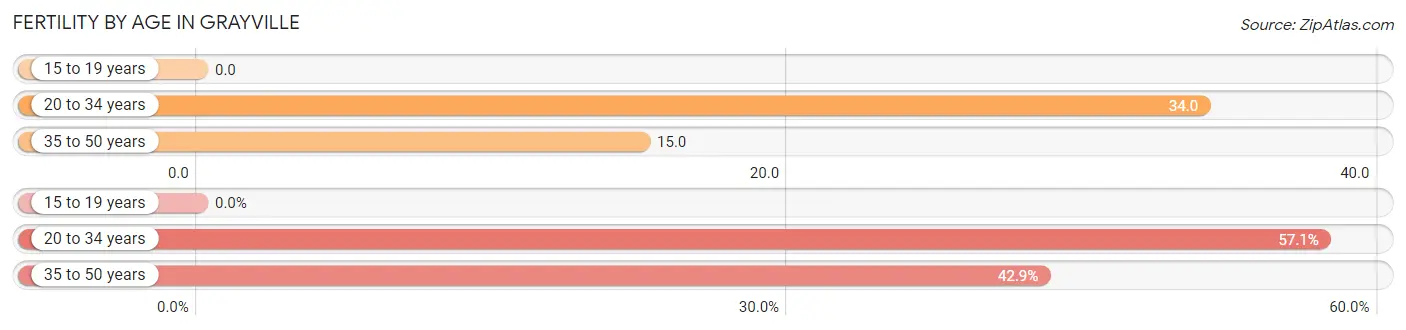
| Age Bracket | Women with Births | Births / 1,000 Women |
| 15 to 19 years | 0 (0.0%) | 0.0 |
| 20 to 34 years | 4 (57.1%) | 34.0 |
| 35 to 50 years | 3 (42.9%) | 15.0 |
| Total | 7 (100.0%) | 21.0 |
Fertility by Age by Marriage Status in Grayville
57.1% of women with births (7) in Grayville are married. The highest percentage of unmarried women with births falls into 35 to 50 years age bracket with 100.0% of them unmarried at the time of birth, while the lowest percentage of unmarried women with births belong to 20 to 34 years age bracket with 0.0% of them unmarried.
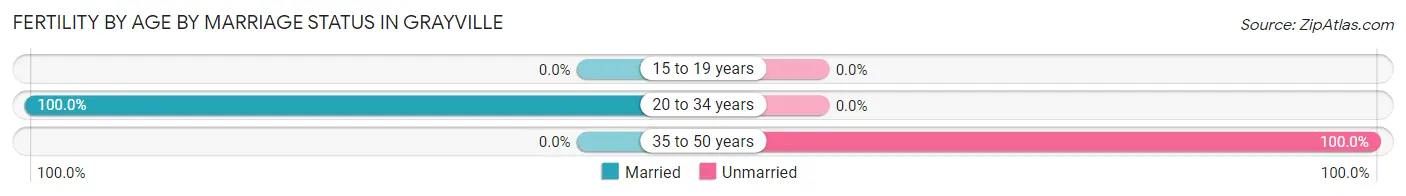
| Age Bracket | Married | Unmarried |
| 15 to 19 years | 0 (0.0%) | 0 (0.0%) |
| 20 to 34 years | 4 (100.0%) | 0 (0.0%) |
| 35 to 50 years | 0 (0.0%) | 3 (100.0%) |
| Total | 4 (57.1%) | 3 (42.9%) |
Fertility by Education in Grayville
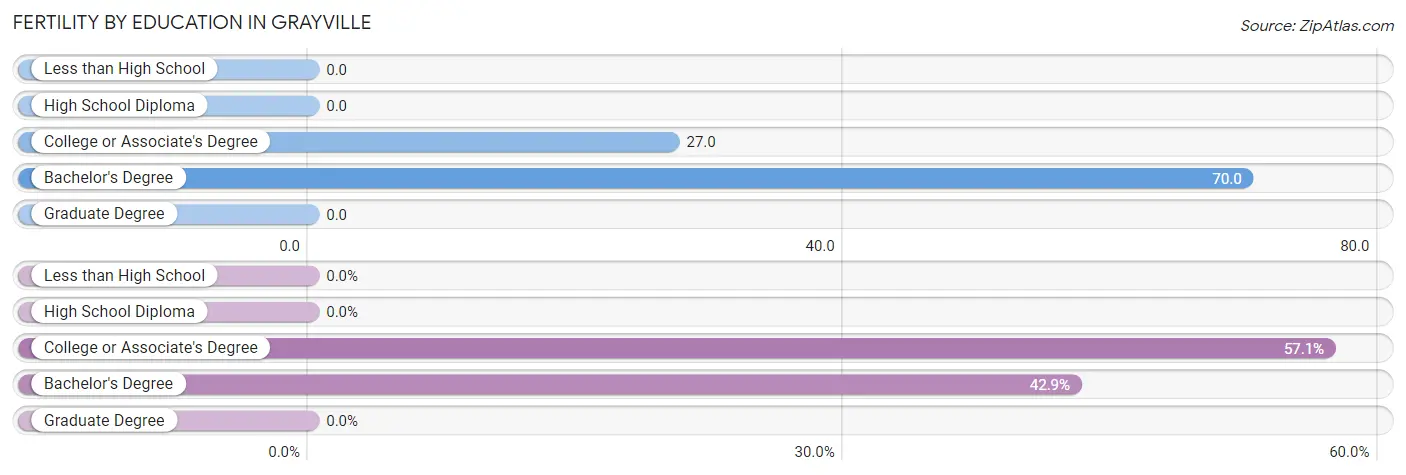
| Educational Attainment | Women with Births | Births / 1,000 Women |
| Less than High School | 0 (0.0%) | 0.0 |
| High School Diploma | 0 (0.0%) | 0.0 |
| College or Associate's Degree | 4 (57.1%) | 27.0 |
| Bachelor's Degree | 3 (42.9%) | 70.0 |
| Graduate Degree | 0 (0.0%) | 0.0 |
| Total | 7 (100.0%) | 21.0 |
Fertility by Education by Marriage Status in Grayville
42.9% of women with births in Grayville are unmarried. Women with the educational attainment of college or associate's degree are most likely to be married with 100.0% of them married at childbirth, while women with the educational attainment of bachelor's degree are least likely to be married with 100.0% of them unmarried at childbirth.
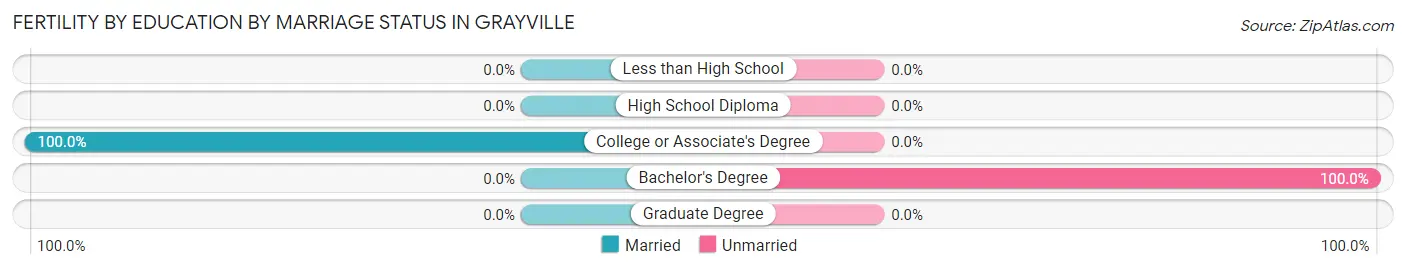
| Educational Attainment | Married | Unmarried |
| Less than High School | 0 (0.0%) | 0 (0.0%) |
| High School Diploma | 0 (0.0%) | 0 (0.0%) |
| College or Associate's Degree | 4 (100.0%) | 0 (0.0%) |
| Bachelor's Degree | 0 (0.0%) | 3 (100.0%) |
| Graduate Degree | 0 (0.0%) | 0 (0.0%) |
| Total | 4 (57.1%) | 3 (42.9%) |
Employment Characteristics in Grayville
Employment by Class of Employer in Grayville
Among the 710 employed individuals in Grayville, private company employees (593 | 83.5%), self-employed (not incorporated) (46 | 6.5%), and not-for-profit organizations (27 | 3.8%) make up the most common classes of employment.
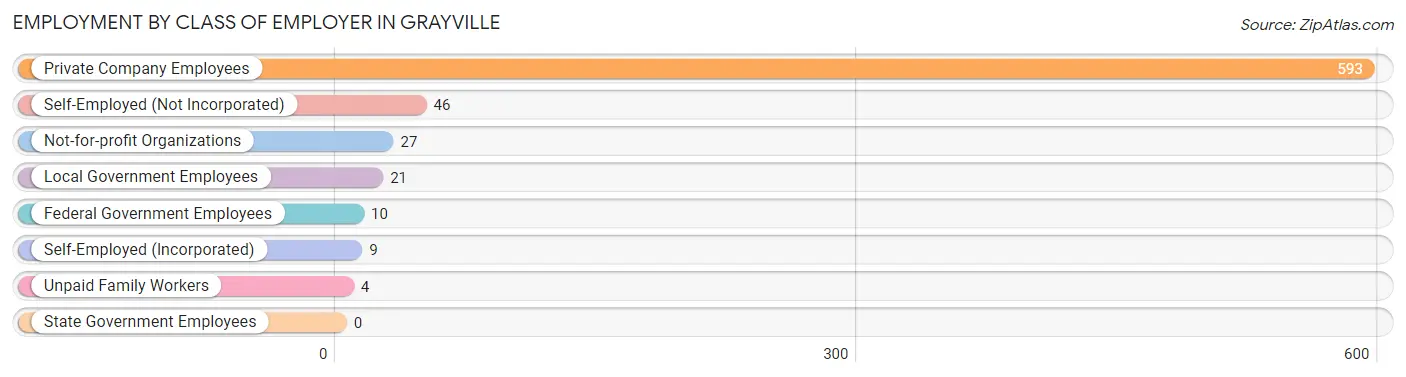
| Employer Class | # Employees | % Employees |
| Private Company Employees | 593 | 83.5% |
| Self-Employed (Incorporated) | 9 | 1.3% |
| Self-Employed (Not Incorporated) | 46 | 6.5% |
| Not-for-profit Organizations | 27 | 3.8% |
| Local Government Employees | 21 | 3.0% |
| State Government Employees | 0 | 0.0% |
| Federal Government Employees | 10 | 1.4% |
| Unpaid Family Workers | 4 | 0.6% |
| Total | 710 | 100.0% |
Employment Status by Age in Grayville
According to the labor force statistics for Grayville, out of the total population over 16 years of age (1,226), 62.2% or 763 individuals are in the labor force, with 5.4% or 41 of them unemployed. The age group with the highest labor force participation rate is 45 to 54 years, with 91.4% or 128 individuals in the labor force. Within the labor force, the 75 years and over age range has the highest percentage of unemployed individuals, with 100.0% or 11 of them being unemployed.
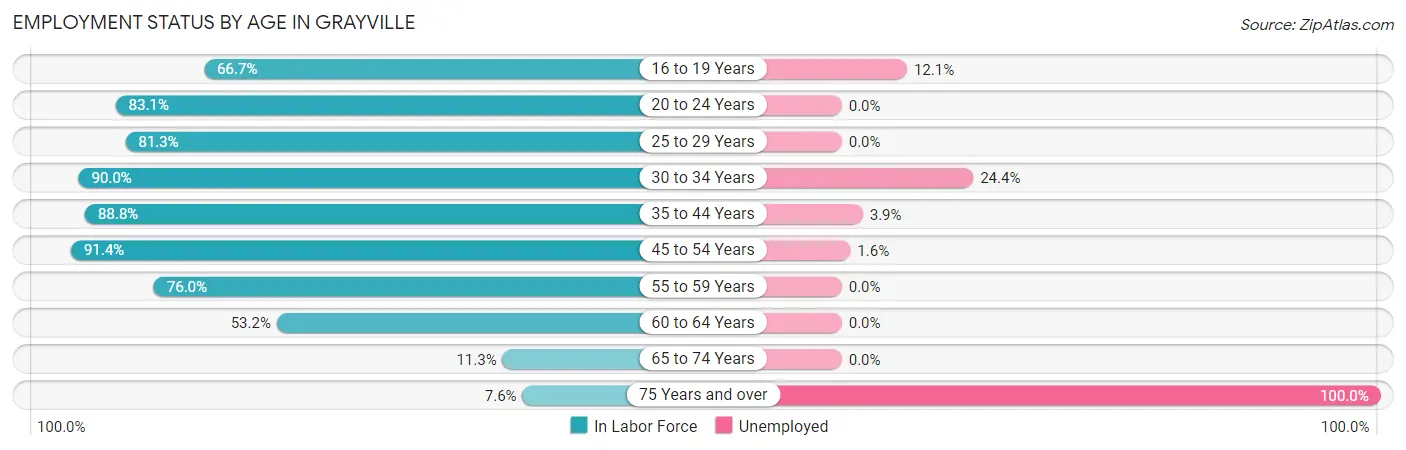
| Age Bracket | In Labor Force | Unemployed |
| 16 to 19 Years | 66 (66.7%) | 8 (12.1%) |
| 20 to 24 Years | 54 (83.1%) | 0 (0.0%) |
| 25 to 29 Years | 74 (81.3%) | 0 (0.0%) |
| 30 to 34 Years | 45 (90.0%) | 11 (24.4%) |
| 35 to 44 Years | 231 (88.8%) | 9 (3.9%) |
| 45 to 54 Years | 128 (91.4%) | 2 (1.6%) |
| 55 to 59 Years | 92 (76.0%) | 0 (0.0%) |
| 60 to 64 Years | 42 (53.2%) | 0 (0.0%) |
| 65 to 74 Years | 20 (11.3%) | 0 (0.0%) |
| 75 Years and over | 11 (7.6%) | 11 (100.0%) |
| Total | 763 (62.2%) | 41 (5.4%) |
Employment Status by Educational Attainment in Grayville
According to labor force statistics for Grayville, 82.6% of individuals (612) out of the total population between 25 and 64 years of age (741) are in the labor force, with 3.6% or 22 of them being unemployed. The group with the highest labor force participation rate are those with the educational attainment of college / associate degree, with 88.8% or 278 individuals in the labor force. Within the labor force, individuals with college / associate degree education have the highest percentage of unemployment, with 6.1% or 17 of them being unemployed.
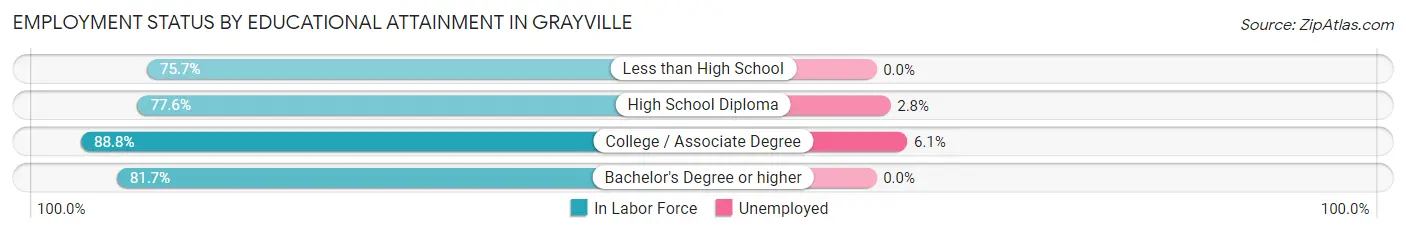
| Educational Attainment | In Labor Force | Unemployed |
| Less than High School | 78 (75.7%) | 0 (0.0%) |
| High School Diploma | 180 (77.6%) | 6 (2.8%) |
| College / Associate Degree | 278 (88.8%) | 19 (6.1%) |
| Bachelor's Degree or higher | 76 (81.7%) | 0 (0.0%) |
| Total | 612 (82.6%) | 27 (3.6%) |
Employment Occupations by Sex in Grayville
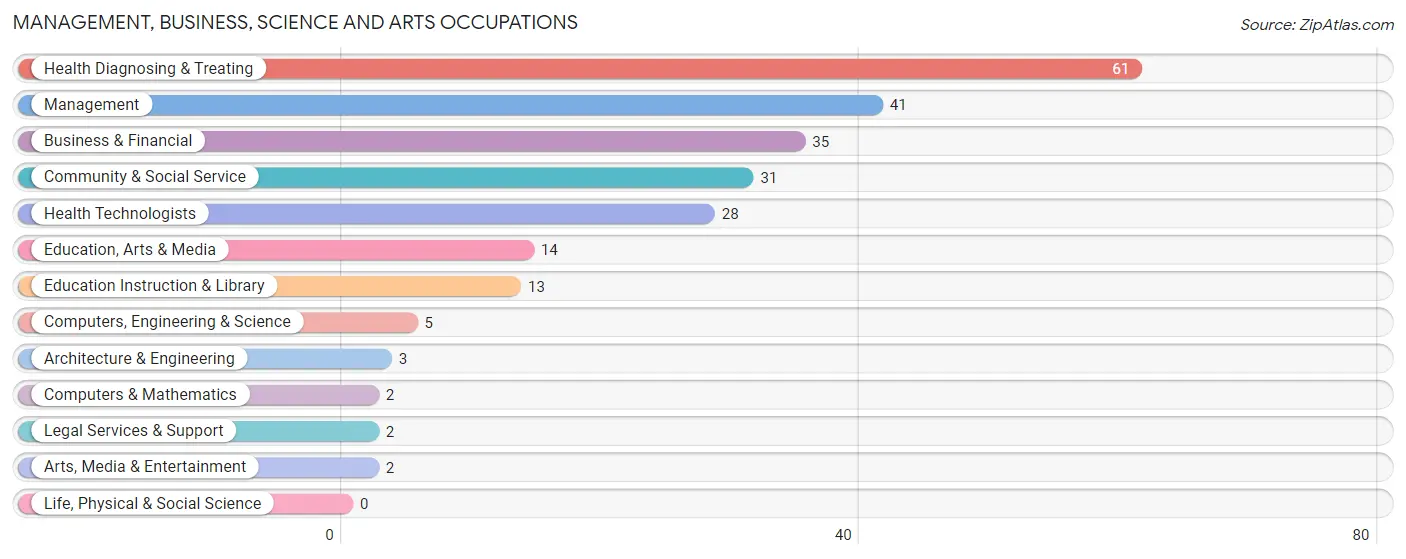
Management, Business, Science and Arts Occupations
The most common Management, Business, Science and Arts occupations in Grayville are Health Diagnosing & Treating (61 | 8.5%), Management (41 | 5.7%), Business & Financial (35 | 4.9%), Community & Social Service (31 | 4.3%), and Health Technologists (28 | 3.9%).
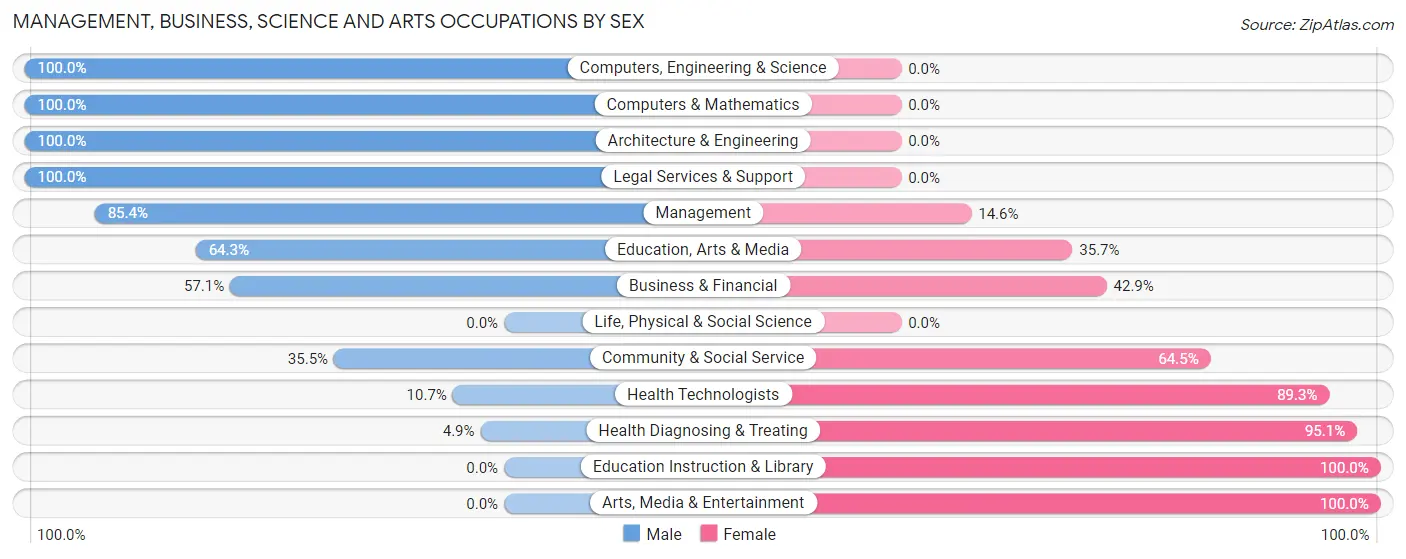
Management, Business, Science and Arts Occupations by Sex
Within the Management, Business, Science and Arts occupations in Grayville, the most male-oriented occupations are Computers, Engineering & Science (100.0%), Computers & Mathematics (100.0%), and Architecture & Engineering (100.0%), while the most female-oriented occupations are Education Instruction & Library (100.0%), Arts, Media & Entertainment (100.0%), and Health Diagnosing & Treating (95.1%).
| Occupation | Male | Female |
| Management | 35 (85.4%) | 6 (14.6%) |
| Business & Financial | 20 (57.1%) | 15 (42.9%) |
| Computers, Engineering & Science | 5 (100.0%) | 0 (0.0%) |
| Computers & Mathematics | 2 (100.0%) | 0 (0.0%) |
| Architecture & Engineering | 3 (100.0%) | 0 (0.0%) |
| Life, Physical & Social Science | 0 (0.0%) | 0 (0.0%) |
| Community & Social Service | 11 (35.5%) | 20 (64.5%) |
| Education, Arts & Media | 9 (64.3%) | 5 (35.7%) |
| Legal Services & Support | 2 (100.0%) | 0 (0.0%) |
| Education Instruction & Library | 0 (0.0%) | 13 (100.0%) |
| Arts, Media & Entertainment | 0 (0.0%) | 2 (100.0%) |
| Health Diagnosing & Treating | 3 (4.9%) | 58 (95.1%) |
| Health Technologists | 3 (10.7%) | 25 (89.3%) |
| Total (Category) | 74 (42.8%) | 99 (57.2%) |
| Total (Overall) | 392 (54.3%) | 330 (45.7%) |
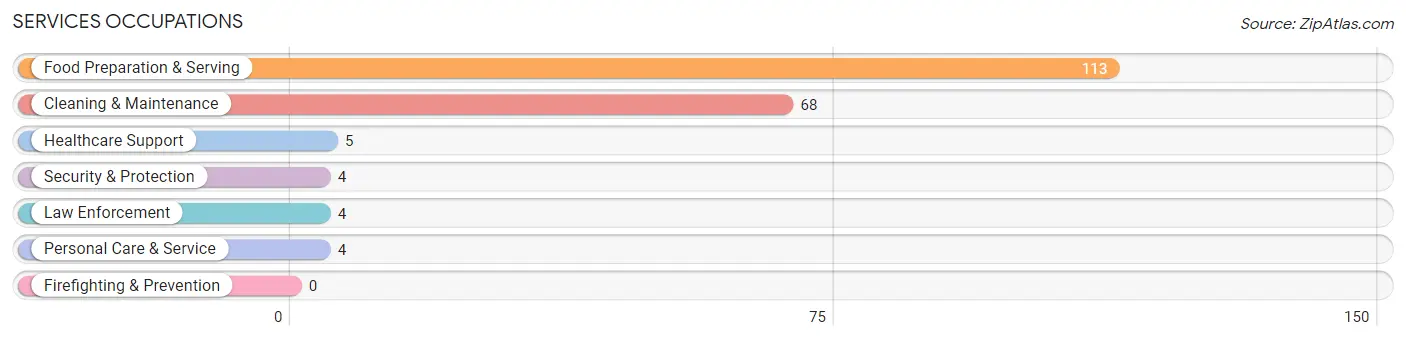
Services Occupations
The most common Services occupations in Grayville are Food Preparation & Serving (113 | 15.7%), Cleaning & Maintenance (68 | 9.4%), Healthcare Support (5 | 0.7%), Security & Protection (4 | 0.5%), and Law Enforcement (4 | 0.5%).
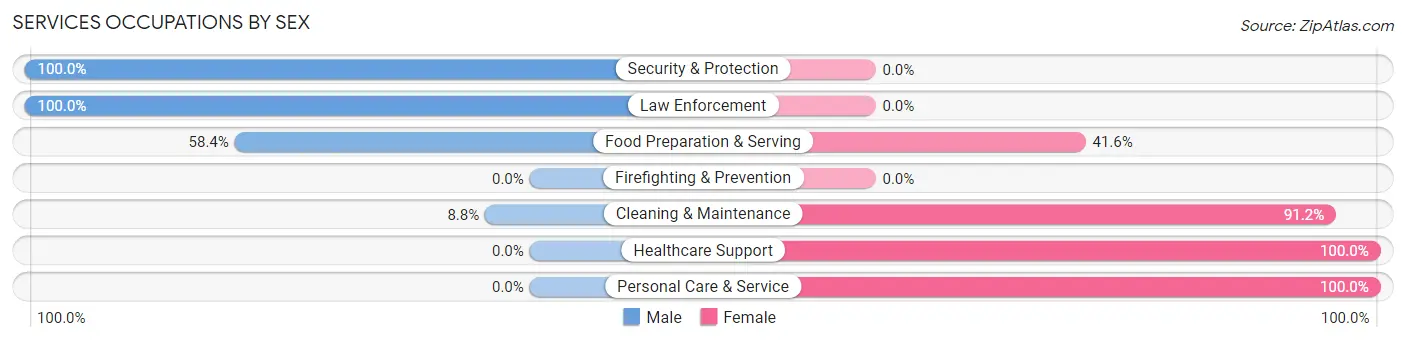
Services Occupations by Sex
Within the Services occupations in Grayville, the most male-oriented occupations are Security & Protection (100.0%), Law Enforcement (100.0%), and Food Preparation & Serving (58.4%), while the most female-oriented occupations are Healthcare Support (100.0%), Personal Care & Service (100.0%), and Cleaning & Maintenance (91.2%).
| Occupation | Male | Female |
| Healthcare Support | 0 (0.0%) | 5 (100.0%) |
| Security & Protection | 4 (100.0%) | 0 (0.0%) |
| Firefighting & Prevention | 0 (0.0%) | 0 (0.0%) |
| Law Enforcement | 4 (100.0%) | 0 (0.0%) |
| Food Preparation & Serving | 66 (58.4%) | 47 (41.6%) |
| Cleaning & Maintenance | 6 (8.8%) | 62 (91.2%) |
| Personal Care & Service | 0 (0.0%) | 4 (100.0%) |
| Total (Category) | 76 (39.2%) | 118 (60.8%) |
| Total (Overall) | 392 (54.3%) | 330 (45.7%) |
Sales and Office Occupations
The most common Sales and Office occupations in Grayville are Sales & Related (69 | 9.6%), and Office & Administration (41 | 5.7%).

Sales and Office Occupations by Sex
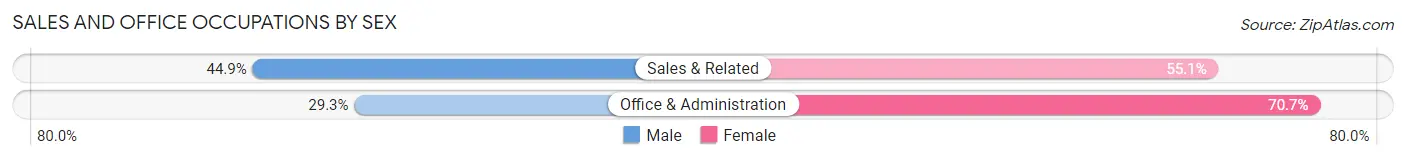
| Occupation | Male | Female |
| Sales & Related | 31 (44.9%) | 38 (55.1%) |
| Office & Administration | 12 (29.3%) | 29 (70.7%) |
| Total (Category) | 43 (39.1%) | 67 (60.9%) |
| Total (Overall) | 392 (54.3%) | 330 (45.7%) |
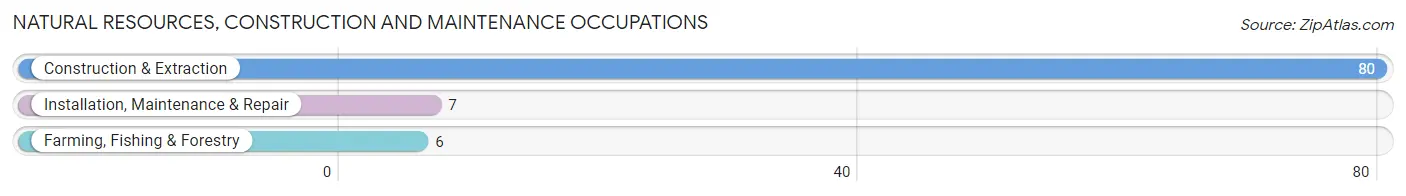
Natural Resources, Construction and Maintenance Occupations
The most common Natural Resources, Construction and Maintenance occupations in Grayville are Construction & Extraction (80 | 11.1%), Installation, Maintenance & Repair (7 | 1.0%), and Farming, Fishing & Forestry (6 | 0.8%).
Natural Resources, Construction and Maintenance Occupations by Sex
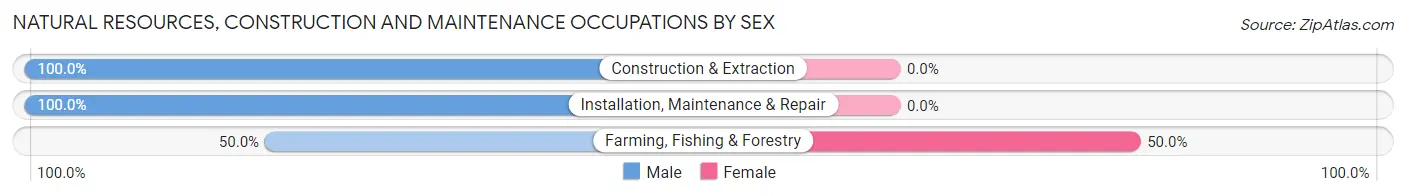
| Occupation | Male | Female |
| Farming, Fishing & Forestry | 3 (50.0%) | 3 (50.0%) |
| Construction & Extraction | 80 (100.0%) | 0 (0.0%) |
| Installation, Maintenance & Repair | 7 (100.0%) | 0 (0.0%) |
| Total (Category) | 90 (96.8%) | 3 (3.2%) |
| Total (Overall) | 392 (54.3%) | 330 (45.7%) |
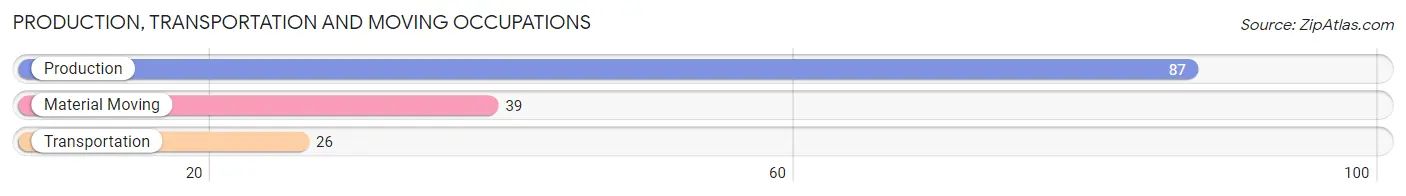
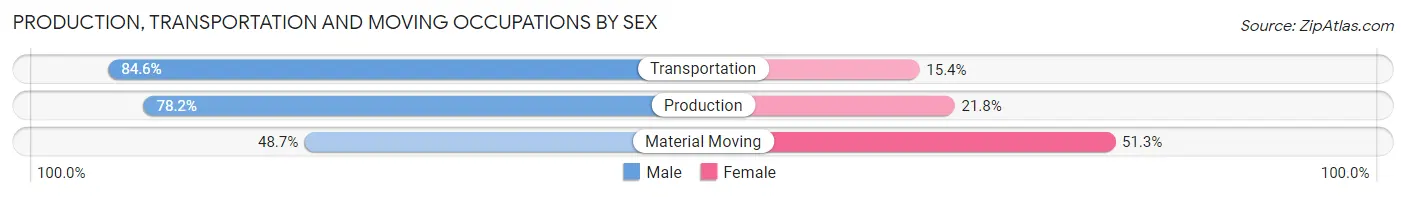
Production, Transportation and Moving Occupations
The most common Production, Transportation and Moving occupations in Grayville are Production (87 | 12.0%), Material Moving (39 | 5.4%), and Transportation (26 | 3.6%).
Production, Transportation and Moving Occupations by Sex
| Occupation | Male | Female |
| Production | 68 (78.2%) | 19 (21.8%) |
| Transportation | 22 (84.6%) | 4 (15.4%) |
| Material Moving | 19 (48.7%) | 20 (51.3%) |
| Total (Category) | 109 (71.7%) | 43 (28.3%) |
| Total (Overall) | 392 (54.3%) | 330 (45.7%) |
Employment Industries by Sex in Grayville
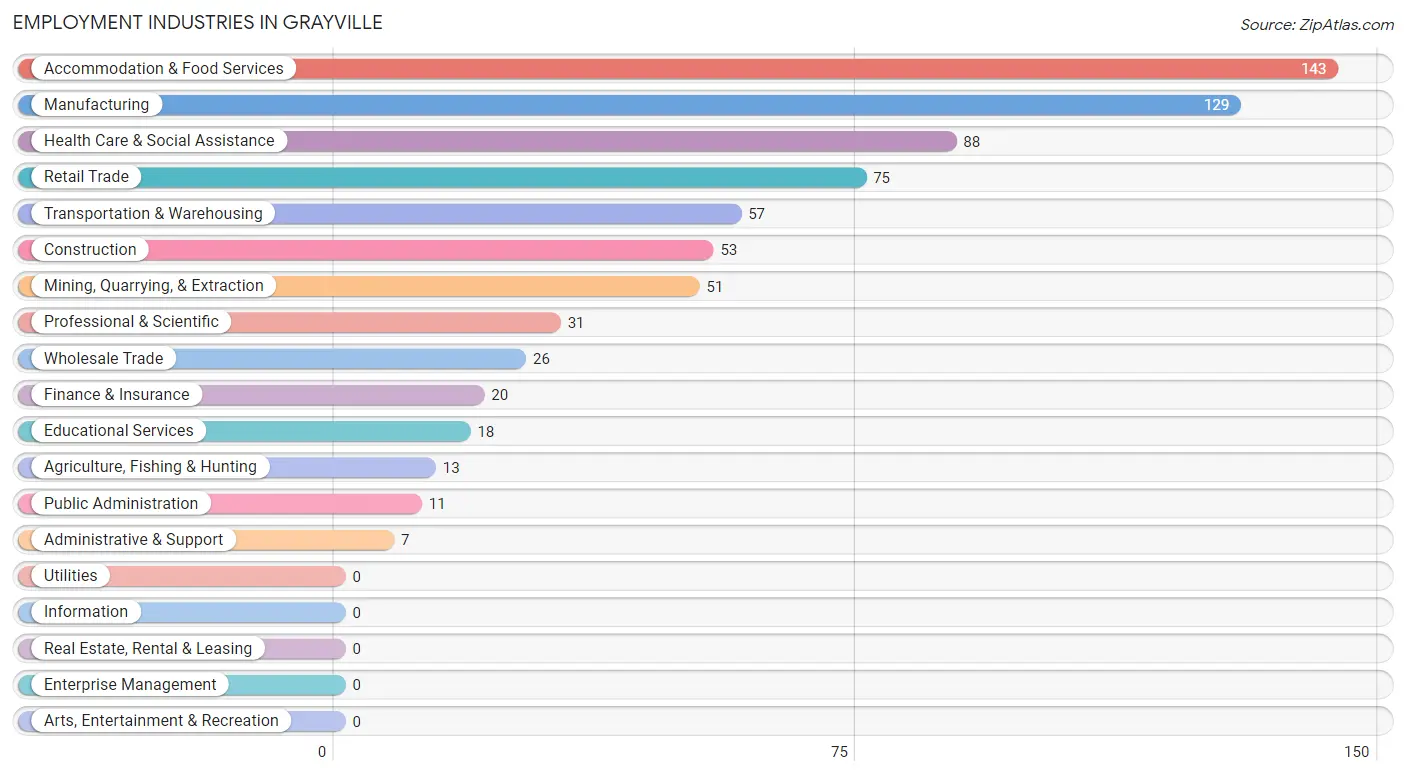
Employment Industries in Grayville
The major employment industries in Grayville include Accommodation & Food Services (143 | 19.8%), Manufacturing (129 | 17.9%), Health Care & Social Assistance (88 | 12.2%), Retail Trade (75 | 10.4%), and Transportation & Warehousing (57 | 7.9%).
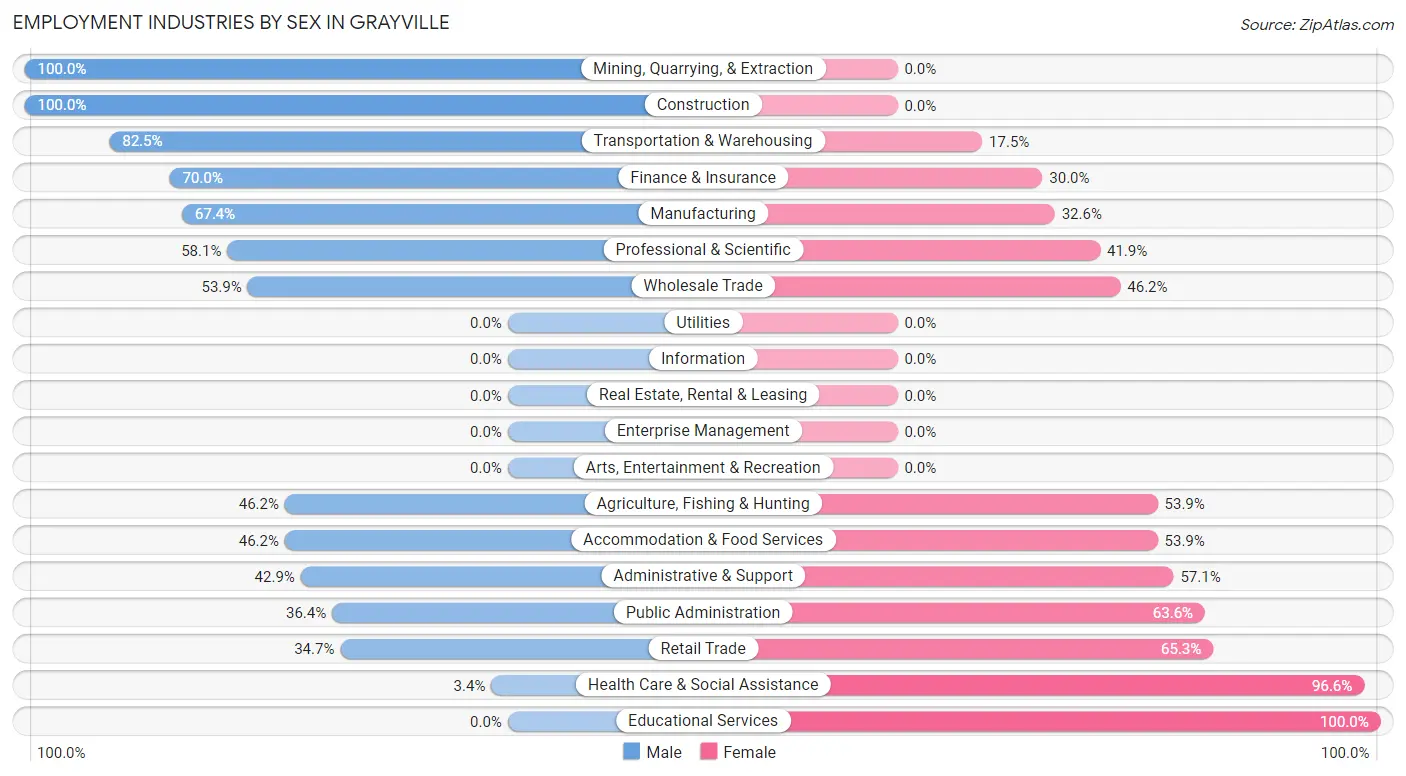
Employment Industries by Sex in Grayville
The Grayville industries that see more men than women are Mining, Quarrying, & Extraction (100.0%), Construction (100.0%), and Transportation & Warehousing (82.5%), whereas the industries that tend to have a higher number of women are Educational Services (100.0%), Health Care & Social Assistance (96.6%), and Retail Trade (65.3%).
| Industry | Male | Female |
| Agriculture, Fishing & Hunting | 6 (46.2%) | 7 (53.8%) |
| Mining, Quarrying, & Extraction | 51 (100.0%) | 0 (0.0%) |
| Construction | 53 (100.0%) | 0 (0.0%) |
| Manufacturing | 87 (67.4%) | 42 (32.6%) |
| Wholesale Trade | 14 (53.8%) | 12 (46.2%) |
| Retail Trade | 26 (34.7%) | 49 (65.3%) |
| Transportation & Warehousing | 47 (82.5%) | 10 (17.5%) |
| Utilities | 0 (0.0%) | 0 (0.0%) |
| Information | 0 (0.0%) | 0 (0.0%) |
| Finance & Insurance | 14 (70.0%) | 6 (30.0%) |
| Real Estate, Rental & Leasing | 0 (0.0%) | 0 (0.0%) |
| Professional & Scientific | 18 (58.1%) | 13 (41.9%) |
| Enterprise Management | 0 (0.0%) | 0 (0.0%) |
| Administrative & Support | 3 (42.9%) | 4 (57.1%) |
| Educational Services | 0 (0.0%) | 18 (100.0%) |
| Health Care & Social Assistance | 3 (3.4%) | 85 (96.6%) |
| Arts, Entertainment & Recreation | 0 (0.0%) | 0 (0.0%) |
| Accommodation & Food Services | 66 (46.2%) | 77 (53.8%) |
| Public Administration | 4 (36.4%) | 7 (63.6%) |
| Total | 392 (54.3%) | 330 (45.7%) |
Education in Grayville
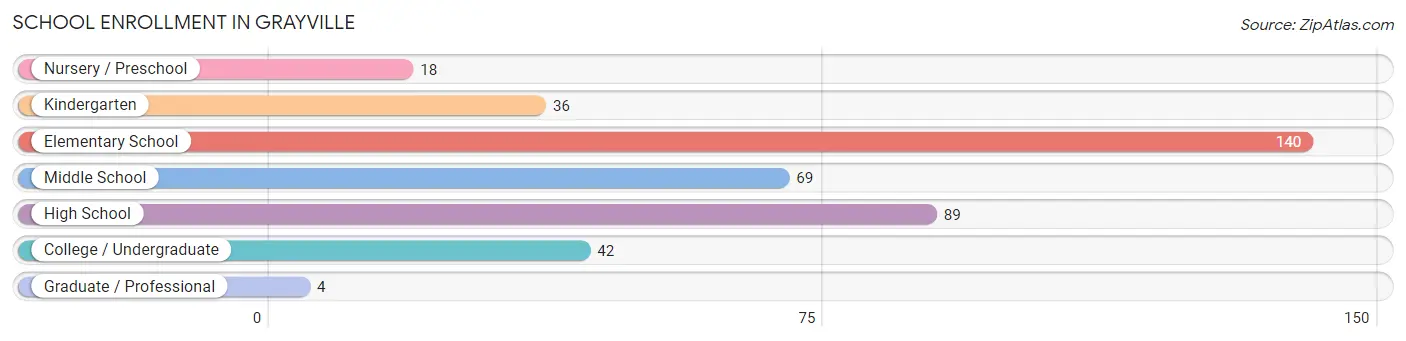
School Enrollment in Grayville
The most common levels of schooling among the 398 students in Grayville are elementary school (140 | 35.2%), high school (89 | 22.4%), and middle school (69 | 17.3%).
| School Level | # Students | % Students |
| Nursery / Preschool | 18 | 4.5% |
| Kindergarten | 36 | 9.0% |
| Elementary School | 140 | 35.2% |
| Middle School | 69 | 17.3% |
| High School | 89 | 22.4% |
| College / Undergraduate | 42 | 10.5% |
| Graduate / Professional | 4 | 1.0% |
| Total | 398 | 100.0% |
School Enrollment by Age by Funding Source in Grayville
Out of a total of 398 students who are enrolled in schools in Grayville, 8 (2.0%) attend a private institution, while the remaining 390 (98.0%) are enrolled in public schools. The age group of 35 years and over has the highest likelihood of being enrolled in private schools, with 1 (25.0% in the age bracket) enrolled. Conversely, the age group of 3 to 4 year olds has the lowest likelihood of being enrolled in a private school, with 12 (100.0% in the age bracket) attending a public institution.
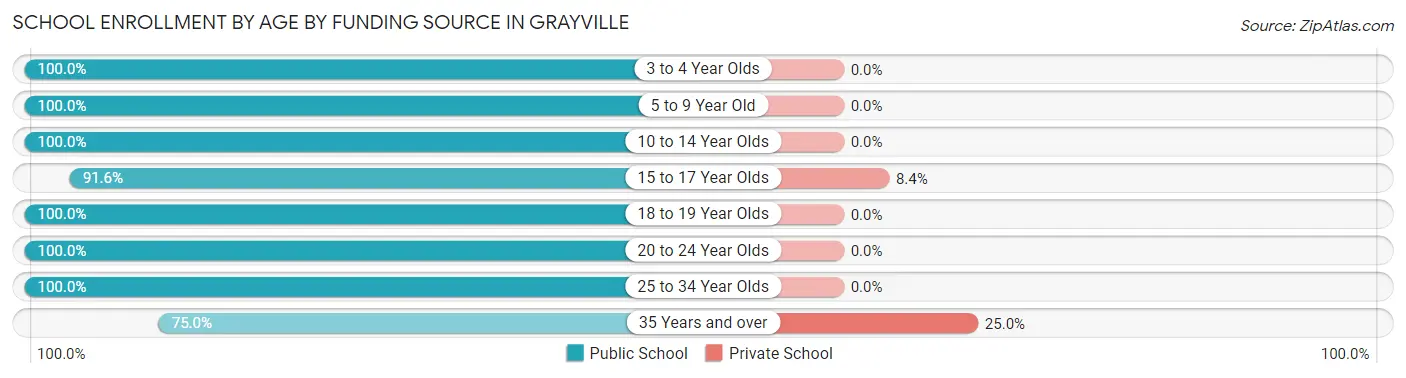
| Age Bracket | Public School | Private School |
| 3 to 4 Year Olds | 12 (100.0%) | 0 (0.0%) |
| 5 to 9 Year Old | 113 (100.0%) | 0 (0.0%) |
| 10 to 14 Year Olds | 131 (100.0%) | 0 (0.0%) |
| 15 to 17 Year Olds | 76 (91.6%) | 7 (8.4%) |
| 18 to 19 Year Olds | 19 (100.0%) | 0 (0.0%) |
| 20 to 24 Year Olds | 25 (100.0%) | 0 (0.0%) |
| 25 to 34 Year Olds | 11 (100.0%) | 0 (0.0%) |
| 35 Years and over | 3 (75.0%) | 1 (25.0%) |
| Total | 390 (98.0%) | 8 (2.0%) |
Educational Attainment by Field of Study in Grayville
Science & technology (23 | 14.8%), education (21 | 13.6%), business (19 | 12.3%), physical & health sciences (14 | 9.0%), and computers & mathematics (11 | 7.1%) are the most common fields of study among 155 individuals in Grayville who have obtained a bachelor's degree or higher.
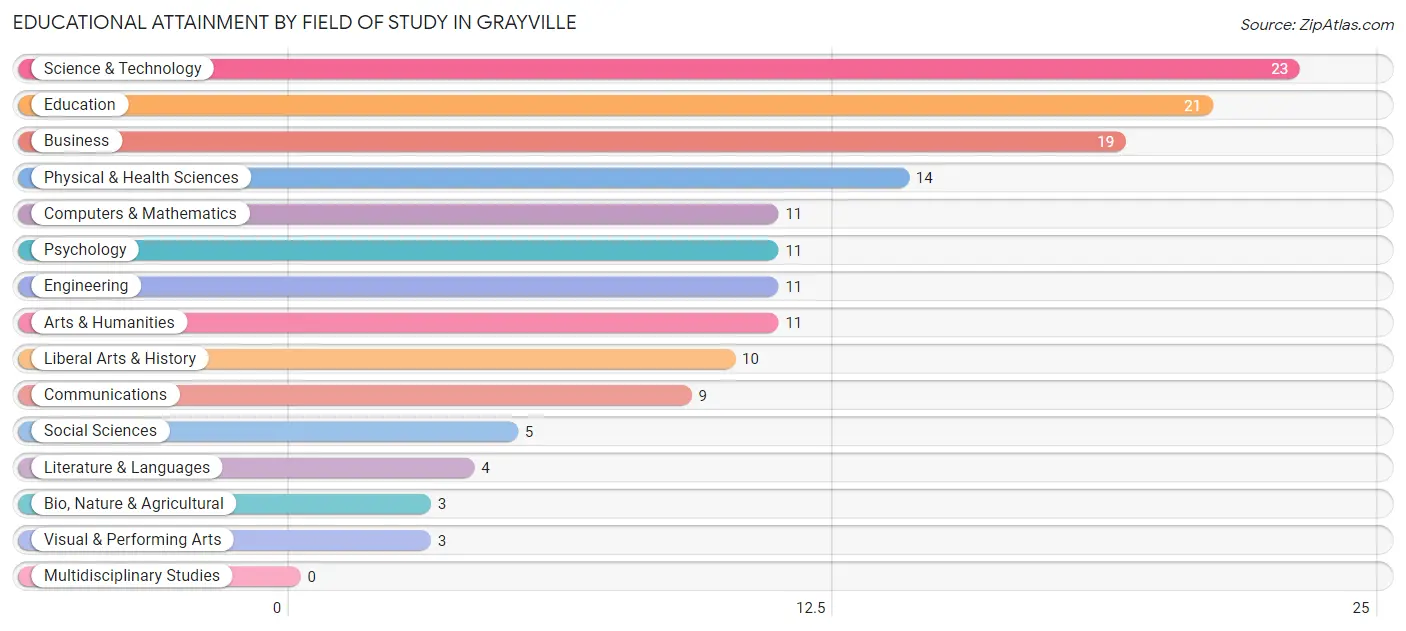
| Field of Study | # Graduates | % Graduates |
| Computers & Mathematics | 11 | 7.1% |
| Bio, Nature & Agricultural | 3 | 1.9% |
| Physical & Health Sciences | 14 | 9.0% |
| Psychology | 11 | 7.1% |
| Social Sciences | 5 | 3.2% |
| Engineering | 11 | 7.1% |
| Multidisciplinary Studies | 0 | 0.0% |
| Science & Technology | 23 | 14.8% |
| Business | 19 | 12.3% |
| Education | 21 | 13.6% |
| Literature & Languages | 4 | 2.6% |
| Liberal Arts & History | 10 | 6.5% |
| Visual & Performing Arts | 3 | 1.9% |
| Communications | 9 | 5.8% |
| Arts & Humanities | 11 | 7.1% |
| Total | 155 | 100.0% |
Transportation & Commute in Grayville
Vehicle Availability by Sex in Grayville
The most prevalent vehicle ownership categories in Grayville are males with 3 vehicles (120, accounting for 31.2%) and females with 3 vehicles (88, making up 36.8%).
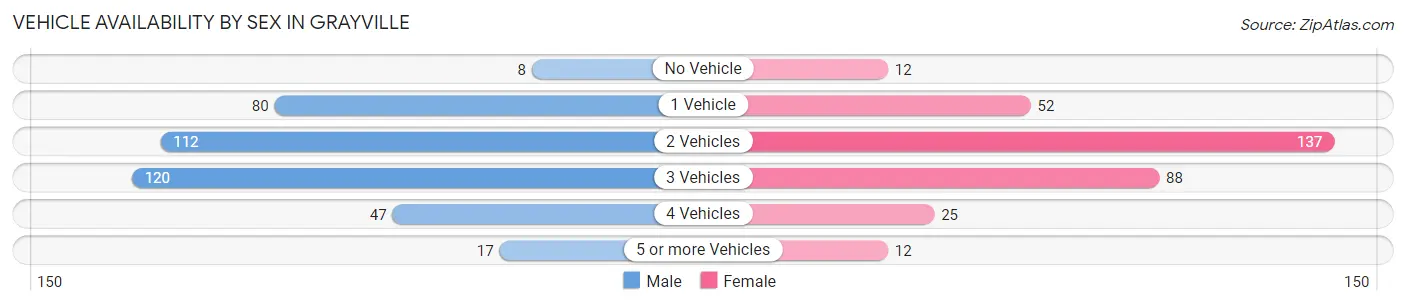
| Vehicles Available | Male | Female |
| No Vehicle | 8 (2.1%) | 12 (3.7%) |
| 1 Vehicle | 80 (20.8%) | 52 (16.0%) |
| 2 Vehicles | 112 (29.2%) | 137 (42.0%) |
| 3 Vehicles | 120 (31.2%) | 88 (27.0%) |
| 4 Vehicles | 47 (12.2%) | 25 (7.7%) |
| 5 or more Vehicles | 17 (4.4%) | 12 (3.7%) |
| Total | 384 (100.0%) | 326 (100.0%) |
Commute Time in Grayville
The most frequently occuring commute durations in Grayville are less than 5 minutes (124 commuters, 19.5%), 30 to 34 minutes (100 commuters, 15.7%), and 5 to 9 minutes (97 commuters, 15.2%).
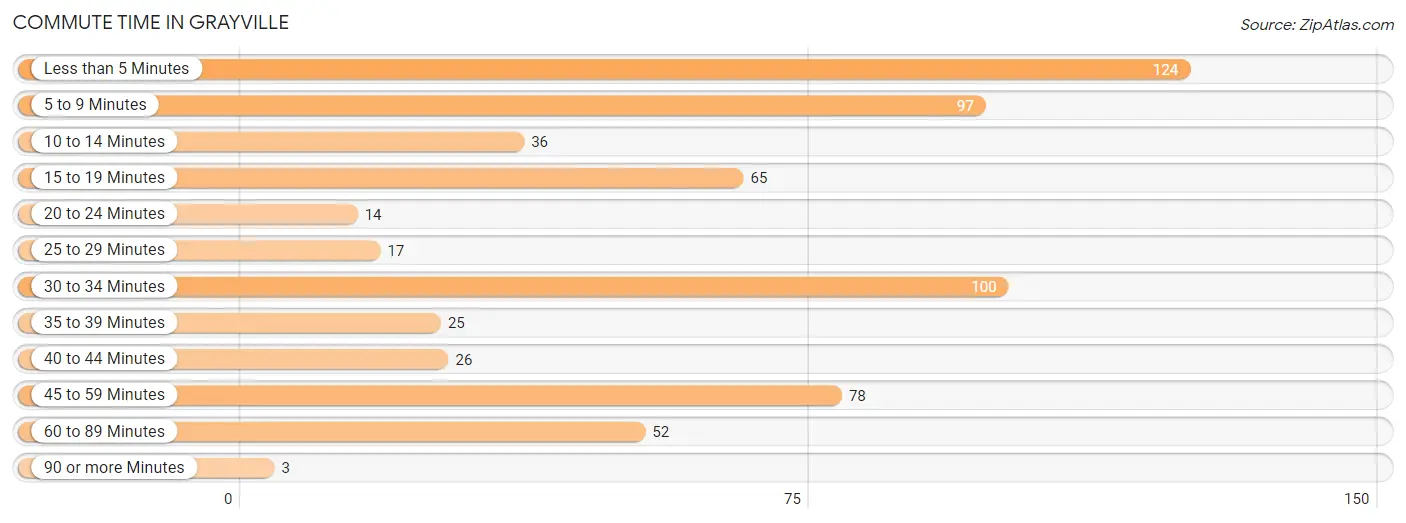
| Commute Time | # Commuters | % Commuters |
| Less than 5 Minutes | 124 | 19.5% |
| 5 to 9 Minutes | 97 | 15.2% |
| 10 to 14 Minutes | 36 | 5.7% |
| 15 to 19 Minutes | 65 | 10.2% |
| 20 to 24 Minutes | 14 | 2.2% |
| 25 to 29 Minutes | 17 | 2.7% |
| 30 to 34 Minutes | 100 | 15.7% |
| 35 to 39 Minutes | 25 | 3.9% |
| 40 to 44 Minutes | 26 | 4.1% |
| 45 to 59 Minutes | 78 | 12.2% |
| 60 to 89 Minutes | 52 | 8.2% |
| 90 or more Minutes | 3 | 0.5% |
Commute Time by Sex in Grayville
The most common commute times in Grayville are 30 to 34 minutes (87 commuters, 24.2%) for males and 5 to 9 minutes (67 commuters, 24.1%) for females.
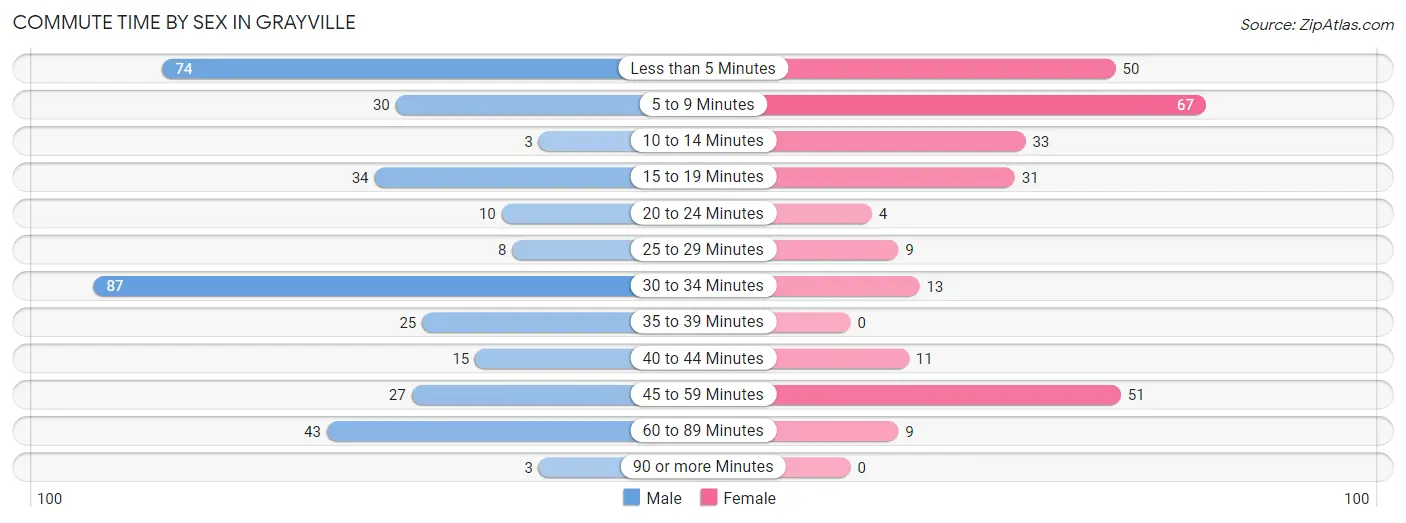
| Commute Time | Male | Female |
| Less than 5 Minutes | 74 (20.6%) | 50 (18.0%) |
| 5 to 9 Minutes | 30 (8.4%) | 67 (24.1%) |
| 10 to 14 Minutes | 3 (0.8%) | 33 (11.9%) |
| 15 to 19 Minutes | 34 (9.5%) | 31 (11.2%) |
| 20 to 24 Minutes | 10 (2.8%) | 4 (1.4%) |
| 25 to 29 Minutes | 8 (2.2%) | 9 (3.2%) |
| 30 to 34 Minutes | 87 (24.2%) | 13 (4.7%) |
| 35 to 39 Minutes | 25 (7.0%) | 0 (0.0%) |
| 40 to 44 Minutes | 15 (4.2%) | 11 (4.0%) |
| 45 to 59 Minutes | 27 (7.5%) | 51 (18.3%) |
| 60 to 89 Minutes | 43 (12.0%) | 9 (3.2%) |
| 90 or more Minutes | 3 (0.8%) | 0 (0.0%) |
Time of Departure to Work by Sex in Grayville
The most frequent times of departure to work in Grayville are 4:00 PM to 11:59 PM (65, 18.1%) for males and 6:30 AM to 6:59 AM (48, 17.3%) for females.
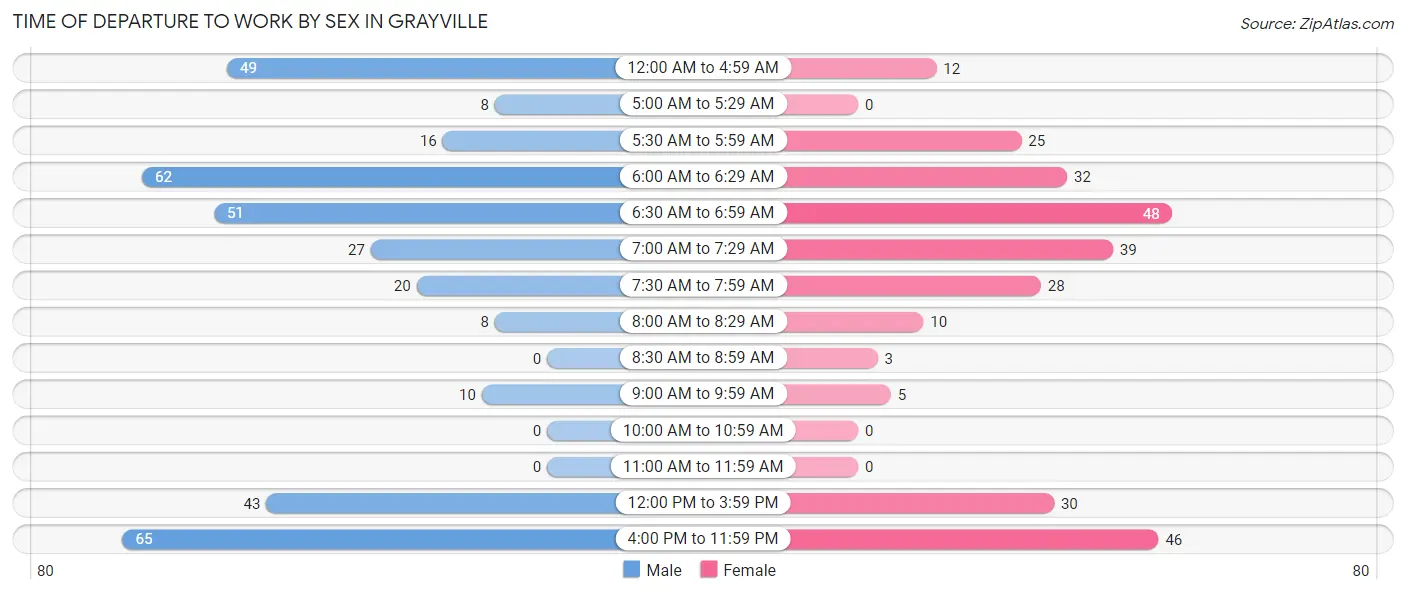
| Time of Departure | Male | Female |
| 12:00 AM to 4:59 AM | 49 (13.7%) | 12 (4.3%) |
| 5:00 AM to 5:29 AM | 8 (2.2%) | 0 (0.0%) |
| 5:30 AM to 5:59 AM | 16 (4.5%) | 25 (9.0%) |
| 6:00 AM to 6:29 AM | 62 (17.3%) | 32 (11.5%) |
| 6:30 AM to 6:59 AM | 51 (14.2%) | 48 (17.3%) |
| 7:00 AM to 7:29 AM | 27 (7.5%) | 39 (14.0%) |
| 7:30 AM to 7:59 AM | 20 (5.6%) | 28 (10.1%) |
| 8:00 AM to 8:29 AM | 8 (2.2%) | 10 (3.6%) |
| 8:30 AM to 8:59 AM | 0 (0.0%) | 3 (1.1%) |
| 9:00 AM to 9:59 AM | 10 (2.8%) | 5 (1.8%) |
| 10:00 AM to 10:59 AM | 0 (0.0%) | 0 (0.0%) |
| 11:00 AM to 11:59 AM | 0 (0.0%) | 0 (0.0%) |
| 12:00 PM to 3:59 PM | 43 (12.0%) | 30 (10.8%) |
| 4:00 PM to 11:59 PM | 65 (18.1%) | 46 (16.6%) |
| Total | 359 (100.0%) | 278 (100.0%) |
Housing Occupancy in Grayville
Occupancy by Ownership in Grayville
Of the total 643 dwellings in Grayville, owner-occupied units account for 436 (67.8%), while renter-occupied units make up 207 (32.2%).
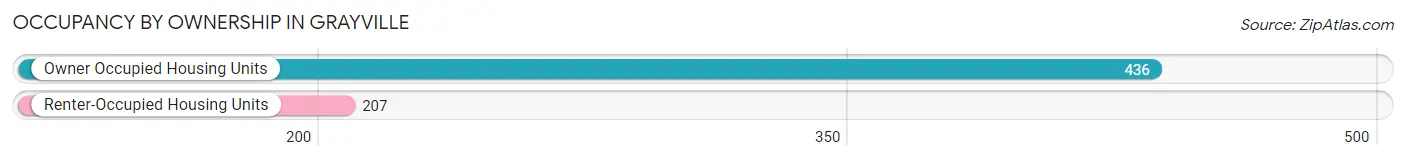
| Occupancy | # Housing Units | % Housing Units |
| Owner Occupied Housing Units | 436 | 67.8% |
| Renter-Occupied Housing Units | 207 | 32.2% |
| Total Occupied Housing Units | 643 | 100.0% |
Occupancy by Household Size in Grayville
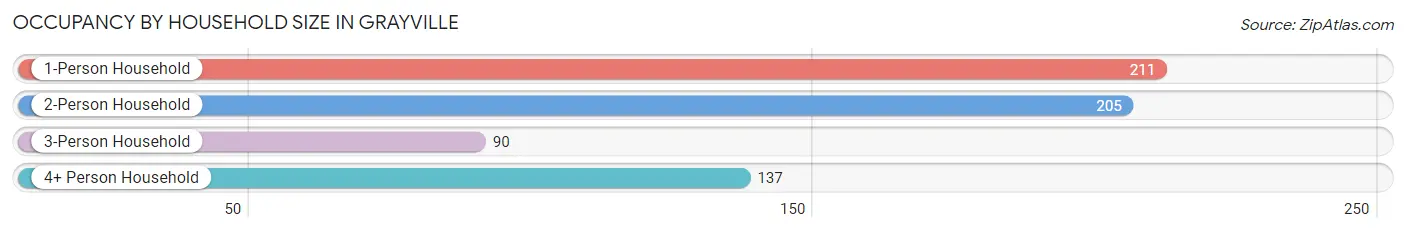
| Household Size | # Housing Units | % Housing Units |
| 1-Person Household | 211 | 32.8% |
| 2-Person Household | 205 | 31.9% |
| 3-Person Household | 90 | 14.0% |
| 4+ Person Household | 137 | 21.3% |
| Total Housing Units | 643 | 100.0% |
Occupancy by Ownership by Household Size in Grayville
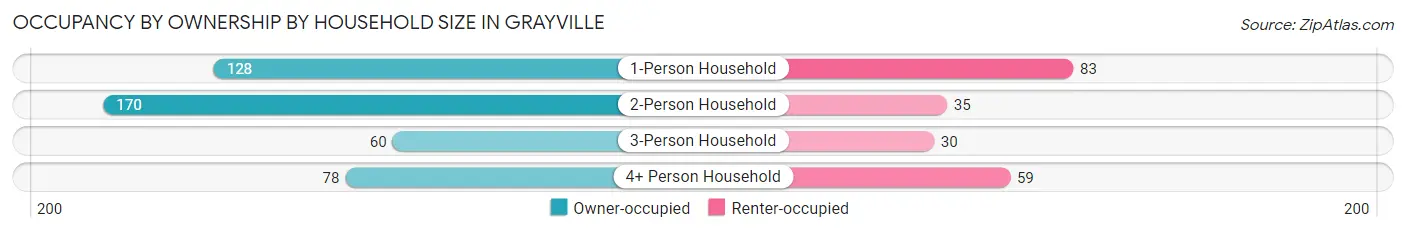
| Household Size | Owner-occupied | Renter-occupied |
| 1-Person Household | 128 (60.7%) | 83 (39.3%) |
| 2-Person Household | 170 (82.9%) | 35 (17.1%) |
| 3-Person Household | 60 (66.7%) | 30 (33.3%) |
| 4+ Person Household | 78 (56.9%) | 59 (43.1%) |
| Total Housing Units | 436 (67.8%) | 207 (32.2%) |
Occupancy by Educational Attainment in Grayville
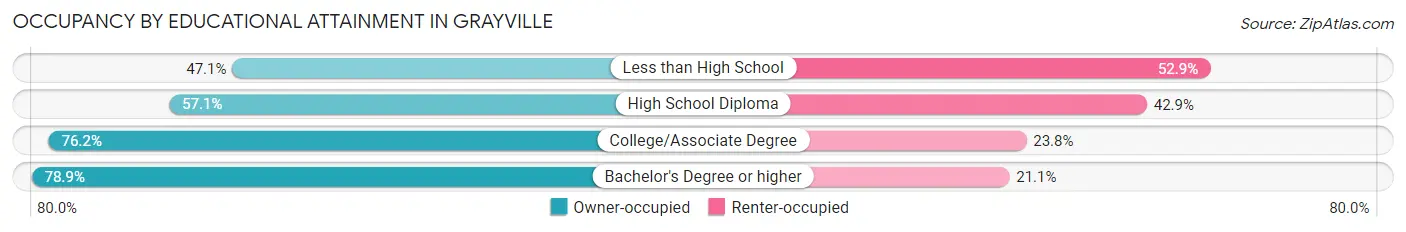
| Household Size | Owner-occupied | Renter-occupied |
| Less than High School | 32 (47.1%) | 36 (52.9%) |
| High School Diploma | 109 (57.1%) | 82 (42.9%) |
| College/Associate Degree | 224 (76.2%) | 70 (23.8%) |
| Bachelor's Degree or higher | 71 (78.9%) | 19 (21.1%) |
Occupancy by Age of Householder in Grayville
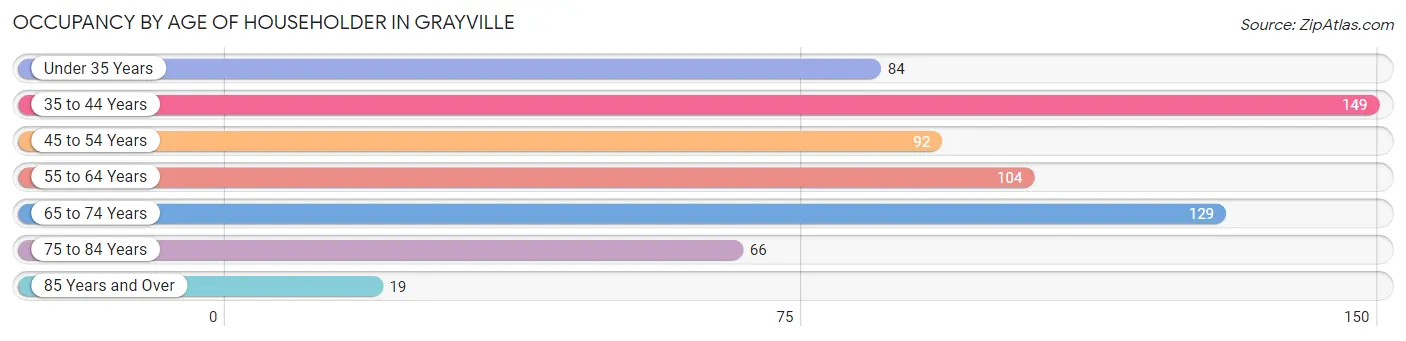
| Age Bracket | # Households | % Households |
| Under 35 Years | 84 | 13.1% |
| 35 to 44 Years | 149 | 23.2% |
| 45 to 54 Years | 92 | 14.3% |
| 55 to 64 Years | 104 | 16.2% |
| 65 to 74 Years | 129 | 20.1% |
| 75 to 84 Years | 66 | 10.3% |
| 85 Years and Over | 19 | 2.9% |
| Total | 643 | 100.0% |
Housing Finances in Grayville
Median Income by Occupancy in Grayville
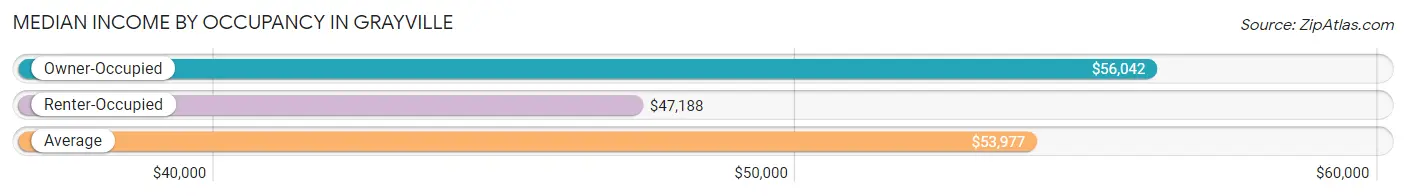
| Occupancy Type | # Households | Median Income |
| Owner-Occupied | 436 (67.8%) | $56,042 |
| Renter-Occupied | 207 (32.2%) | $47,188 |
| Average | 643 (100.0%) | $53,977 |
Occupancy by Householder Income Bracket in Grayville
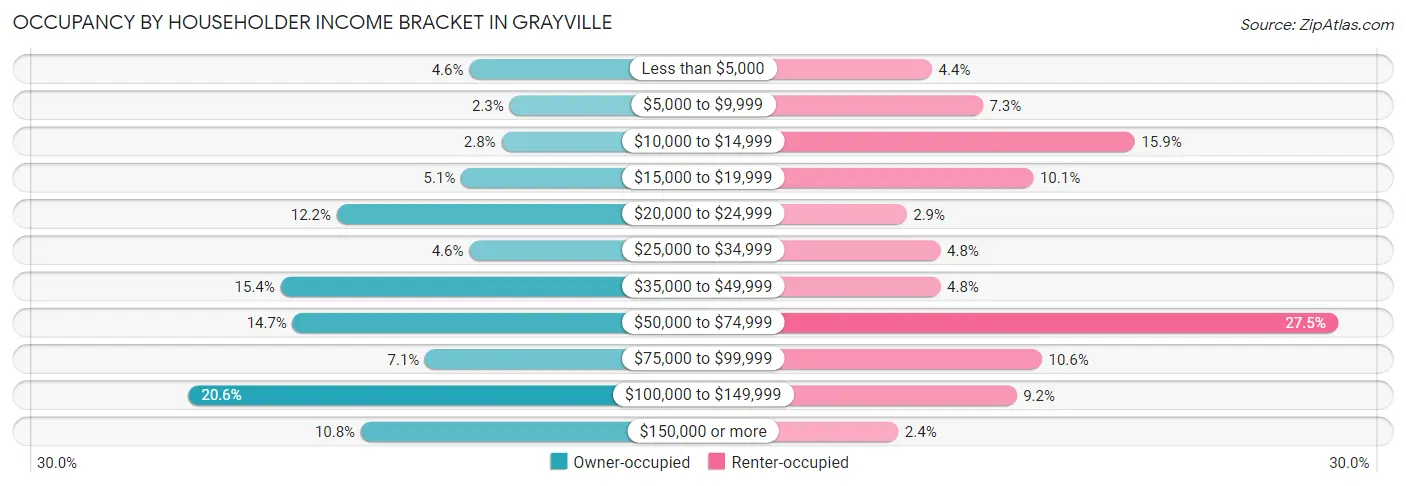
| Income Bracket | Owner-occupied | Renter-occupied |
| Less than $5,000 | 20 (4.6%) | 9 (4.3%) |
| $5,000 to $9,999 | 10 (2.3%) | 15 (7.2%) |
| $10,000 to $14,999 | 12 (2.8%) | 33 (15.9%) |
| $15,000 to $19,999 | 22 (5.1%) | 21 (10.1%) |
| $20,000 to $24,999 | 53 (12.2%) | 6 (2.9%) |
| $25,000 to $34,999 | 20 (4.6%) | 10 (4.8%) |
| $35,000 to $49,999 | 67 (15.4%) | 10 (4.8%) |
| $50,000 to $74,999 | 64 (14.7%) | 57 (27.5%) |
| $75,000 to $99,999 | 31 (7.1%) | 22 (10.6%) |
| $100,000 to $149,999 | 90 (20.6%) | 19 (9.2%) |
| $150,000 or more | 47 (10.8%) | 5 (2.4%) |
| Total | 436 (100.0%) | 207 (100.0%) |
Monthly Housing Cost Tiers in Grayville
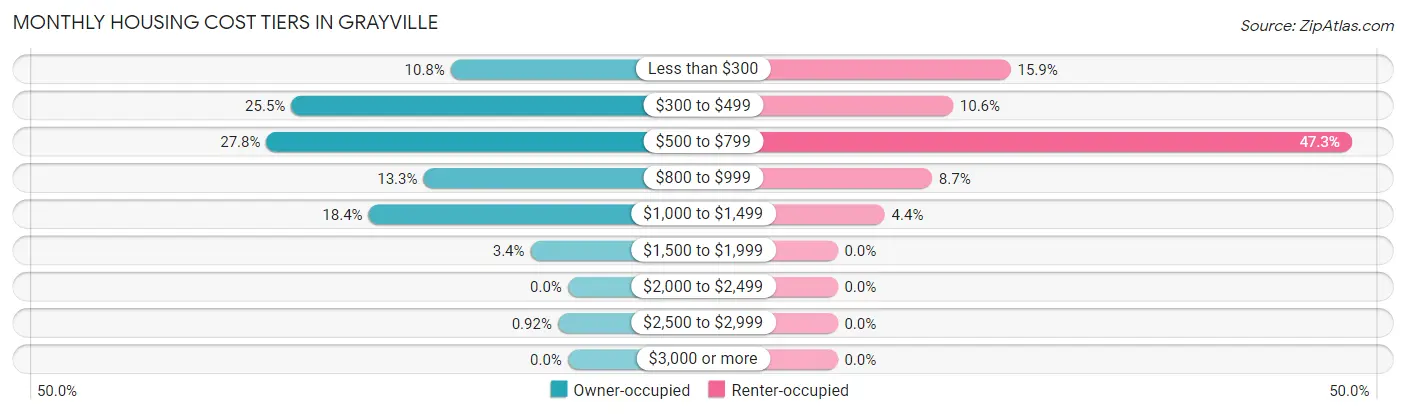
| Monthly Cost | Owner-occupied | Renter-occupied |
| Less than $300 | 47 (10.8%) | 33 (15.9%) |
| $300 to $499 | 111 (25.5%) | 22 (10.6%) |
| $500 to $799 | 121 (27.8%) | 98 (47.3%) |
| $800 to $999 | 58 (13.3%) | 18 (8.7%) |
| $1,000 to $1,499 | 80 (18.3%) | 9 (4.3%) |
| $1,500 to $1,999 | 15 (3.4%) | 0 (0.0%) |
| $2,000 to $2,499 | 0 (0.0%) | 0 (0.0%) |
| $2,500 to $2,999 | 4 (0.9%) | 0 (0.0%) |
| $3,000 or more | 0 (0.0%) | 0 (0.0%) |
| Total | 436 (100.0%) | 207 (100.0%) |
Physical Housing Characteristics in Grayville
Housing Structures in Grayville
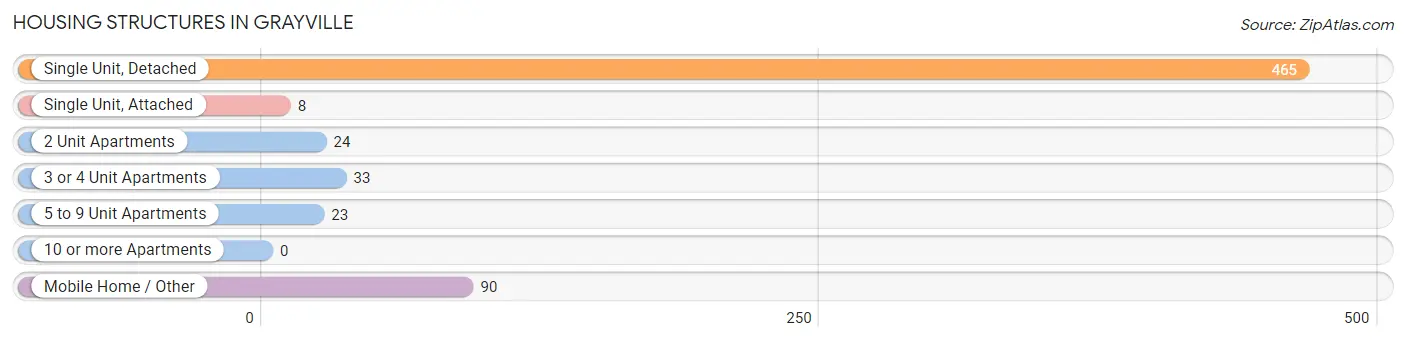
| Structure Type | # Housing Units | % Housing Units |
| Single Unit, Detached | 465 | 72.3% |
| Single Unit, Attached | 8 | 1.2% |
| 2 Unit Apartments | 24 | 3.7% |
| 3 or 4 Unit Apartments | 33 | 5.1% |
| 5 to 9 Unit Apartments | 23 | 3.6% |
| 10 or more Apartments | 0 | 0.0% |
| Mobile Home / Other | 90 | 14.0% |
| Total | 643 | 100.0% |
Housing Structures by Occupancy in Grayville
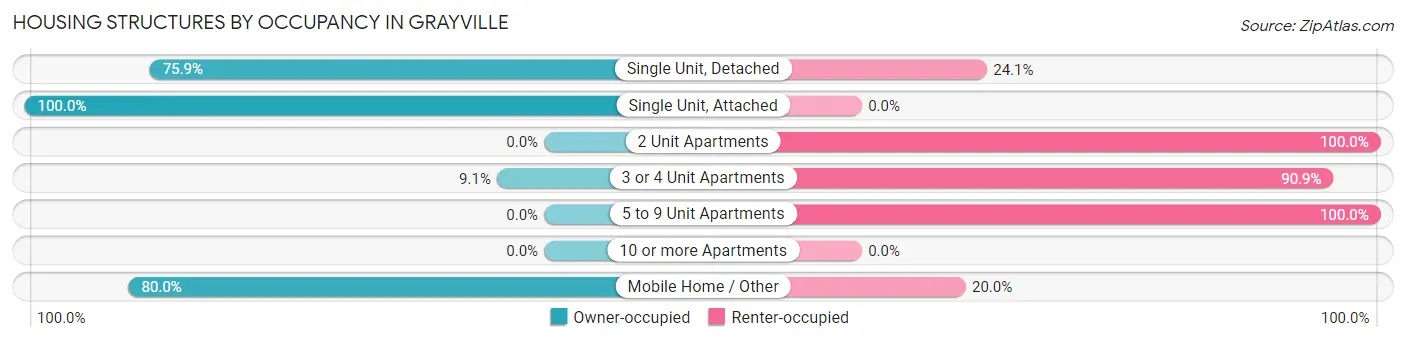
| Structure Type | Owner-occupied | Renter-occupied |
| Single Unit, Detached | 353 (75.9%) | 112 (24.1%) |
| Single Unit, Attached | 8 (100.0%) | 0 (0.0%) |
| 2 Unit Apartments | 0 (0.0%) | 24 (100.0%) |
| 3 or 4 Unit Apartments | 3 (9.1%) | 30 (90.9%) |
| 5 to 9 Unit Apartments | 0 (0.0%) | 23 (100.0%) |
| 10 or more Apartments | 0 (0.0%) | 0 (0.0%) |
| Mobile Home / Other | 72 (80.0%) | 18 (20.0%) |
| Total | 436 (67.8%) | 207 (32.2%) |
Housing Structures by Number of Rooms in Grayville
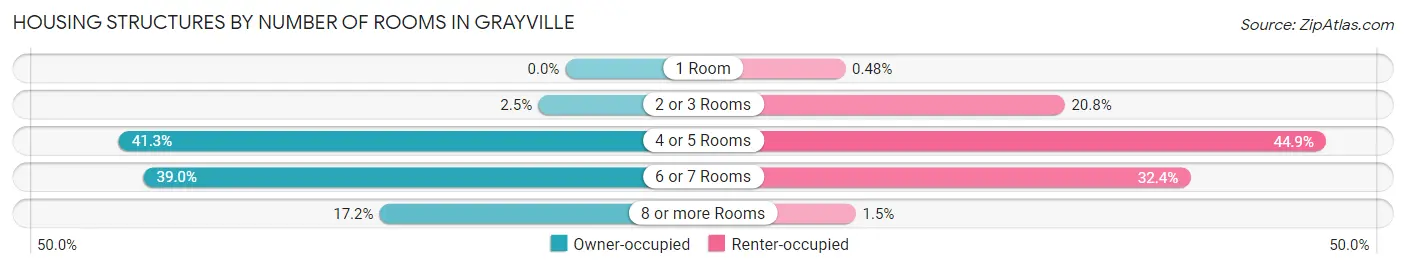
| Number of Rooms | Owner-occupied | Renter-occupied |
| 1 Room | 0 (0.0%) | 1 (0.5%) |
| 2 or 3 Rooms | 11 (2.5%) | 43 (20.8%) |
| 4 or 5 Rooms | 180 (41.3%) | 93 (44.9%) |
| 6 or 7 Rooms | 170 (39.0%) | 67 (32.4%) |
| 8 or more Rooms | 75 (17.2%) | 3 (1.5%) |
| Total | 436 (100.0%) | 207 (100.0%) |
Housing Structure by Heating Type in Grayville
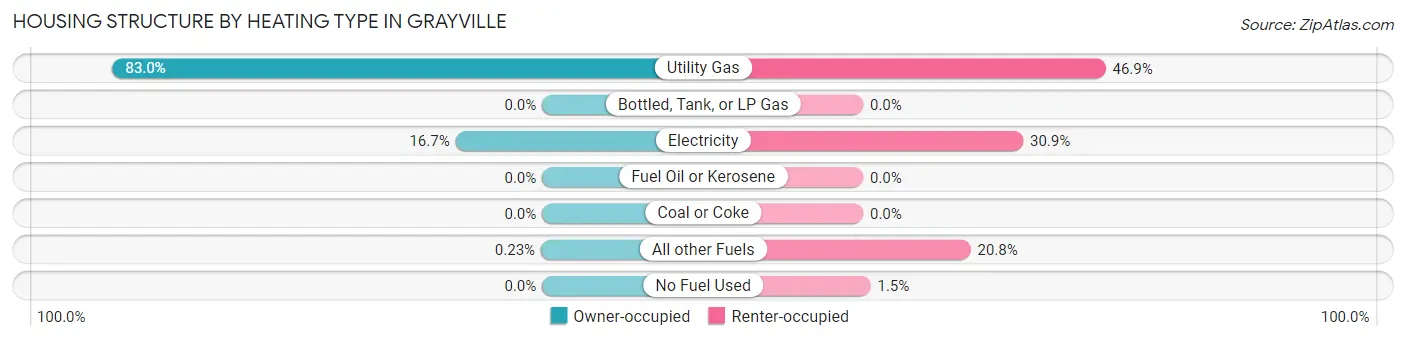
| Heating Type | Owner-occupied | Renter-occupied |
| Utility Gas | 362 (83.0%) | 97 (46.9%) |
| Bottled, Tank, or LP Gas | 0 (0.0%) | 0 (0.0%) |
| Electricity | 73 (16.7%) | 64 (30.9%) |
| Fuel Oil or Kerosene | 0 (0.0%) | 0 (0.0%) |
| Coal or Coke | 0 (0.0%) | 0 (0.0%) |
| All other Fuels | 1 (0.2%) | 43 (20.8%) |
| No Fuel Used | 0 (0.0%) | 3 (1.5%) |
| Total | 436 (100.0%) | 207 (100.0%) |
Household Vehicle Usage in Grayville
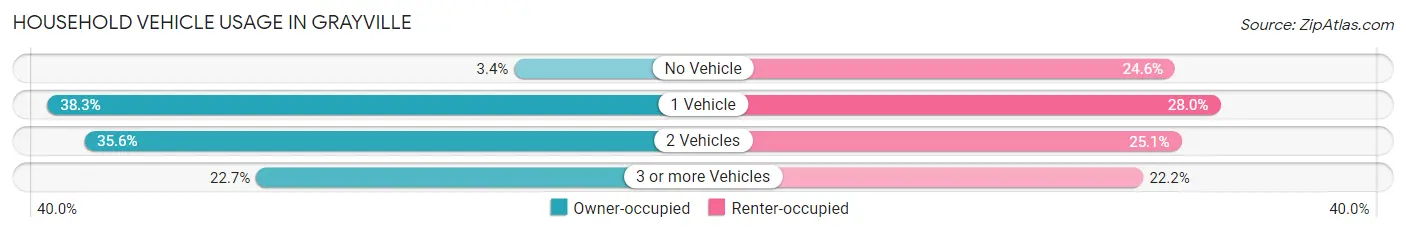
| Vehicles per Household | Owner-occupied | Renter-occupied |
| No Vehicle | 15 (3.4%) | 51 (24.6%) |
| 1 Vehicle | 167 (38.3%) | 58 (28.0%) |
| 2 Vehicles | 155 (35.5%) | 52 (25.1%) |
| 3 or more Vehicles | 99 (22.7%) | 46 (22.2%) |
| Total | 436 (100.0%) | 207 (100.0%) |
Real Estate & Mortgages in Grayville
Real Estate and Mortgage Overview in Grayville
| Characteristic | Without Mortgage | With Mortgage |
| Housing Units | 200 | 236 |
| Median Property Value | $66,600 | $75,000 |
| Median Household Income | $55,208 | $22 |
| Monthly Housing Costs | $386 | $0 |
| Real Estate Taxes | $938 | $14 |
Property Value by Mortgage Status in Grayville
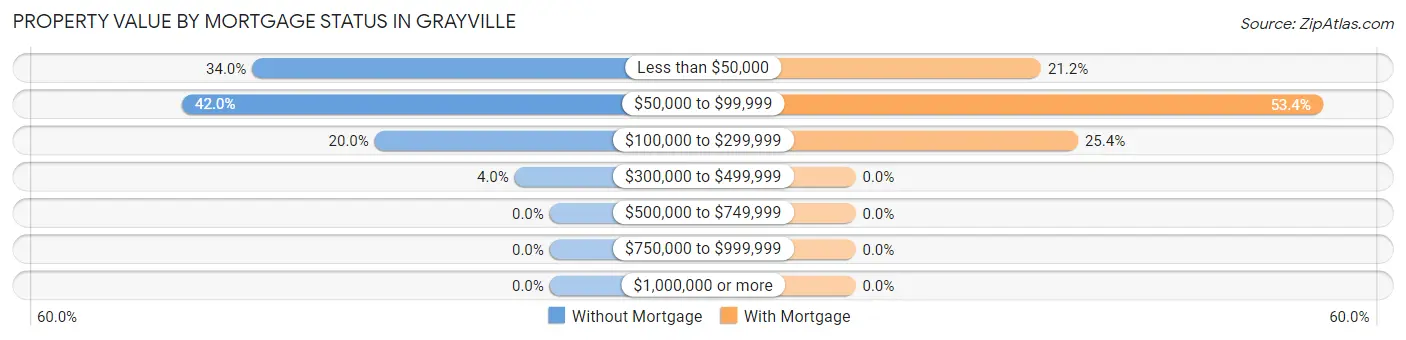
| Property Value | Without Mortgage | With Mortgage |
| Less than $50,000 | 68 (34.0%) | 50 (21.2%) |
| $50,000 to $99,999 | 84 (42.0%) | 126 (53.4%) |
| $100,000 to $299,999 | 40 (20.0%) | 60 (25.4%) |
| $300,000 to $499,999 | 8 (4.0%) | 0 (0.0%) |
| $500,000 to $749,999 | 0 (0.0%) | 0 (0.0%) |
| $750,000 to $999,999 | 0 (0.0%) | 0 (0.0%) |
| $1,000,000 or more | 0 (0.0%) | 0 (0.0%) |
| Total | 200 (100.0%) | 236 (100.0%) |
Household Income by Mortgage Status in Grayville
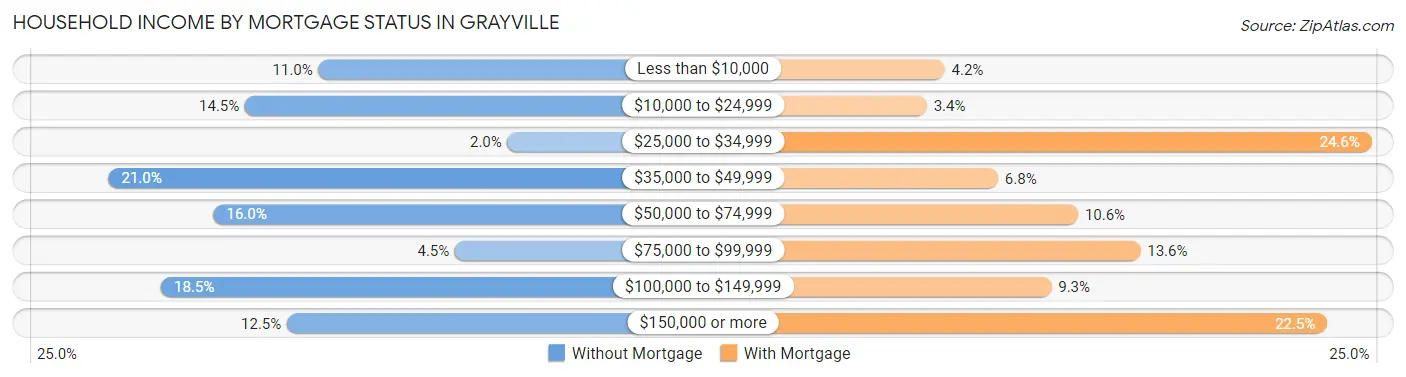
| Household Income | Without Mortgage | With Mortgage |
| Less than $10,000 | 22 (11.0%) | 10 (4.2%) |
| $10,000 to $24,999 | 29 (14.5%) | 8 (3.4%) |
| $25,000 to $34,999 | 4 (2.0%) | 58 (24.6%) |
| $35,000 to $49,999 | 42 (21.0%) | 16 (6.8%) |
| $50,000 to $74,999 | 32 (16.0%) | 25 (10.6%) |
| $75,000 to $99,999 | 9 (4.5%) | 32 (13.6%) |
| $100,000 to $149,999 | 37 (18.5%) | 22 (9.3%) |
| $150,000 or more | 25 (12.5%) | 53 (22.5%) |
| Total | 200 (100.0%) | 236 (100.0%) |
Property Value to Household Income Ratio in Grayville
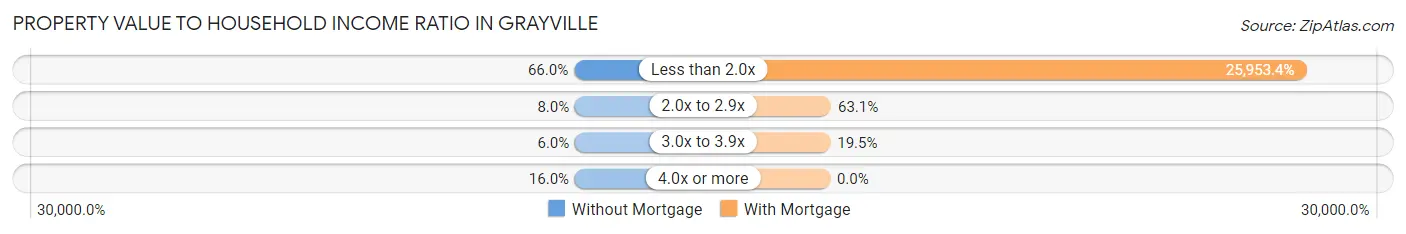
| Value-to-Income Ratio | Without Mortgage | With Mortgage |
| Less than 2.0x | 132 (66.0%) | 61,250 (25,953.4%) |
| 2.0x to 2.9x | 16 (8.0%) | 149 (63.1%) |
| 3.0x to 3.9x | 12 (6.0%) | 46 (19.5%) |
| 4.0x or more | 32 (16.0%) | 0 (0.0%) |
| Total | 200 (100.0%) | 236 (100.0%) |
Real Estate Taxes by Mortgage Status in Grayville
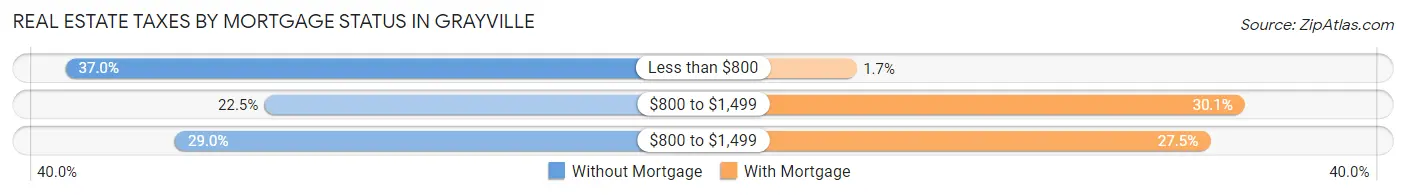
| Property Taxes | Without Mortgage | With Mortgage |
| Less than $800 | 74 (37.0%) | 4 (1.7%) |
| $800 to $1,499 | 45 (22.5%) | 71 (30.1%) |
| $800 to $1,499 | 58 (29.0%) | 65 (27.5%) |
| Total | 200 (100.0%) | 236 (100.0%) |
Health & Disability in Grayville
Health Insurance Coverage by Age in Grayville
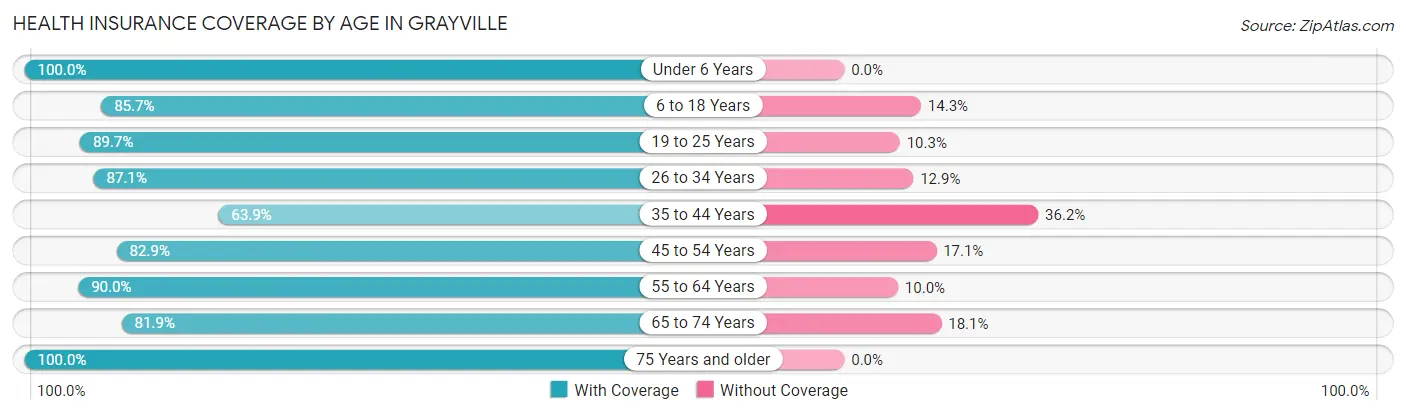
| Age Bracket | With Coverage | Without Coverage |
| Under 6 Years | 58 (100.0%) | 0 (0.0%) |
| 6 to 18 Years | 288 (85.7%) | 48 (14.3%) |
| 19 to 25 Years | 78 (89.7%) | 9 (10.3%) |
| 26 to 34 Years | 122 (87.1%) | 18 (12.9%) |
| 35 to 44 Years | 166 (63.8%) | 94 (36.1%) |
| 45 to 54 Years | 116 (82.9%) | 24 (17.1%) |
| 55 to 64 Years | 171 (90.0%) | 19 (10.0%) |
| 65 to 74 Years | 145 (81.9%) | 32 (18.1%) |
| 75 Years and older | 107 (100.0%) | 0 (0.0%) |
| Total | 1,251 (83.7%) | 244 (16.3%) |
Health Insurance Coverage by Citizenship Status in Grayville
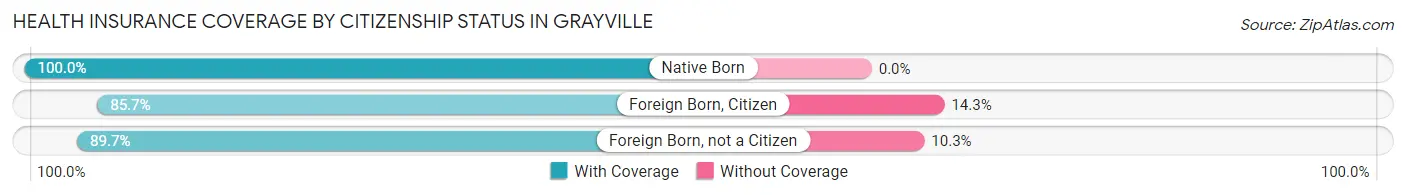
| Citizenship Status | With Coverage | Without Coverage |
| Native Born | 58 (100.0%) | 0 (0.0%) |
| Foreign Born, Citizen | 288 (85.7%) | 48 (14.3%) |
| Foreign Born, not a Citizen | 78 (89.7%) | 9 (10.3%) |
Health Insurance Coverage by Household Income in Grayville
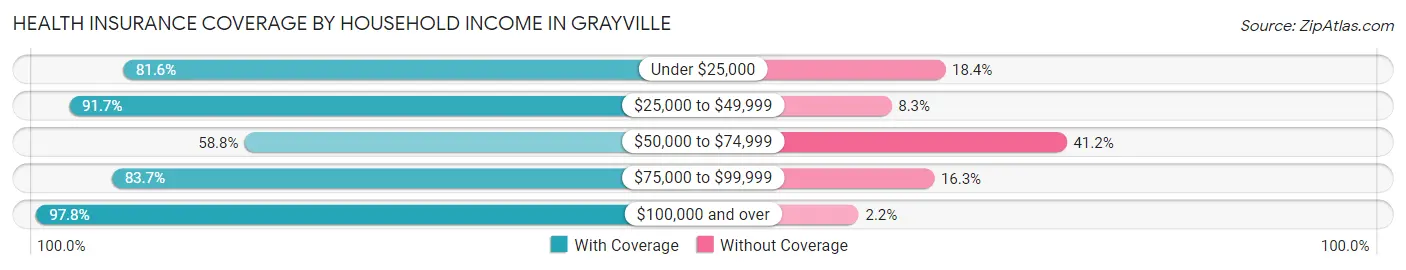
| Household Income | With Coverage | Without Coverage |
| Under $25,000 | 248 (81.6%) | 56 (18.4%) |
| $25,000 to $49,999 | 198 (91.7%) | 18 (8.3%) |
| $50,000 to $74,999 | 193 (58.8%) | 135 (41.2%) |
| $75,000 to $99,999 | 123 (83.7%) | 24 (16.3%) |
| $100,000 and over | 489 (97.8%) | 11 (2.2%) |
Public vs Private Health Insurance Coverage by Age in Grayville
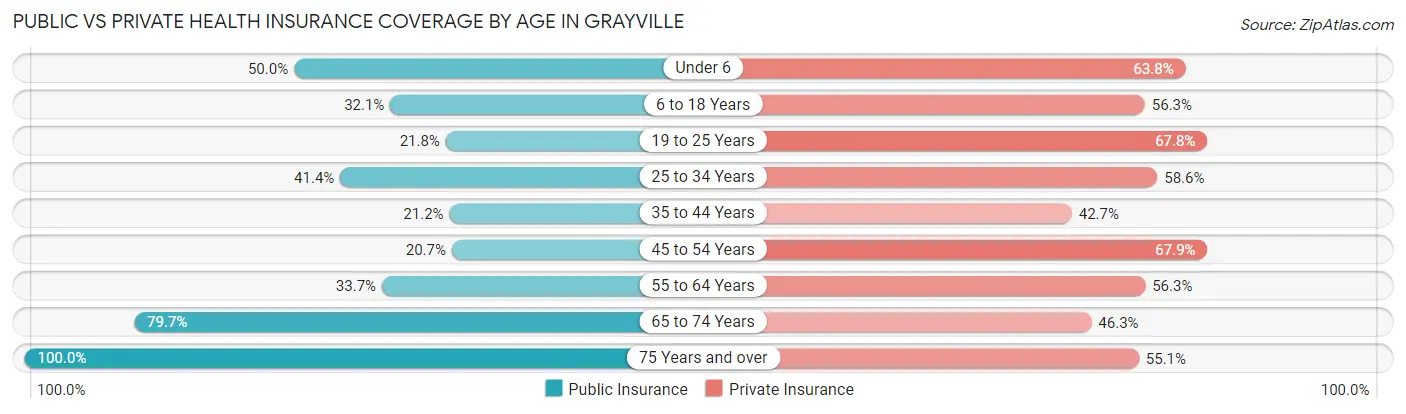
| Age Bracket | Public Insurance | Private Insurance |
| Under 6 | 29 (50.0%) | 37 (63.8%) |
| 6 to 18 Years | 108 (32.1%) | 189 (56.2%) |
| 19 to 25 Years | 19 (21.8%) | 59 (67.8%) |
| 25 to 34 Years | 58 (41.4%) | 82 (58.6%) |
| 35 to 44 Years | 55 (21.1%) | 111 (42.7%) |
| 45 to 54 Years | 29 (20.7%) | 95 (67.9%) |
| 55 to 64 Years | 64 (33.7%) | 107 (56.3%) |
| 65 to 74 Years | 141 (79.7%) | 82 (46.3%) |
| 75 Years and over | 107 (100.0%) | 59 (55.1%) |
| Total | 610 (40.8%) | 821 (54.9%) |
Disability Status by Sex by Age in Grayville
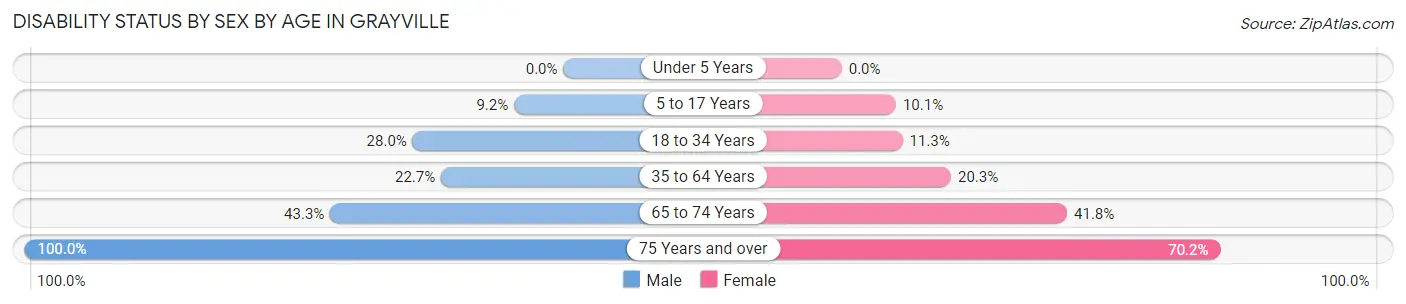
| Age Bracket | Male | Female |
| Under 5 Years | 0 (0.0%) | 0 (0.0%) |
| 5 to 17 Years | 14 (9.1%) | 18 (10.1%) |
| 18 to 34 Years | 33 (28.0%) | 14 (11.3%) |
| 35 to 64 Years | 69 (22.7%) | 58 (20.3%) |
| 65 to 74 Years | 29 (43.3%) | 46 (41.8%) |
| 75 Years and over | 23 (100.0%) | 59 (70.2%) |
Disability Class by Sex by Age in Grayville
Disability Class: Hearing Difficulty
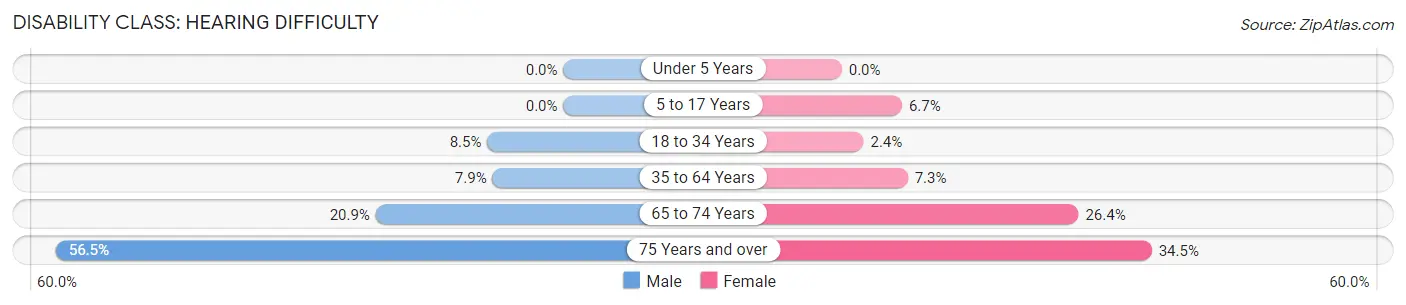
| Age Bracket | Male | Female |
| Under 5 Years | 0 (0.0%) | 0 (0.0%) |
| 5 to 17 Years | 0 (0.0%) | 12 (6.7%) |
| 18 to 34 Years | 10 (8.5%) | 3 (2.4%) |
| 35 to 64 Years | 24 (7.9%) | 21 (7.3%) |
| 65 to 74 Years | 14 (20.9%) | 29 (26.4%) |
| 75 Years and over | 13 (56.5%) | 29 (34.5%) |
Disability Class: Vision Difficulty
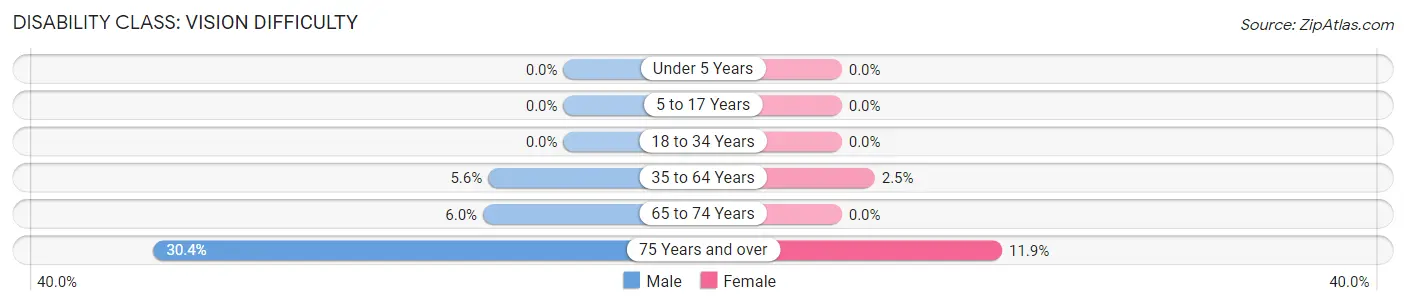
| Age Bracket | Male | Female |
| Under 5 Years | 0 (0.0%) | 0 (0.0%) |
| 5 to 17 Years | 0 (0.0%) | 0 (0.0%) |
| 18 to 34 Years | 0 (0.0%) | 0 (0.0%) |
| 35 to 64 Years | 17 (5.6%) | 7 (2.5%) |
| 65 to 74 Years | 4 (6.0%) | 0 (0.0%) |
| 75 Years and over | 7 (30.4%) | 10 (11.9%) |
Disability Class: Cognitive Difficulty
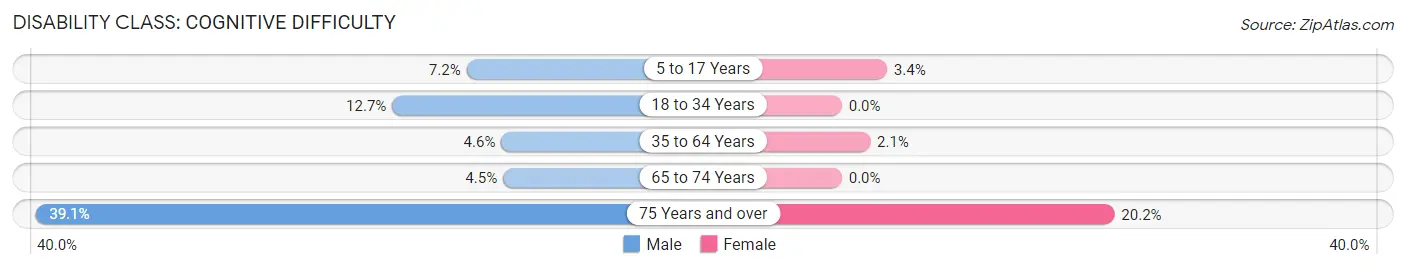
| Age Bracket | Male | Female |
| 5 to 17 Years | 11 (7.2%) | 6 (3.4%) |
| 18 to 34 Years | 15 (12.7%) | 0 (0.0%) |
| 35 to 64 Years | 14 (4.6%) | 6 (2.1%) |
| 65 to 74 Years | 3 (4.5%) | 0 (0.0%) |
| 75 Years and over | 9 (39.1%) | 17 (20.2%) |
Disability Class: Ambulatory Difficulty
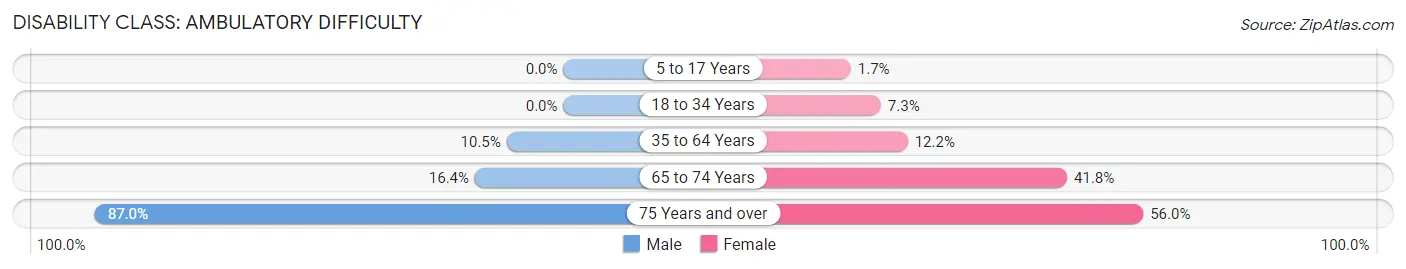
| Age Bracket | Male | Female |
| 5 to 17 Years | 0 (0.0%) | 3 (1.7%) |
| 18 to 34 Years | 0 (0.0%) | 9 (7.3%) |
| 35 to 64 Years | 32 (10.5%) | 35 (12.2%) |
| 65 to 74 Years | 11 (16.4%) | 46 (41.8%) |
| 75 Years and over | 20 (87.0%) | 47 (55.9%) |
Disability Class: Self-Care Difficulty
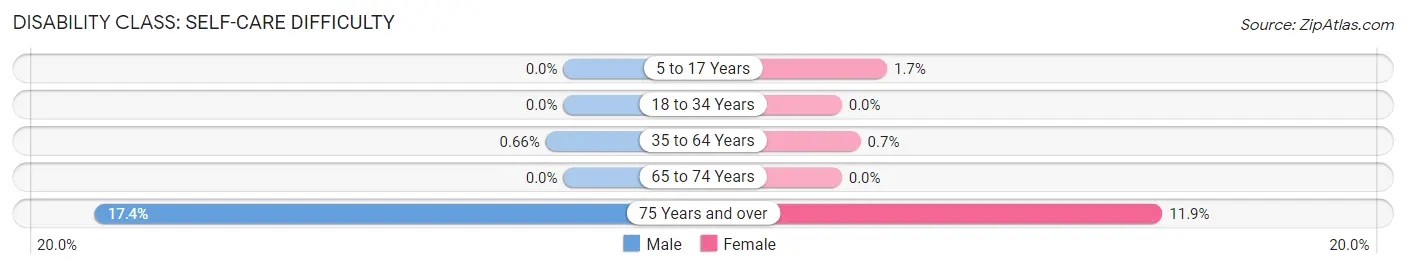
| Age Bracket | Male | Female |
| 5 to 17 Years | 0 (0.0%) | 3 (1.7%) |
| 18 to 34 Years | 0 (0.0%) | 0 (0.0%) |
| 35 to 64 Years | 2 (0.7%) | 2 (0.7%) |
| 65 to 74 Years | 0 (0.0%) | 0 (0.0%) |
| 75 Years and over | 4 (17.4%) | 10 (11.9%) |
Technology Access in Grayville
Computing Device Access in Grayville
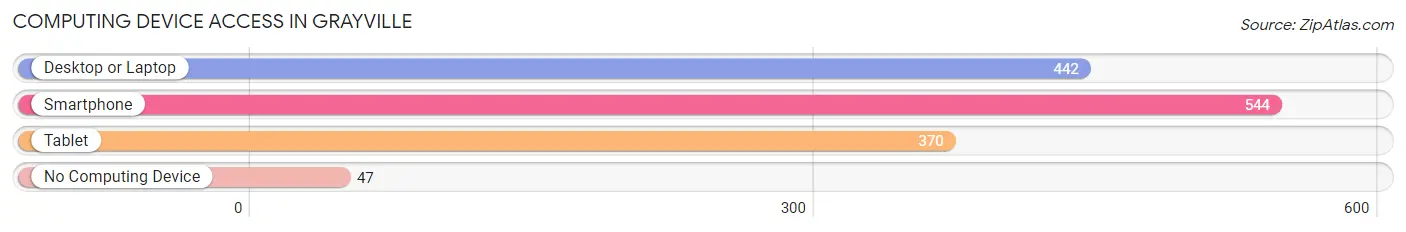
| Device Type | # Households | % Households |
| Desktop or Laptop | 442 | 68.7% |
| Smartphone | 544 | 84.6% |
| Tablet | 370 | 57.5% |
| No Computing Device | 47 | 7.3% |
| Total | 643 | 100.0% |
Internet Access in Grayville
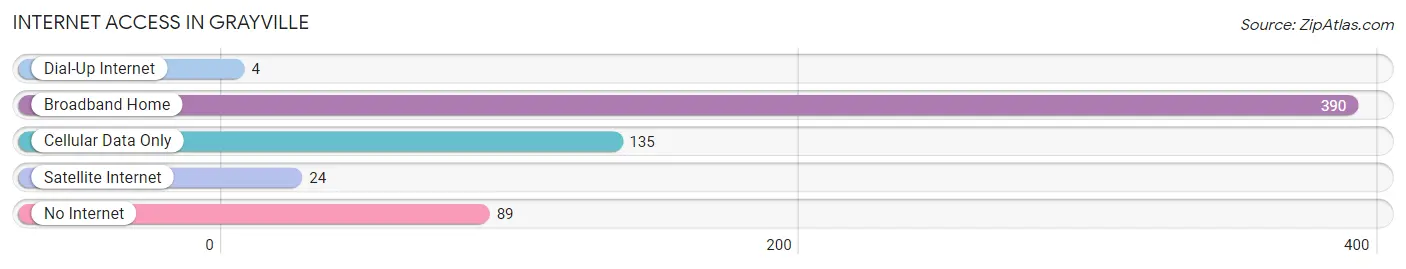
| Internet Type | # Households | % Households |
| Dial-Up Internet | 4 | 0.6% |
| Broadband Home | 390 | 60.7% |
| Cellular Data Only | 135 | 21.0% |
| Satellite Internet | 24 | 3.7% |
| No Internet | 89 | 13.8% |
| Total | 643 | 100.0% |
Grayville Summary
History
The small town of Grayville, Illinois is located in the southeastern corner of the state, in White County. It is situated on the banks of the Wabash River, and is the county seat of White County. The town was founded in 1817 by William Gray, a Revolutionary War veteran, and was originally known as Graysville. The town was later renamed Grayville in 1854.
The town was an important stop on the Wabash and Erie Canal, which was built in the early 1800s to connect the Great Lakes to the Ohio River. The canal was a major transportation route for goods and people, and Grayville was a popular stop for travelers. The town was also an important stop on the Illinois Central Railroad, which was built in the mid-1800s.
Grayville was an important center of commerce and industry in the late 1800s and early 1900s. The town was home to several factories, including a flour mill, a sawmill, a brickyard, and a furniture factory. The town also had several stores, a bank, and a post office.
In the early 1900s, Grayville was a popular tourist destination. The town was home to several resorts, including the Grayville Hotel, which was built in the late 1800s. The hotel was a popular destination for visitors from all over the country.
Geography
Grayville is located in the southeastern corner of Illinois, in White County. The town is situated on the banks of the Wabash River, and is the county seat of White County. The town is located about 40 miles east of Evansville, Indiana, and about 80 miles west of Louisville, Kentucky.
The town is located in a rural area, and is surrounded by farmland. The town is located in a hilly region, and is surrounded by rolling hills and wooded areas. The town is located in a temperate climate, and has mild winters and hot, humid summers.
Economy
Grayville is a small town with a population of about 1,500 people. The town is home to several small businesses, including a grocery store, a hardware store, a restaurant, and a few other small shops. The town is also home to several manufacturing companies, including a furniture factory and a brickyard.
The town is also home to several farms, which produce corn, soybeans, and other crops. The town is also home to several wineries, which produce a variety of wines.
Demographics
As of the 2010 census, the population of Grayville was 1,521 people. The town is predominantly white, with about 95% of the population being white. The town is also home to a small African American population, with about 4% of the population being African American. The town is also home to a small Hispanic population, with about 1% of the population being Hispanic.
The median household income in Grayville is $37,000, and the median home value is $90,000. The town has a poverty rate of about 15%, which is slightly higher than the national average. The town also has a high unemployment rate, with about 10% of the population being unemployed.
Common Questions
What is Per Capita Income in Grayville?
Per Capita income in Grayville is $26,450.
What is the Median Family Income in Grayville?
Median Family Income in Grayville is $70,375.
What is the Median Household income in Grayville?
Median Household Income in Grayville is $53,977.
What is Income or Wage Gap in Grayville?
Income or Wage Gap in Grayville is 47.1%.
Women in Grayville earn 52.9 cents for every dollar earned by a man.
What is Inequality or Gini Index in Grayville?
Inequality or Gini Index in Grayville is 0.44.
What is the Total Population of Grayville?
Total Population of Grayville is 1,542.
What is the Total Male Population of Grayville?
Total Male Population of Grayville is 724.
What is the Total Female Population of Grayville?
Total Female Population of Grayville is 818.
What is the Ratio of Males per 100 Females in Grayville?
There are 88.51 Males per 100 Females in Grayville.
What is the Ratio of Females per 100 Males in Grayville?
There are 112.98 Females per 100 Males in Grayville.
What is the Median Population Age in Grayville?
Median Population Age in Grayville is 40.8 Years.
What is the Average Family Size in Grayville
Average Family Size in Grayville is 2.9 People.
What is the Average Household Size in Grayville
Average Household Size in Grayville is 2.3 People.
How Large is the Labor Force in Grayville?
There are 763 People in the Labor Forcein in Grayville.
What is the Percentage of People in the Labor Force in Grayville?
62.2% of People are in the Labor Force in Grayville.
What is the Unemployment Rate in Grayville?
Unemployment Rate in Grayville is 5.4%.