Belle Rive, IL Map & Demographics
Belle Rive Map
Belle Rive Overview
$33,266
PER CAPITA INCOME
$53,000
AVG FAMILY INCOME
$53,750
AVG HOUSEHOLD INCOME
25.4%
WAGE / INCOME GAP [ % ]
74.6¢/ $1
WAGE / INCOME GAP [ $ ]
0.29
INEQUALITY / GINI INDEX
324
TOTAL POPULATION
177
MALE POPULATION
147
FEMALE POPULATION
120.41
MALES / 100 FEMALES
83.05
FEMALES / 100 MALES
38.9
MEDIAN AGE
2.4
AVG FAMILY SIZE
1.9
AVG HOUSEHOLD SIZE
185
LABOR FORCE [ PEOPLE ]
69.0%
PERCENT IN LABOR FORCE
3.2%
UNEMPLOYMENT RATE
Belle Rive Zip Codes
Belle Rive Area Codes
Income in Belle Rive
Income Overview in Belle Rive
Per Capita Income in Belle Rive is $33,266, while median incomes of families and households are $53,000 and $53,750 respectively.
| Characteristic | Number | Measure |
| Per Capita Income | 324 | $33,266 |
| Median Family Income | 98 | $53,000 |
| Mean Family Income | 98 | $67,643 |
| Median Household Income | 168 | $53,750 |
| Mean Household Income | 168 | $64,372 |
| Income Deficit | 98 | $0 |
| Wage / Income Gap (%) | 324 | 25.45% |
| Wage / Income Gap ($) | 324 | 74.55¢ per $1 |
| Gini / Inequality Index | 324 | 0.29 |
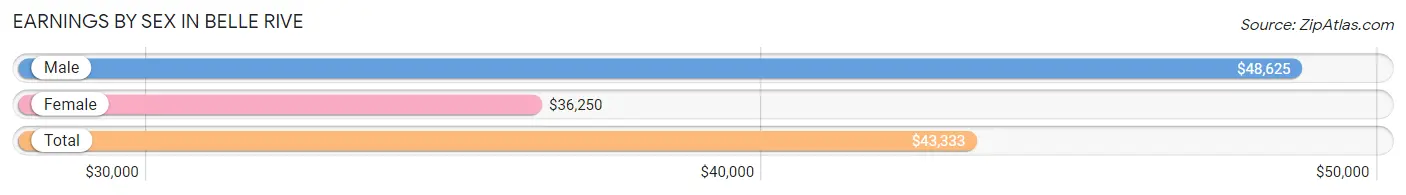
Earnings by Sex in Belle Rive
Average Earnings in Belle Rive are $43,333, $48,625 for men and $36,250 for women, a difference of 25.5%.
| Sex | Number | Average Earnings |
| Male | 106 (57.0%) | $48,625 |
| Female | 80 (43.0%) | $36,250 |
| Total | 186 (100.0%) | $43,333 |
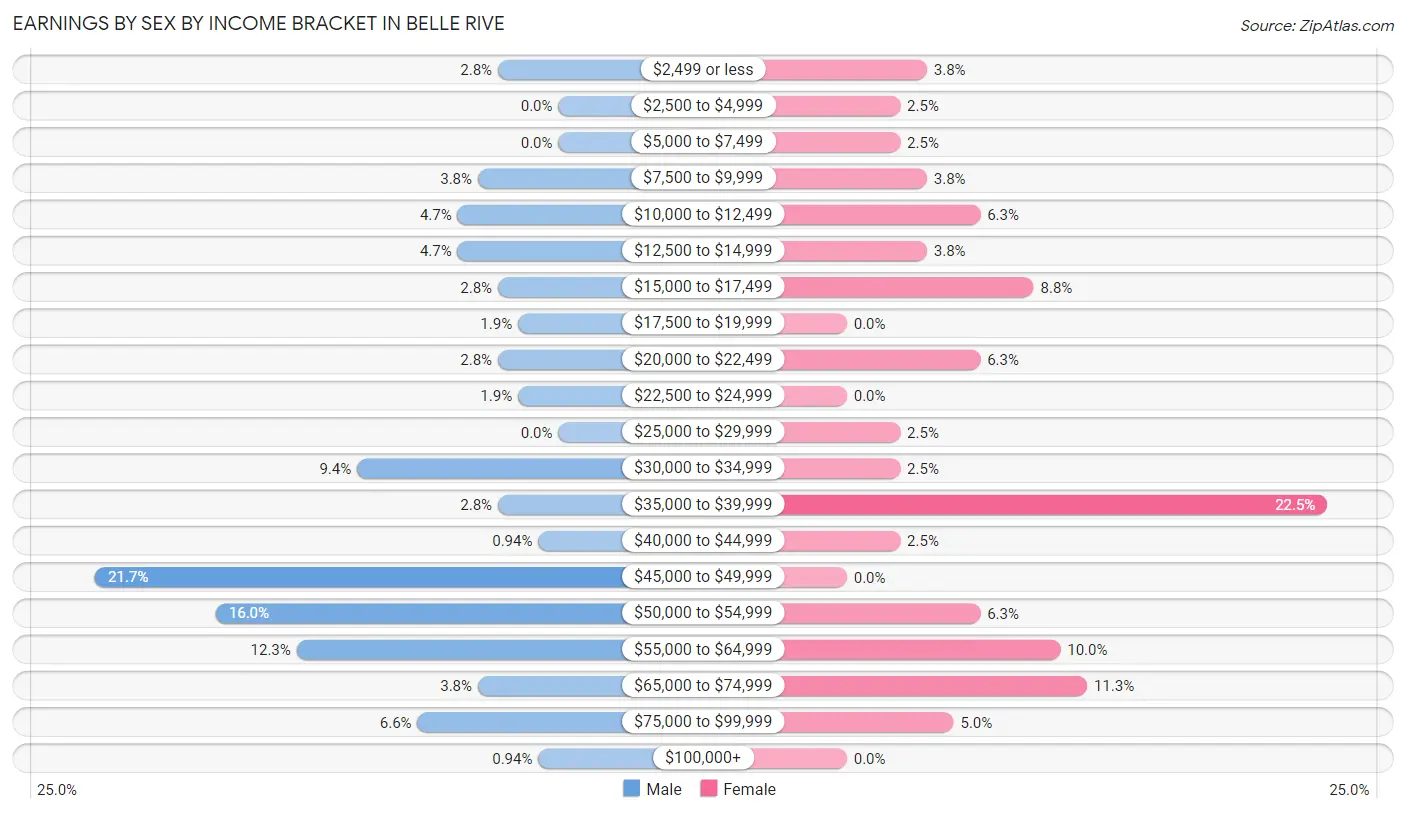
Earnings by Sex by Income Bracket in Belle Rive
The most common earnings brackets in Belle Rive are $45,000 to $49,999 for men (23 | 21.7%) and $35,000 to $39,999 for women (18 | 22.5%).
| Income | Male | Female |
| $2,499 or less | 3 (2.8%) | 3 (3.7%) |
| $2,500 to $4,999 | 0 (0.0%) | 2 (2.5%) |
| $5,000 to $7,499 | 0 (0.0%) | 2 (2.5%) |
| $7,500 to $9,999 | 4 (3.8%) | 3 (3.7%) |
| $10,000 to $12,499 | 5 (4.7%) | 5 (6.2%) |
| $12,500 to $14,999 | 5 (4.7%) | 3 (3.7%) |
| $15,000 to $17,499 | 3 (2.8%) | 7 (8.7%) |
| $17,500 to $19,999 | 2 (1.9%) | 0 (0.0%) |
| $20,000 to $22,499 | 3 (2.8%) | 5 (6.2%) |
| $22,500 to $24,999 | 2 (1.9%) | 0 (0.0%) |
| $25,000 to $29,999 | 0 (0.0%) | 2 (2.5%) |
| $30,000 to $34,999 | 10 (9.4%) | 2 (2.5%) |
| $35,000 to $39,999 | 3 (2.8%) | 18 (22.5%) |
| $40,000 to $44,999 | 1 (0.9%) | 2 (2.5%) |
| $45,000 to $49,999 | 23 (21.7%) | 0 (0.0%) |
| $50,000 to $54,999 | 17 (16.0%) | 5 (6.2%) |
| $55,000 to $64,999 | 13 (12.3%) | 8 (10.0%) |
| $65,000 to $74,999 | 4 (3.8%) | 9 (11.3%) |
| $75,000 to $99,999 | 7 (6.6%) | 4 (5.0%) |
| $100,000+ | 1 (0.9%) | 0 (0.0%) |
| Total | 106 (100.0%) | 80 (100.0%) |
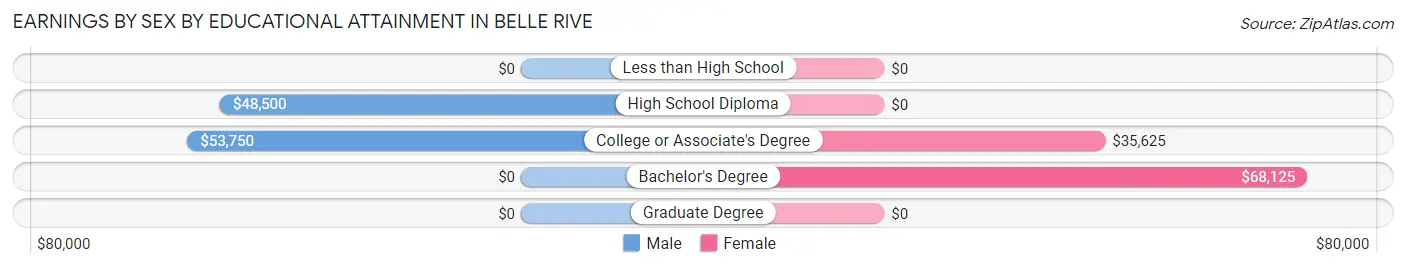
Earnings by Sex by Educational Attainment in Belle Rive
Average earnings in Belle Rive are $48,875 for men and $36,354 for women, a difference of 25.6%. Men with an educational attainment of college or associate's degree enjoy the highest average annual earnings of $53,750, while those with high school diploma education earn the least with $48,500. Women with an educational attainment of bachelor's degree earn the most with the average annual earnings of $68,125, while those with college or associate's degree education have the smallest earnings of $35,625.
| Educational Attainment | Male Income | Female Income |
| Less than High School | - | - |
| High School Diploma | $48,500 | $0 |
| College or Associate's Degree | $53,750 | $35,625 |
| Bachelor's Degree | - | - |
| Graduate Degree | - | - |
| Total | $48,875 | $36,354 |
Family Income in Belle Rive
Family Income Brackets in Belle Rive
According to the Belle Rive family income data, there are 27 families falling into the $50,000 to $74,999 income range, which is the most common income bracket and makes up 27.6% of all families.
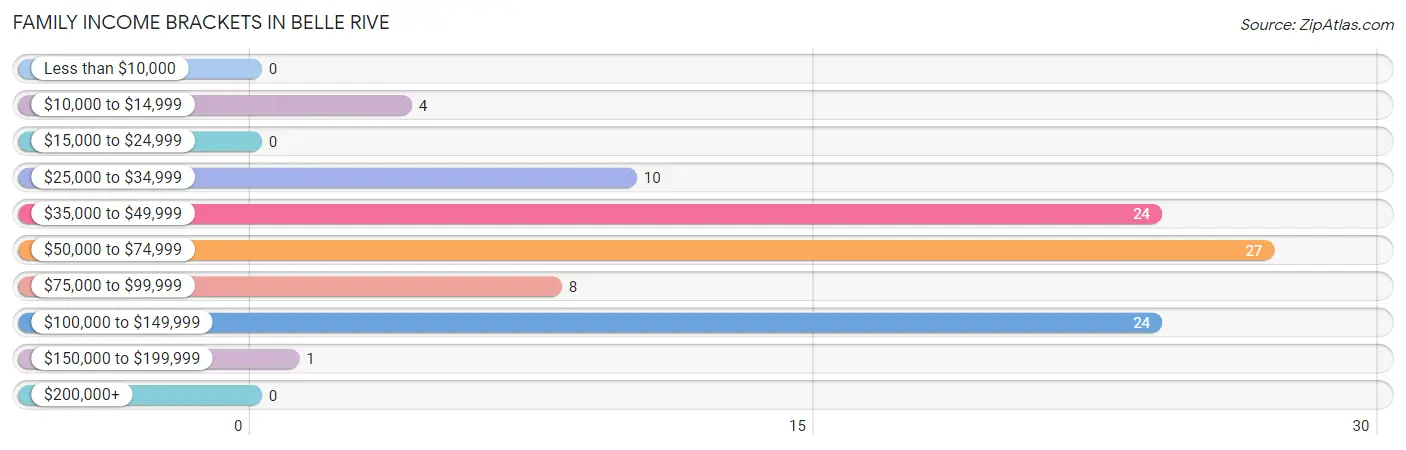
| Income Bracket | # Families | % Families |
| Less than $10,000 | 0 | 0.0% |
| $10,000 to $14,999 | 4 | 4.1% |
| $15,000 to $24,999 | 0 | 0.0% |
| $25,000 to $34,999 | 10 | 10.2% |
| $35,000 to $49,999 | 24 | 24.5% |
| $50,000 to $74,999 | 27 | 27.6% |
| $75,000 to $99,999 | 8 | 8.2% |
| $100,000 to $149,999 | 24 | 24.5% |
| $150,000 to $199,999 | 1 | 1.0% |
| $200,000+ | 0 | 0.0% |
Family Income by Famaliy Size in Belle Rive
4-person families (8 | 8.2%) account for the highest median family income in Belle Rive with $60,000 per family, while 2-person families (71 | 72.5%) have the highest median income of $26,438 per family member.
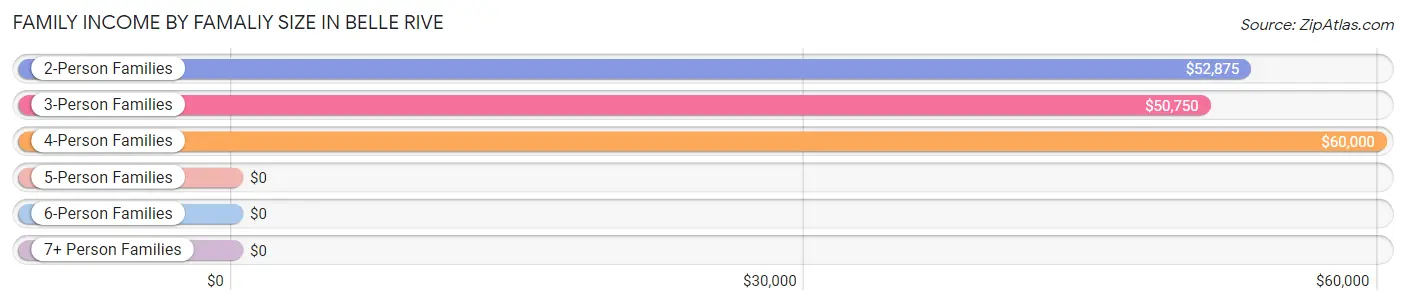
| Income Bracket | # Families | Median Income |
| 2-Person Families | 71 (72.5%) | $52,875 |
| 3-Person Families | 15 (15.3%) | $50,750 |
| 4-Person Families | 8 (8.2%) | $60,000 |
| 5-Person Families | 2 (2.0%) | $0 |
| 6-Person Families | 2 (2.0%) | $0 |
| 7+ Person Families | 0 (0.0%) | $0 |
| Total | 98 (100.0%) | $53,000 |
Family Income by Number of Earners in Belle Rive
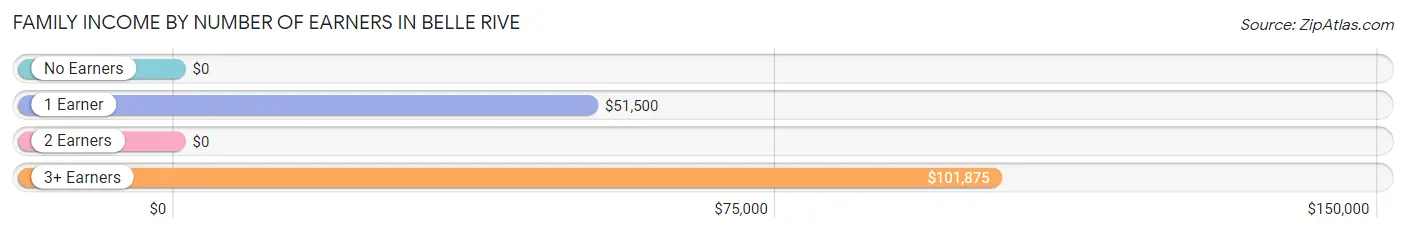
| Number of Earners | # Families | Median Income |
| No Earners | 21 (21.4%) | $0 |
| 1 Earner | 52 (53.1%) | $51,500 |
| 2 Earners | 20 (20.4%) | $0 |
| 3+ Earners | 5 (5.1%) | $101,875 |
| Total | 98 (100.0%) | $53,000 |
Household Income in Belle Rive
Household Income Brackets in Belle Rive
With 46 households falling in the category, the $50,000 to $74,999 income range is the most frequent in Belle Rive, accounting for 27.4% of all households.
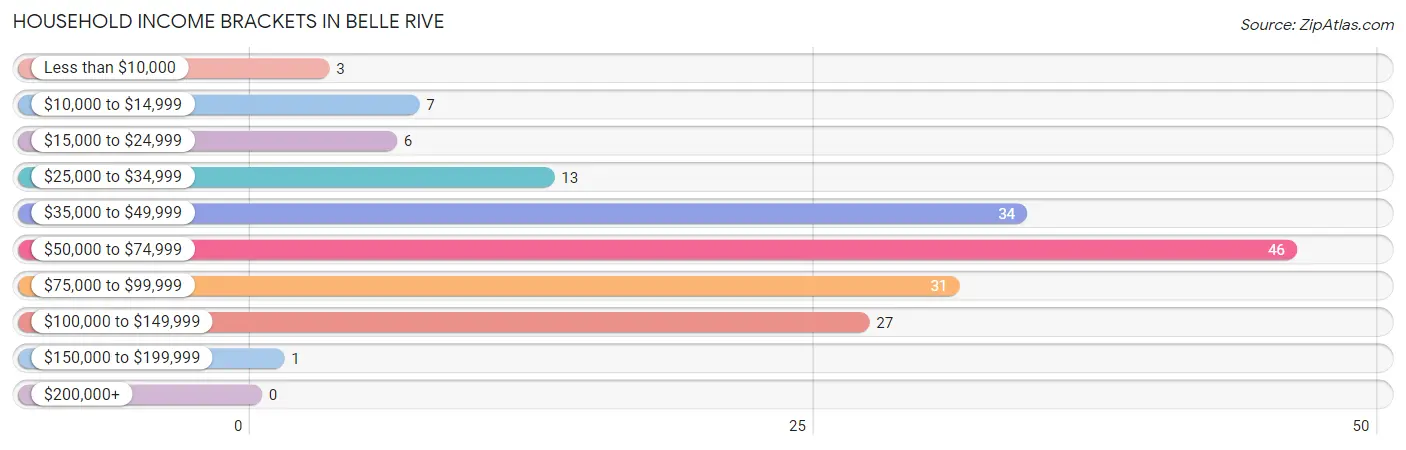
| Income Bracket | # Households | % Households |
| Less than $10,000 | 3 | 1.8% |
| $10,000 to $14,999 | 7 | 4.2% |
| $15,000 to $24,999 | 6 | 3.6% |
| $25,000 to $34,999 | 13 | 7.7% |
| $35,000 to $49,999 | 34 | 20.2% |
| $50,000 to $74,999 | 46 | 27.4% |
| $75,000 to $99,999 | 31 | 18.5% |
| $100,000 to $149,999 | 27 | 16.1% |
| $150,000 to $199,999 | 1 | 0.6% |
| $200,000+ | 0 | 0.0% |
Household Income by Householder Age in Belle Rive
The median household income in Belle Rive is $53,750, with the highest median household income of $88,036 found in the 15 to 24 years age bracket for the primary householder. A total of 11 households (6.6%) fall into this category. Meanwhile, the 25 to 44 years age bracket for the primary householder has the lowest median household income of $49,830, with 57 households (33.9%) in this group.
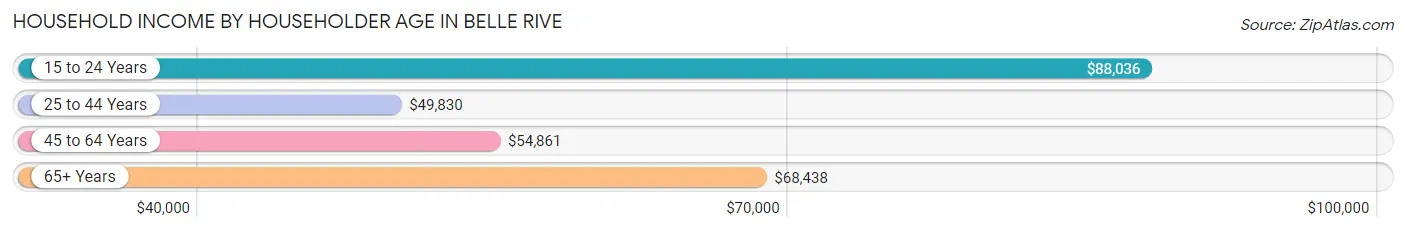
| Income Bracket | # Households | Median Income |
| 15 to 24 Years | 11 (6.6%) | $88,036 |
| 25 to 44 Years | 57 (33.9%) | $49,830 |
| 45 to 64 Years | 59 (35.1%) | $54,861 |
| 65+ Years | 41 (24.4%) | $68,438 |
| Total | 168 (100.0%) | $53,750 |
Poverty in Belle Rive
Income Below Poverty by Sex and Age in Belle Rive
With 4.0% poverty level for males and 8.2% for females among the residents of Belle Rive, 18 to 24 year old males and 18 to 24 year old females are the most vulnerable to poverty, with 3 males (12.5%) and 4 females (36.4%) in their respective age groups living below the poverty level.
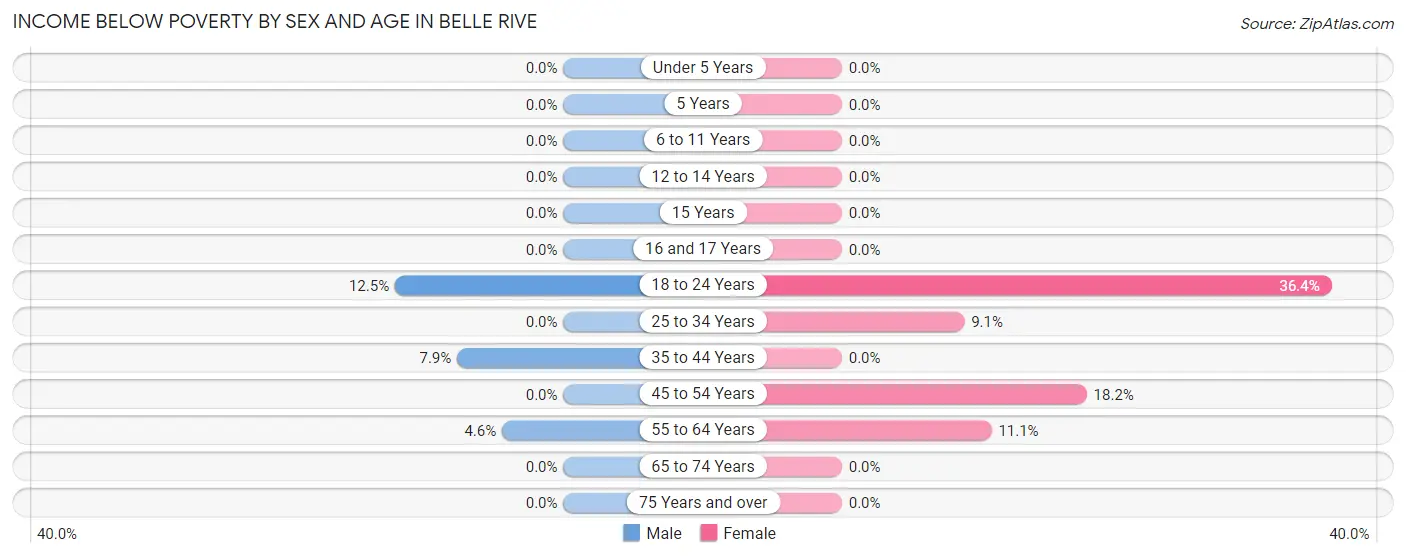
| Age Bracket | Male | Female |
| Under 5 Years | 0 (0.0%) | 0 (0.0%) |
| 5 Years | 0 (0.0%) | 0 (0.0%) |
| 6 to 11 Years | 0 (0.0%) | 0 (0.0%) |
| 12 to 14 Years | 0 (0.0%) | 0 (0.0%) |
| 15 Years | 0 (0.0%) | 0 (0.0%) |
| 16 and 17 Years | 0 (0.0%) | 0 (0.0%) |
| 18 to 24 Years | 3 (12.5%) | 4 (36.4%) |
| 25 to 34 Years | 0 (0.0%) | 1 (9.1%) |
| 35 to 44 Years | 3 (7.9%) | 0 (0.0%) |
| 45 to 54 Years | 0 (0.0%) | 4 (18.2%) |
| 55 to 64 Years | 1 (4.5%) | 3 (11.1%) |
| 65 to 74 Years | 0 (0.0%) | 0 (0.0%) |
| 75 Years and over | 0 (0.0%) | 0 (0.0%) |
| Total | 7 (4.0%) | 12 (8.2%) |
Income Above Poverty by Sex and Age in Belle Rive
According to the poverty statistics in Belle Rive, males aged under 5 years and females aged under 5 years are the age groups that are most secure financially, with 100.0% of males and 100.0% of females in these age groups living above the poverty line.
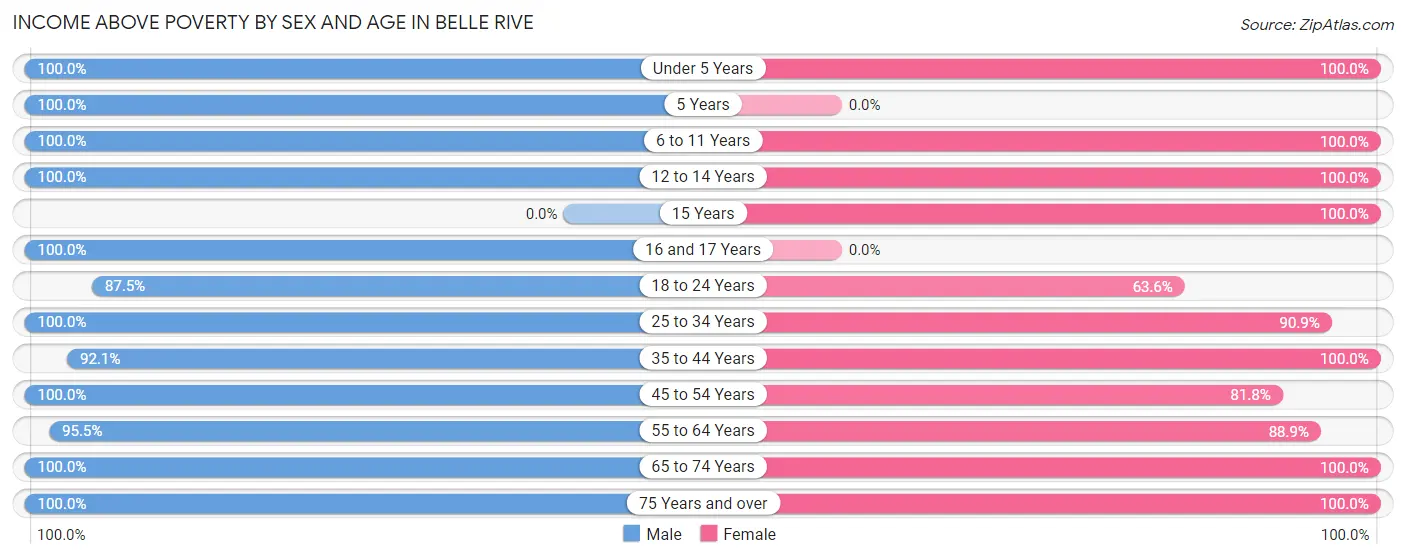
| Age Bracket | Male | Female |
| Under 5 Years | 2 (100.0%) | 16 (100.0%) |
| 5 Years | 5 (100.0%) | 0 (0.0%) |
| 6 to 11 Years | 8 (100.0%) | 7 (100.0%) |
| 12 to 14 Years | 6 (100.0%) | 9 (100.0%) |
| 15 Years | 0 (0.0%) | 2 (100.0%) |
| 16 and 17 Years | 2 (100.0%) | 0 (0.0%) |
| 18 to 24 Years | 21 (87.5%) | 7 (63.6%) |
| 25 to 34 Years | 28 (100.0%) | 10 (90.9%) |
| 35 to 44 Years | 35 (92.1%) | 9 (100.0%) |
| 45 to 54 Years | 15 (100.0%) | 18 (81.8%) |
| 55 to 64 Years | 21 (95.5%) | 24 (88.9%) |
| 65 to 74 Years | 4 (100.0%) | 13 (100.0%) |
| 75 Years and over | 22 (100.0%) | 20 (100.0%) |
| Total | 169 (96.0%) | 135 (91.8%) |
Income Below Poverty Among Married-Couple Families in Belle Rive
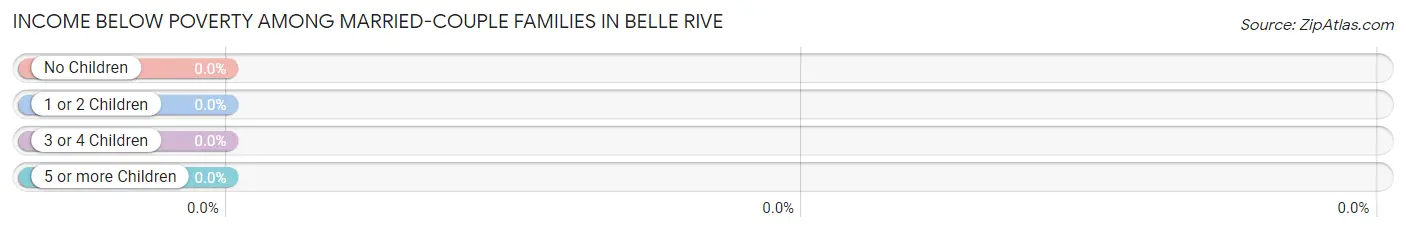
| Children | Above Poverty | Below Poverty |
| No Children | 39 (100.0%) | 0 (0.0%) |
| 1 or 2 Children | 8 (100.0%) | 0 (0.0%) |
| 3 or 4 Children | 2 (100.0%) | 0 (0.0%) |
| 5 or more Children | 0 (0.0%) | 0 (0.0%) |
| Total | 49 (100.0%) | 0 (0.0%) |
Income Below Poverty Among Single-Parent Households in Belle Rive
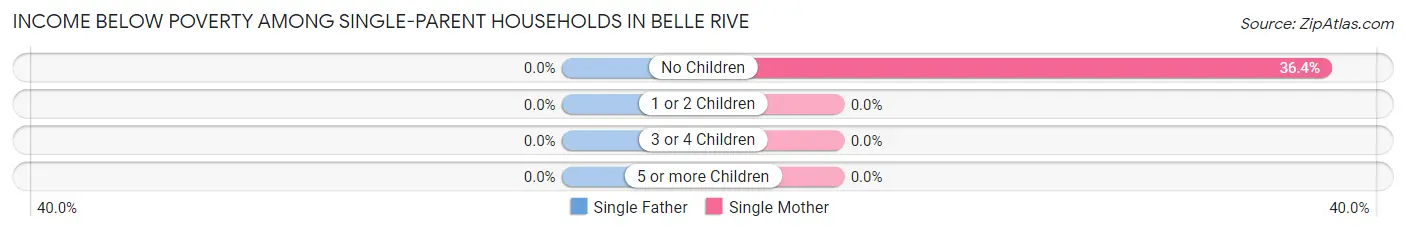
| Children | Single Father | Single Mother |
| No Children | 0 (0.0%) | 4 (36.4%) |
| 1 or 2 Children | 0 (0.0%) | 0 (0.0%) |
| 3 or 4 Children | 0 (0.0%) | 0 (0.0%) |
| 5 or more Children | 0 (0.0%) | 0 (0.0%) |
| Total | 0 (0.0%) | 4 (22.2%) |
Income Below Poverty Among Married-Couple vs Single-Parent Households in Belle Rive
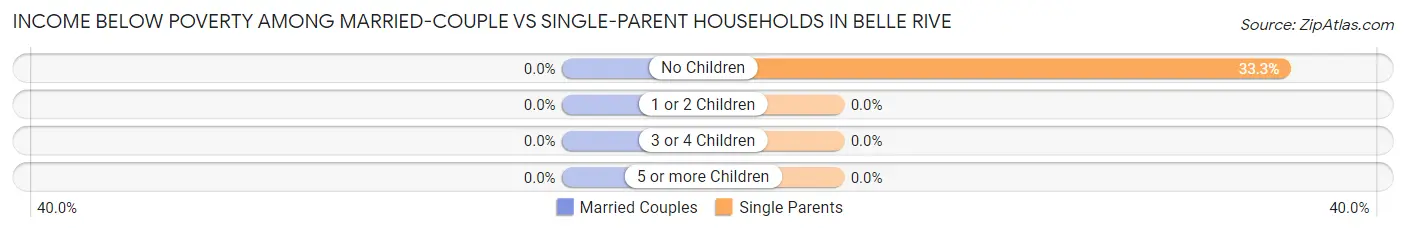
| Children | Married-Couple Families | Single-Parent Households |
| No Children | 0 (0.0%) | 4 (33.3%) |
| 1 or 2 Children | 0 (0.0%) | 0 (0.0%) |
| 3 or 4 Children | 0 (0.0%) | 0 (0.0%) |
| 5 or more Children | 0 (0.0%) | 0 (0.0%) |
| Total | 0 (0.0%) | 4 (8.2%) |
Race in Belle Rive
The most populous races in Belle Rive are White / Caucasian (285 | 88.0%), Two or more Races (39 | 12.0%), and Hispanic or Latino (37 | 11.4%).
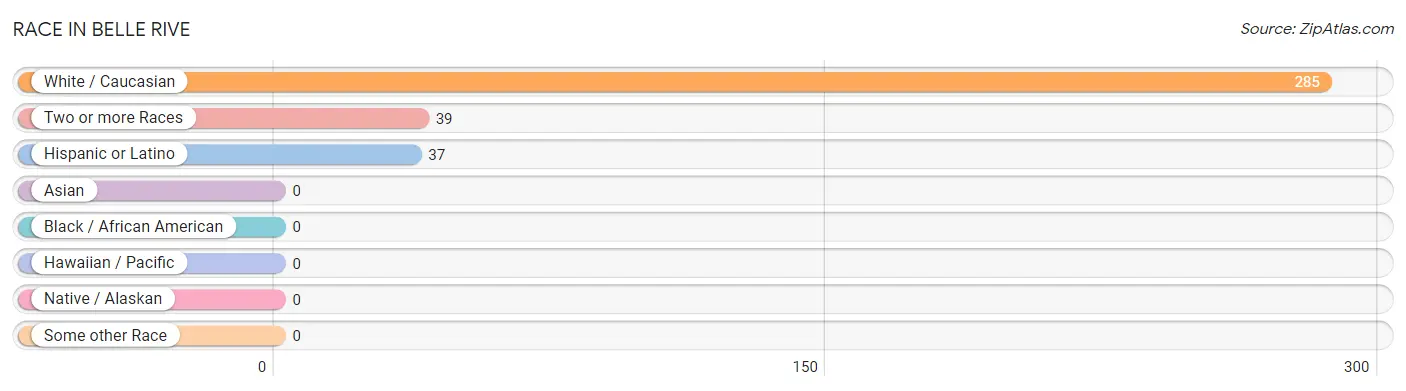
| Race | # Population | % Population |
| Asian | 0 | 0.0% |
| Black / African American | 0 | 0.0% |
| Hawaiian / Pacific | 0 | 0.0% |
| Hispanic or Latino | 37 | 11.4% |
| Native / Alaskan | 0 | 0.0% |
| White / Caucasian | 285 | 88.0% |
| Two or more Races | 39 | 12.0% |
| Some other Race | 0 | 0.0% |
| Total | 324 | 100.0% |
Ancestry in Belle Rive
The most populous ancestries reported in Belle Rive are German (61 | 18.8%), English (39 | 12.0%), Irish (34 | 10.5%), Puerto Rican (32 | 9.9%), and American (19 | 5.9%), together accounting for 57.1% of all Belle Rive residents.
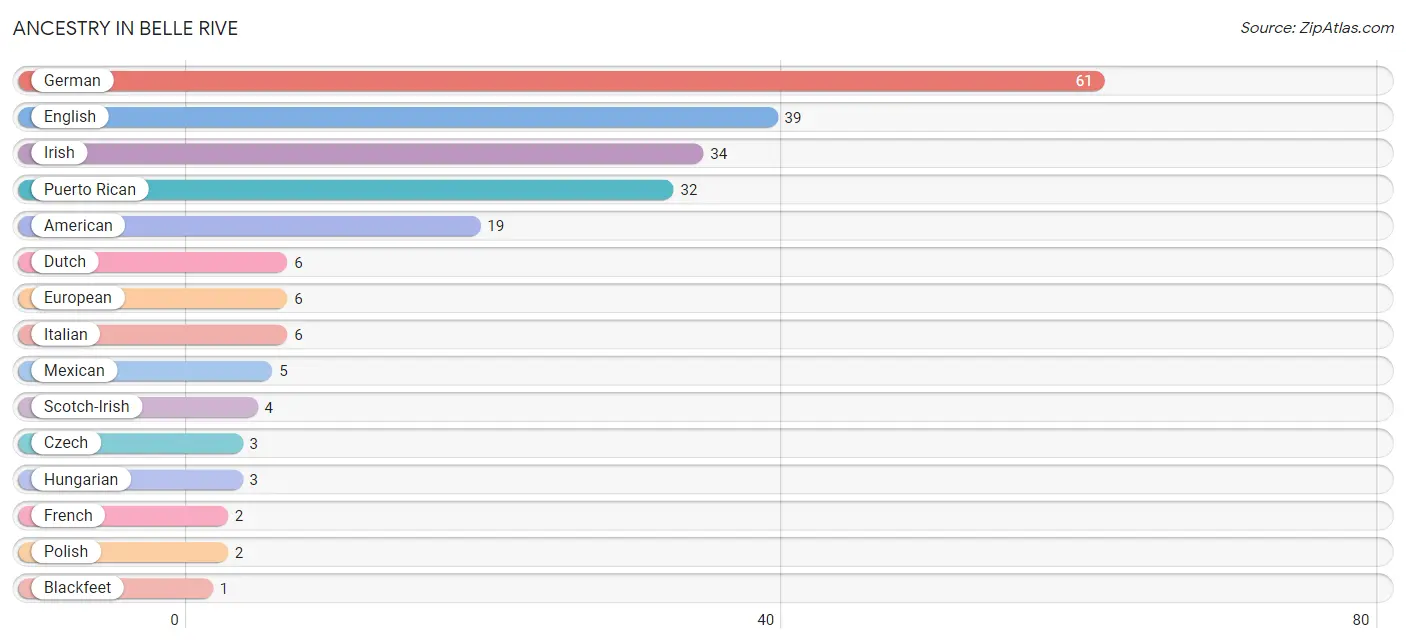
| Ancestry | # Population | % Population |
| American | 19 | 5.9% |
| Blackfeet | 1 | 0.3% |
| Czech | 3 | 0.9% |
| Dutch | 6 | 1.8% |
| English | 39 | 12.0% |
| European | 6 | 1.8% |
| French | 2 | 0.6% |
| German | 61 | 18.8% |
| Hungarian | 3 | 0.9% |
| Irish | 34 | 10.5% |
| Italian | 6 | 1.8% |
| Mexican | 5 | 1.5% |
| Polish | 2 | 0.6% |
| Puerto Rican | 32 | 9.9% |
| Scotch-Irish | 4 | 1.2% |
| Scottish | 1 | 0.3% | View All 16 Rows |
Immigrants in Belle Rive
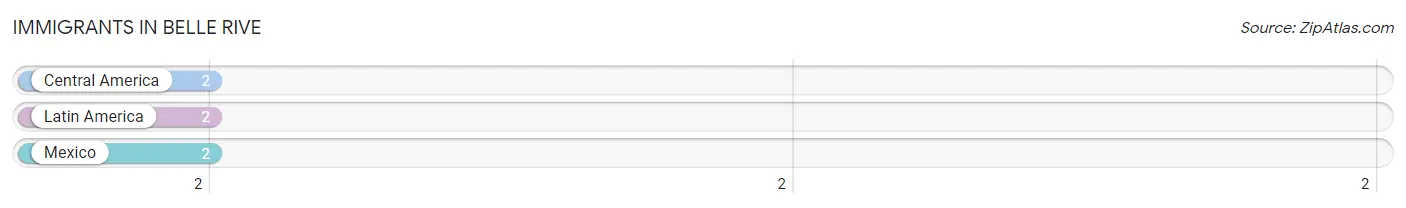
The most numerous immigrant groups reported in Belle Rive came from Central America (2 | 0.6%), Latin America (2 | 0.6%), and Mexico (2 | 0.6%), together accounting for 1.9% of all Belle Rive residents.
| Immigration Origin | # Population | % Population |
| Central America | 2 | 0.6% |
| Latin America | 2 | 0.6% |
| Mexico | 2 | 0.6% | View All 3 Rows |
Sex and Age in Belle Rive
Sex and Age in Belle Rive
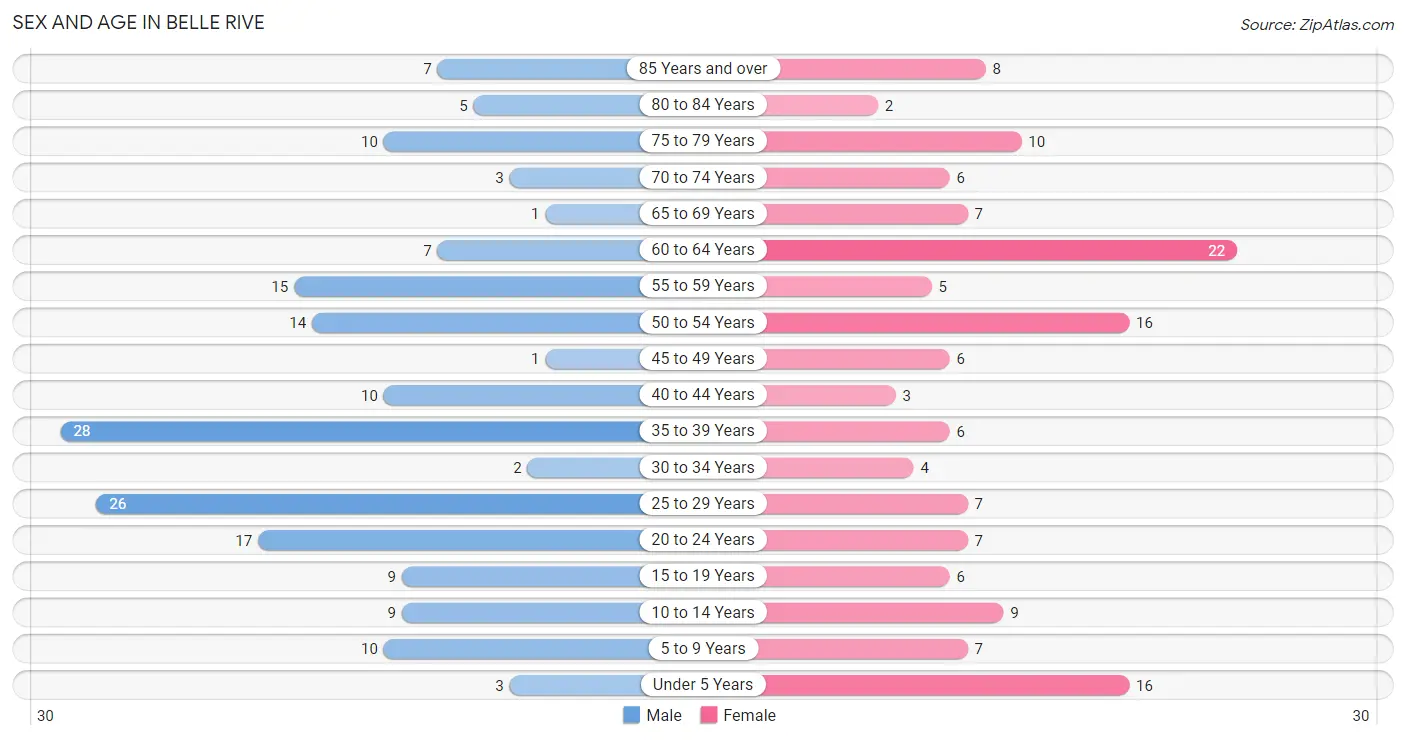
The most populous age groups in Belle Rive are 35 to 39 Years (28 | 15.8%) for men and 60 to 64 Years (22 | 15.0%) for women.
| Age Bracket | Male | Female |
| Under 5 Years | 3 (1.7%) | 16 (10.9%) |
| 5 to 9 Years | 10 (5.7%) | 7 (4.8%) |
| 10 to 14 Years | 9 (5.1%) | 9 (6.1%) |
| 15 to 19 Years | 9 (5.1%) | 6 (4.1%) |
| 20 to 24 Years | 17 (9.6%) | 7 (4.8%) |
| 25 to 29 Years | 26 (14.7%) | 7 (4.8%) |
| 30 to 34 Years | 2 (1.1%) | 4 (2.7%) |
| 35 to 39 Years | 28 (15.8%) | 6 (4.1%) |
| 40 to 44 Years | 10 (5.7%) | 3 (2.0%) |
| 45 to 49 Years | 1 (0.6%) | 6 (4.1%) |
| 50 to 54 Years | 14 (7.9%) | 16 (10.9%) |
| 55 to 59 Years | 15 (8.5%) | 5 (3.4%) |
| 60 to 64 Years | 7 (4.0%) | 22 (15.0%) |
| 65 to 69 Years | 1 (0.6%) | 7 (4.8%) |
| 70 to 74 Years | 3 (1.7%) | 6 (4.1%) |
| 75 to 79 Years | 10 (5.7%) | 10 (6.8%) |
| 80 to 84 Years | 5 (2.8%) | 2 (1.4%) |
| 85 Years and over | 7 (4.0%) | 8 (5.4%) |
| Total | 177 (100.0%) | 147 (100.0%) |
Families and Households in Belle Rive
Median Family Size in Belle Rive
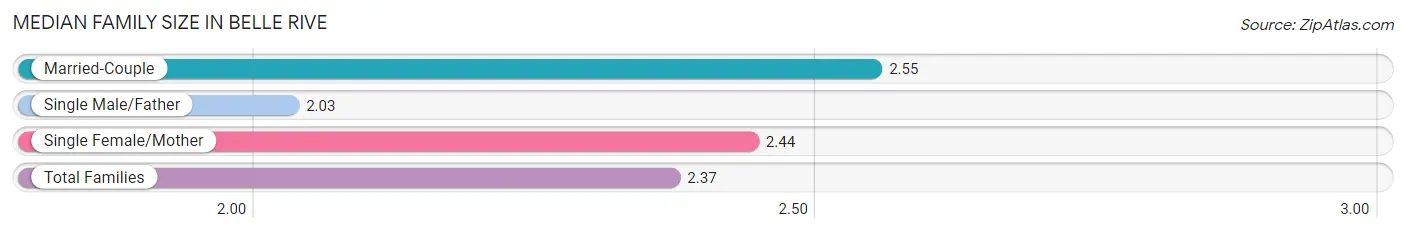
The median family size in Belle Rive is 2.37 persons per family, with married-couple families (49 | 50.0%) accounting for the largest median family size of 2.55 persons per family. On the other hand, single male/father families (31 | 31.6%) represent the smallest median family size with 2.03 persons per family.
| Family Type | # Families | Family Size |
| Married-Couple | 49 (50.0%) | 2.55 |
| Single Male/Father | 31 (31.6%) | 2.03 |
| Single Female/Mother | 18 (18.4%) | 2.44 |
| Total Families | 98 (100.0%) | 2.37 |
Median Household Size in Belle Rive
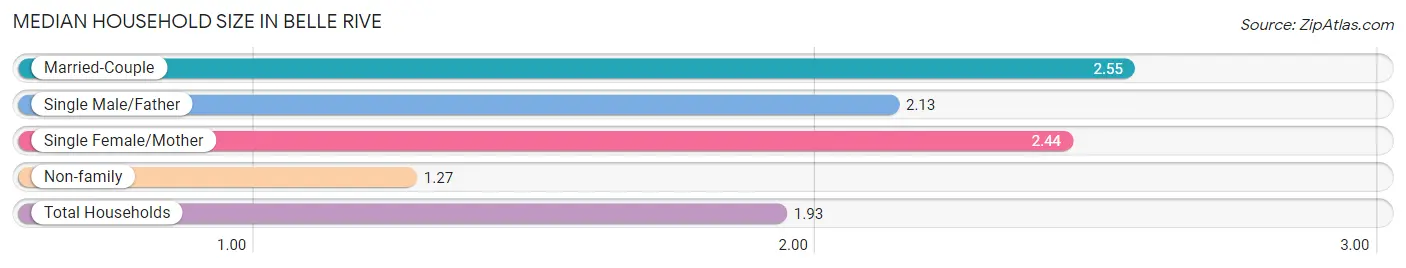
The median household size in Belle Rive is 1.93 persons per household, with married-couple households (49 | 29.2%) accounting for the largest median household size of 2.55 persons per household. non-family households (70 | 41.7%) represent the smallest median household size with 1.27 persons per household.
| Household Type | # Households | Household Size |
| Married-Couple | 49 (29.2%) | 2.55 |
| Single Male/Father | 31 (18.4%) | 2.13 |
| Single Female/Mother | 18 (10.7%) | 2.44 |
| Non-family | 70 (41.7%) | 1.27 |
| Total Households | 168 (100.0%) | 1.93 |
Household Size by Marriage Status in Belle Rive
Out of a total of 168 households in Belle Rive, 98 (58.3%) are family households, while 70 (41.7%) are nonfamily households. The most numerous type of family households are 2-person households, comprising 69, and the most common type of nonfamily households are 1-person households, comprising 52.
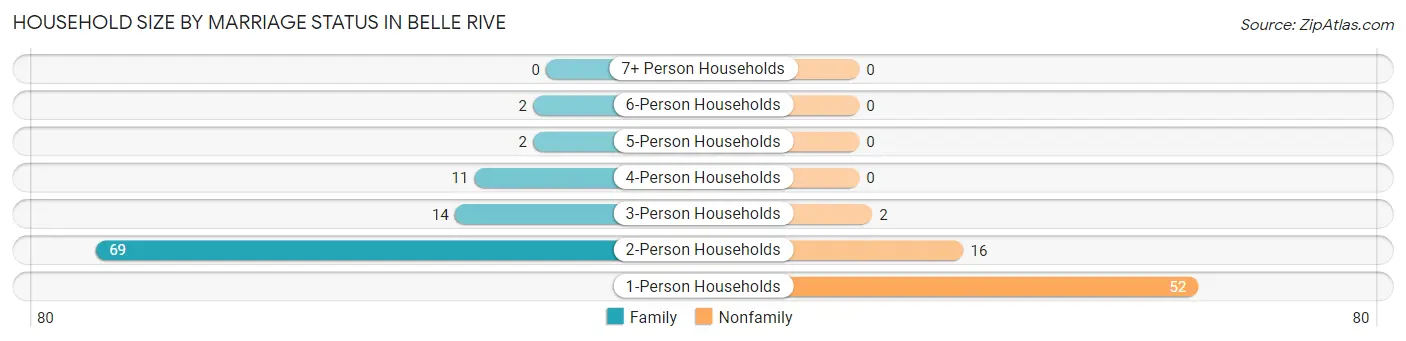
| Household Size | Family Households | Nonfamily Households |
| 1-Person Households | - | 52 (30.9%) |
| 2-Person Households | 69 (41.1%) | 16 (9.5%) |
| 3-Person Households | 14 (8.3%) | 2 (1.2%) |
| 4-Person Households | 11 (6.6%) | 0 (0.0%) |
| 5-Person Households | 2 (1.2%) | 0 (0.0%) |
| 6-Person Households | 2 (1.2%) | 0 (0.0%) |
| 7+ Person Households | 0 (0.0%) | 0 (0.0%) |
| Total | 98 (58.3%) | 70 (41.7%) |
Female Fertility in Belle Rive
Fertility by Age in Belle Rive
Average fertility rate in Belle Rive is 42.0 births per 1,000 women. Women in the age bracket of 20 to 34 years have the highest fertility rate with 111.0 births per 1,000 women. Women in the age bracket of 20 to 34 years acount for 100.0% of all women with births.
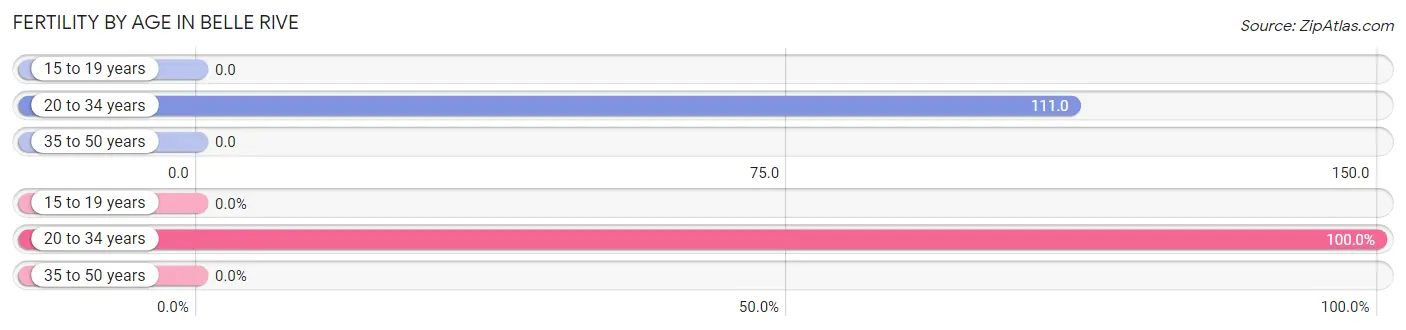
| Age Bracket | Women with Births | Births / 1,000 Women |
| 15 to 19 years | 0 (0.0%) | 0.0 |
| 20 to 34 years | 2 (100.0%) | 111.0 |
| 35 to 50 years | 0 (0.0%) | 0.0 |
| Total | 2 (100.0%) | 42.0 |
Fertility by Age by Marriage Status in Belle Rive
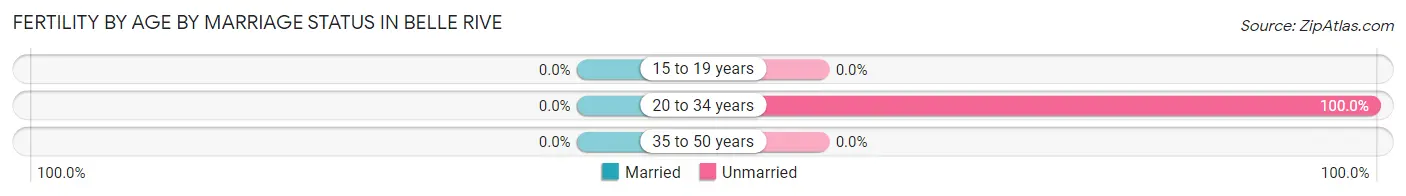
| Age Bracket | Married | Unmarried |
| 15 to 19 years | 0 (0.0%) | 0 (0.0%) |
| 20 to 34 years | 0 (0.0%) | 2 (100.0%) |
| 35 to 50 years | 0 (0.0%) | 0 (0.0%) |
| Total | 0 (0.0%) | 2 (100.0%) |
Fertility by Education in Belle Rive
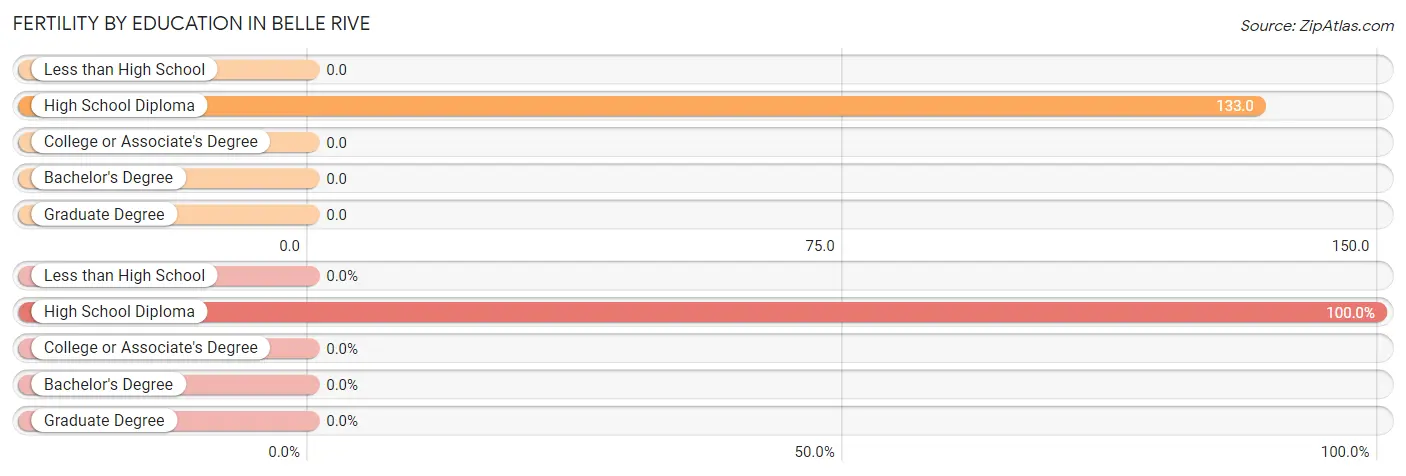
| Educational Attainment | Women with Births | Births / 1,000 Women |
| Less than High School | 0 (0.0%) | 0.0 |
| High School Diploma | 2 (100.0%) | 133.0 |
| College or Associate's Degree | 0 (0.0%) | 0.0 |
| Bachelor's Degree | 0 (0.0%) | 0.0 |
| Graduate Degree | 0 (0.0%) | 0.0 |
| Total | 2 (100.0%) | 42.0 |
Fertility by Education by Marriage Status in Belle Rive
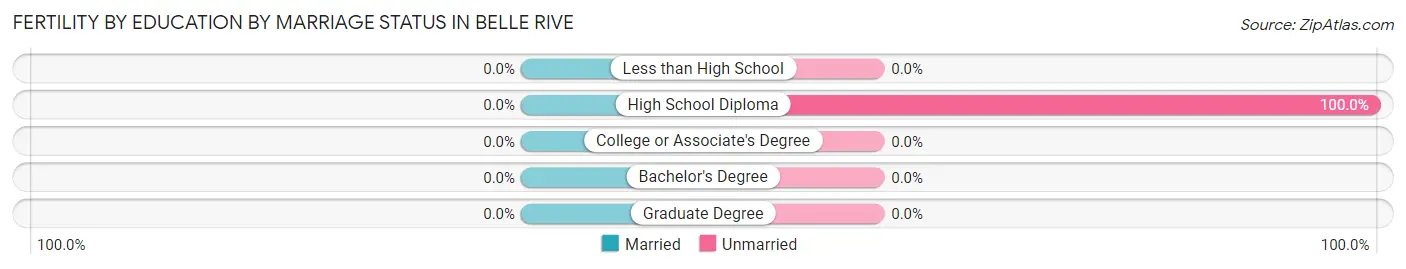
| Educational Attainment | Married | Unmarried |
| Less than High School | 0 (0.0%) | 0 (0.0%) |
| High School Diploma | 0 (0.0%) | 2 (100.0%) |
| College or Associate's Degree | 0 (0.0%) | 0 (0.0%) |
| Bachelor's Degree | 0 (0.0%) | 0 (0.0%) |
| Graduate Degree | 0 (0.0%) | 0 (0.0%) |
| Total | 0 (0.0%) | 2 (100.0%) |
Employment Characteristics in Belle Rive
Employment by Class of Employer in Belle Rive
Among the 169 employed individuals in Belle Rive, private company employees (121 | 71.6%), local government employees (14 | 8.3%), and self-employed (not incorporated) (12 | 7.1%) make up the most common classes of employment.
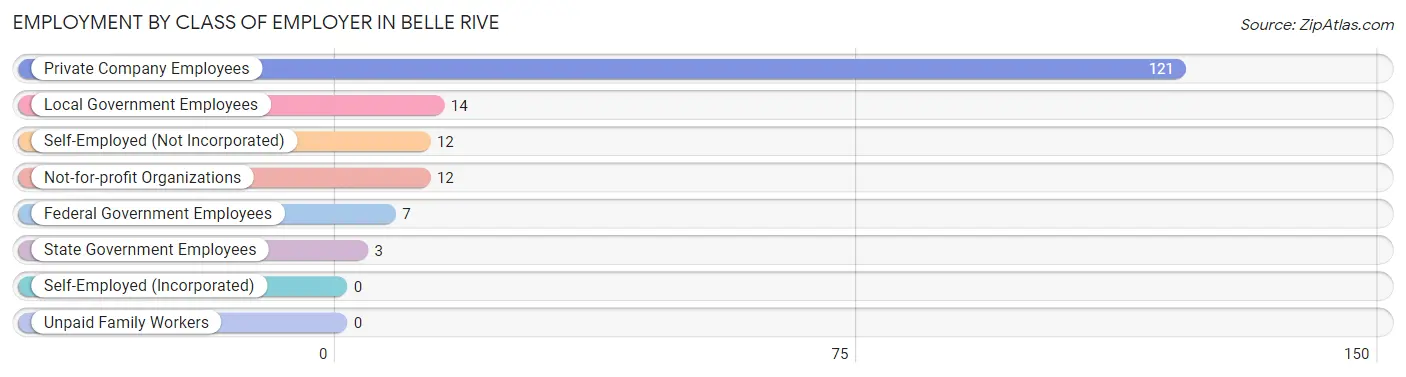
| Employer Class | # Employees | % Employees |
| Private Company Employees | 121 | 71.6% |
| Self-Employed (Incorporated) | 0 | 0.0% |
| Self-Employed (Not Incorporated) | 12 | 7.1% |
| Not-for-profit Organizations | 12 | 7.1% |
| Local Government Employees | 14 | 8.3% |
| State Government Employees | 3 | 1.8% |
| Federal Government Employees | 7 | 4.1% |
| Unpaid Family Workers | 0 | 0.0% |
| Total | 169 | 100.0% |
Employment Status by Age in Belle Rive
According to the labor force statistics for Belle Rive, out of the total population over 16 years of age (268), 69.0% or 185 individuals are in the labor force, with 3.2% or 6 of them unemployed. The age group with the highest labor force participation rate is 35 to 44 years, with 100.0% or 47 individuals in the labor force. Within the labor force, the 16 to 19 years age range has the highest percentage of unemployed individuals, with 33.3% or 3 of them being unemployed.
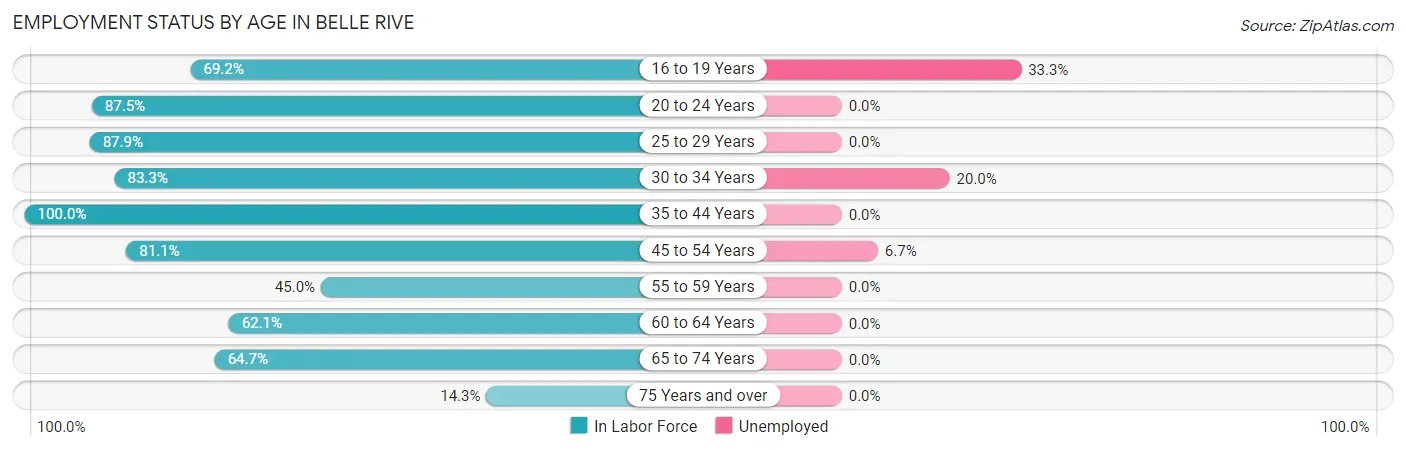
| Age Bracket | In Labor Force | Unemployed |
| 16 to 19 Years | 9 (69.2%) | 3 (33.3%) |
| 20 to 24 Years | 21 (87.5%) | 0 (0.0%) |
| 25 to 29 Years | 29 (87.9%) | 0 (0.0%) |
| 30 to 34 Years | 5 (83.3%) | 1 (20.0%) |
| 35 to 44 Years | 47 (100.0%) | 0 (0.0%) |
| 45 to 54 Years | 30 (81.1%) | 2 (6.7%) |
| 55 to 59 Years | 9 (45.0%) | 0 (0.0%) |
| 60 to 64 Years | 18 (62.1%) | 0 (0.0%) |
| 65 to 74 Years | 11 (64.7%) | 0 (0.0%) |
| 75 Years and over | 6 (14.3%) | 0 (0.0%) |
| Total | 185 (69.0%) | 6 (3.2%) |
Employment Status by Educational Attainment in Belle Rive
According to labor force statistics for Belle Rive, 80.2% of individuals (138) out of the total population between 25 and 64 years of age (172) are in the labor force, with 2.2% or 3 of them being unemployed. The group with the highest labor force participation rate are those with the educational attainment of high school diploma, with 82.8% or 53 individuals in the labor force. Within the labor force, individuals with less than high school education have the highest percentage of unemployment, with 14.3% or 1 of them being unemployed.
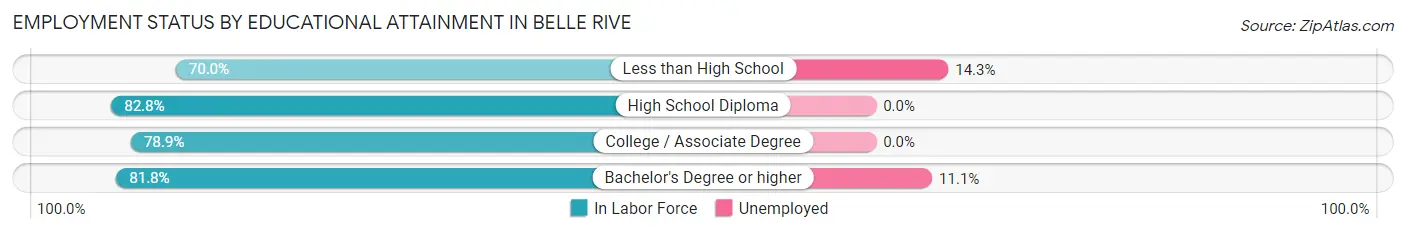
| Educational Attainment | In Labor Force | Unemployed |
| Less than High School | 7 (70.0%) | 1 (14.3%) |
| High School Diploma | 53 (82.8%) | 0 (0.0%) |
| College / Associate Degree | 60 (78.9%) | 0 (0.0%) |
| Bachelor's Degree or higher | 18 (81.8%) | 2 (11.1%) |
| Total | 138 (80.2%) | 4 (2.2%) |
Employment Occupations by Sex in Belle Rive
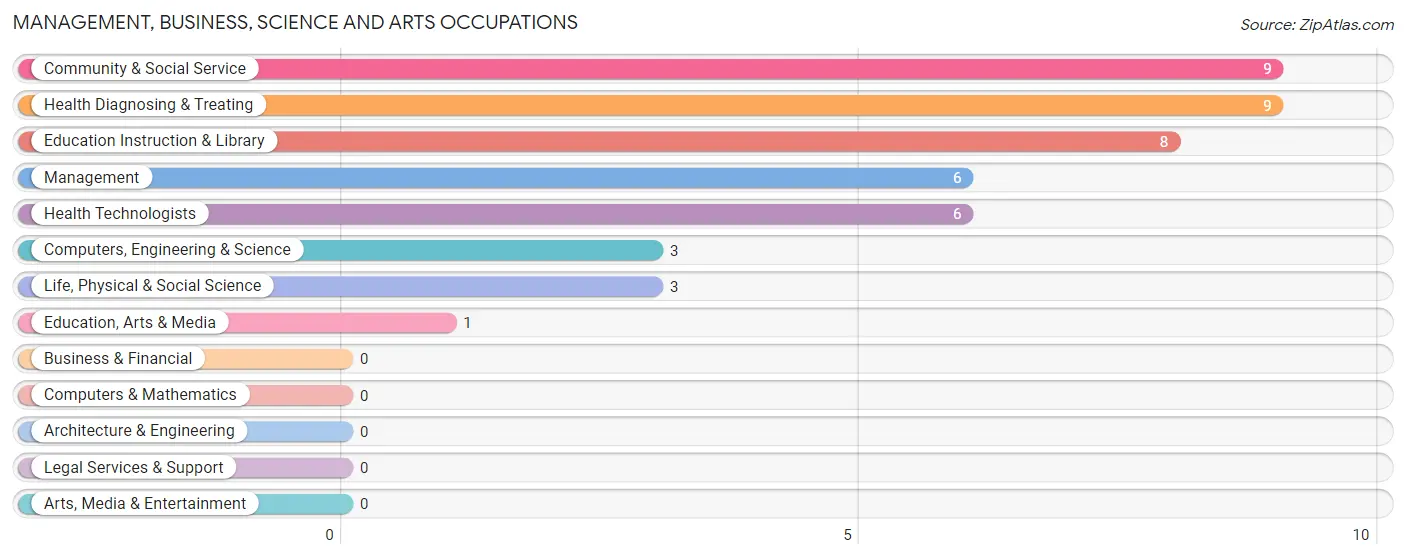
Management, Business, Science and Arts Occupations
The most common Management, Business, Science and Arts occupations in Belle Rive are Community & Social Service (9 | 5.0%), Health Diagnosing & Treating (9 | 5.0%), Education Instruction & Library (8 | 4.5%), Management (6 | 3.4%), and Health Technologists (6 | 3.4%).
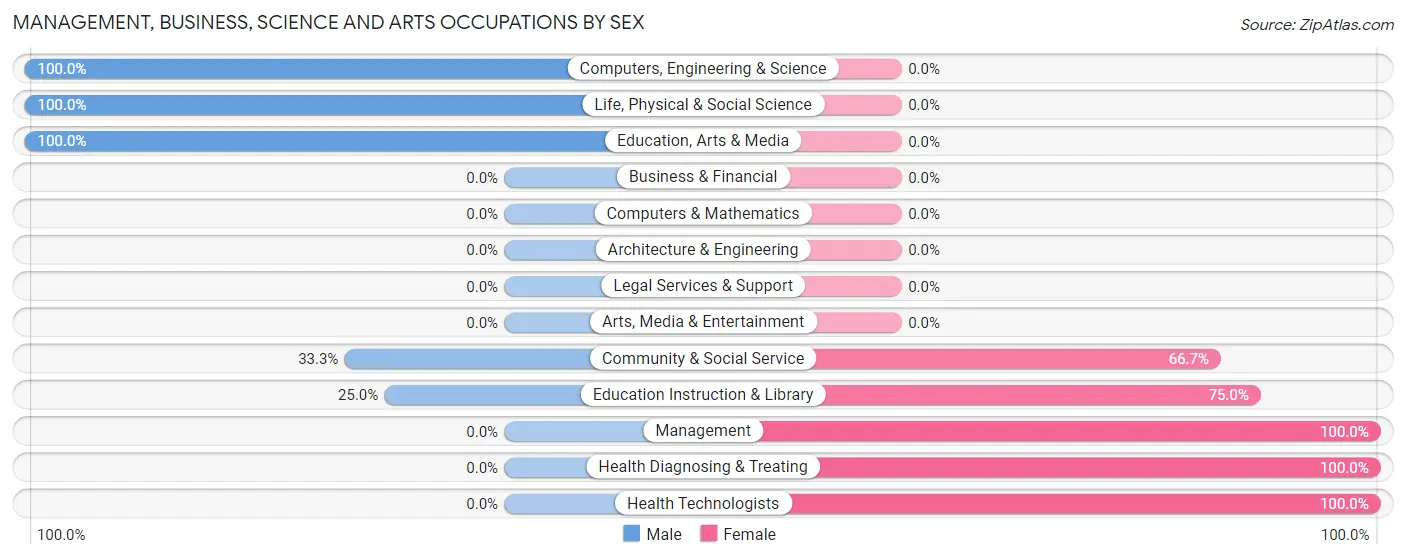
Management, Business, Science and Arts Occupations by Sex
Within the Management, Business, Science and Arts occupations in Belle Rive, the most male-oriented occupations are Computers, Engineering & Science (100.0%), Life, Physical & Social Science (100.0%), and Education, Arts & Media (100.0%), while the most female-oriented occupations are Management (100.0%), Health Diagnosing & Treating (100.0%), and Health Technologists (100.0%).
| Occupation | Male | Female |
| Management | 0 (0.0%) | 6 (100.0%) |
| Business & Financial | 0 (0.0%) | 0 (0.0%) |
| Computers, Engineering & Science | 3 (100.0%) | 0 (0.0%) |
| Computers & Mathematics | 0 (0.0%) | 0 (0.0%) |
| Architecture & Engineering | 0 (0.0%) | 0 (0.0%) |
| Life, Physical & Social Science | 3 (100.0%) | 0 (0.0%) |
| Community & Social Service | 3 (33.3%) | 6 (66.7%) |
| Education, Arts & Media | 1 (100.0%) | 0 (0.0%) |
| Legal Services & Support | 0 (0.0%) | 0 (0.0%) |
| Education Instruction & Library | 2 (25.0%) | 6 (75.0%) |
| Arts, Media & Entertainment | 0 (0.0%) | 0 (0.0%) |
| Health Diagnosing & Treating | 0 (0.0%) | 9 (100.0%) |
| Health Technologists | 0 (0.0%) | 6 (100.0%) |
| Total (Category) | 6 (22.2%) | 21 (77.8%) |
| Total (Overall) | 104 (58.1%) | 75 (41.9%) |
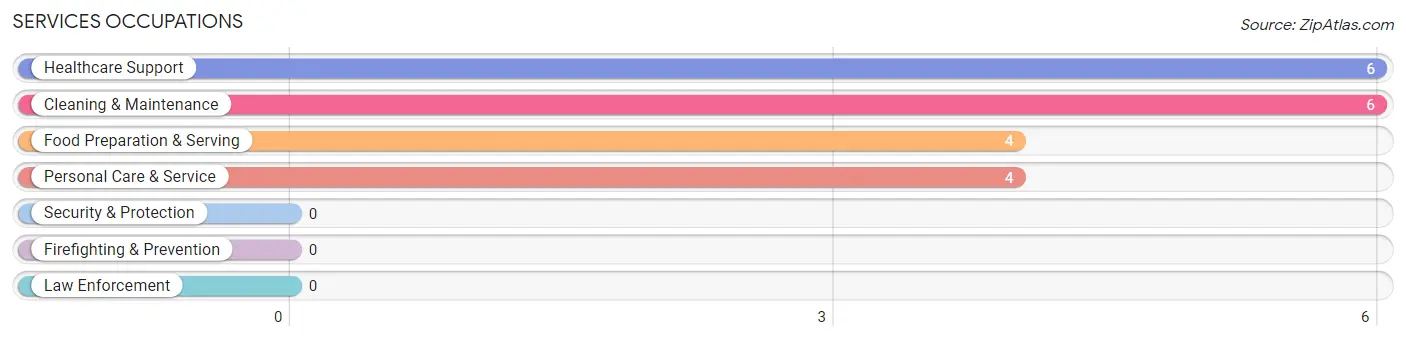
Services Occupations
The most common Services occupations in Belle Rive are Healthcare Support (6 | 3.4%), Cleaning & Maintenance (6 | 3.4%), Food Preparation & Serving (4 | 2.2%), and Personal Care & Service (4 | 2.2%).
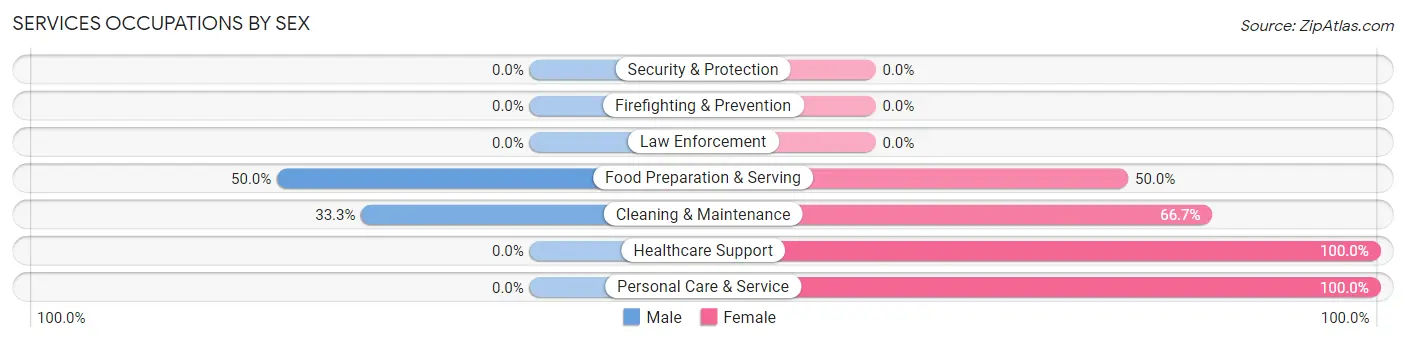
Services Occupations by Sex
Within the Services occupations in Belle Rive, the most male-oriented occupations are Food Preparation & Serving (50.0%), and Cleaning & Maintenance (33.3%), while the most female-oriented occupations are Healthcare Support (100.0%), Personal Care & Service (100.0%), and Cleaning & Maintenance (66.7%).
| Occupation | Male | Female |
| Healthcare Support | 0 (0.0%) | 6 (100.0%) |
| Security & Protection | 0 (0.0%) | 0 (0.0%) |
| Firefighting & Prevention | 0 (0.0%) | 0 (0.0%) |
| Law Enforcement | 0 (0.0%) | 0 (0.0%) |
| Food Preparation & Serving | 2 (50.0%) | 2 (50.0%) |
| Cleaning & Maintenance | 2 (33.3%) | 4 (66.7%) |
| Personal Care & Service | 0 (0.0%) | 4 (100.0%) |
| Total (Category) | 4 (20.0%) | 16 (80.0%) |
| Total (Overall) | 104 (58.1%) | 75 (41.9%) |
Sales and Office Occupations
The most common Sales and Office occupations in Belle Rive are Office & Administration (23 | 12.9%), and Sales & Related (14 | 7.8%).

Sales and Office Occupations by Sex

| Occupation | Male | Female |
| Sales & Related | 5 (35.7%) | 9 (64.3%) |
| Office & Administration | 0 (0.0%) | 23 (100.0%) |
| Total (Category) | 5 (13.5%) | 32 (86.5%) |
| Total (Overall) | 104 (58.1%) | 75 (41.9%) |
Natural Resources, Construction and Maintenance Occupations
The most common Natural Resources, Construction and Maintenance occupations in Belle Rive are Construction & Extraction (17 | 9.5%), and Installation, Maintenance & Repair (5 | 2.8%).
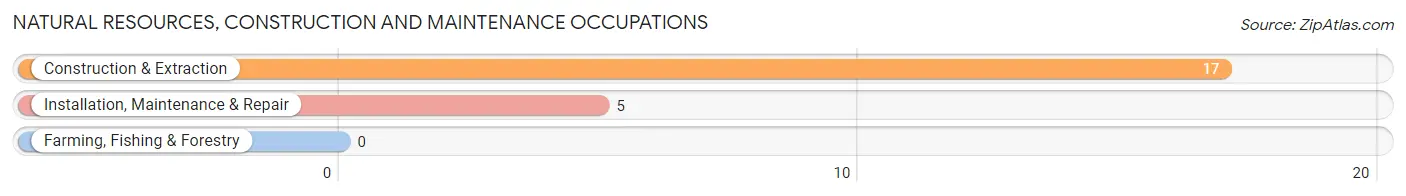
Natural Resources, Construction and Maintenance Occupations by Sex

| Occupation | Male | Female |
| Farming, Fishing & Forestry | 0 (0.0%) | 0 (0.0%) |
| Construction & Extraction | 17 (100.0%) | 0 (0.0%) |
| Installation, Maintenance & Repair | 5 (100.0%) | 0 (0.0%) |
| Total (Category) | 22 (100.0%) | 0 (0.0%) |
| Total (Overall) | 104 (58.1%) | 75 (41.9%) |
Production, Transportation and Moving Occupations
The most common Production, Transportation and Moving occupations in Belle Rive are Material Moving (34 | 19.0%), Production (33 | 18.4%), and Transportation (6 | 3.4%).
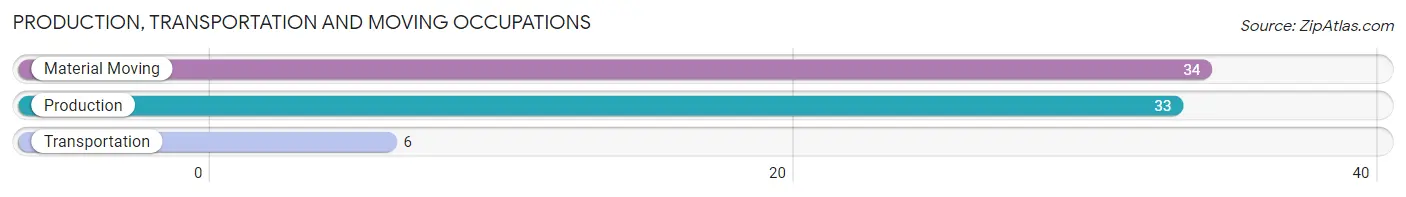
Production, Transportation and Moving Occupations by Sex
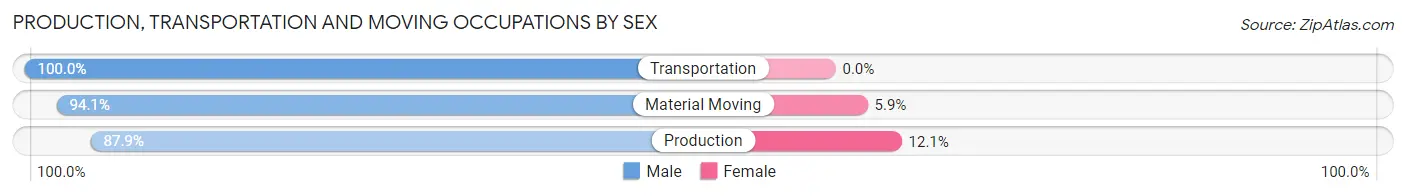
| Occupation | Male | Female |
| Production | 29 (87.9%) | 4 (12.1%) |
| Transportation | 6 (100.0%) | 0 (0.0%) |
| Material Moving | 32 (94.1%) | 2 (5.9%) |
| Total (Category) | 67 (91.8%) | 6 (8.2%) |
| Total (Overall) | 104 (58.1%) | 75 (41.9%) |
Employment Industries by Sex in Belle Rive
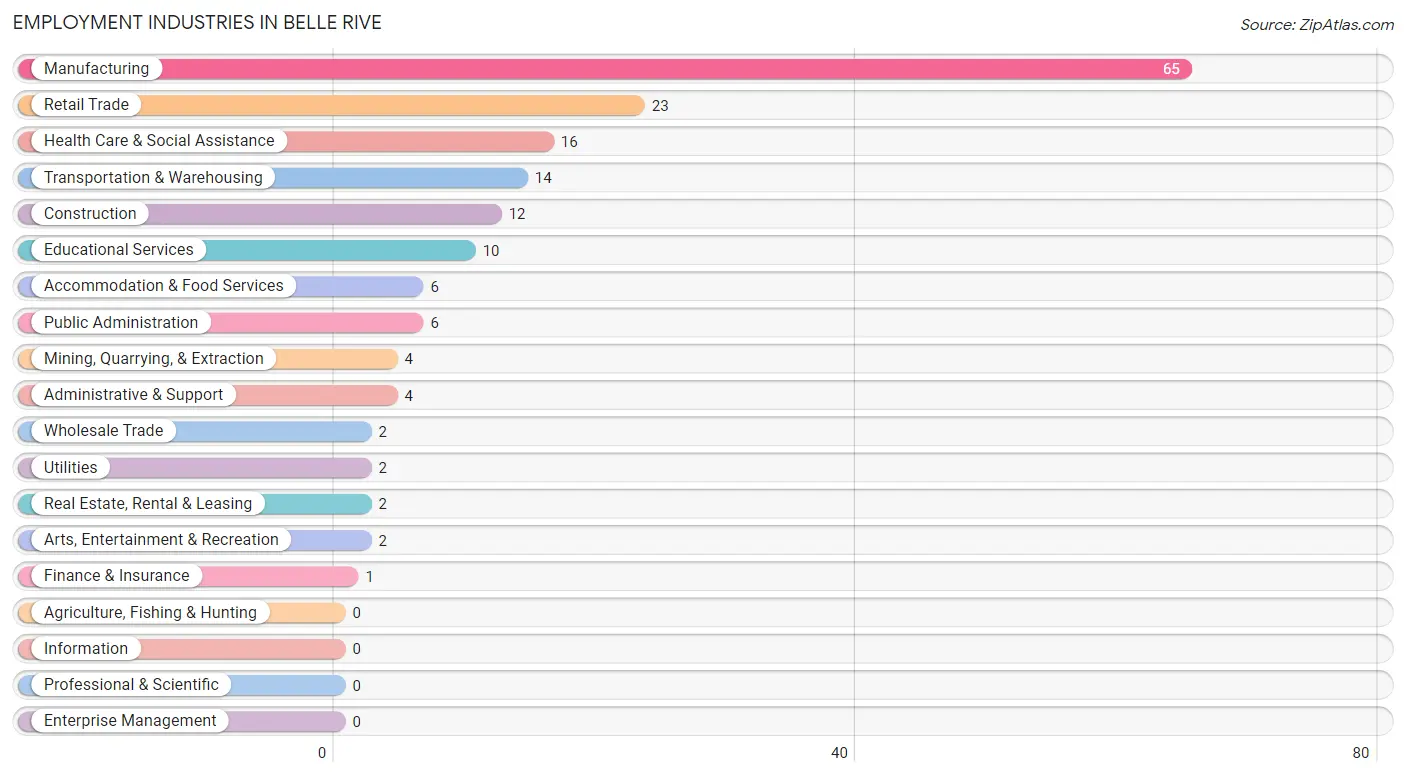
Employment Industries in Belle Rive
The major employment industries in Belle Rive include Manufacturing (65 | 36.3%), Retail Trade (23 | 12.9%), Health Care & Social Assistance (16 | 8.9%), Transportation & Warehousing (14 | 7.8%), and Construction (12 | 6.7%).
Employment Industries by Sex in Belle Rive
The Belle Rive industries that see more men than women are Mining, Quarrying, & Extraction (100.0%), Construction (100.0%), and Real Estate, Rental & Leasing (100.0%), whereas the industries that tend to have a higher number of women are Wholesale Trade (100.0%), Utilities (100.0%), and Finance & Insurance (100.0%).
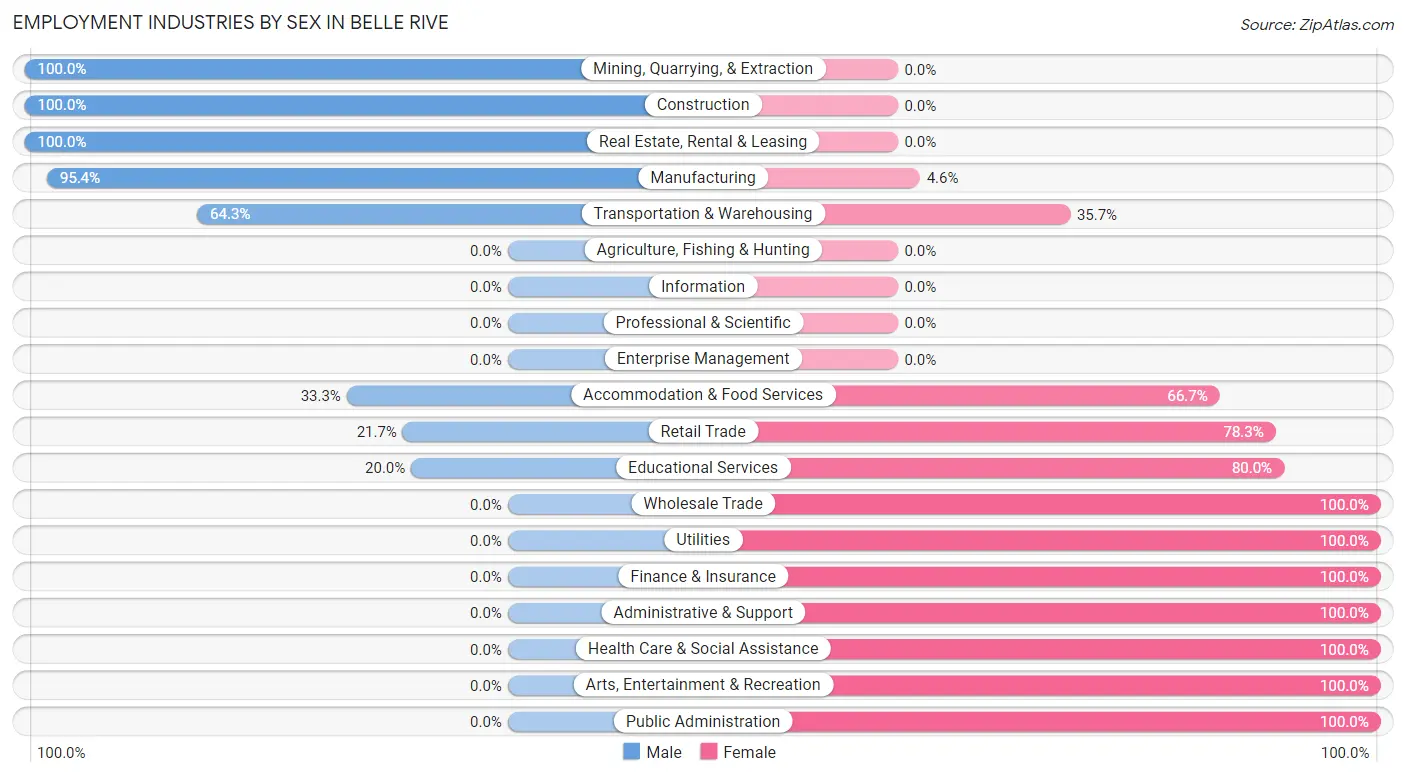
| Industry | Male | Female |
| Agriculture, Fishing & Hunting | 0 (0.0%) | 0 (0.0%) |
| Mining, Quarrying, & Extraction | 4 (100.0%) | 0 (0.0%) |
| Construction | 12 (100.0%) | 0 (0.0%) |
| Manufacturing | 62 (95.4%) | 3 (4.6%) |
| Wholesale Trade | 0 (0.0%) | 2 (100.0%) |
| Retail Trade | 5 (21.7%) | 18 (78.3%) |
| Transportation & Warehousing | 9 (64.3%) | 5 (35.7%) |
| Utilities | 0 (0.0%) | 2 (100.0%) |
| Information | 0 (0.0%) | 0 (0.0%) |
| Finance & Insurance | 0 (0.0%) | 1 (100.0%) |
| Real Estate, Rental & Leasing | 2 (100.0%) | 0 (0.0%) |
| Professional & Scientific | 0 (0.0%) | 0 (0.0%) |
| Enterprise Management | 0 (0.0%) | 0 (0.0%) |
| Administrative & Support | 0 (0.0%) | 4 (100.0%) |
| Educational Services | 2 (20.0%) | 8 (80.0%) |
| Health Care & Social Assistance | 0 (0.0%) | 16 (100.0%) |
| Arts, Entertainment & Recreation | 0 (0.0%) | 2 (100.0%) |
| Accommodation & Food Services | 2 (33.3%) | 4 (66.7%) |
| Public Administration | 0 (0.0%) | 6 (100.0%) |
| Total | 104 (58.1%) | 75 (41.9%) |
Education in Belle Rive
School Enrollment in Belle Rive
The most common levels of schooling among the 48 students in Belle Rive are middle school (17 | 35.4%), elementary school (10 | 20.8%), and college / undergraduate (8 | 16.7%).
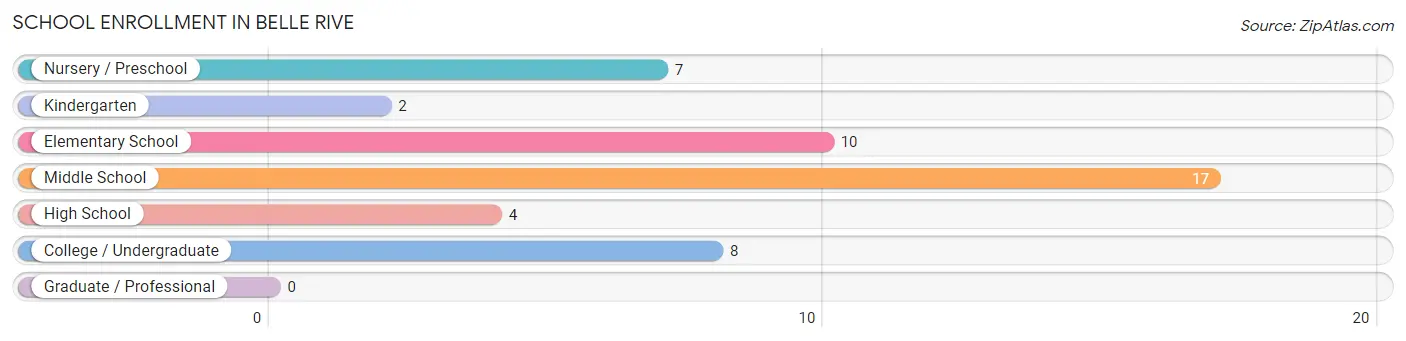
| School Level | # Students | % Students |
| Nursery / Preschool | 7 | 14.6% |
| Kindergarten | 2 | 4.2% |
| Elementary School | 10 | 20.8% |
| Middle School | 17 | 35.4% |
| High School | 4 | 8.3% |
| College / Undergraduate | 8 | 16.7% |
| Graduate / Professional | 0 | 0.0% |
| Total | 48 | 100.0% |
School Enrollment by Age by Funding Source in Belle Rive
Out of a total of 48 students who are enrolled in schools in Belle Rive, 11 (22.9%) attend a private institution, while the remaining 37 (77.1%) are enrolled in public schools. The age group of 25 to 34 year olds has the highest likelihood of being enrolled in private schools, with 2 (100.0% in the age bracket) enrolled. Conversely, the age group of 3 to 4 year olds has the lowest likelihood of being enrolled in a private school, with 2 (100.0% in the age bracket) attending a public institution.
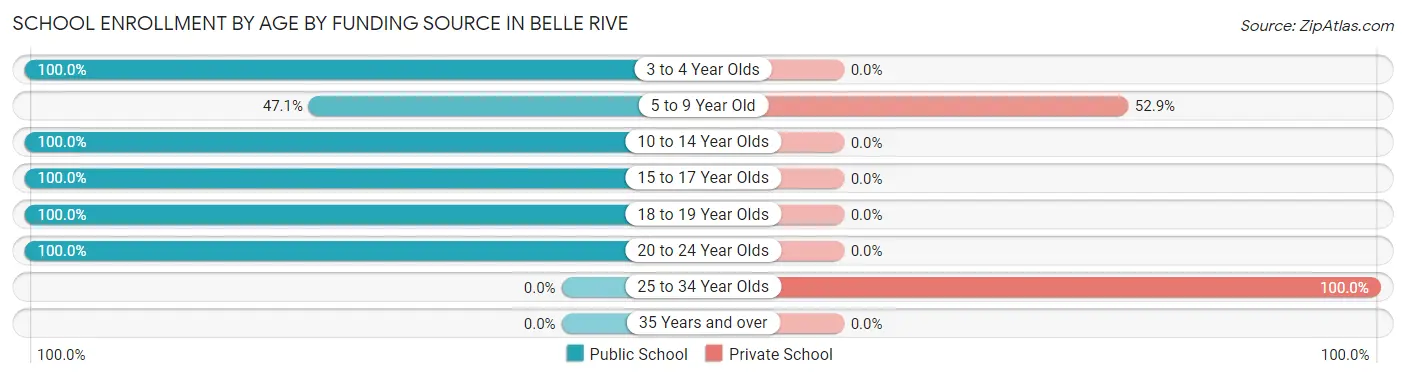
| Age Bracket | Public School | Private School |
| 3 to 4 Year Olds | 2 (100.0%) | 0 (0.0%) |
| 5 to 9 Year Old | 8 (47.1%) | 9 (52.9%) |
| 10 to 14 Year Olds | 17 (100.0%) | 0 (0.0%) |
| 15 to 17 Year Olds | 4 (100.0%) | 0 (0.0%) |
| 18 to 19 Year Olds | 5 (100.0%) | 0 (0.0%) |
| 20 to 24 Year Olds | 1 (100.0%) | 0 (0.0%) |
| 25 to 34 Year Olds | 0 (0.0%) | 2 (100.0%) |
| 35 Years and over | 0 (0.0%) | 0 (0.0%) |
| Total | 37 (77.1%) | 11 (22.9%) |
Educational Attainment by Field of Study in Belle Rive
Arts & humanities (11 | 35.5%), education (10 | 32.3%), business (6 | 19.4%), liberal arts & history (2 | 6.5%), and psychology (1 | 3.2%) are the most common fields of study among 31 individuals in Belle Rive who have obtained a bachelor's degree or higher.
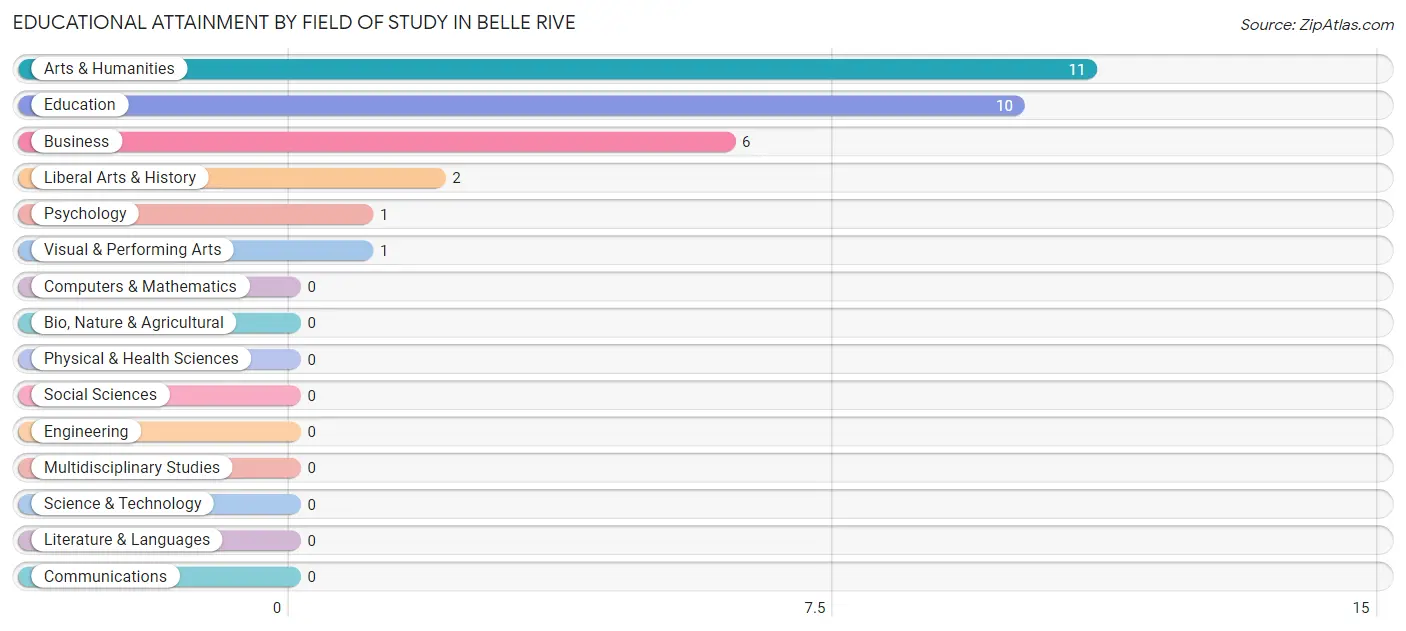
| Field of Study | # Graduates | % Graduates |
| Computers & Mathematics | 0 | 0.0% |
| Bio, Nature & Agricultural | 0 | 0.0% |
| Physical & Health Sciences | 0 | 0.0% |
| Psychology | 1 | 3.2% |
| Social Sciences | 0 | 0.0% |
| Engineering | 0 | 0.0% |
| Multidisciplinary Studies | 0 | 0.0% |
| Science & Technology | 0 | 0.0% |
| Business | 6 | 19.4% |
| Education | 10 | 32.3% |
| Literature & Languages | 0 | 0.0% |
| Liberal Arts & History | 2 | 6.5% |
| Visual & Performing Arts | 1 | 3.2% |
| Communications | 0 | 0.0% |
| Arts & Humanities | 11 | 35.5% |
| Total | 31 | 100.0% |
Transportation & Commute in Belle Rive
Vehicle Availability by Sex in Belle Rive
The most prevalent vehicle ownership categories in Belle Rive are males with 2 vehicles (29, accounting for 29.6%) and females with 2 vehicles (25, making up 40.8%).
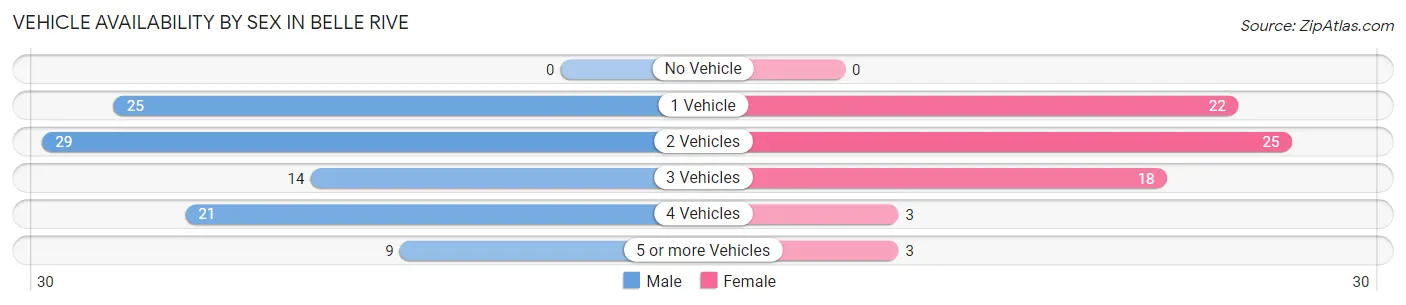
| Vehicles Available | Male | Female |
| No Vehicle | 0 (0.0%) | 0 (0.0%) |
| 1 Vehicle | 25 (25.5%) | 22 (31.0%) |
| 2 Vehicles | 29 (29.6%) | 25 (35.2%) |
| 3 Vehicles | 14 (14.3%) | 18 (25.4%) |
| 4 Vehicles | 21 (21.4%) | 3 (4.2%) |
| 5 or more Vehicles | 9 (9.2%) | 3 (4.2%) |
| Total | 98 (100.0%) | 71 (100.0%) |
Commute Time in Belle Rive
The most frequently occuring commute durations in Belle Rive are 20 to 24 minutes (50 commuters, 29.9%), 15 to 19 minutes (42 commuters, 25.2%), and 10 to 14 minutes (31 commuters, 18.6%).
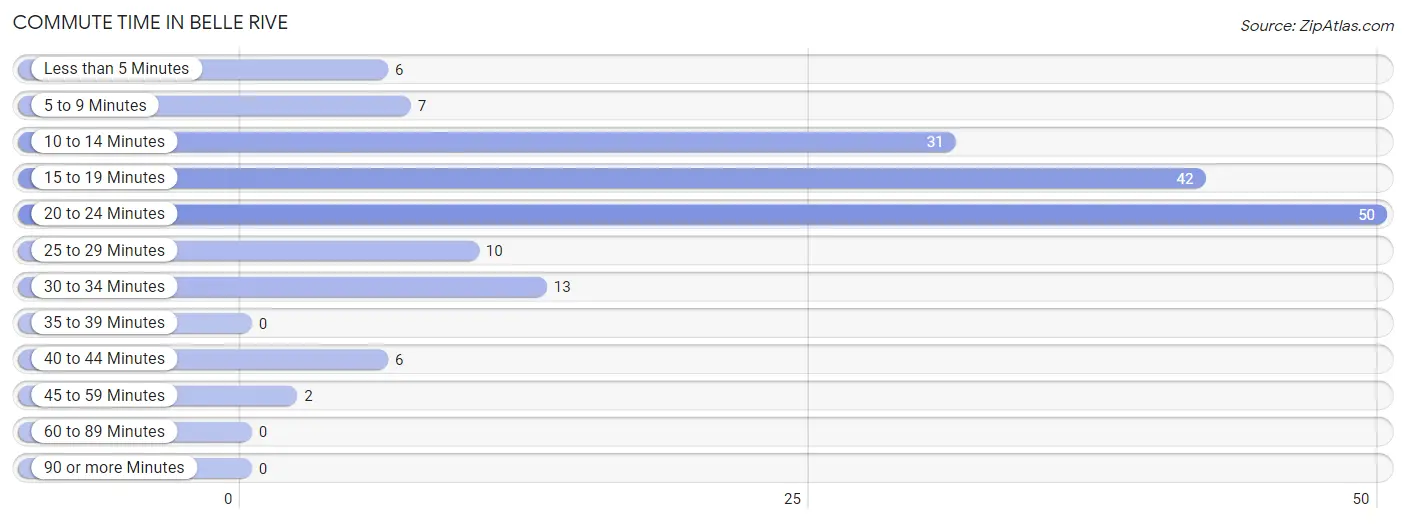
| Commute Time | # Commuters | % Commuters |
| Less than 5 Minutes | 6 | 3.6% |
| 5 to 9 Minutes | 7 | 4.2% |
| 10 to 14 Minutes | 31 | 18.6% |
| 15 to 19 Minutes | 42 | 25.2% |
| 20 to 24 Minutes | 50 | 29.9% |
| 25 to 29 Minutes | 10 | 6.0% |
| 30 to 34 Minutes | 13 | 7.8% |
| 35 to 39 Minutes | 0 | 0.0% |
| 40 to 44 Minutes | 6 | 3.6% |
| 45 to 59 Minutes | 2 | 1.2% |
| 60 to 89 Minutes | 0 | 0.0% |
| 90 or more Minutes | 0 | 0.0% |
Commute Time by Sex in Belle Rive
The most common commute times in Belle Rive are 15 to 19 minutes (31 commuters, 31.6%) for males and 20 to 24 minutes (26 commuters, 37.7%) for females.
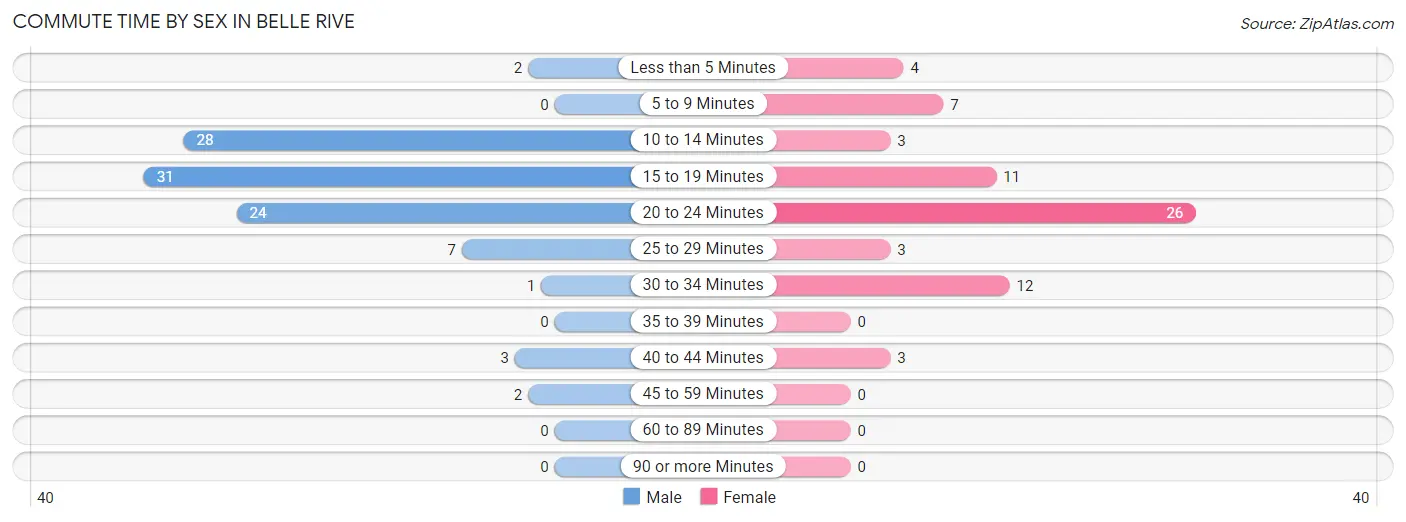
| Commute Time | Male | Female |
| Less than 5 Minutes | 2 (2.0%) | 4 (5.8%) |
| 5 to 9 Minutes | 0 (0.0%) | 7 (10.1%) |
| 10 to 14 Minutes | 28 (28.6%) | 3 (4.3%) |
| 15 to 19 Minutes | 31 (31.6%) | 11 (15.9%) |
| 20 to 24 Minutes | 24 (24.5%) | 26 (37.7%) |
| 25 to 29 Minutes | 7 (7.1%) | 3 (4.3%) |
| 30 to 34 Minutes | 1 (1.0%) | 12 (17.4%) |
| 35 to 39 Minutes | 0 (0.0%) | 0 (0.0%) |
| 40 to 44 Minutes | 3 (3.1%) | 3 (4.3%) |
| 45 to 59 Minutes | 2 (2.0%) | 0 (0.0%) |
| 60 to 89 Minutes | 0 (0.0%) | 0 (0.0%) |
| 90 or more Minutes | 0 (0.0%) | 0 (0.0%) |
Time of Departure to Work by Sex in Belle Rive
The most frequent times of departure to work in Belle Rive are 12:00 PM to 3:59 PM (35, 35.7%) for males and 7:30 AM to 7:59 AM (16, 23.2%) for females.
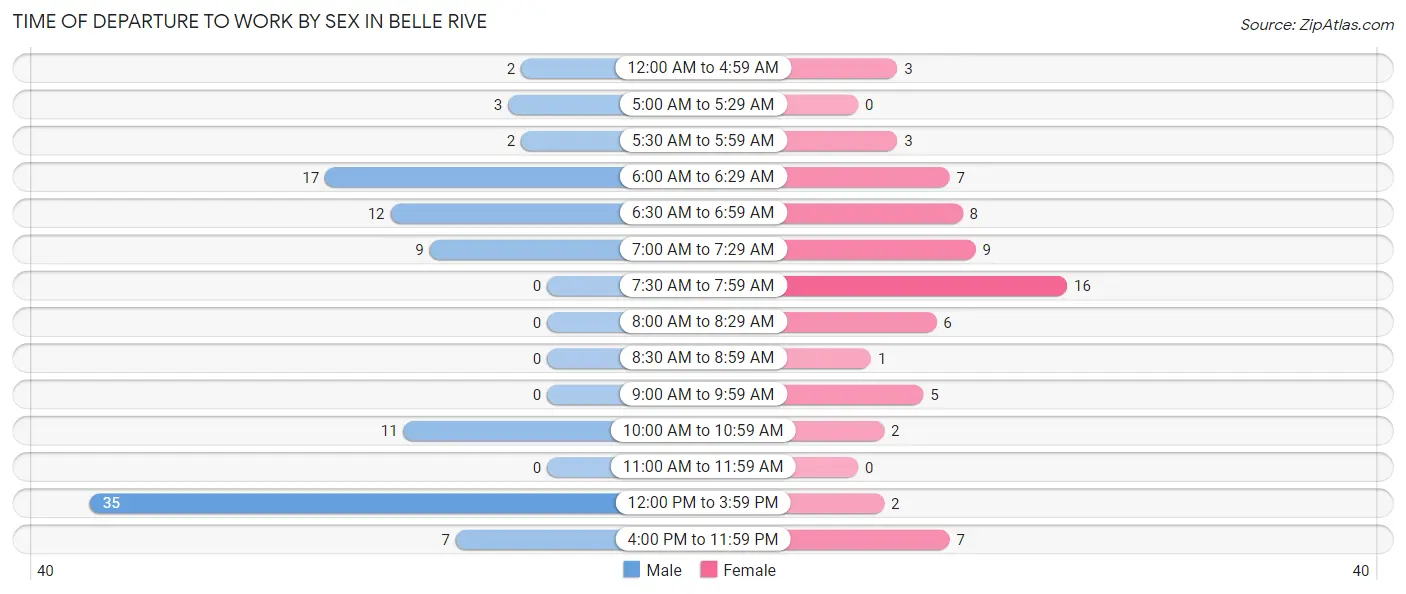
| Time of Departure | Male | Female |
| 12:00 AM to 4:59 AM | 2 (2.0%) | 3 (4.3%) |
| 5:00 AM to 5:29 AM | 3 (3.1%) | 0 (0.0%) |
| 5:30 AM to 5:59 AM | 2 (2.0%) | 3 (4.3%) |
| 6:00 AM to 6:29 AM | 17 (17.3%) | 7 (10.1%) |
| 6:30 AM to 6:59 AM | 12 (12.2%) | 8 (11.6%) |
| 7:00 AM to 7:29 AM | 9 (9.2%) | 9 (13.0%) |
| 7:30 AM to 7:59 AM | 0 (0.0%) | 16 (23.2%) |
| 8:00 AM to 8:29 AM | 0 (0.0%) | 6 (8.7%) |
| 8:30 AM to 8:59 AM | 0 (0.0%) | 1 (1.5%) |
| 9:00 AM to 9:59 AM | 0 (0.0%) | 5 (7.2%) |
| 10:00 AM to 10:59 AM | 11 (11.2%) | 2 (2.9%) |
| 11:00 AM to 11:59 AM | 0 (0.0%) | 0 (0.0%) |
| 12:00 PM to 3:59 PM | 35 (35.7%) | 2 (2.9%) |
| 4:00 PM to 11:59 PM | 7 (7.1%) | 7 (10.1%) |
| Total | 98 (100.0%) | 69 (100.0%) |
Housing Occupancy in Belle Rive
Occupancy by Ownership in Belle Rive
Of the total 168 dwellings in Belle Rive, owner-occupied units account for 126 (75.0%), while renter-occupied units make up 42 (25.0%).
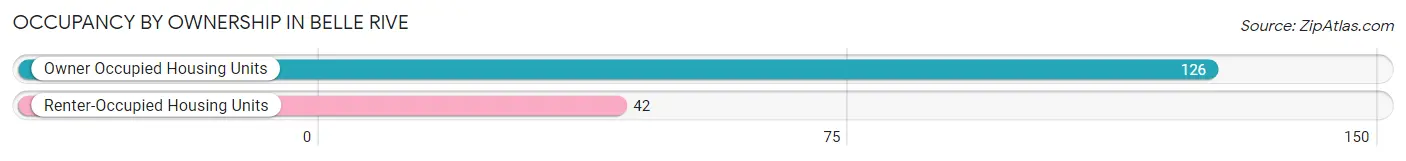
| Occupancy | # Housing Units | % Housing Units |
| Owner Occupied Housing Units | 126 | 75.0% |
| Renter-Occupied Housing Units | 42 | 25.0% |
| Total Occupied Housing Units | 168 | 100.0% |
Occupancy by Household Size in Belle Rive
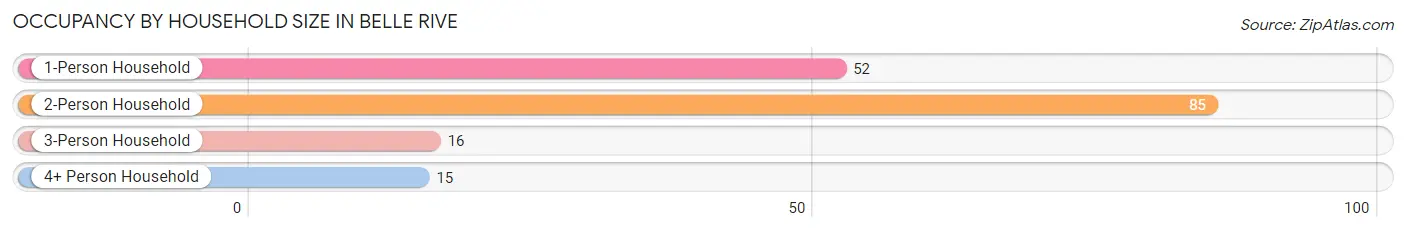
| Household Size | # Housing Units | % Housing Units |
| 1-Person Household | 52 | 30.9% |
| 2-Person Household | 85 | 50.6% |
| 3-Person Household | 16 | 9.5% |
| 4+ Person Household | 15 | 8.9% |
| Total Housing Units | 168 | 100.0% |
Occupancy by Ownership by Household Size in Belle Rive
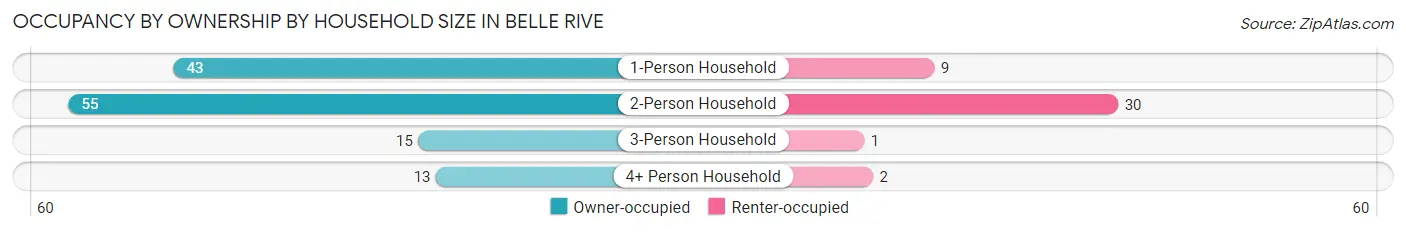
| Household Size | Owner-occupied | Renter-occupied |
| 1-Person Household | 43 (82.7%) | 9 (17.3%) |
| 2-Person Household | 55 (64.7%) | 30 (35.3%) |
| 3-Person Household | 15 (93.8%) | 1 (6.2%) |
| 4+ Person Household | 13 (86.7%) | 2 (13.3%) |
| Total Housing Units | 126 (75.0%) | 42 (25.0%) |
Occupancy by Educational Attainment in Belle Rive
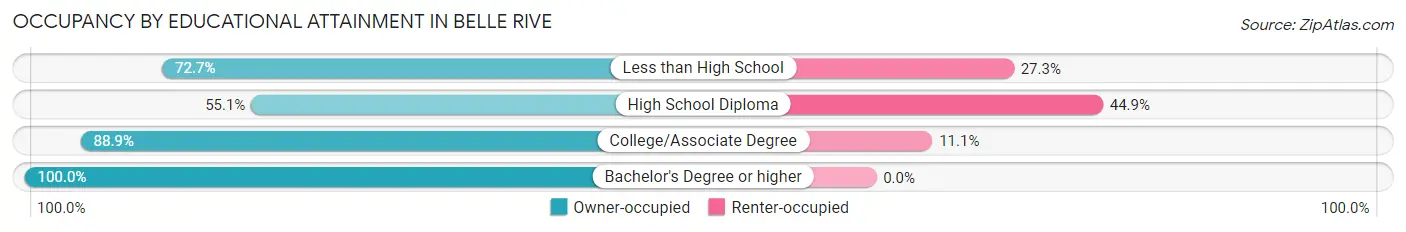
| Household Size | Owner-occupied | Renter-occupied |
| Less than High School | 8 (72.7%) | 3 (27.3%) |
| High School Diploma | 38 (55.1%) | 31 (44.9%) |
| College/Associate Degree | 64 (88.9%) | 8 (11.1%) |
| Bachelor's Degree or higher | 16 (100.0%) | 0 (0.0%) |
Occupancy by Age of Householder in Belle Rive
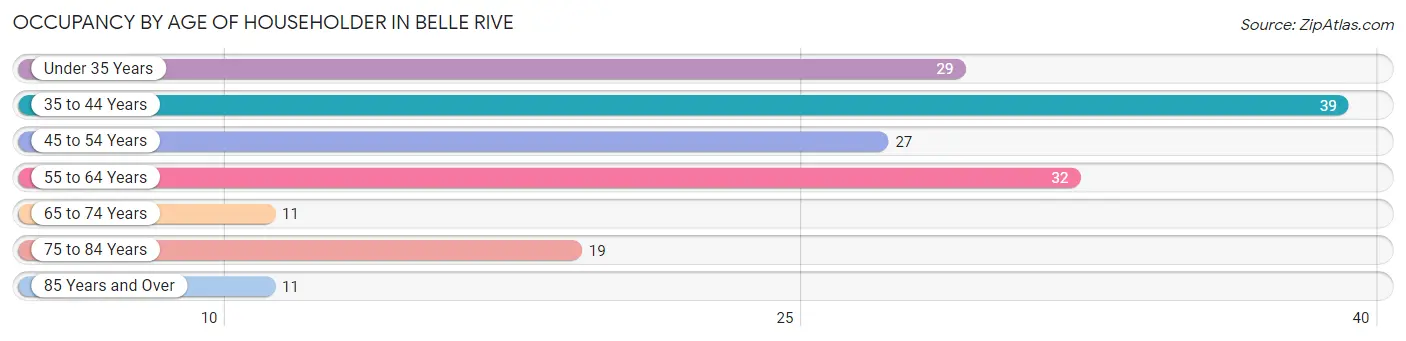
| Age Bracket | # Households | % Households |
| Under 35 Years | 29 | 17.3% |
| 35 to 44 Years | 39 | 23.2% |
| 45 to 54 Years | 27 | 16.1% |
| 55 to 64 Years | 32 | 19.1% |
| 65 to 74 Years | 11 | 6.6% |
| 75 to 84 Years | 19 | 11.3% |
| 85 Years and Over | 11 | 6.6% |
| Total | 168 | 100.0% |
Housing Finances in Belle Rive
Median Income by Occupancy in Belle Rive
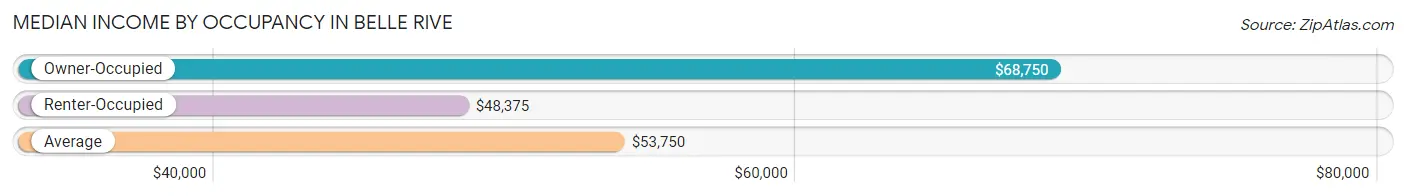
| Occupancy Type | # Households | Median Income |
| Owner-Occupied | 126 (75.0%) | $68,750 |
| Renter-Occupied | 42 (25.0%) | $48,375 |
| Average | 168 (100.0%) | $53,750 |
Occupancy by Householder Income Bracket in Belle Rive
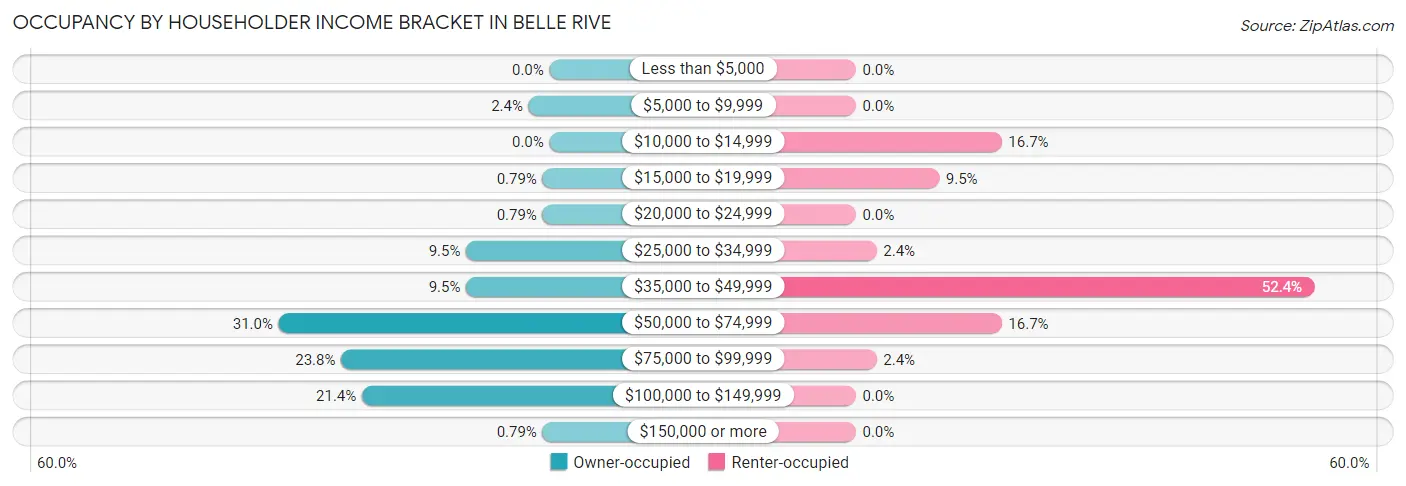
| Income Bracket | Owner-occupied | Renter-occupied |
| Less than $5,000 | 0 (0.0%) | 0 (0.0%) |
| $5,000 to $9,999 | 3 (2.4%) | 0 (0.0%) |
| $10,000 to $14,999 | 0 (0.0%) | 7 (16.7%) |
| $15,000 to $19,999 | 1 (0.8%) | 4 (9.5%) |
| $20,000 to $24,999 | 1 (0.8%) | 0 (0.0%) |
| $25,000 to $34,999 | 12 (9.5%) | 1 (2.4%) |
| $35,000 to $49,999 | 12 (9.5%) | 22 (52.4%) |
| $50,000 to $74,999 | 39 (30.9%) | 7 (16.7%) |
| $75,000 to $99,999 | 30 (23.8%) | 1 (2.4%) |
| $100,000 to $149,999 | 27 (21.4%) | 0 (0.0%) |
| $150,000 or more | 1 (0.8%) | 0 (0.0%) |
| Total | 126 (100.0%) | 42 (100.0%) |
Monthly Housing Cost Tiers in Belle Rive
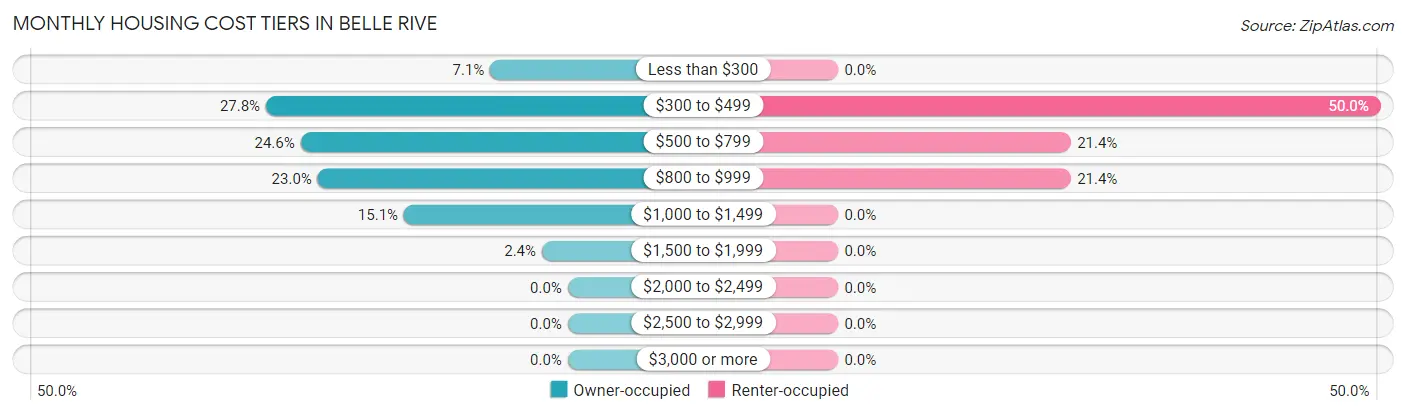
| Monthly Cost | Owner-occupied | Renter-occupied |
| Less than $300 | 9 (7.1%) | 0 (0.0%) |
| $300 to $499 | 35 (27.8%) | 21 (50.0%) |
| $500 to $799 | 31 (24.6%) | 9 (21.4%) |
| $800 to $999 | 29 (23.0%) | 9 (21.4%) |
| $1,000 to $1,499 | 19 (15.1%) | 0 (0.0%) |
| $1,500 to $1,999 | 3 (2.4%) | 0 (0.0%) |
| $2,000 to $2,499 | 0 (0.0%) | 0 (0.0%) |
| $2,500 to $2,999 | 0 (0.0%) | 0 (0.0%) |
| $3,000 or more | 0 (0.0%) | 0 (0.0%) |
| Total | 126 (100.0%) | 42 (100.0%) |
Physical Housing Characteristics in Belle Rive
Housing Structures in Belle Rive
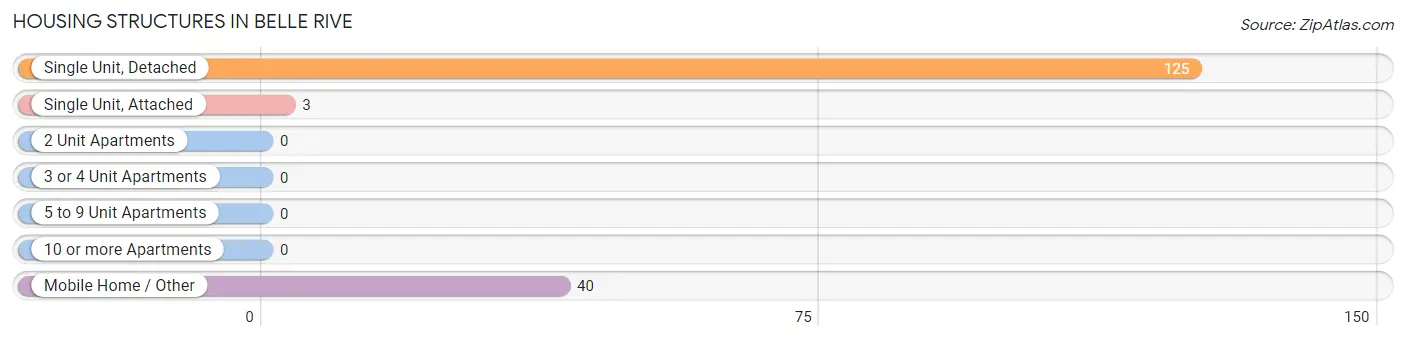
| Structure Type | # Housing Units | % Housing Units |
| Single Unit, Detached | 125 | 74.4% |
| Single Unit, Attached | 3 | 1.8% |
| 2 Unit Apartments | 0 | 0.0% |
| 3 or 4 Unit Apartments | 0 | 0.0% |
| 5 to 9 Unit Apartments | 0 | 0.0% |
| 10 or more Apartments | 0 | 0.0% |
| Mobile Home / Other | 40 | 23.8% |
| Total | 168 | 100.0% |
Housing Structures by Occupancy in Belle Rive
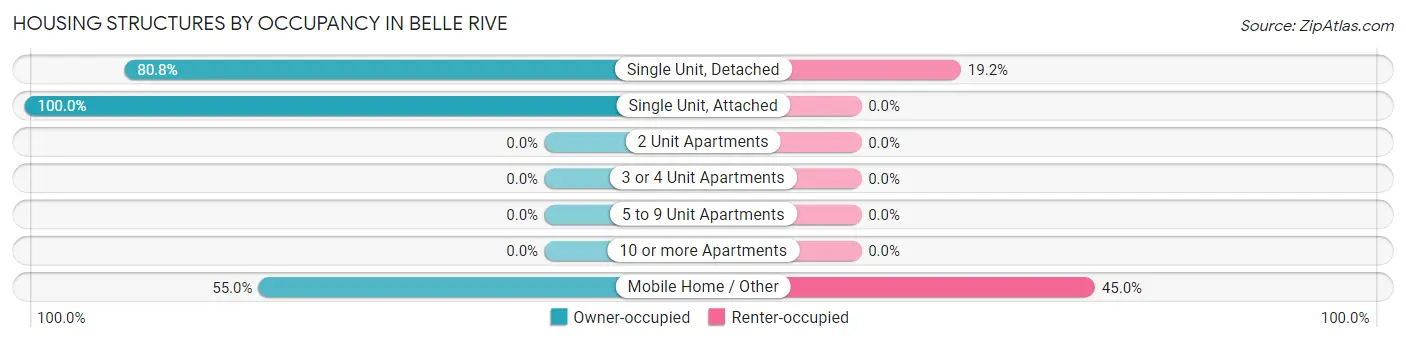
| Structure Type | Owner-occupied | Renter-occupied |
| Single Unit, Detached | 101 (80.8%) | 24 (19.2%) |
| Single Unit, Attached | 3 (100.0%) | 0 (0.0%) |
| 2 Unit Apartments | 0 (0.0%) | 0 (0.0%) |
| 3 or 4 Unit Apartments | 0 (0.0%) | 0 (0.0%) |
| 5 to 9 Unit Apartments | 0 (0.0%) | 0 (0.0%) |
| 10 or more Apartments | 0 (0.0%) | 0 (0.0%) |
| Mobile Home / Other | 22 (55.0%) | 18 (45.0%) |
| Total | 126 (75.0%) | 42 (25.0%) |
Housing Structures by Number of Rooms in Belle Rive
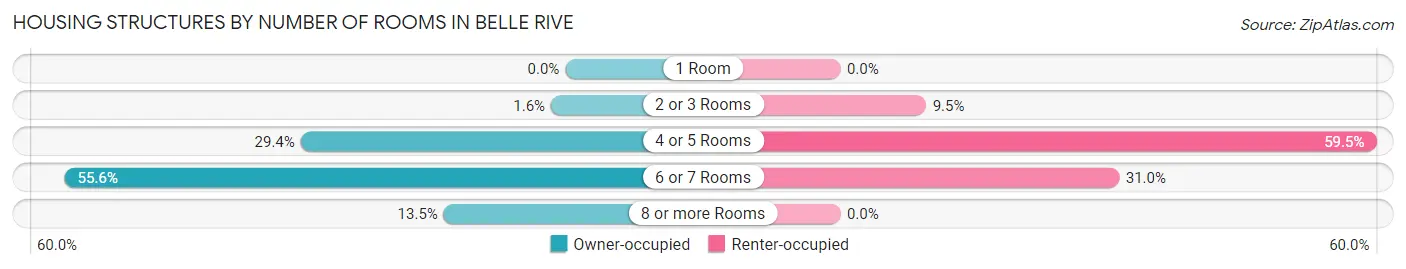
| Number of Rooms | Owner-occupied | Renter-occupied |
| 1 Room | 0 (0.0%) | 0 (0.0%) |
| 2 or 3 Rooms | 2 (1.6%) | 4 (9.5%) |
| 4 or 5 Rooms | 37 (29.4%) | 25 (59.5%) |
| 6 or 7 Rooms | 70 (55.6%) | 13 (30.9%) |
| 8 or more Rooms | 17 (13.5%) | 0 (0.0%) |
| Total | 126 (100.0%) | 42 (100.0%) |
Housing Structure by Heating Type in Belle Rive
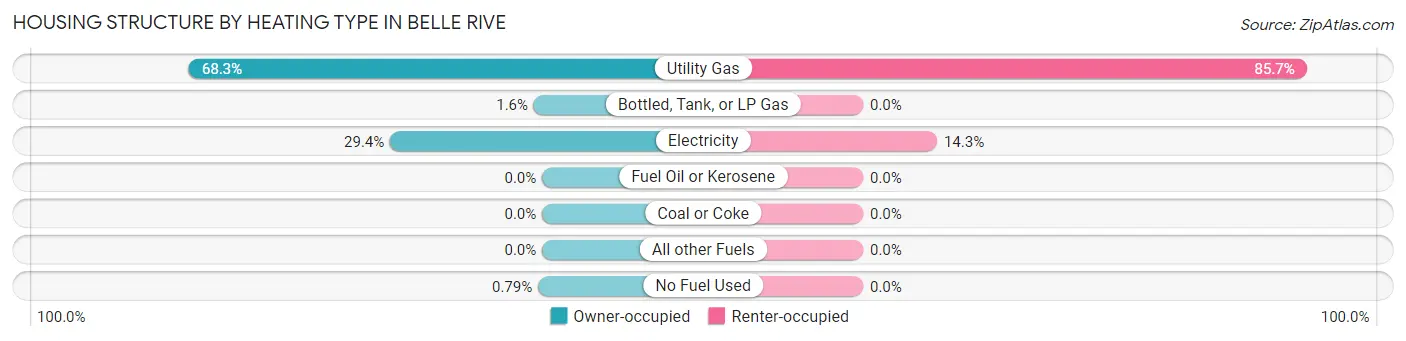
| Heating Type | Owner-occupied | Renter-occupied |
| Utility Gas | 86 (68.2%) | 36 (85.7%) |
| Bottled, Tank, or LP Gas | 2 (1.6%) | 0 (0.0%) |
| Electricity | 37 (29.4%) | 6 (14.3%) |
| Fuel Oil or Kerosene | 0 (0.0%) | 0 (0.0%) |
| Coal or Coke | 0 (0.0%) | 0 (0.0%) |
| All other Fuels | 0 (0.0%) | 0 (0.0%) |
| No Fuel Used | 1 (0.8%) | 0 (0.0%) |
| Total | 126 (100.0%) | 42 (100.0%) |
Household Vehicle Usage in Belle Rive
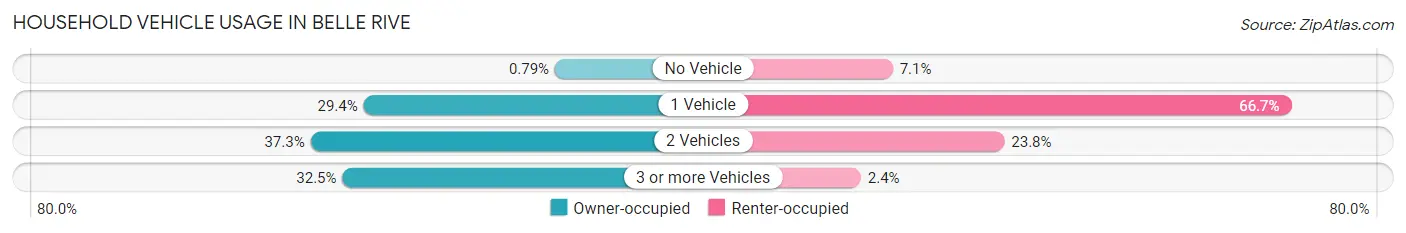
| Vehicles per Household | Owner-occupied | Renter-occupied |
| No Vehicle | 1 (0.8%) | 3 (7.1%) |
| 1 Vehicle | 37 (29.4%) | 28 (66.7%) |
| 2 Vehicles | 47 (37.3%) | 10 (23.8%) |
| 3 or more Vehicles | 41 (32.5%) | 1 (2.4%) |
| Total | 126 (100.0%) | 42 (100.0%) |
Real Estate & Mortgages in Belle Rive
Real Estate and Mortgage Overview in Belle Rive
| Characteristic | Without Mortgage | With Mortgage |
| Housing Units | 75 | 51 |
| Median Property Value | $84,100 | $81,900 |
| Median Household Income | $54,861 | $0 |
| Monthly Housing Costs | $474 | $0 |
| Real Estate Taxes | $1,375 | $0 |
Property Value by Mortgage Status in Belle Rive
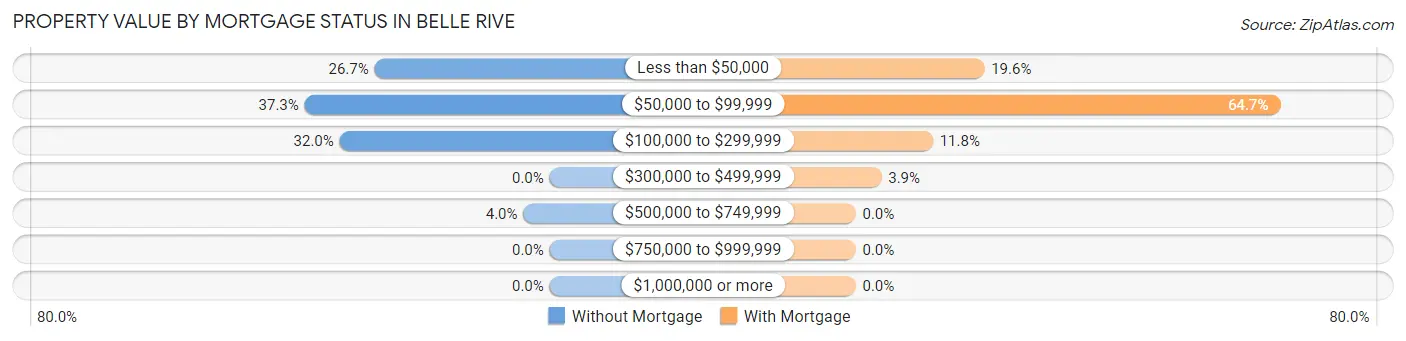
| Property Value | Without Mortgage | With Mortgage |
| Less than $50,000 | 20 (26.7%) | 10 (19.6%) |
| $50,000 to $99,999 | 28 (37.3%) | 33 (64.7%) |
| $100,000 to $299,999 | 24 (32.0%) | 6 (11.8%) |
| $300,000 to $499,999 | 0 (0.0%) | 2 (3.9%) |
| $500,000 to $749,999 | 3 (4.0%) | 0 (0.0%) |
| $750,000 to $999,999 | 0 (0.0%) | 0 (0.0%) |
| $1,000,000 or more | 0 (0.0%) | 0 (0.0%) |
| Total | 75 (100.0%) | 51 (100.0%) |
Household Income by Mortgage Status in Belle Rive
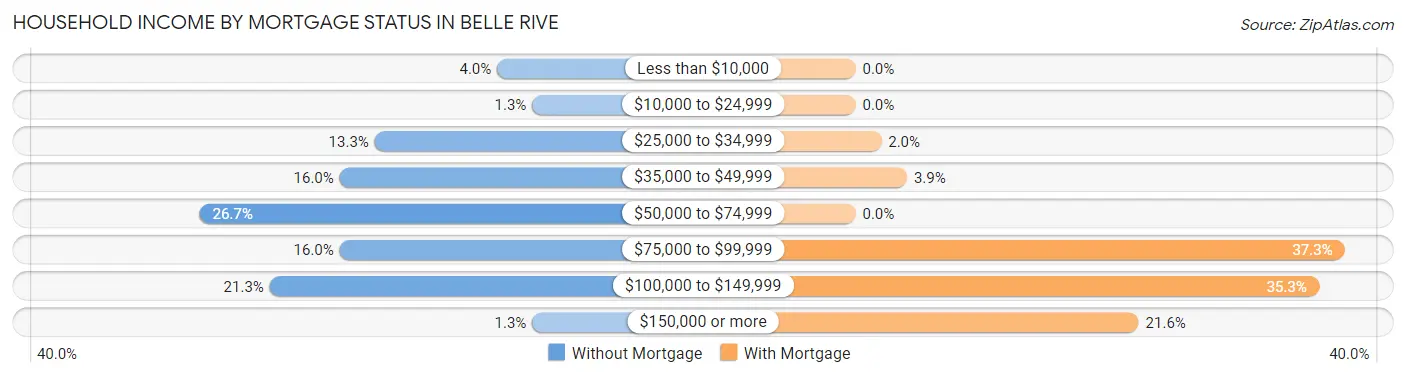
| Household Income | Without Mortgage | With Mortgage |
| Less than $10,000 | 3 (4.0%) | 0 (0.0%) |
| $10,000 to $24,999 | 1 (1.3%) | 0 (0.0%) |
| $25,000 to $34,999 | 10 (13.3%) | 1 (2.0%) |
| $35,000 to $49,999 | 12 (16.0%) | 2 (3.9%) |
| $50,000 to $74,999 | 20 (26.7%) | 0 (0.0%) |
| $75,000 to $99,999 | 12 (16.0%) | 19 (37.2%) |
| $100,000 to $149,999 | 16 (21.3%) | 18 (35.3%) |
| $150,000 or more | 1 (1.3%) | 11 (21.6%) |
| Total | 75 (100.0%) | 51 (100.0%) |
Property Value to Household Income Ratio in Belle Rive
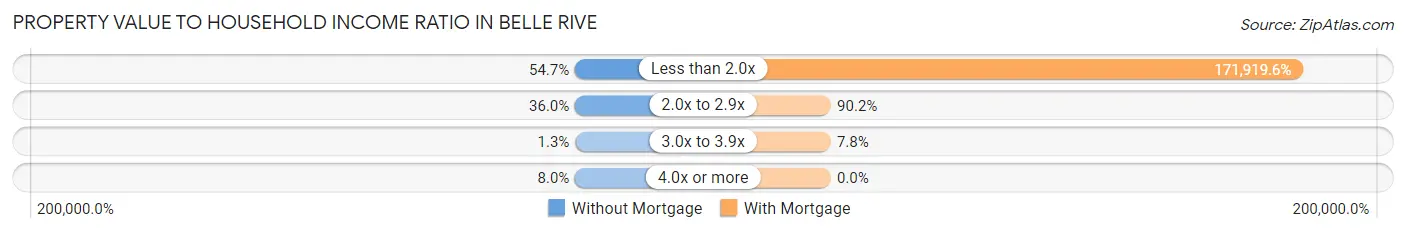
| Value-to-Income Ratio | Without Mortgage | With Mortgage |
| Less than 2.0x | 41 (54.7%) | 87,679 (171,919.6%) |
| 2.0x to 2.9x | 27 (36.0%) | 46 (90.2%) |
| 3.0x to 3.9x | 1 (1.3%) | 4 (7.8%) |
| 4.0x or more | 6 (8.0%) | 0 (0.0%) |
| Total | 75 (100.0%) | 51 (100.0%) |
Real Estate Taxes by Mortgage Status in Belle Rive
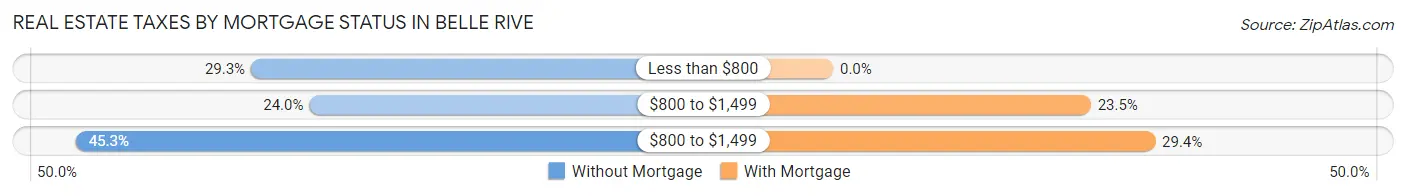
| Property Taxes | Without Mortgage | With Mortgage |
| Less than $800 | 22 (29.3%) | 0 (0.0%) |
| $800 to $1,499 | 18 (24.0%) | 12 (23.5%) |
| $800 to $1,499 | 34 (45.3%) | 15 (29.4%) |
| Total | 75 (100.0%) | 51 (100.0%) |
Health & Disability in Belle Rive
Health Insurance Coverage by Age in Belle Rive
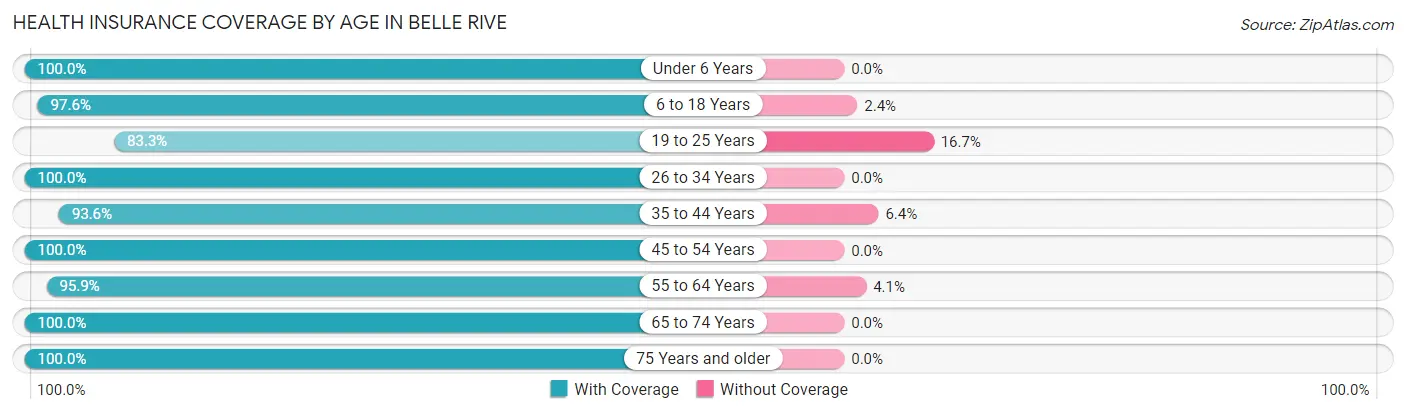
| Age Bracket | With Coverage | Without Coverage |
| Under 6 Years | 24 (100.0%) | 0 (0.0%) |
| 6 to 18 Years | 40 (97.6%) | 1 (2.4%) |
| 19 to 25 Years | 25 (83.3%) | 5 (16.7%) |
| 26 to 34 Years | 37 (100.0%) | 0 (0.0%) |
| 35 to 44 Years | 44 (93.6%) | 3 (6.4%) |
| 45 to 54 Years | 37 (100.0%) | 0 (0.0%) |
| 55 to 64 Years | 47 (95.9%) | 2 (4.1%) |
| 65 to 74 Years | 17 (100.0%) | 0 (0.0%) |
| 75 Years and older | 42 (100.0%) | 0 (0.0%) |
| Total | 313 (96.6%) | 11 (3.4%) |
Health Insurance Coverage by Citizenship Status in Belle Rive
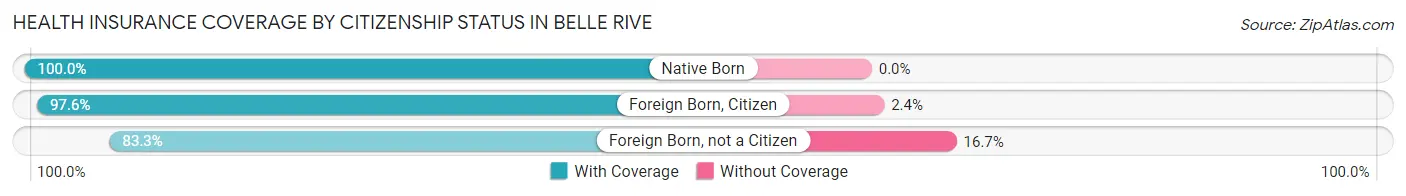
| Citizenship Status | With Coverage | Without Coverage |
| Native Born | 24 (100.0%) | 0 (0.0%) |
| Foreign Born, Citizen | 40 (97.6%) | 1 (2.4%) |
| Foreign Born, not a Citizen | 25 (83.3%) | 5 (16.7%) |
Health Insurance Coverage by Household Income in Belle Rive
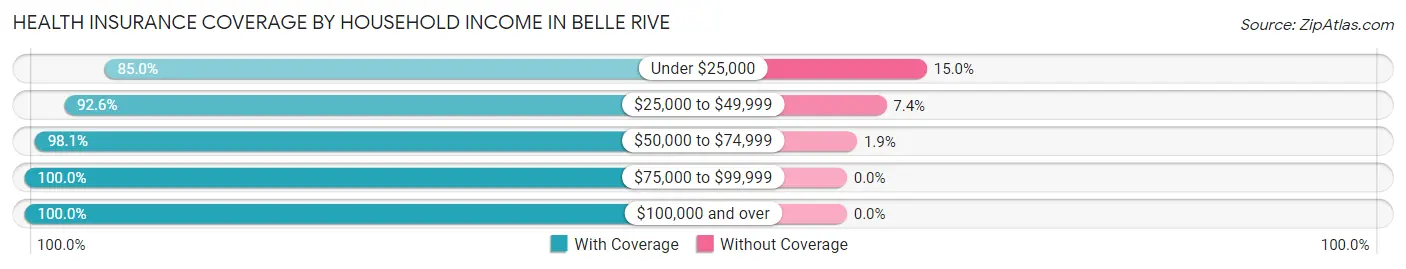
| Household Income | With Coverage | Without Coverage |
| Under $25,000 | 17 (85.0%) | 3 (15.0%) |
| $25,000 to $49,999 | 75 (92.6%) | 6 (7.4%) |
| $50,000 to $74,999 | 103 (98.1%) | 2 (1.9%) |
| $75,000 to $99,999 | 46 (100.0%) | 0 (0.0%) |
| $100,000 and over | 72 (100.0%) | 0 (0.0%) |
Public vs Private Health Insurance Coverage by Age in Belle Rive
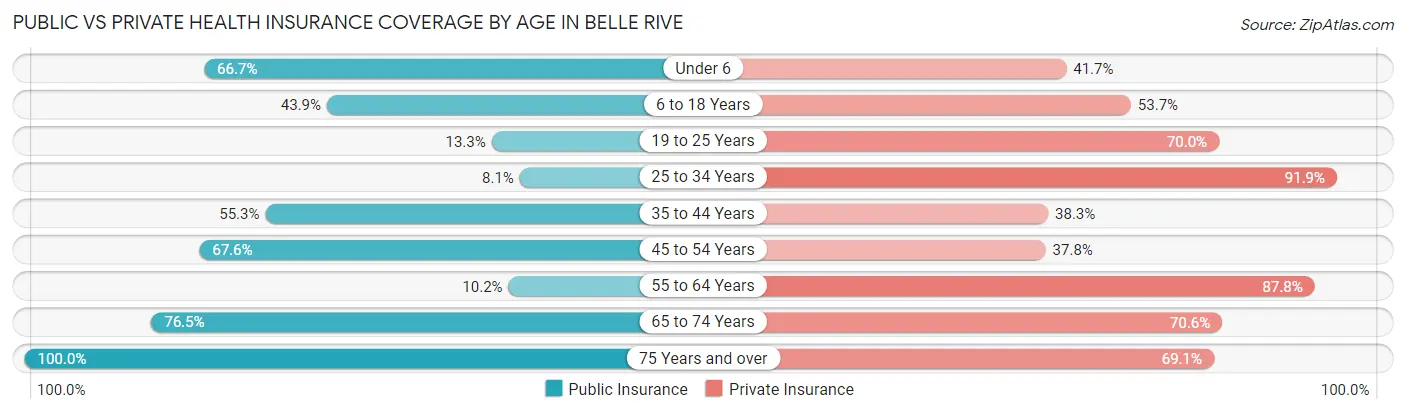
| Age Bracket | Public Insurance | Private Insurance |
| Under 6 | 16 (66.7%) | 10 (41.7%) |
| 6 to 18 Years | 18 (43.9%) | 22 (53.7%) |
| 19 to 25 Years | 4 (13.3%) | 21 (70.0%) |
| 25 to 34 Years | 3 (8.1%) | 34 (91.9%) |
| 35 to 44 Years | 26 (55.3%) | 18 (38.3%) |
| 45 to 54 Years | 25 (67.6%) | 14 (37.8%) |
| 55 to 64 Years | 5 (10.2%) | 43 (87.8%) |
| 65 to 74 Years | 13 (76.5%) | 12 (70.6%) |
| 75 Years and over | 42 (100.0%) | 29 (69.1%) |
| Total | 152 (46.9%) | 203 (62.6%) |
Disability Status by Sex by Age in Belle Rive
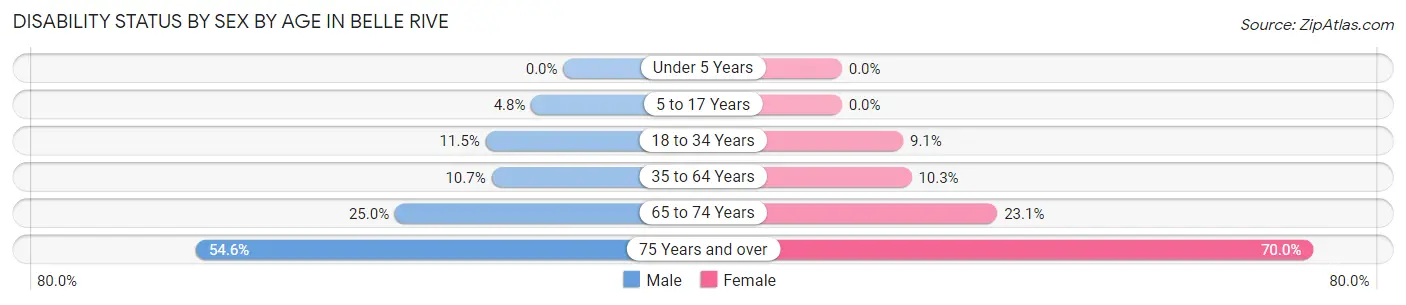
| Age Bracket | Male | Female |
| Under 5 Years | 0 (0.0%) | 0 (0.0%) |
| 5 to 17 Years | 1 (4.8%) | 0 (0.0%) |
| 18 to 34 Years | 6 (11.5%) | 2 (9.1%) |
| 35 to 64 Years | 8 (10.7%) | 6 (10.3%) |
| 65 to 74 Years | 1 (25.0%) | 3 (23.1%) |
| 75 Years and over | 12 (54.5%) | 14 (70.0%) |
Disability Class by Sex by Age in Belle Rive
Disability Class: Hearing Difficulty
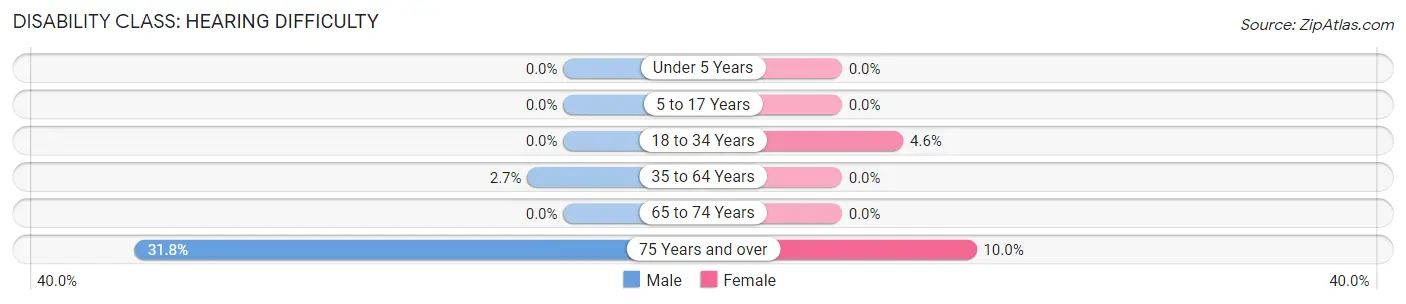
| Age Bracket | Male | Female |
| Under 5 Years | 0 (0.0%) | 0 (0.0%) |
| 5 to 17 Years | 0 (0.0%) | 0 (0.0%) |
| 18 to 34 Years | 0 (0.0%) | 1 (4.5%) |
| 35 to 64 Years | 2 (2.7%) | 0 (0.0%) |
| 65 to 74 Years | 0 (0.0%) | 0 (0.0%) |
| 75 Years and over | 7 (31.8%) | 2 (10.0%) |
Disability Class: Vision Difficulty
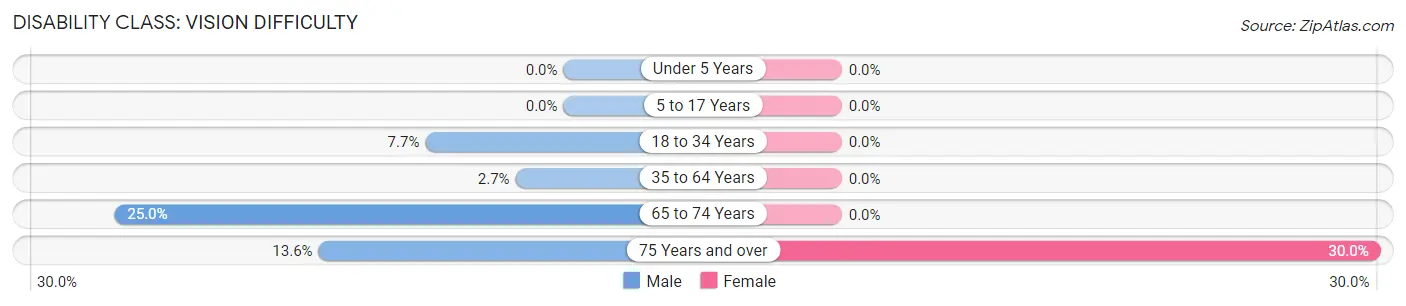
| Age Bracket | Male | Female |
| Under 5 Years | 0 (0.0%) | 0 (0.0%) |
| 5 to 17 Years | 0 (0.0%) | 0 (0.0%) |
| 18 to 34 Years | 4 (7.7%) | 0 (0.0%) |
| 35 to 64 Years | 2 (2.7%) | 0 (0.0%) |
| 65 to 74 Years | 1 (25.0%) | 0 (0.0%) |
| 75 Years and over | 3 (13.6%) | 6 (30.0%) |
Disability Class: Cognitive Difficulty
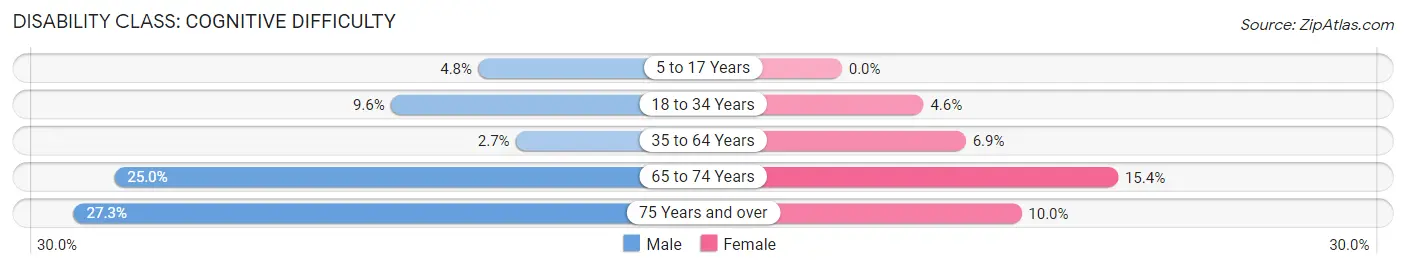
| Age Bracket | Male | Female |
| 5 to 17 Years | 1 (4.8%) | 0 (0.0%) |
| 18 to 34 Years | 5 (9.6%) | 1 (4.5%) |
| 35 to 64 Years | 2 (2.7%) | 4 (6.9%) |
| 65 to 74 Years | 1 (25.0%) | 2 (15.4%) |
| 75 Years and over | 6 (27.3%) | 2 (10.0%) |
Disability Class: Ambulatory Difficulty
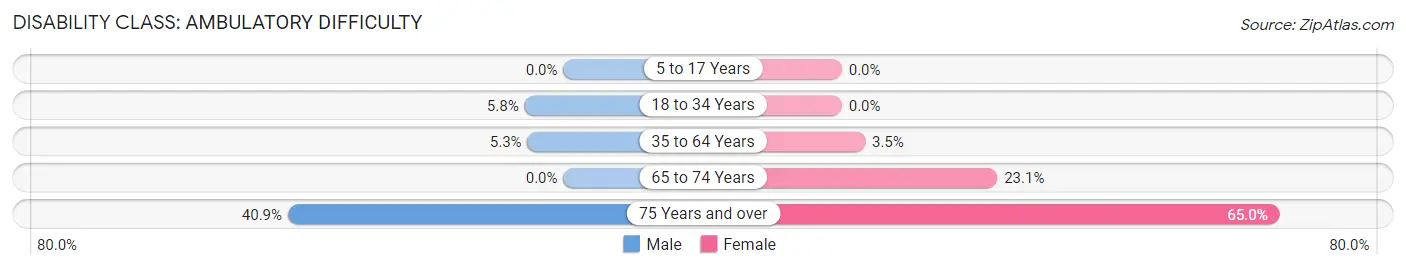
| Age Bracket | Male | Female |
| 5 to 17 Years | 0 (0.0%) | 0 (0.0%) |
| 18 to 34 Years | 3 (5.8%) | 0 (0.0%) |
| 35 to 64 Years | 4 (5.3%) | 2 (3.5%) |
| 65 to 74 Years | 0 (0.0%) | 3 (23.1%) |
| 75 Years and over | 9 (40.9%) | 13 (65.0%) |
Disability Class: Self-Care Difficulty
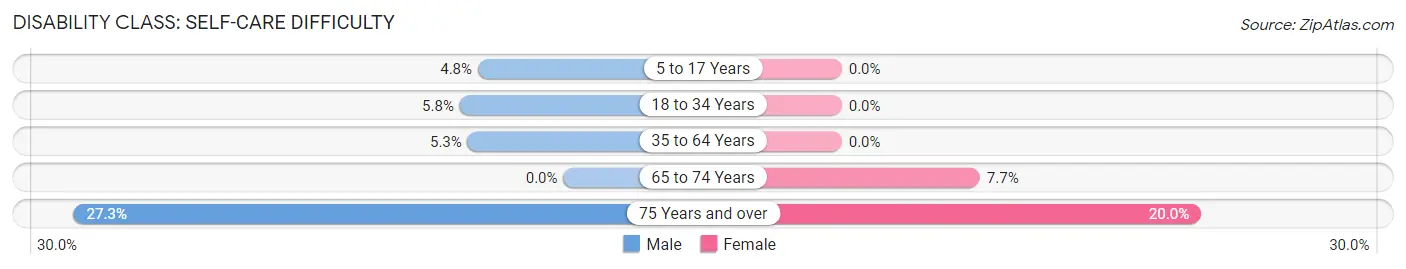
| Age Bracket | Male | Female |
| 5 to 17 Years | 1 (4.8%) | 0 (0.0%) |
| 18 to 34 Years | 3 (5.8%) | 0 (0.0%) |
| 35 to 64 Years | 4 (5.3%) | 0 (0.0%) |
| 65 to 74 Years | 0 (0.0%) | 1 (7.7%) |
| 75 Years and over | 6 (27.3%) | 4 (20.0%) |
Technology Access in Belle Rive
Computing Device Access in Belle Rive
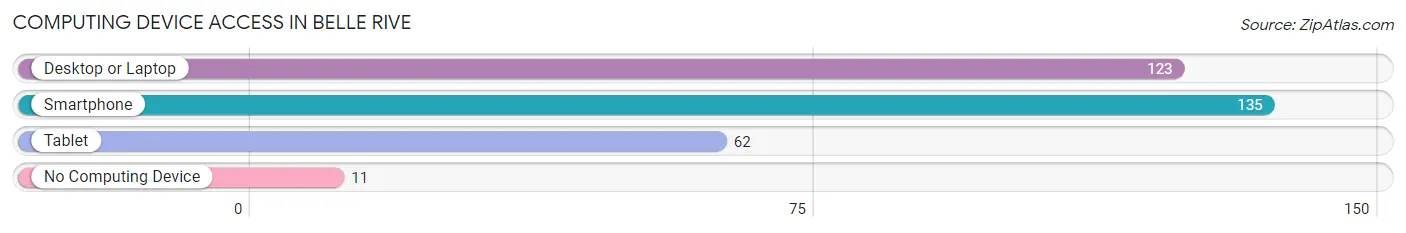
| Device Type | # Households | % Households |
| Desktop or Laptop | 123 | 73.2% |
| Smartphone | 135 | 80.4% |
| Tablet | 62 | 36.9% |
| No Computing Device | 11 | 6.6% |
| Total | 168 | 100.0% |
Internet Access in Belle Rive
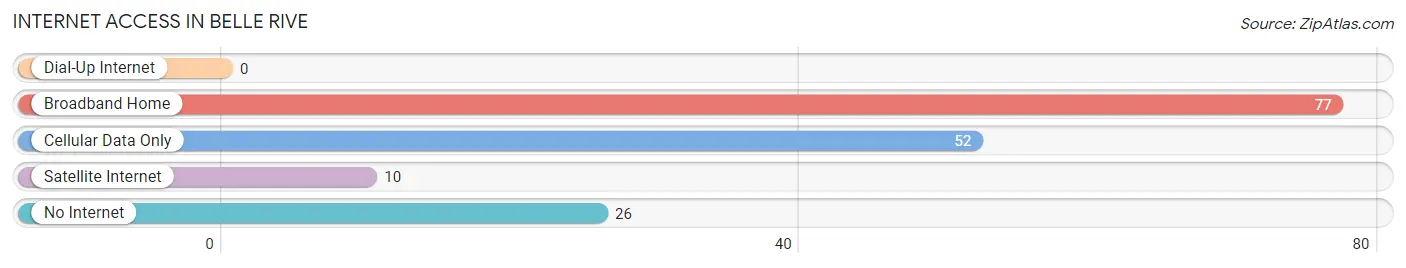
| Internet Type | # Households | % Households |
| Dial-Up Internet | 0 | 0.0% |
| Broadband Home | 77 | 45.8% |
| Cellular Data Only | 52 | 30.9% |
| Satellite Internet | 10 | 5.9% |
| No Internet | 26 | 15.5% |
| Total | 168 | 100.0% |
Belle Rive Summary
Belle Rive is a small village located in Jefferson County, Illinois. It is situated on the banks of the Big Muddy River, about 25 miles south of Mount Vernon. The population of Belle Rive was estimated to be around 500 people in 2020.
History
Belle Rive was founded in 1819 by a group of settlers from Kentucky. The village was named after the French phrase for “beautiful river”, which was an apt description of the Big Muddy River that runs through the area. The settlers were attracted to the area due to its fertile soil and abundant wildlife.
The village grew slowly over the years, and by the mid-1800s, it had become a thriving agricultural community. The main crops grown in the area were corn, wheat, and oats. The village also had a few small businesses, such as a general store, a blacksmith, and a sawmill.
In the late 1800s, the railroad came to Belle Rive, connecting it to the larger cities of Mount Vernon and Centralia. This allowed the village to become more connected to the outside world and allowed for the growth of the local economy.
Geography
Belle Rive is located in the southern part of Jefferson County, Illinois. It is situated on the banks of the Big Muddy River, about 25 miles south of Mount Vernon. The village is surrounded by rolling hills and farmland, and is located in a rural area.
The climate in Belle Rive is typical of the Midwest, with hot summers and cold winters. The average temperature in the summer is around 80 degrees Fahrenheit, and the average temperature in the winter is around 30 degrees Fahrenheit.
Economy
The economy of Belle Rive is largely based on agriculture. The main crops grown in the area are corn, wheat, and oats. The village also has a few small businesses, such as a general store, a blacksmith, and a sawmill.
In recent years, the village has seen an increase in tourism due to its proximity to the Big Muddy River. The village is also home to a few small wineries, which attract visitors from all over the region.
Demographics
The population of Belle Rive was estimated to be around 500 people in 2020. The majority of the population is white (95%), with the remaining 5% being African American, Hispanic, or other. The median household income in the village is around $45,000, and the median age is around 40 years old.
Belle Rive is a small, rural village with a rich history and a strong sense of community. The village is home to a diverse population, and the economy is largely based on agriculture. The village is also a popular tourist destination due to its proximity to the Big Muddy River.
Common Questions
What is Per Capita Income in Belle Rive?
Per Capita income in Belle Rive is $33,266.
What is the Median Family Income in Belle Rive?
Median Family Income in Belle Rive is $53,000.
What is the Median Household income in Belle Rive?
Median Household Income in Belle Rive is $53,750.
What is Income or Wage Gap in Belle Rive?
Income or Wage Gap in Belle Rive is 25.4%.
Women in Belle Rive earn 74.6 cents for every dollar earned by a man.
What is Inequality or Gini Index in Belle Rive?
Inequality or Gini Index in Belle Rive is 0.29.
What is the Total Population of Belle Rive?
Total Population of Belle Rive is 324.
What is the Total Male Population of Belle Rive?
Total Male Population of Belle Rive is 177.
What is the Total Female Population of Belle Rive?
Total Female Population of Belle Rive is 147.
What is the Ratio of Males per 100 Females in Belle Rive?
There are 120.41 Males per 100 Females in Belle Rive.
What is the Ratio of Females per 100 Males in Belle Rive?
There are 83.05 Females per 100 Males in Belle Rive.
What is the Median Population Age in Belle Rive?
Median Population Age in Belle Rive is 38.9 Years.
What is the Average Family Size in Belle Rive
Average Family Size in Belle Rive is 2.4 People.
What is the Average Household Size in Belle Rive
Average Household Size in Belle Rive is 1.9 People.
How Large is the Labor Force in Belle Rive?
There are 185 People in the Labor Forcein in Belle Rive.
What is the Percentage of People in the Labor Force in Belle Rive?
69.0% of People are in the Labor Force in Belle Rive.
What is the Unemployment Rate in Belle Rive?
Unemployment Rate in Belle Rive is 3.2%.