Pendleton County, WV Map & Demographics
Pendleton County Map
Pendleton County Overview
$27,513
PER CAPITA INCOME
$63,016
AVG FAMILY INCOME
$52,458
AVG HOUSEHOLD INCOME
24.8%
WAGE / INCOME GAP [ % ]
75.2¢/ $1
WAGE / INCOME GAP [ $ ]
0.40
INEQUALITY / GINI INDEX
6,156
TOTAL POPULATION
3,178
MALE POPULATION
2,978
FEMALE POPULATION
106.72
MALES / 100 FEMALES
93.71
FEMALES / 100 MALES
50.9
MEDIAN AGE
3.0
AVG FAMILY SIZE
2.6
AVG HOUSEHOLD SIZE
2,665
LABOR FORCE [ PEOPLE ]
51.5%
PERCENT IN LABOR FORCE
7.3%
UNEMPLOYMENT RATE
Pendleton County Area Codes
Income in Pendleton County
Income Overview in Pendleton County
Per Capita Income in Pendleton County is $27,513, while median incomes of families and households are $63,016 and $52,458 respectively.
| Characteristic | Number | Measure |
| Per Capita Income | 6,156 | $27,513 |
| Median Family Income | 1,683 | $63,016 |
| Mean Family Income | 1,683 | $74,638 |
| Median Household Income | 2,361 | $52,458 |
| Mean Household Income | 2,361 | $64,715 |
| Income Deficit | 1,683 | $0 |
| Wage / Income Gap (%) | 6,156 | 24.84% |
| Wage / Income Gap ($) | 6,156 | 75.16¢ per $1 |
| Gini / Inequality Index | 6,156 | 0.40 |
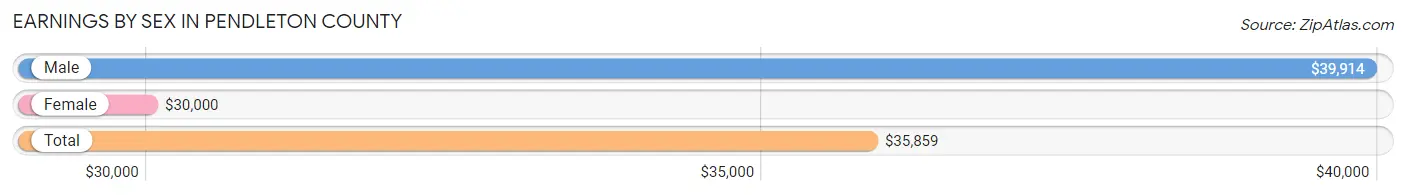
Earnings by Sex in Pendleton County
Average Earnings in Pendleton County are $35,859, $39,914 for men and $30,000 for women, a difference of 24.8%.
| Sex | Number | Average Earnings |
| Male | 1,446 (54.9%) | $39,914 |
| Female | 1,188 (45.1%) | $30,000 |
| Total | 2,634 (100.0%) | $35,859 |
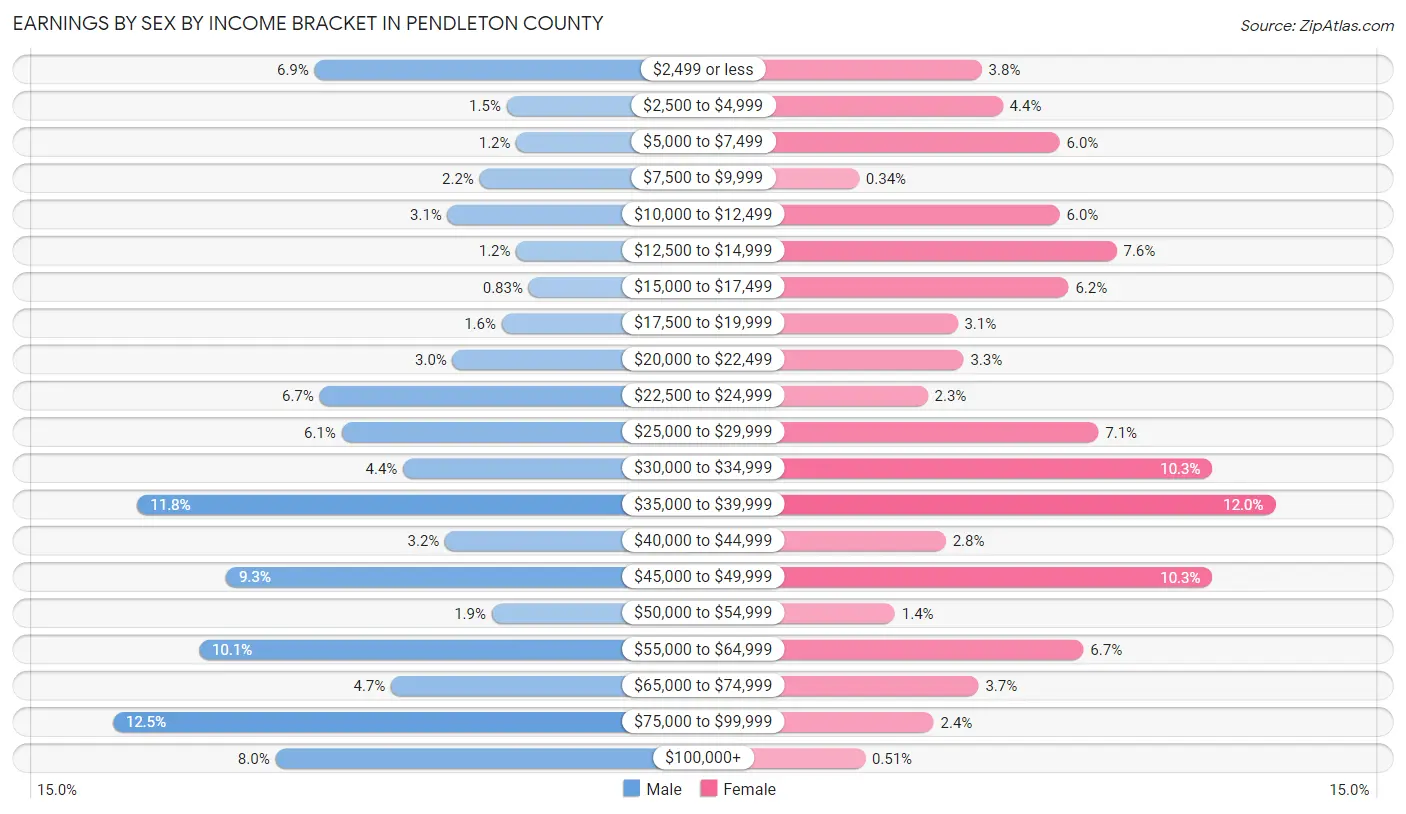
Earnings by Sex by Income Bracket in Pendleton County
The most common earnings brackets in Pendleton County are $75,000 to $99,999 for men (181 | 12.5%) and $35,000 to $39,999 for women (143 | 12.0%).
| Income | Male | Female |
| $2,499 or less | 99 (6.9%) | 45 (3.8%) |
| $2,500 to $4,999 | 21 (1.5%) | 52 (4.4%) |
| $5,000 to $7,499 | 17 (1.2%) | 71 (6.0%) |
| $7,500 to $9,999 | 32 (2.2%) | 4 (0.3%) |
| $10,000 to $12,499 | 45 (3.1%) | 71 (6.0%) |
| $12,500 to $14,999 | 17 (1.2%) | 90 (7.6%) |
| $15,000 to $17,499 | 12 (0.8%) | 74 (6.2%) |
| $17,500 to $19,999 | 23 (1.6%) | 37 (3.1%) |
| $20,000 to $22,499 | 43 (3.0%) | 39 (3.3%) |
| $22,500 to $24,999 | 97 (6.7%) | 27 (2.3%) |
| $25,000 to $29,999 | 88 (6.1%) | 84 (7.1%) |
| $30,000 to $34,999 | 63 (4.4%) | 122 (10.3%) |
| $35,000 to $39,999 | 171 (11.8%) | 143 (12.0%) |
| $40,000 to $44,999 | 46 (3.2%) | 33 (2.8%) |
| $45,000 to $49,999 | 135 (9.3%) | 122 (10.3%) |
| $50,000 to $54,999 | 27 (1.9%) | 16 (1.3%) |
| $55,000 to $64,999 | 146 (10.1%) | 79 (6.7%) |
| $65,000 to $74,999 | 68 (4.7%) | 44 (3.7%) |
| $75,000 to $99,999 | 181 (12.5%) | 29 (2.4%) |
| $100,000+ | 115 (8.0%) | 6 (0.5%) |
| Total | 1,446 (100.0%) | 1,188 (100.0%) |
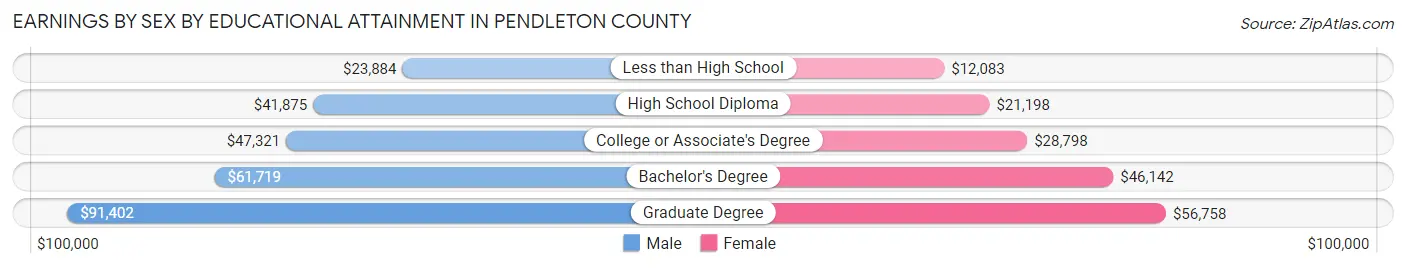
Earnings by Sex by Educational Attainment in Pendleton County
Average earnings in Pendleton County are $45,819 for men and $31,123 for women, a difference of 32.1%. Men with an educational attainment of graduate degree enjoy the highest average annual earnings of $91,402, while those with less than high school education earn the least with $23,884. Women with an educational attainment of graduate degree earn the most with the average annual earnings of $56,758, while those with less than high school education have the smallest earnings of $12,083.
| Educational Attainment | Male Income | Female Income |
| Less than High School | $23,884 | $12,083 |
| High School Diploma | $41,875 | $21,198 |
| College or Associate's Degree | $47,321 | $28,798 |
| Bachelor's Degree | $61,719 | $46,142 |
| Graduate Degree | $91,402 | $56,758 |
| Total | $45,819 | $31,123 |
Family Income in Pendleton County
Family Income Brackets in Pendleton County
According to the Pendleton County family income data, there are 377 families falling into the $50,000 to $74,999 income range, which is the most common income bracket and makes up 22.4% of all families. Conversely, the $10,000 to $14,999 income bracket is the least frequent group with only 22 families (1.3%) belonging to this category.
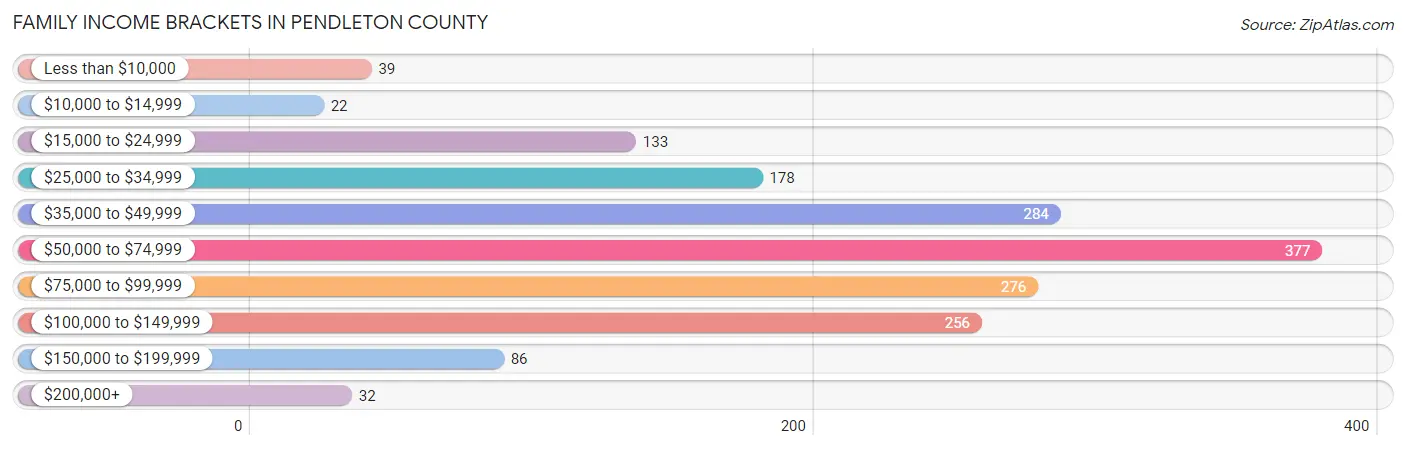
| Income Bracket | # Families | % Families |
| Less than $10,000 | 39 | 2.3% |
| $10,000 to $14,999 | 22 | 1.3% |
| $15,000 to $24,999 | 133 | 7.9% |
| $25,000 to $34,999 | 178 | 10.6% |
| $35,000 to $49,999 | 284 | 16.9% |
| $50,000 to $74,999 | 377 | 22.4% |
| $75,000 to $99,999 | 276 | 16.4% |
| $100,000 to $149,999 | 256 | 15.2% |
| $150,000 to $199,999 | 86 | 5.1% |
| $200,000+ | 32 | 1.9% |
Family Income by Famaliy Size in Pendleton County
5-person families (119 | 7.1%) account for the highest median family income in Pendleton County with $86,836 per family, while 2-person families (1,078 | 64.0%) have the highest median income of $30,166 per family member.
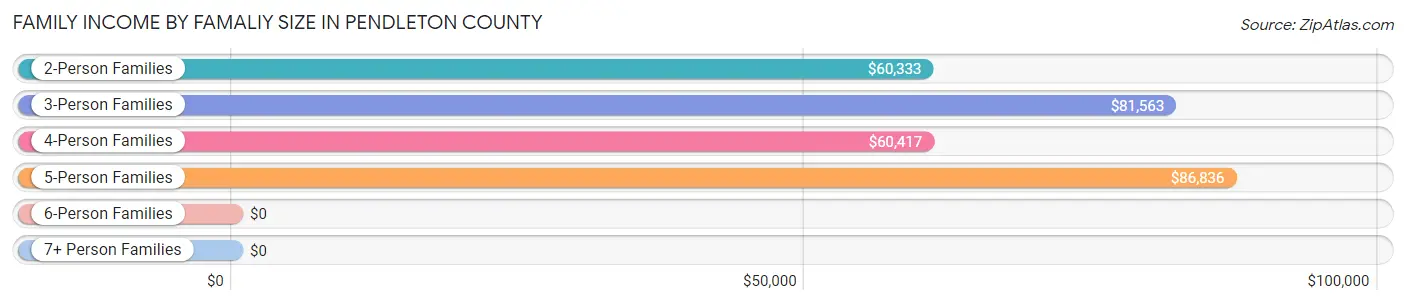
| Income Bracket | # Families | Median Income |
| 2-Person Families | 1,078 (64.0%) | $60,333 |
| 3-Person Families | 311 (18.5%) | $81,563 |
| 4-Person Families | 149 (8.8%) | $60,417 |
| 5-Person Families | 119 (7.1%) | $86,836 |
| 6-Person Families | 22 (1.3%) | $0 |
| 7+ Person Families | 4 (0.2%) | $0 |
| Total | 1,683 (100.0%) | $63,016 |
Family Income by Number of Earners in Pendleton County
The median family income in Pendleton County is $63,016, with families comprising 3+ earners (89) having the highest median family income of $123,625, while families with no earners (486) have the lowest median family income of $36,318, accounting for 5.3% and 28.9% of families, respectively.
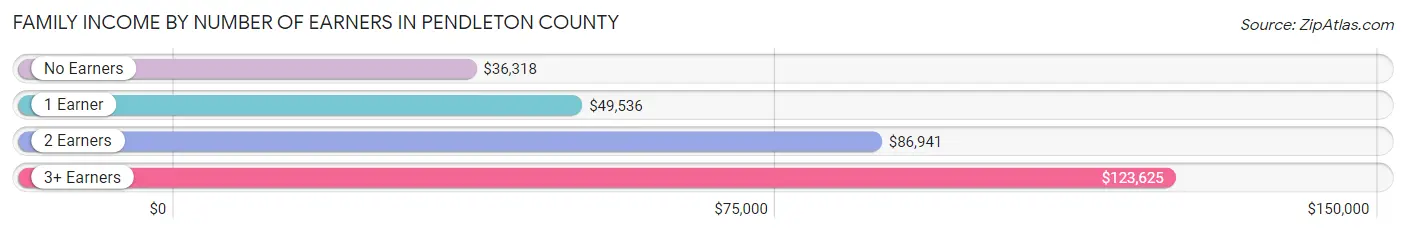
| Number of Earners | # Families | Median Income |
| No Earners | 486 (28.9%) | $36,318 |
| 1 Earner | 563 (33.5%) | $49,536 |
| 2 Earners | 545 (32.4%) | $86,941 |
| 3+ Earners | 89 (5.3%) | $123,625 |
| Total | 1,683 (100.0%) | $63,016 |
Household Income in Pendleton County
Household Income Brackets in Pendleton County
With 467 households falling in the category, the $50,000 to $74,999 income range is the most frequent in Pendleton County, accounting for 19.8% of all households. In contrast, only 42 households (1.8%) fall into the $200,000+ income bracket, making it the least populous group.
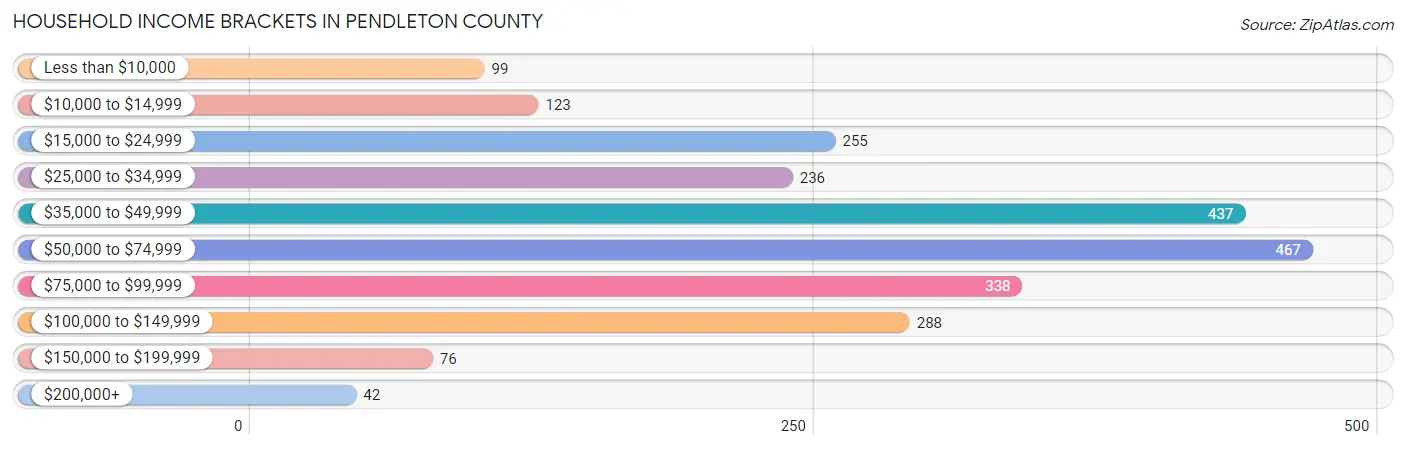
| Income Bracket | # Households | % Households |
| Less than $10,000 | 99 | 4.2% |
| $10,000 to $14,999 | 123 | 5.2% |
| $15,000 to $24,999 | 255 | 10.8% |
| $25,000 to $34,999 | 236 | 10.0% |
| $35,000 to $49,999 | 437 | 18.5% |
| $50,000 to $74,999 | 467 | 19.8% |
| $75,000 to $99,999 | 338 | 14.3% |
| $100,000 to $149,999 | 288 | 12.2% |
| $150,000 to $199,999 | 76 | 3.2% |
| $200,000+ | 42 | 1.8% |
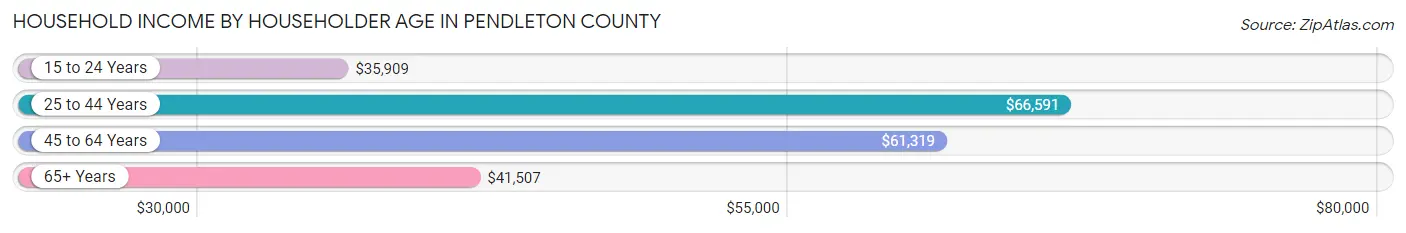
Household Income by Householder Age in Pendleton County
The median household income in Pendleton County is $52,458, with the highest median household income of $66,591 found in the 25 to 44 years age bracket for the primary householder. A total of 466 households (19.7%) fall into this category. Meanwhile, the 15 to 24 years age bracket for the primary householder has the lowest median household income of $35,909, with 46 households (1.9%) in this group.
| Income Bracket | # Households | Median Income |
| 15 to 24 Years | 46 (1.9%) | $35,909 |
| 25 to 44 Years | 466 (19.7%) | $66,591 |
| 45 to 64 Years | 869 (36.8%) | $61,319 |
| 65+ Years | 980 (41.5%) | $41,507 |
| Total | 2,361 (100.0%) | $52,458 |
Poverty in Pendleton County
Income Below Poverty by Sex and Age in Pendleton County
With 16.7% poverty level for males and 15.9% for females among the residents of Pendleton County, under 5 year old males and 15 year old females are the most vulnerable to poverty, with 71 males (42.5%) and 10 females (62.5%) in their respective age groups living below the poverty level.
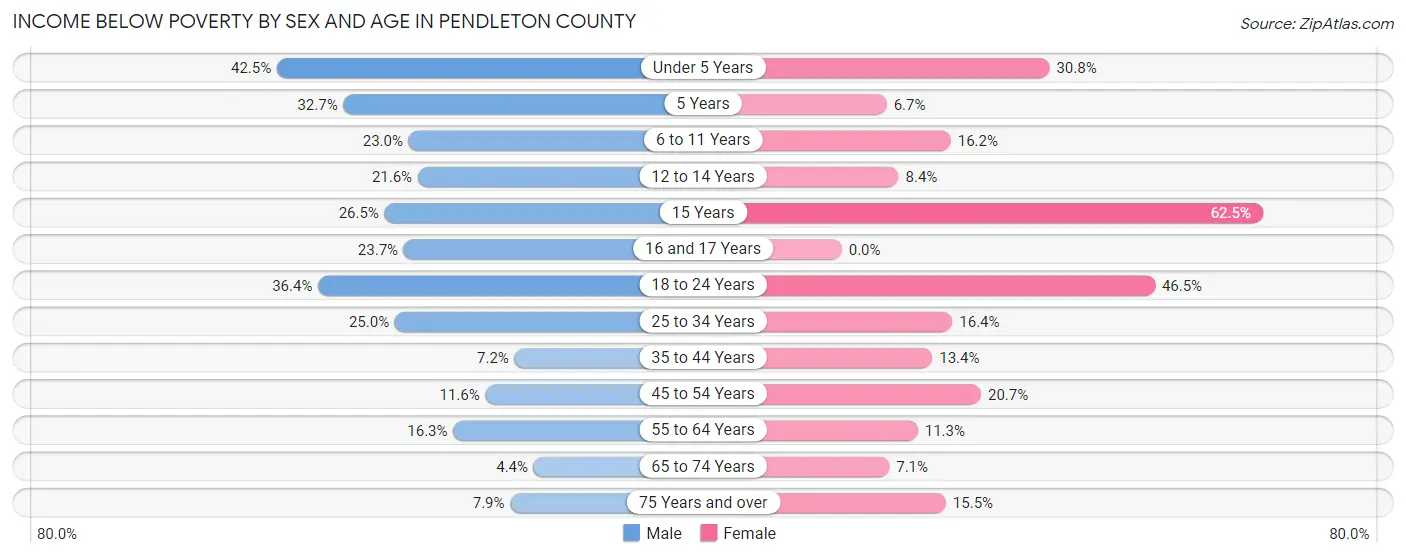
| Age Bracket | Male | Female |
| Under 5 Years | 71 (42.5%) | 33 (30.8%) |
| 5 Years | 16 (32.7%) | 1 (6.7%) |
| 6 to 11 Years | 42 (23.0%) | 34 (16.2%) |
| 12 to 14 Years | 19 (21.6%) | 7 (8.4%) |
| 15 Years | 13 (26.5%) | 10 (62.5%) |
| 16 and 17 Years | 18 (23.7%) | 0 (0.0%) |
| 18 to 24 Years | 87 (36.4%) | 73 (46.5%) |
| 25 to 34 Years | 57 (25.0%) | 45 (16.4%) |
| 35 to 44 Years | 25 (7.2%) | 41 (13.4%) |
| 45 to 54 Years | 43 (11.6%) | 67 (20.7%) |
| 55 to 64 Years | 90 (16.3%) | 57 (11.3%) |
| 65 to 74 Years | 20 (4.4%) | 32 (7.0%) |
| 75 Years and over | 28 (7.9%) | 60 (15.5%) |
| Total | 529 (16.7%) | 460 (15.9%) |
Income Above Poverty by Sex and Age in Pendleton County
According to the poverty statistics in Pendleton County, males aged 65 to 74 years and females aged 16 and 17 years are the age groups that are most secure financially, with 95.6% of males and 100.0% of females in these age groups living above the poverty line.
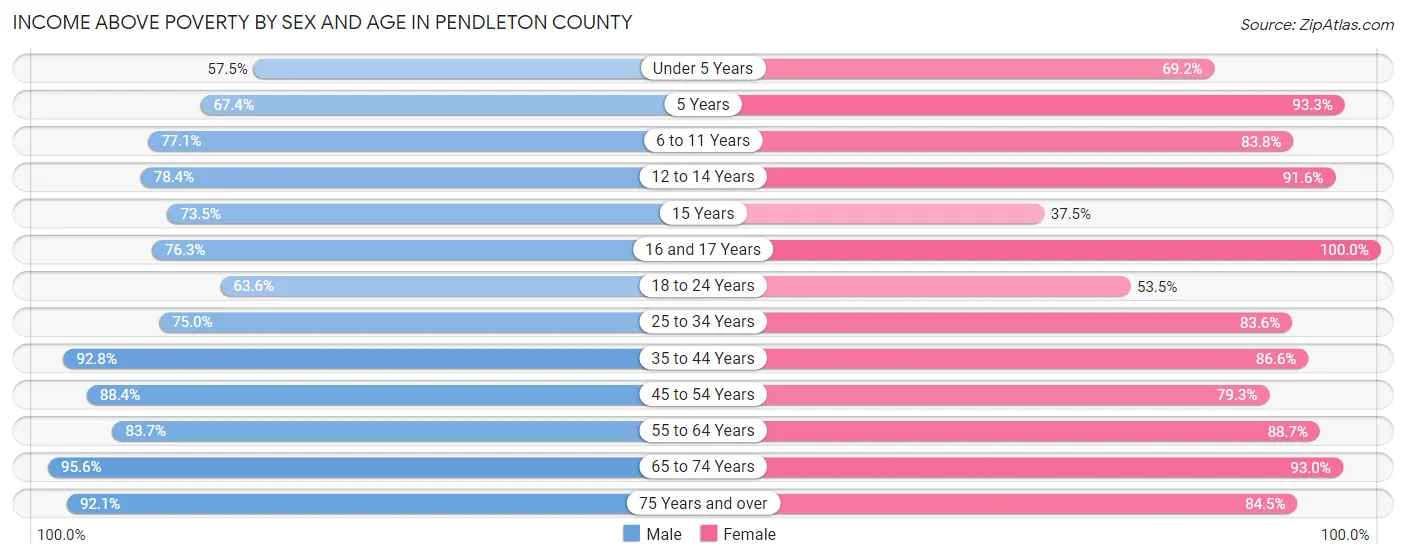
| Age Bracket | Male | Female |
| Under 5 Years | 96 (57.5%) | 74 (69.2%) |
| 5 Years | 33 (67.3%) | 14 (93.3%) |
| 6 to 11 Years | 141 (77.0%) | 176 (83.8%) |
| 12 to 14 Years | 69 (78.4%) | 76 (91.6%) |
| 15 Years | 36 (73.5%) | 6 (37.5%) |
| 16 and 17 Years | 58 (76.3%) | 49 (100.0%) |
| 18 to 24 Years | 152 (63.6%) | 84 (53.5%) |
| 25 to 34 Years | 171 (75.0%) | 229 (83.6%) |
| 35 to 44 Years | 321 (92.8%) | 264 (86.6%) |
| 45 to 54 Years | 329 (88.4%) | 257 (79.3%) |
| 55 to 64 Years | 461 (83.7%) | 448 (88.7%) |
| 65 to 74 Years | 437 (95.6%) | 422 (92.9%) |
| 75 Years and over | 328 (92.1%) | 328 (84.5%) |
| Total | 2,632 (83.3%) | 2,427 (84.1%) |
Income Below Poverty Among Married-Couple Families in Pendleton County
The poverty statistics for married-couple families in Pendleton County show that 7.1% or 101 of the total 1,419 families live below the poverty line. Families with 5 or more children have the highest poverty rate of 100.0%, comprising of 4 families. On the other hand, families with no children have the lowest poverty rate of 6.0%, which includes 64 families.
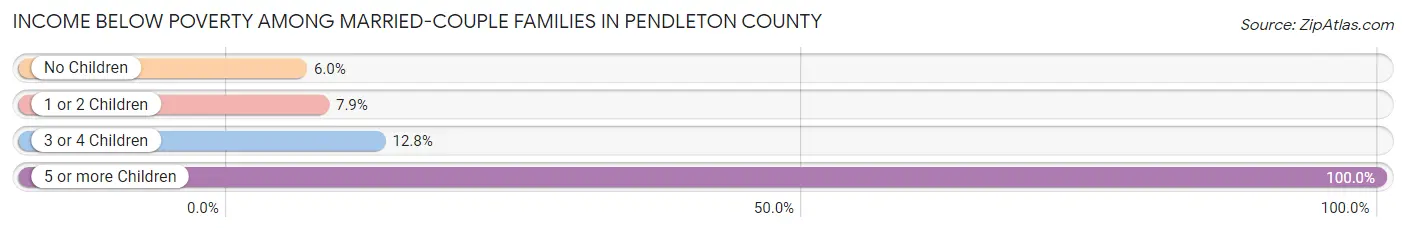
| Children | Above Poverty | Below Poverty |
| No Children | 1,002 (94.0%) | 64 (6.0%) |
| 1 or 2 Children | 221 (92.1%) | 19 (7.9%) |
| 3 or 4 Children | 95 (87.2%) | 14 (12.8%) |
| 5 or more Children | 0 (0.0%) | 4 (100.0%) |
| Total | 1,318 (92.9%) | 101 (7.1%) |
Income Below Poverty Among Single-Parent Households in Pendleton County
According to the poverty data in Pendleton County, 9.8% or 10 single-father households and 27.8% or 45 single-mother households are living below the poverty line. Among single-father households, those with 1 or 2 children have the highest poverty rate, with 3 households (100.0%) experiencing poverty. Likewise, among single-mother households, those with 3 or 4 children have the highest poverty rate, with 24 households (52.2%) falling below the poverty line.
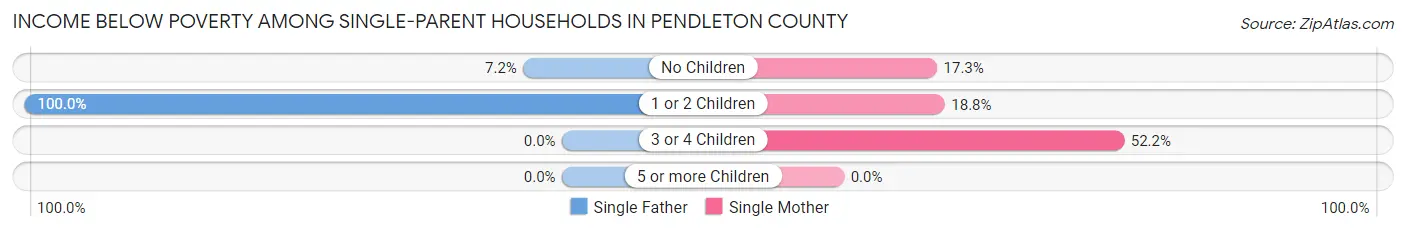
| Children | Single Father | Single Mother |
| No Children | 7 (7.2%) | 9 (17.3%) |
| 1 or 2 Children | 3 (100.0%) | 12 (18.8%) |
| 3 or 4 Children | 0 (0.0%) | 24 (52.2%) |
| 5 or more Children | 0 (0.0%) | 0 (0.0%) |
| Total | 10 (9.8%) | 45 (27.8%) |
Income Below Poverty Among Married-Couple vs Single-Parent Households in Pendleton County
The poverty data for Pendleton County shows that 101 of the married-couple family households (7.1%) and 55 of the single-parent households (20.8%) are living below the poverty level. Within the married-couple family households, those with 5 or more children have the highest poverty rate, with 4 households (100.0%) falling below the poverty line. Among the single-parent households, those with 3 or 4 children have the highest poverty rate, with 24 household (50.0%) living below poverty.
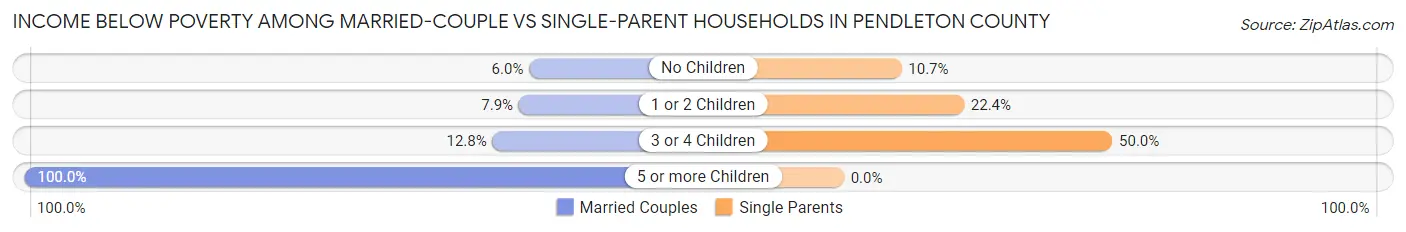
| Children | Married-Couple Families | Single-Parent Households |
| No Children | 64 (6.0%) | 16 (10.7%) |
| 1 or 2 Children | 19 (7.9%) | 15 (22.4%) |
| 3 or 4 Children | 14 (12.8%) | 24 (50.0%) |
| 5 or more Children | 4 (100.0%) | 0 (0.0%) |
| Total | 101 (7.1%) | 55 (20.8%) |
Race in Pendleton County
The most populous races in Pendleton County are White / Caucasian (5,839 | 94.9%), Black / African American (205 | 3.3%), and Hispanic or Latino (90 | 1.5%).
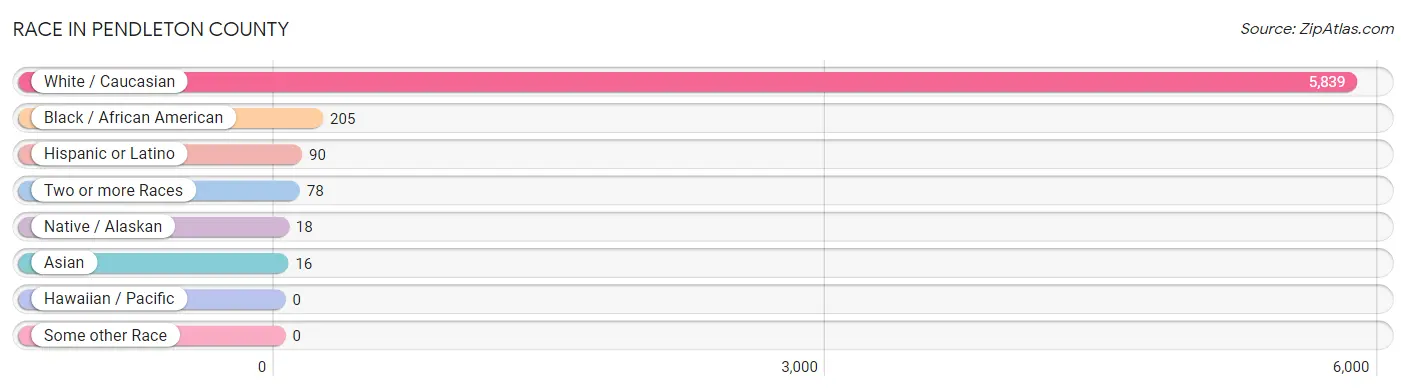
| Race | # Population | % Population |
| Asian | 16 | 0.3% |
| Black / African American | 205 | 3.3% |
| Hawaiian / Pacific | 0 | 0.0% |
| Hispanic or Latino | 90 | 1.5% |
| Native / Alaskan | 18 | 0.3% |
| White / Caucasian | 5,839 | 94.9% |
| Two or more Races | 78 | 1.3% |
| Some other Race | 0 | 0.0% |
| Total | 6,156 | 100.0% |
Ancestry in Pendleton County
The most populous ancestries reported in Pendleton County are German (2,200 | 35.7%), English (388 | 6.3%), Irish (314 | 5.1%), American (255 | 4.1%), and Italian (152 | 2.5%), together accounting for 53.8% of all Pendleton County residents.
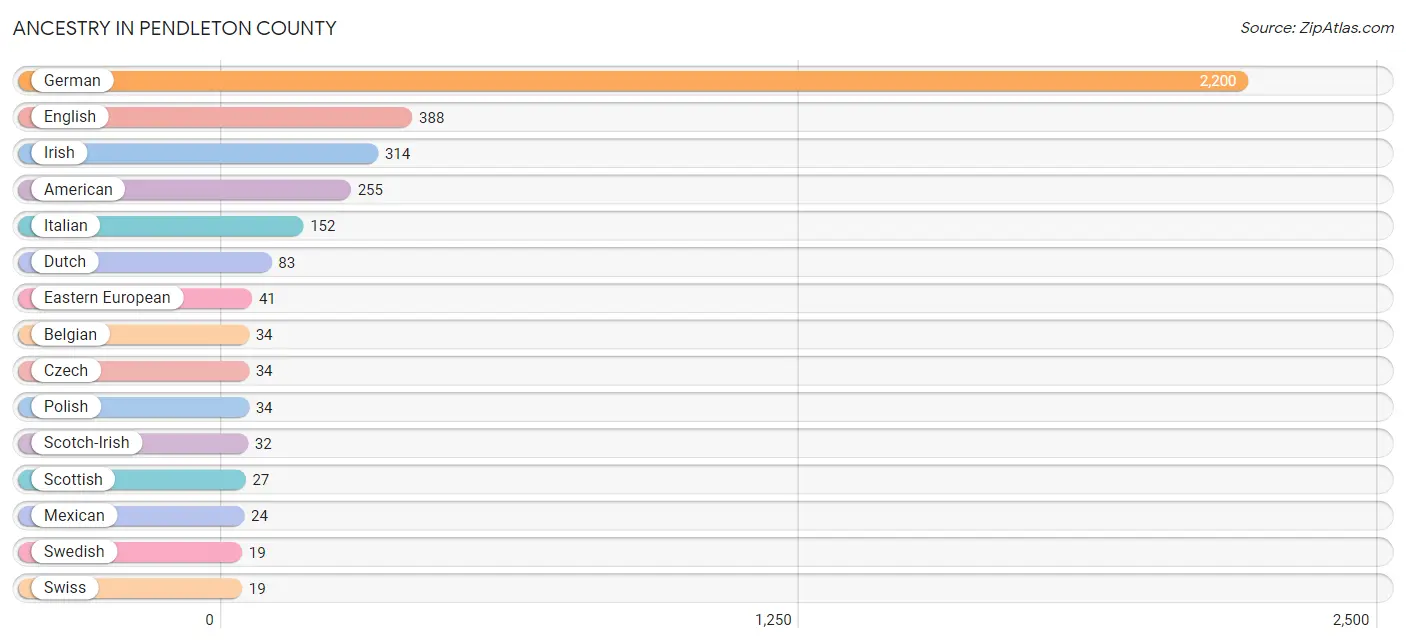
| Ancestry | # Population | % Population |
| American | 255 | 4.1% |
| Arab | 2 | 0.0% |
| Belgian | 34 | 0.5% |
| British | 9 | 0.2% |
| Canadian | 6 | 0.1% |
| Cherokee | 5 | 0.1% |
| Czech | 34 | 0.5% |
| Dutch | 83 | 1.3% |
| Eastern European | 41 | 0.7% |
| English | 388 | 6.3% |
| European | 3 | 0.1% |
| French | 11 | 0.2% |
| French Canadian | 7 | 0.1% |
| German | 2,200 | 35.7% |
| Haitian | 2 | 0.0% |
| Irish | 314 | 5.1% |
| Italian | 152 | 2.5% |
| Lebanese | 2 | 0.0% |
| Lithuanian | 3 | 0.1% |
| Mexican | 24 | 0.4% |
| Northern European | 3 | 0.1% |
| Norwegian | 9 | 0.2% |
| Polish | 34 | 0.5% |
| Russian | 7 | 0.1% |
| Scotch-Irish | 32 | 0.5% |
| Scottish | 27 | 0.4% |
| Swedish | 19 | 0.3% |
| Swiss | 19 | 0.3% |
| Thai | 10 | 0.2% | View All 29 Rows |
Immigrants in Pendleton County
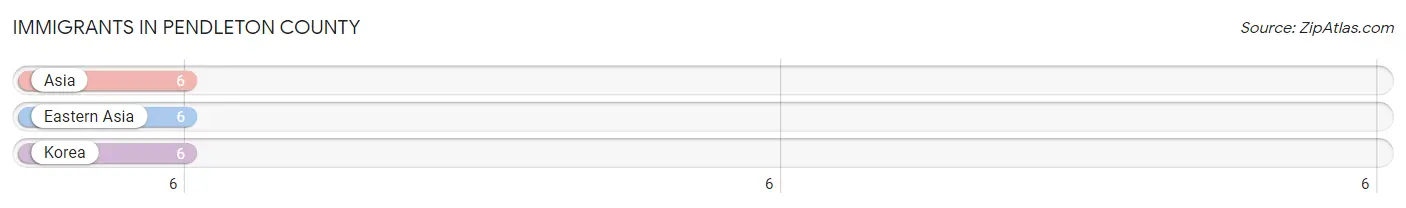
The most numerous immigrant groups reported in Pendleton County came from Asia (6 | 0.1%), Eastern Asia (6 | 0.1%), and Korea (6 | 0.1%), together accounting for 0.3% of all Pendleton County residents.
| Immigration Origin | # Population | % Population |
| Asia | 6 | 0.1% |
| Eastern Asia | 6 | 0.1% |
| Korea | 6 | 0.1% | View All 3 Rows |
Sex and Age in Pendleton County
Sex and Age in Pendleton County
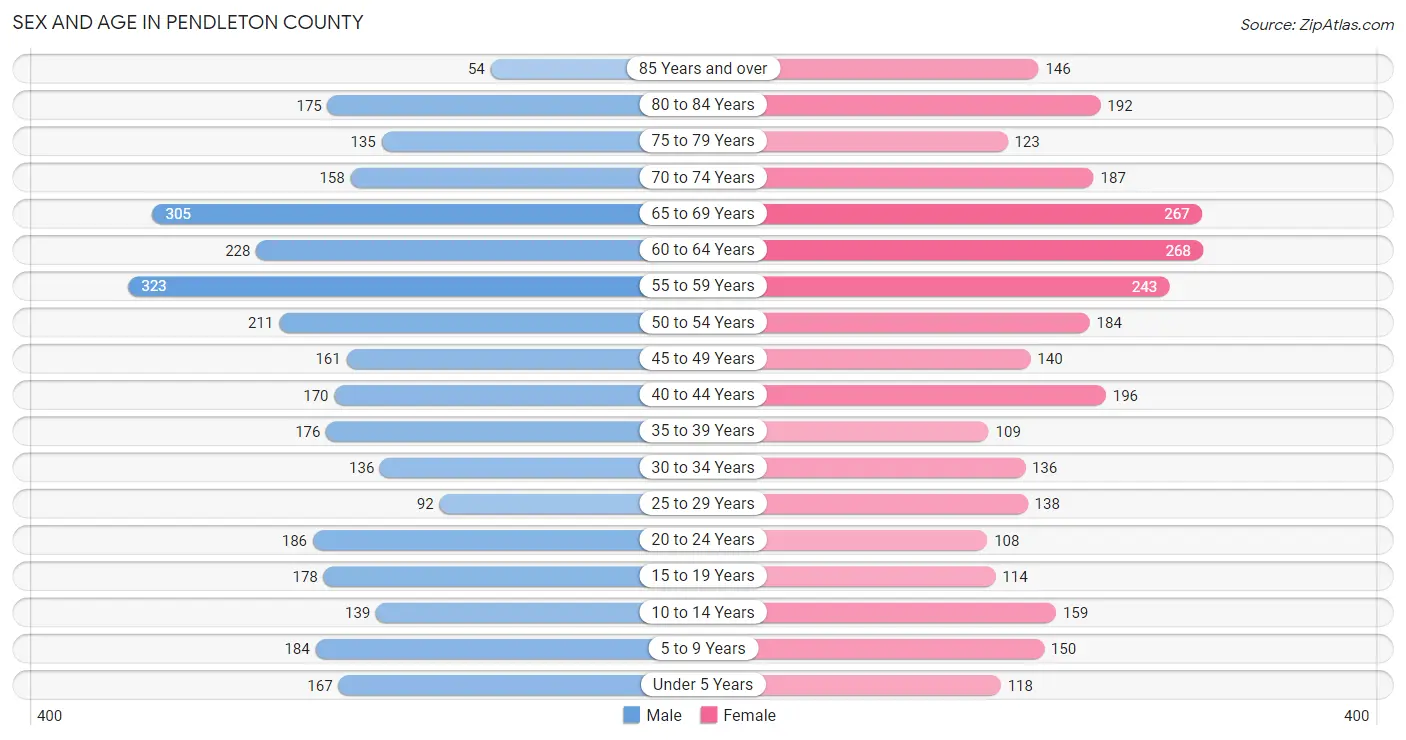
The most populous age groups in Pendleton County are 55 to 59 Years (323 | 10.2%) for men and 60 to 64 Years (268 | 9.0%) for women.
| Age Bracket | Male | Female |
| Under 5 Years | 167 (5.2%) | 118 (4.0%) |
| 5 to 9 Years | 184 (5.8%) | 150 (5.0%) |
| 10 to 14 Years | 139 (4.4%) | 159 (5.3%) |
| 15 to 19 Years | 178 (5.6%) | 114 (3.8%) |
| 20 to 24 Years | 186 (5.9%) | 108 (3.6%) |
| 25 to 29 Years | 92 (2.9%) | 138 (4.6%) |
| 30 to 34 Years | 136 (4.3%) | 136 (4.6%) |
| 35 to 39 Years | 176 (5.5%) | 109 (3.7%) |
| 40 to 44 Years | 170 (5.3%) | 196 (6.6%) |
| 45 to 49 Years | 161 (5.1%) | 140 (4.7%) |
| 50 to 54 Years | 211 (6.6%) | 184 (6.2%) |
| 55 to 59 Years | 323 (10.2%) | 243 (8.2%) |
| 60 to 64 Years | 228 (7.2%) | 268 (9.0%) |
| 65 to 69 Years | 305 (9.6%) | 267 (9.0%) |
| 70 to 74 Years | 158 (5.0%) | 187 (6.3%) |
| 75 to 79 Years | 135 (4.3%) | 123 (4.1%) |
| 80 to 84 Years | 175 (5.5%) | 192 (6.5%) |
| 85 Years and over | 54 (1.7%) | 146 (4.9%) |
| Total | 3,178 (100.0%) | 2,978 (100.0%) |
Families and Households in Pendleton County
Median Family Size in Pendleton County
The median family size in Pendleton County is 3.05 persons per family, with single female/mother families (162 | 9.6%) accounting for the largest median family size of 4.76 persons per family. On the other hand, single male/father families (102 | 6.1%) represent the smallest median family size with 2.60 persons per family.

| Family Type | # Families | Family Size |
| Married-Couple | 1,419 (84.3%) | 2.88 |
| Single Male/Father | 102 (6.1%) | 2.60 |
| Single Female/Mother | 162 (9.6%) | 4.76 |
| Total Families | 1,683 (100.0%) | 3.05 |
Median Household Size in Pendleton County
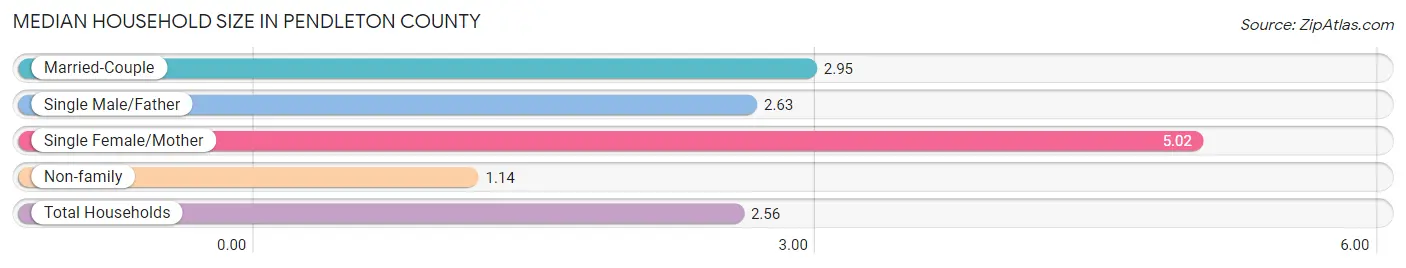
The median household size in Pendleton County is 2.56 persons per household, with single female/mother households (162 | 6.9%) accounting for the largest median household size of 5.02 persons per household. non-family households (678 | 28.7%) represent the smallest median household size with 1.14 persons per household.
| Household Type | # Households | Household Size |
| Married-Couple | 1,419 (60.1%) | 2.95 |
| Single Male/Father | 102 (4.3%) | 2.63 |
| Single Female/Mother | 162 (6.9%) | 5.02 |
| Non-family | 678 (28.7%) | 1.14 |
| Total Households | 2,361 (100.0%) | 2.56 |
Household Size by Marriage Status in Pendleton County
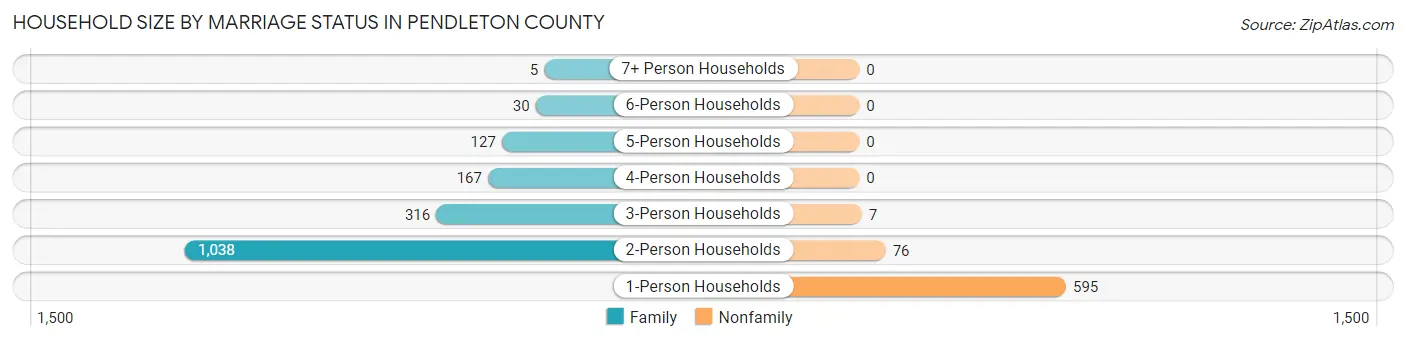
Out of a total of 2,361 households in Pendleton County, 1,683 (71.3%) are family households, while 678 (28.7%) are nonfamily households. The most numerous type of family households are 2-person households, comprising 1,038, and the most common type of nonfamily households are 1-person households, comprising 595.
| Household Size | Family Households | Nonfamily Households |
| 1-Person Households | - | 595 (25.2%) |
| 2-Person Households | 1,038 (44.0%) | 76 (3.2%) |
| 3-Person Households | 316 (13.4%) | 7 (0.3%) |
| 4-Person Households | 167 (7.1%) | 0 (0.0%) |
| 5-Person Households | 127 (5.4%) | 0 (0.0%) |
| 6-Person Households | 30 (1.3%) | 0 (0.0%) |
| 7+ Person Households | 5 (0.2%) | 0 (0.0%) |
| Total | 1,683 (71.3%) | 678 (28.7%) |
Female Fertility in Pendleton County
Fertility by Age in Pendleton County
Average fertility rate in Pendleton County is 36.0 births per 1,000 women. Women in the age bracket of 20 to 34 years have the highest fertility rate with 76.0 births per 1,000 women. Women in the age bracket of 20 to 34 years acount for 78.4% of all women with births.
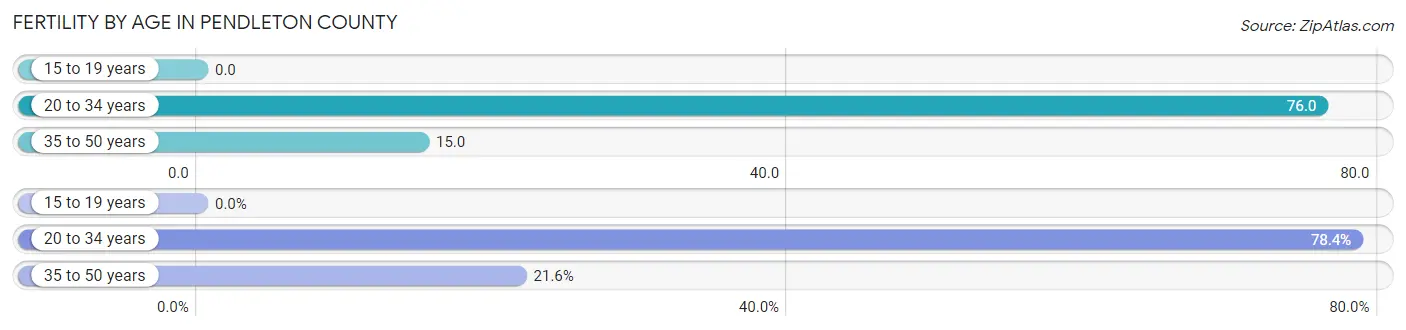
| Age Bracket | Women with Births | Births / 1,000 Women |
| 15 to 19 years | 0 (0.0%) | 0.0 |
| 20 to 34 years | 29 (78.4%) | 76.0 |
| 35 to 50 years | 8 (21.6%) | 15.0 |
| Total | 37 (100.0%) | 36.0 |
Fertility by Age by Marriage Status in Pendleton County
73.0% of women with births (37) in Pendleton County are married. The highest percentage of unmarried women with births falls into 20 to 34 years age bracket with 34.5% of them unmarried at the time of birth, while the lowest percentage of unmarried women with births belong to 35 to 50 years age bracket with 0.0% of them unmarried.
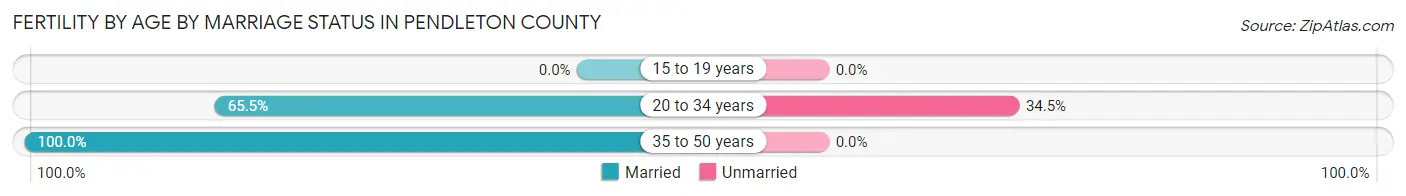
| Age Bracket | Married | Unmarried |
| 15 to 19 years | 0 (0.0%) | 0 (0.0%) |
| 20 to 34 years | 19 (65.5%) | 10 (34.5%) |
| 35 to 50 years | 8 (100.0%) | 0 (0.0%) |
| Total | 27 (73.0%) | 10 (27.0%) |
Fertility by Education in Pendleton County
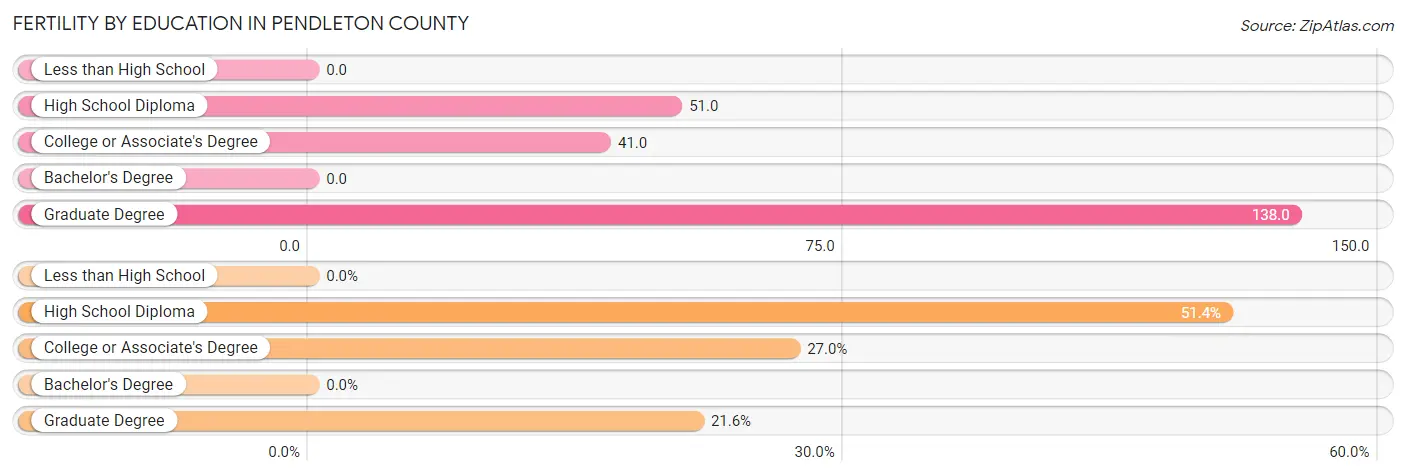
| Educational Attainment | Women with Births | Births / 1,000 Women |
| Less than High School | 0 (0.0%) | 0.0 |
| High School Diploma | 19 (51.3%) | 51.0 |
| College or Associate's Degree | 10 (27.0%) | 41.0 |
| Bachelor's Degree | 0 (0.0%) | 0.0 |
| Graduate Degree | 8 (21.6%) | 138.0 |
| Total | 37 (100.0%) | 36.0 |
Fertility by Education by Marriage Status in Pendleton County
27.0% of women with births in Pendleton County are unmarried. Women with the educational attainment of high school diploma are most likely to be married with 100.0% of them married at childbirth, while women with the educational attainment of college or associate's degree are least likely to be married with 100.0% of them unmarried at childbirth.
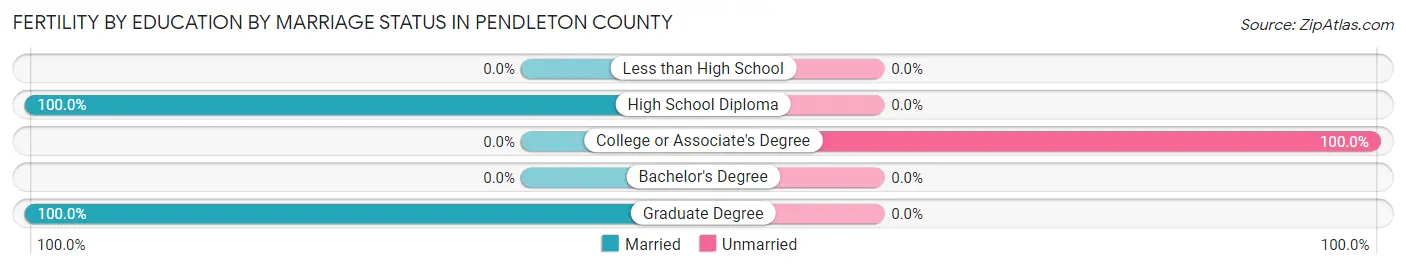
| Educational Attainment | Married | Unmarried |
| Less than High School | 0 (0.0%) | 0 (0.0%) |
| High School Diploma | 19 (100.0%) | 0 (0.0%) |
| College or Associate's Degree | 0 (0.0%) | 10 (100.0%) |
| Bachelor's Degree | 0 (0.0%) | 0 (0.0%) |
| Graduate Degree | 8 (100.0%) | 0 (0.0%) |
| Total | 27 (73.0%) | 10 (27.0%) |
Employment Characteristics in Pendleton County
Employment by Class of Employer in Pendleton County
Among the 2,432 employed individuals in Pendleton County, private company employees (1,395 | 57.4%), local government employees (284 | 11.7%), and self-employed (not incorporated) (270 | 11.1%) make up the most common classes of employment.
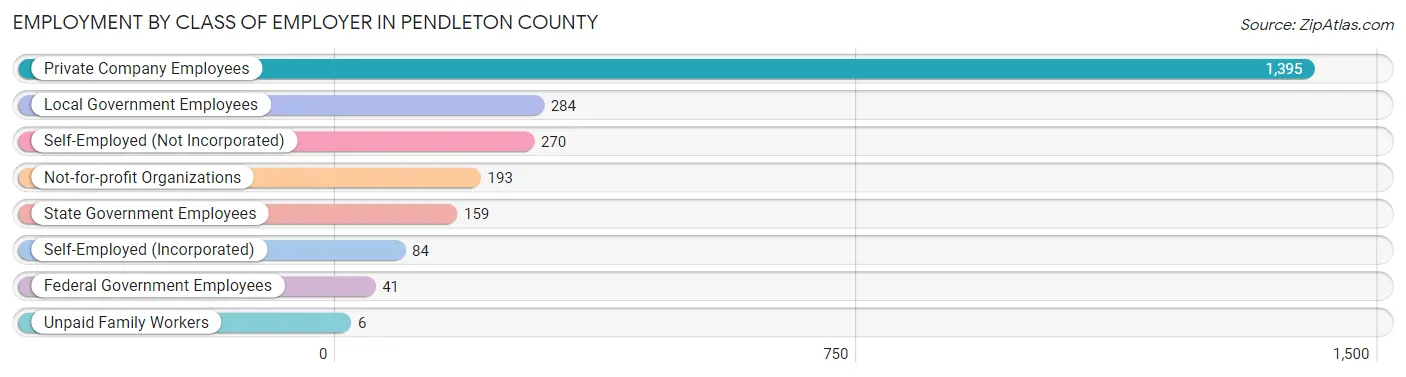
| Employer Class | # Employees | % Employees |
| Private Company Employees | 1,395 | 57.4% |
| Self-Employed (Incorporated) | 84 | 3.5% |
| Self-Employed (Not Incorporated) | 270 | 11.1% |
| Not-for-profit Organizations | 193 | 7.9% |
| Local Government Employees | 284 | 11.7% |
| State Government Employees | 159 | 6.5% |
| Federal Government Employees | 41 | 1.7% |
| Unpaid Family Workers | 6 | 0.3% |
| Total | 2,432 | 100.0% |
Employment Status by Age in Pendleton County
According to the labor force statistics for Pendleton County, out of the total population over 16 years of age (5,174), 51.5% or 2,665 individuals are in the labor force, with 7.3% or 195 of them unemployed. The age group with the highest labor force participation rate is 25 to 29 years, with 93.0% or 214 individuals in the labor force. Within the labor force, the 20 to 24 years age range has the highest percentage of unemployed individuals, with 24.8% or 67 of them being unemployed.
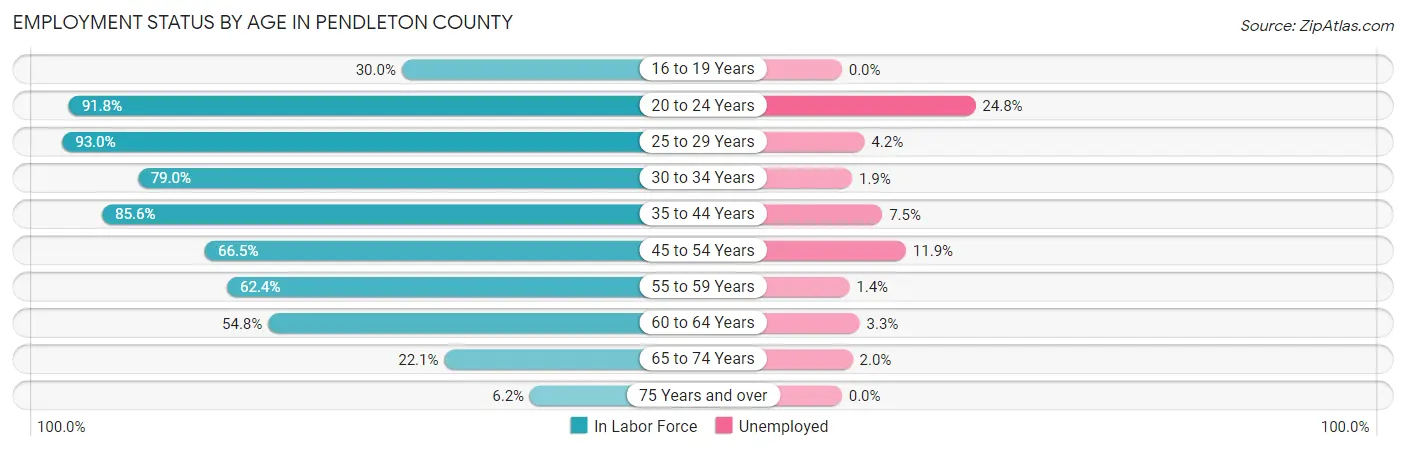
| Age Bracket | In Labor Force | Unemployed |
| 16 to 19 Years | 68 (30.0%) | 0 (0.0%) |
| 20 to 24 Years | 270 (91.8%) | 67 (24.8%) |
| 25 to 29 Years | 214 (93.0%) | 9 (4.2%) |
| 30 to 34 Years | 215 (79.0%) | 4 (1.9%) |
| 35 to 44 Years | 557 (85.6%) | 42 (7.5%) |
| 45 to 54 Years | 463 (66.5%) | 55 (11.9%) |
| 55 to 59 Years | 353 (62.4%) | 5 (1.4%) |
| 60 to 64 Years | 272 (54.8%) | 9 (3.3%) |
| 65 to 74 Years | 203 (22.1%) | 4 (2.0%) |
| 75 Years and over | 51 (6.2%) | 0 (0.0%) |
| Total | 2,665 (51.5%) | 195 (7.3%) |
Employment Status by Educational Attainment in Pendleton County
According to labor force statistics for Pendleton County, 71.2% of individuals (2,073) out of the total population between 25 and 64 years of age (2,911) are in the labor force, with 6.0% or 124 of them being unemployed. The group with the highest labor force participation rate are those with the educational attainment of college / associate degree, with 88.1% or 401 individuals in the labor force. Within the labor force, individuals with less than high school education have the highest percentage of unemployment, with 10.7% or 11 of them being unemployed.
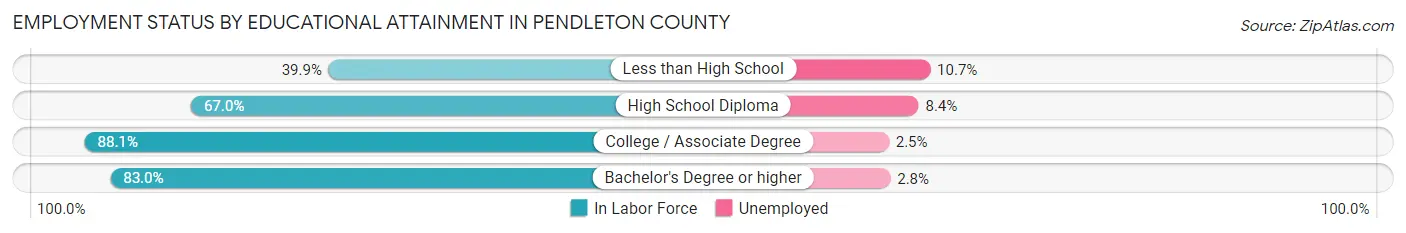
| Educational Attainment | In Labor Force | Unemployed |
| Less than High School | 103 (39.9%) | 28 (10.7%) |
| High School Diploma | 1,064 (67.0%) | 133 (8.4%) |
| College / Associate Degree | 401 (88.1%) | 11 (2.5%) |
| Bachelor's Degree or higher | 506 (83.0%) | 17 (2.8%) |
| Total | 2,073 (71.2%) | 175 (6.0%) |
Employment Occupations by Sex in Pendleton County
Management, Business, Science and Arts Occupations
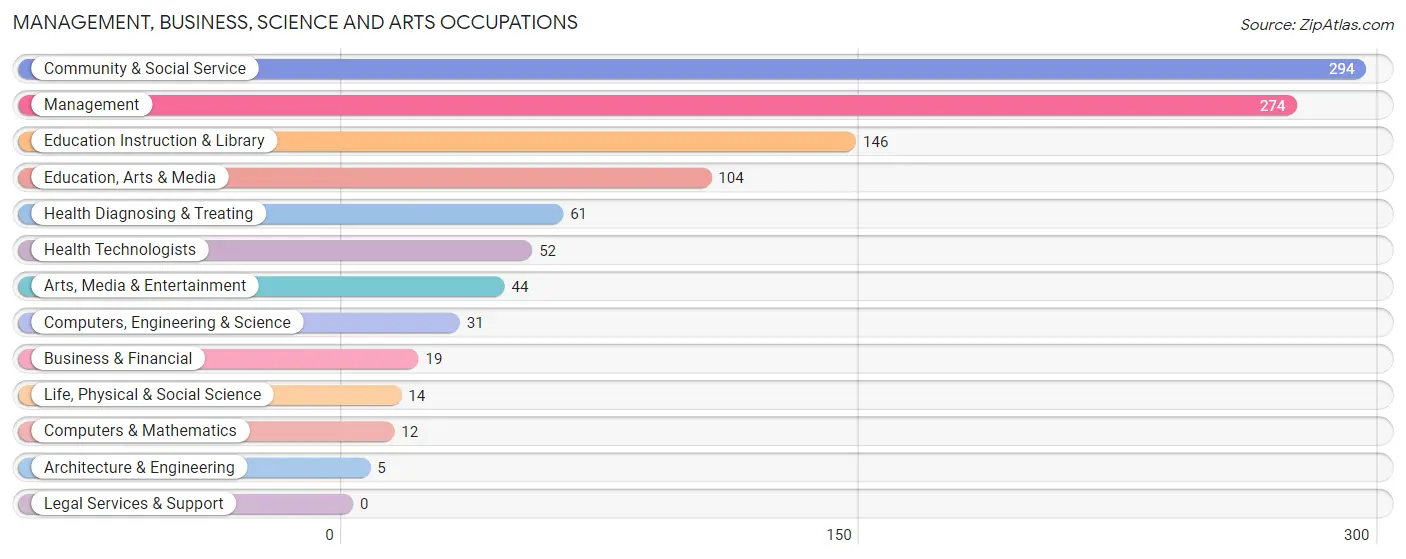
The most common Management, Business, Science and Arts occupations in Pendleton County are Community & Social Service (294 | 11.9%), Management (274 | 11.1%), Education Instruction & Library (146 | 5.9%), Education, Arts & Media (104 | 4.2%), and Health Diagnosing & Treating (61 | 2.5%).
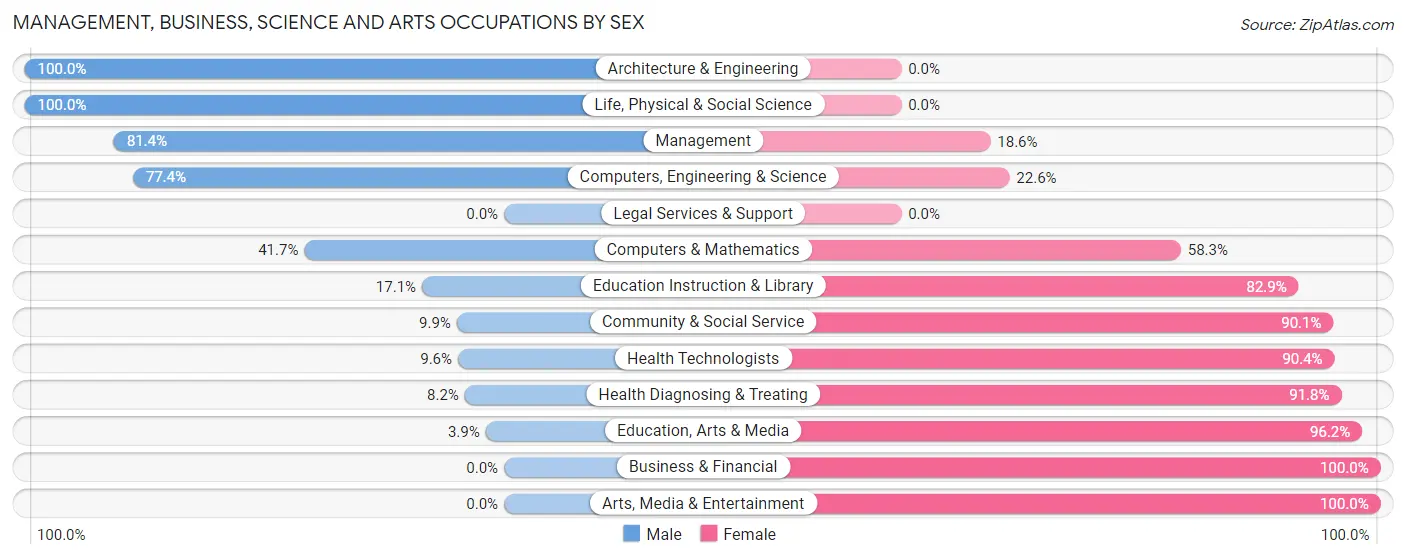
Management, Business, Science and Arts Occupations by Sex
Within the Management, Business, Science and Arts occupations in Pendleton County, the most male-oriented occupations are Architecture & Engineering (100.0%), Life, Physical & Social Science (100.0%), and Management (81.4%), while the most female-oriented occupations are Business & Financial (100.0%), Arts, Media & Entertainment (100.0%), and Education, Arts & Media (96.2%).
| Occupation | Male | Female |
| Management | 223 (81.4%) | 51 (18.6%) |
| Business & Financial | 0 (0.0%) | 19 (100.0%) |
| Computers, Engineering & Science | 24 (77.4%) | 7 (22.6%) |
| Computers & Mathematics | 5 (41.7%) | 7 (58.3%) |
| Architecture & Engineering | 5 (100.0%) | 0 (0.0%) |
| Life, Physical & Social Science | 14 (100.0%) | 0 (0.0%) |
| Community & Social Service | 29 (9.9%) | 265 (90.1%) |
| Education, Arts & Media | 4 (3.8%) | 100 (96.2%) |
| Legal Services & Support | 0 (0.0%) | 0 (0.0%) |
| Education Instruction & Library | 25 (17.1%) | 121 (82.9%) |
| Arts, Media & Entertainment | 0 (0.0%) | 44 (100.0%) |
| Health Diagnosing & Treating | 5 (8.2%) | 56 (91.8%) |
| Health Technologists | 5 (9.6%) | 47 (90.4%) |
| Total (Category) | 281 (41.4%) | 398 (58.6%) |
| Total (Overall) | 1,400 (56.7%) | 1,071 (43.3%) |
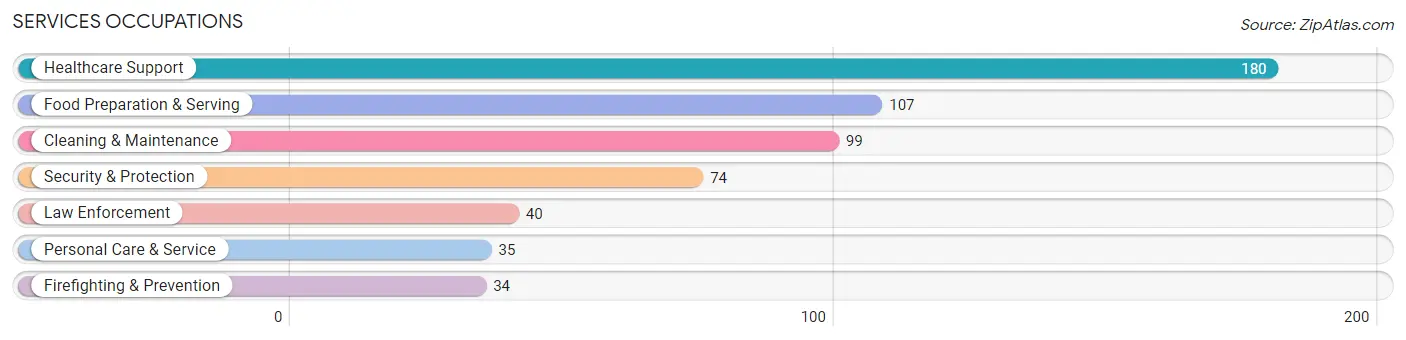
Services Occupations
The most common Services occupations in Pendleton County are Healthcare Support (180 | 7.3%), Food Preparation & Serving (107 | 4.3%), Cleaning & Maintenance (99 | 4.0%), Security & Protection (74 | 3.0%), and Law Enforcement (40 | 1.6%).
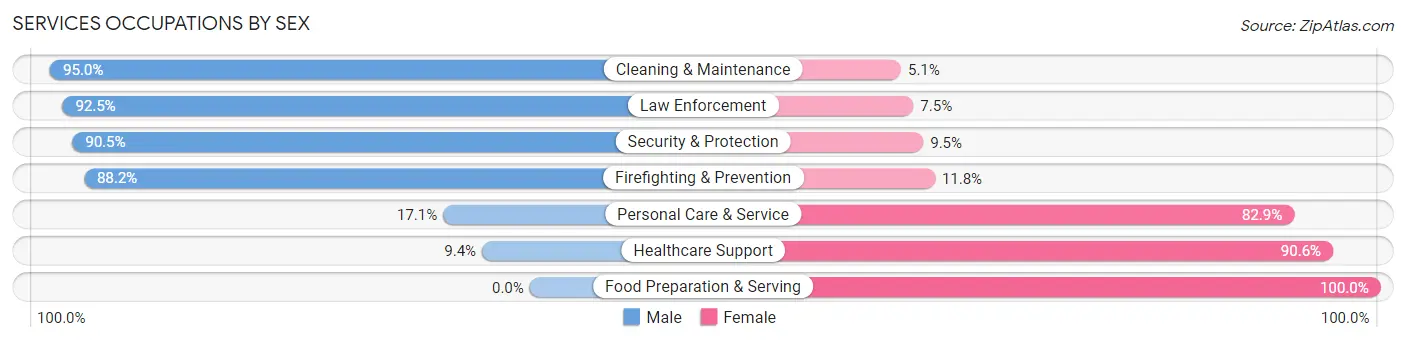
Services Occupations by Sex
Within the Services occupations in Pendleton County, the most male-oriented occupations are Cleaning & Maintenance (95.0%), Law Enforcement (92.5%), and Security & Protection (90.5%), while the most female-oriented occupations are Food Preparation & Serving (100.0%), Healthcare Support (90.6%), and Personal Care & Service (82.9%).
| Occupation | Male | Female |
| Healthcare Support | 17 (9.4%) | 163 (90.6%) |
| Security & Protection | 67 (90.5%) | 7 (9.5%) |
| Firefighting & Prevention | 30 (88.2%) | 4 (11.8%) |
| Law Enforcement | 37 (92.5%) | 3 (7.5%) |
| Food Preparation & Serving | 0 (0.0%) | 107 (100.0%) |
| Cleaning & Maintenance | 94 (95.0%) | 5 (5.1%) |
| Personal Care & Service | 6 (17.1%) | 29 (82.9%) |
| Total (Category) | 184 (37.2%) | 311 (62.8%) |
| Total (Overall) | 1,400 (56.7%) | 1,071 (43.3%) |
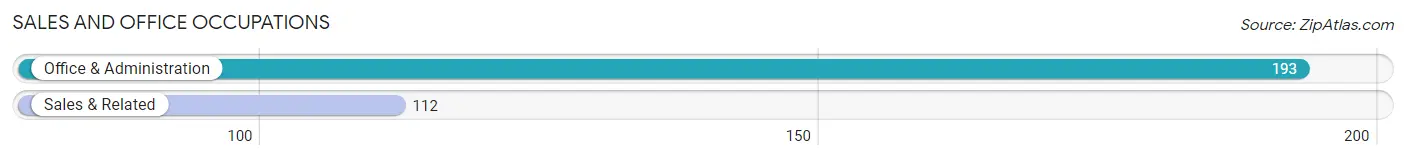
Sales and Office Occupations
The most common Sales and Office occupations in Pendleton County are Office & Administration (193 | 7.8%), and Sales & Related (112 | 4.5%).
Sales and Office Occupations by Sex
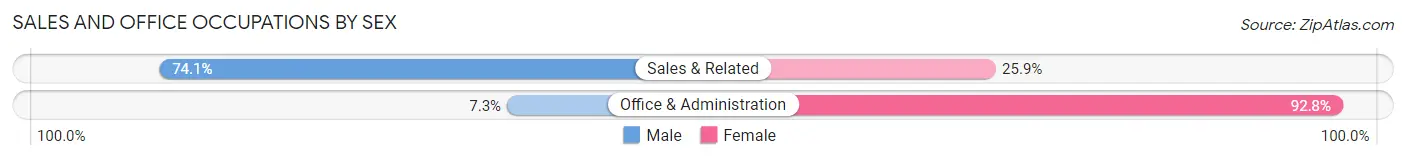
| Occupation | Male | Female |
| Sales & Related | 83 (74.1%) | 29 (25.9%) |
| Office & Administration | 14 (7.2%) | 179 (92.7%) |
| Total (Category) | 97 (31.8%) | 208 (68.2%) |
| Total (Overall) | 1,400 (56.7%) | 1,071 (43.3%) |
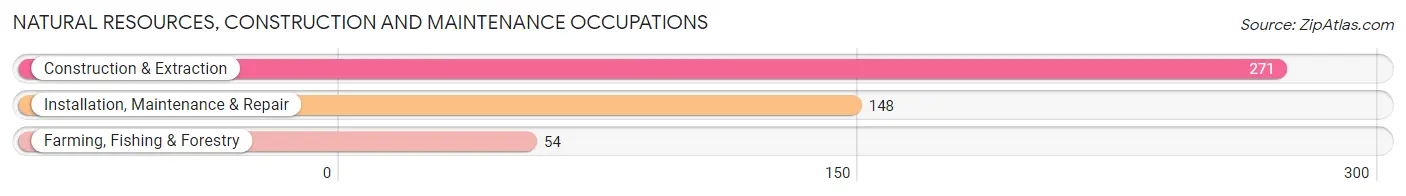
Natural Resources, Construction and Maintenance Occupations
The most common Natural Resources, Construction and Maintenance occupations in Pendleton County are Construction & Extraction (271 | 11.0%), Installation, Maintenance & Repair (148 | 6.0%), and Farming, Fishing & Forestry (54 | 2.2%).
Natural Resources, Construction and Maintenance Occupations by Sex
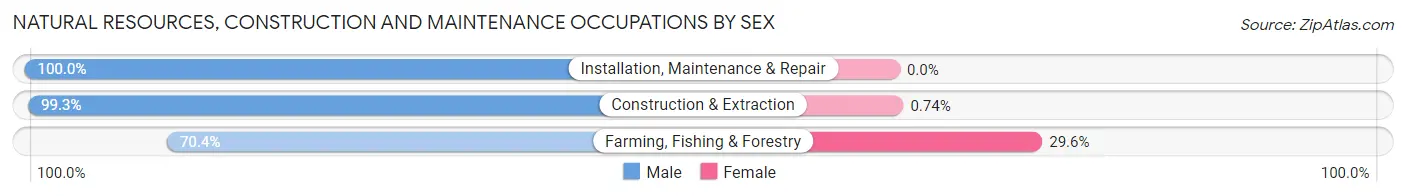
| Occupation | Male | Female |
| Farming, Fishing & Forestry | 38 (70.4%) | 16 (29.6%) |
| Construction & Extraction | 269 (99.3%) | 2 (0.7%) |
| Installation, Maintenance & Repair | 148 (100.0%) | 0 (0.0%) |
| Total (Category) | 455 (96.2%) | 18 (3.8%) |
| Total (Overall) | 1,400 (56.7%) | 1,071 (43.3%) |
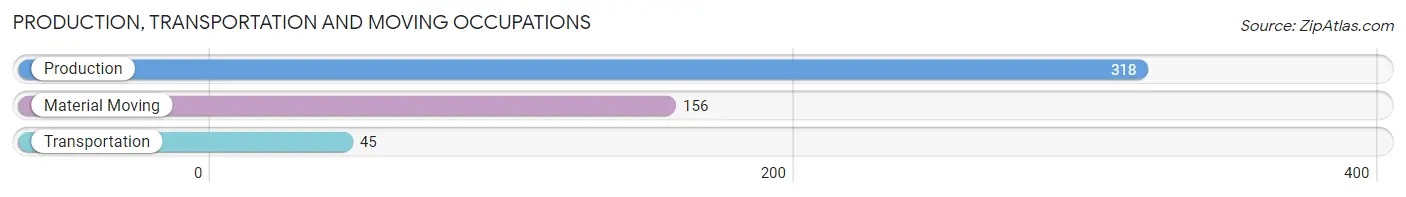
Production, Transportation and Moving Occupations
The most common Production, Transportation and Moving occupations in Pendleton County are Production (318 | 12.9%), Material Moving (156 | 6.3%), and Transportation (45 | 1.8%).
Production, Transportation and Moving Occupations by Sex
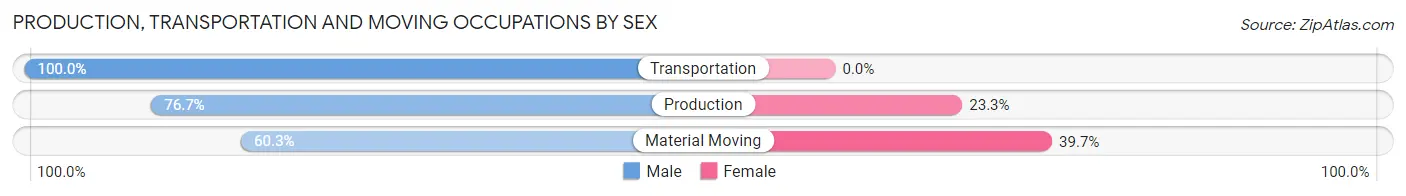
| Occupation | Male | Female |
| Production | 244 (76.7%) | 74 (23.3%) |
| Transportation | 45 (100.0%) | 0 (0.0%) |
| Material Moving | 94 (60.3%) | 62 (39.7%) |
| Total (Category) | 383 (73.8%) | 136 (26.2%) |
| Total (Overall) | 1,400 (56.7%) | 1,071 (43.3%) |
Employment Industries by Sex in Pendleton County
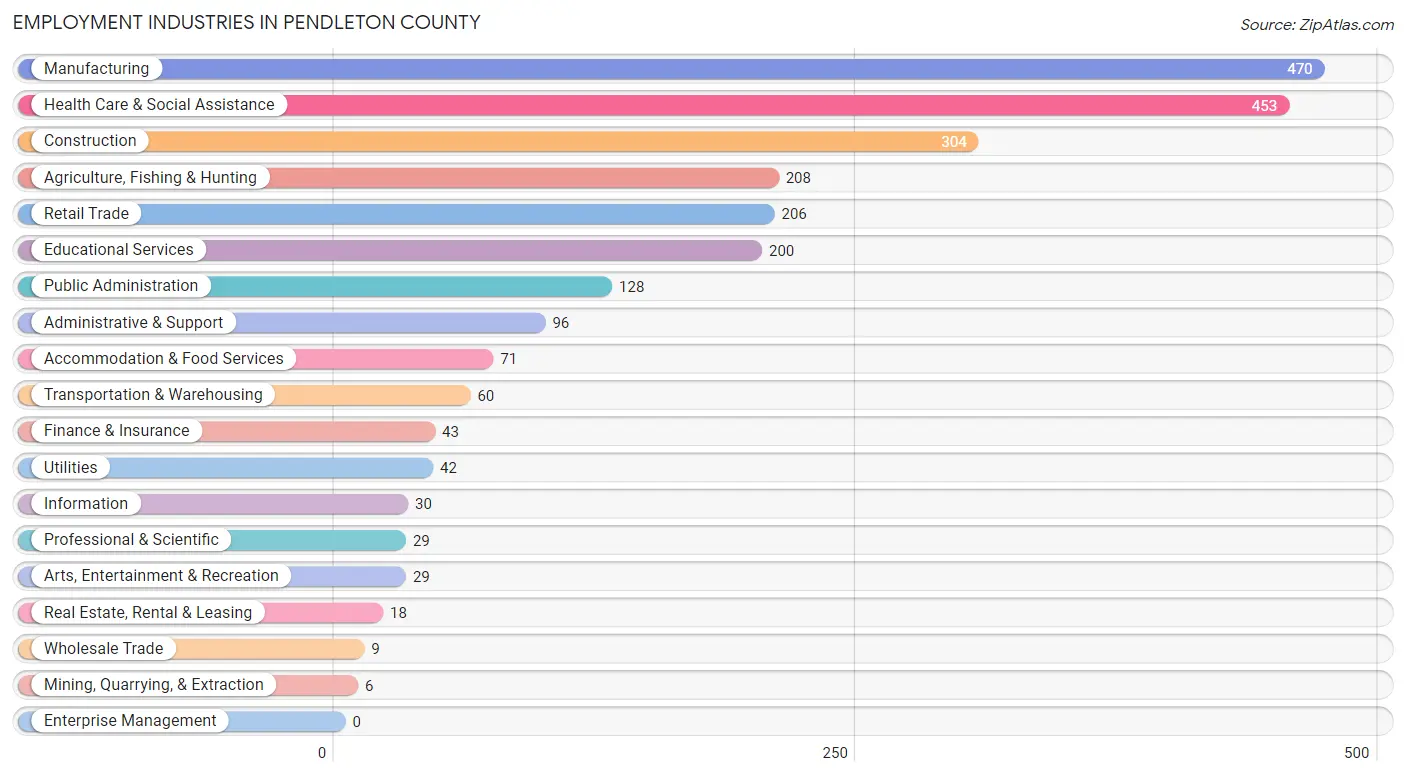
Employment Industries in Pendleton County
The major employment industries in Pendleton County include Manufacturing (470 | 19.0%), Health Care & Social Assistance (453 | 18.3%), Construction (304 | 12.3%), Agriculture, Fishing & Hunting (208 | 8.4%), and Retail Trade (206 | 8.3%).
Employment Industries by Sex in Pendleton County
The Pendleton County industries that see more men than women are Mining, Quarrying, & Extraction (100.0%), Utilities (100.0%), and Construction (98.0%), whereas the industries that tend to have a higher number of women are Professional & Scientific (100.0%), Arts, Entertainment & Recreation (100.0%), and Health Care & Social Assistance (85.4%).
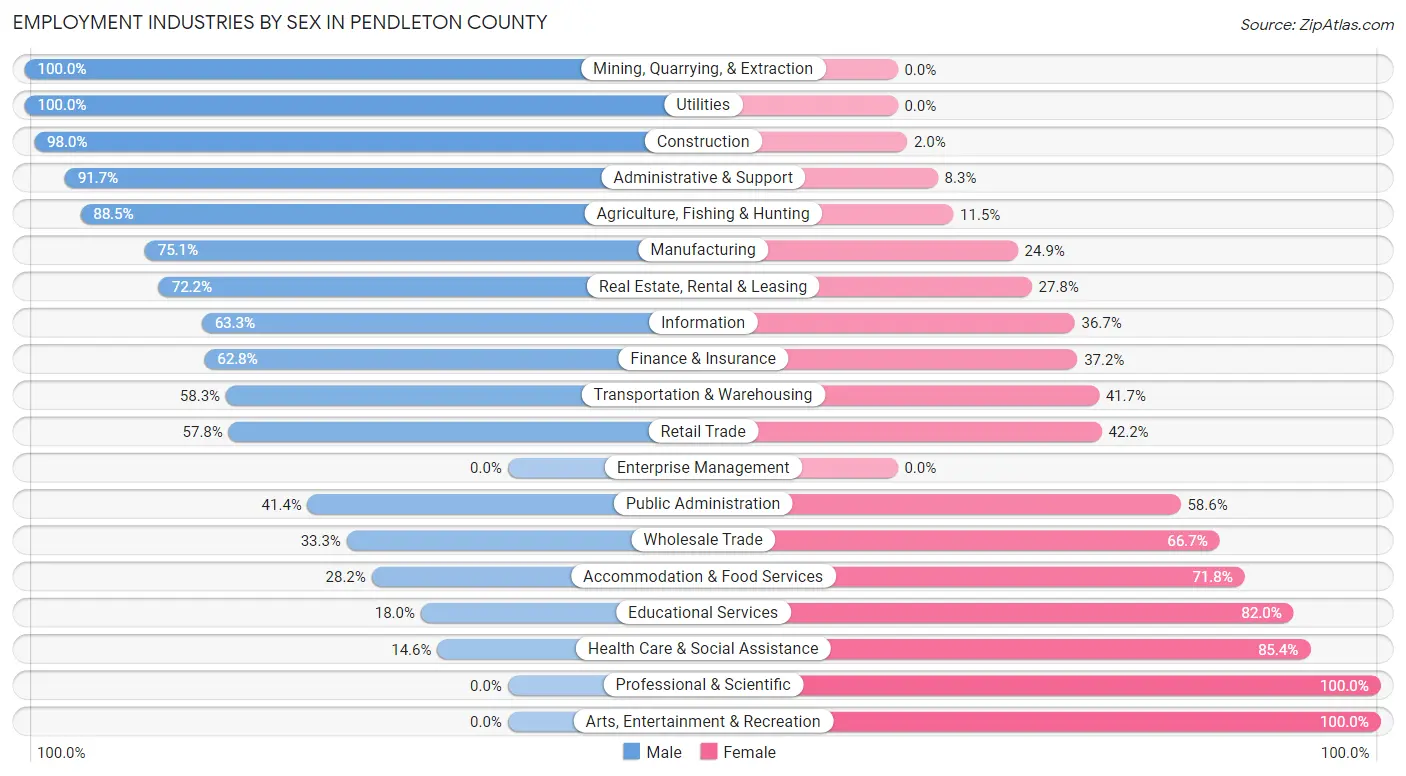
| Industry | Male | Female |
| Agriculture, Fishing & Hunting | 184 (88.5%) | 24 (11.5%) |
| Mining, Quarrying, & Extraction | 6 (100.0%) | 0 (0.0%) |
| Construction | 298 (98.0%) | 6 (2.0%) |
| Manufacturing | 353 (75.1%) | 117 (24.9%) |
| Wholesale Trade | 3 (33.3%) | 6 (66.7%) |
| Retail Trade | 119 (57.8%) | 87 (42.2%) |
| Transportation & Warehousing | 35 (58.3%) | 25 (41.7%) |
| Utilities | 42 (100.0%) | 0 (0.0%) |
| Information | 19 (63.3%) | 11 (36.7%) |
| Finance & Insurance | 27 (62.8%) | 16 (37.2%) |
| Real Estate, Rental & Leasing | 13 (72.2%) | 5 (27.8%) |
| Professional & Scientific | 0 (0.0%) | 29 (100.0%) |
| Enterprise Management | 0 (0.0%) | 0 (0.0%) |
| Administrative & Support | 88 (91.7%) | 8 (8.3%) |
| Educational Services | 36 (18.0%) | 164 (82.0%) |
| Health Care & Social Assistance | 66 (14.6%) | 387 (85.4%) |
| Arts, Entertainment & Recreation | 0 (0.0%) | 29 (100.0%) |
| Accommodation & Food Services | 20 (28.2%) | 51 (71.8%) |
| Public Administration | 53 (41.4%) | 75 (58.6%) |
| Total | 1,400 (56.7%) | 1,071 (43.3%) |
Education in Pendleton County
School Enrollment in Pendleton County
The most common levels of schooling among the 970 students in Pendleton County are elementary school (377 | 38.9%), high school (284 | 29.3%), and middle school (167 | 17.2%).
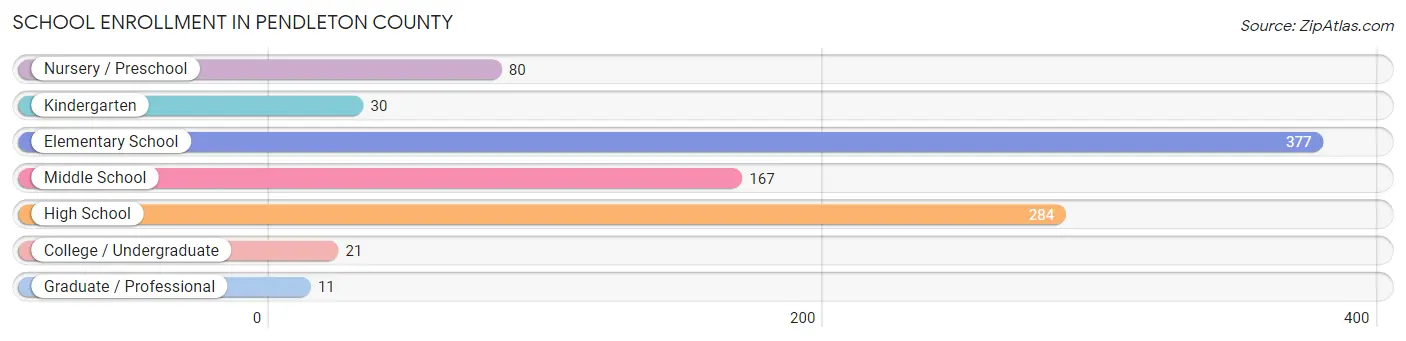
| School Level | # Students | % Students |
| Nursery / Preschool | 80 | 8.3% |
| Kindergarten | 30 | 3.1% |
| Elementary School | 377 | 38.9% |
| Middle School | 167 | 17.2% |
| High School | 284 | 29.3% |
| College / Undergraduate | 21 | 2.2% |
| Graduate / Professional | 11 | 1.1% |
| Total | 970 | 100.0% |
School Enrollment by Age by Funding Source in Pendleton County
Out of a total of 970 students who are enrolled in schools in Pendleton County, 126 (13.0%) attend a private institution, while the remaining 844 (87.0%) are enrolled in public schools. The age group of 20 to 24 year olds has the highest likelihood of being enrolled in private schools, with 17 (100.0% in the age bracket) enrolled. Conversely, the age group of 3 to 4 year olds has the lowest likelihood of being enrolled in a private school, with 62 (100.0% in the age bracket) attending a public institution.
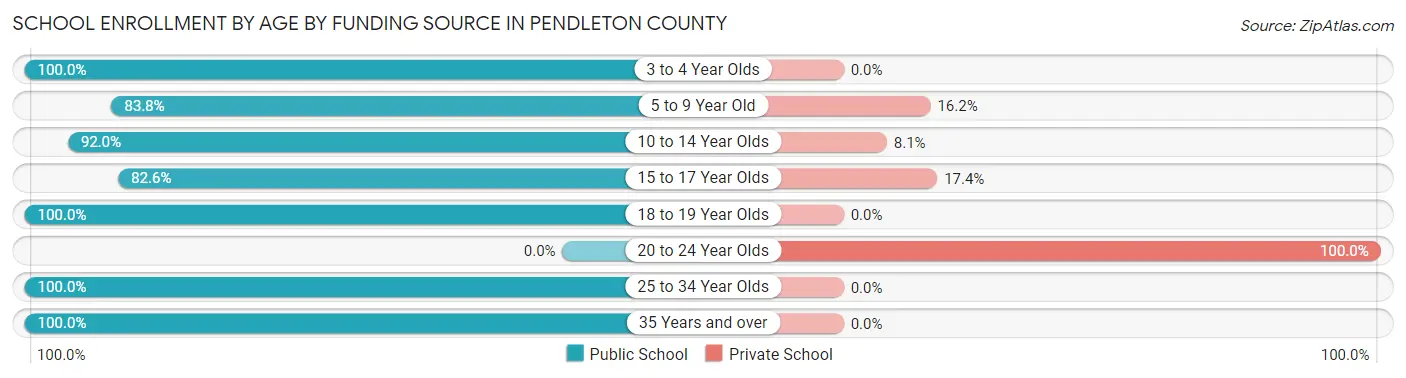
| Age Bracket | Public School | Private School |
| 3 to 4 Year Olds | 62 (100.0%) | 0 (0.0%) |
| 5 to 9 Year Old | 280 (83.8%) | 54 (16.2%) |
| 10 to 14 Year Olds | 274 (91.9%) | 24 (8.1%) |
| 15 to 17 Year Olds | 147 (82.6%) | 31 (17.4%) |
| 18 to 19 Year Olds | 66 (100.0%) | 0 (0.0%) |
| 20 to 24 Year Olds | 0 (0.0%) | 17 (100.0%) |
| 25 to 34 Year Olds | 11 (100.0%) | 0 (0.0%) |
| 35 Years and over | 4 (100.0%) | 0 (0.0%) |
| Total | 844 (87.0%) | 126 (13.0%) |
Educational Attainment by Field of Study in Pendleton County
Science & technology (176 | 17.8%), education (147 | 14.9%), arts & humanities (124 | 12.6%), bio, nature & agricultural (113 | 11.4%), and business (87 | 8.8%) are the most common fields of study among 988 individuals in Pendleton County who have obtained a bachelor's degree or higher.
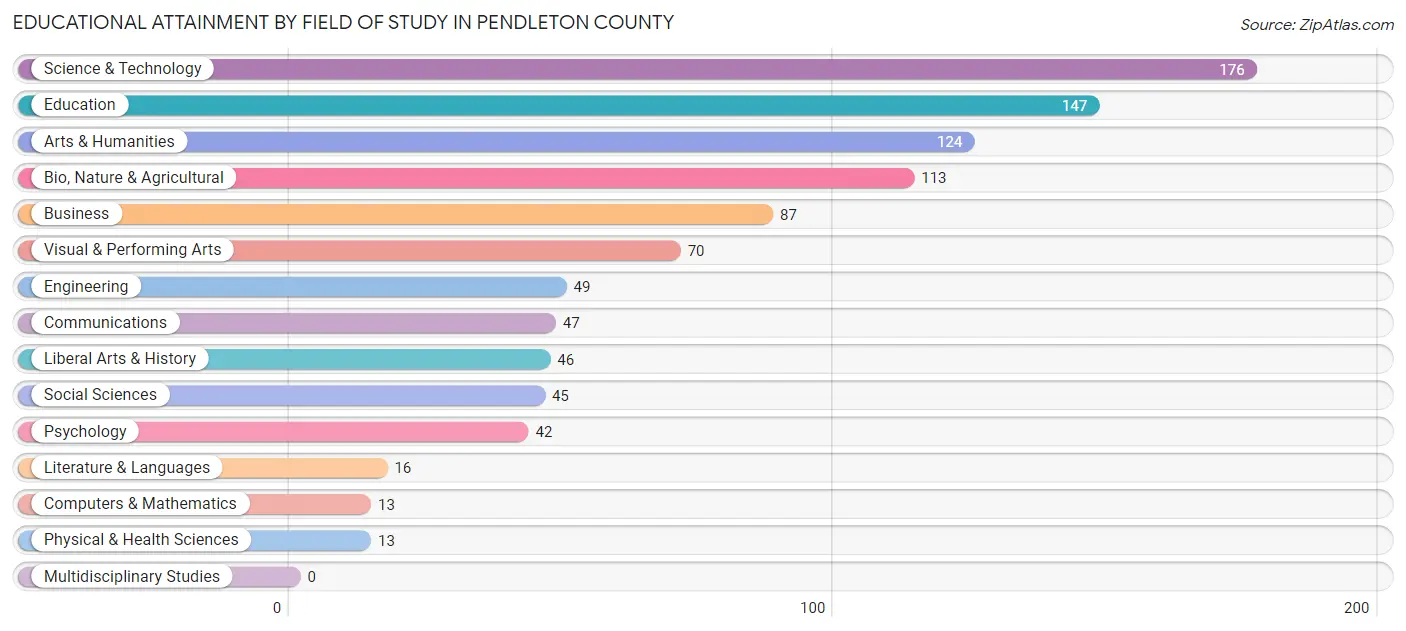
| Field of Study | # Graduates | % Graduates |
| Computers & Mathematics | 13 | 1.3% |
| Bio, Nature & Agricultural | 113 | 11.4% |
| Physical & Health Sciences | 13 | 1.3% |
| Psychology | 42 | 4.3% |
| Social Sciences | 45 | 4.5% |
| Engineering | 49 | 5.0% |
| Multidisciplinary Studies | 0 | 0.0% |
| Science & Technology | 176 | 17.8% |
| Business | 87 | 8.8% |
| Education | 147 | 14.9% |
| Literature & Languages | 16 | 1.6% |
| Liberal Arts & History | 46 | 4.7% |
| Visual & Performing Arts | 70 | 7.1% |
| Communications | 47 | 4.8% |
| Arts & Humanities | 124 | 12.6% |
| Total | 988 | 100.0% |
Transportation & Commute in Pendleton County
Vehicle Availability by Sex in Pendleton County
The most prevalent vehicle ownership categories in Pendleton County are males with 3 vehicles (443, accounting for 32.3%) and females with 3 vehicles (362, making up 41.7%).
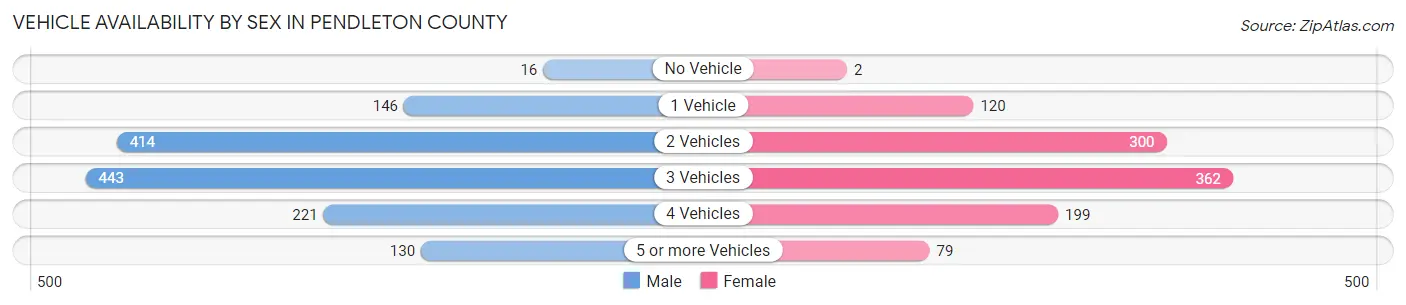
| Vehicles Available | Male | Female |
| No Vehicle | 16 (1.2%) | 2 (0.2%) |
| 1 Vehicle | 146 (10.7%) | 120 (11.3%) |
| 2 Vehicles | 414 (30.2%) | 300 (28.2%) |
| 3 Vehicles | 443 (32.3%) | 362 (34.1%) |
| 4 Vehicles | 221 (16.1%) | 199 (18.7%) |
| 5 or more Vehicles | 130 (9.5%) | 79 (7.4%) |
| Total | 1,370 (100.0%) | 1,062 (100.0%) |
Commute Time in Pendleton County
The most frequently occuring commute durations in Pendleton County are 15 to 19 minutes (333 commuters, 14.9%), 10 to 14 minutes (256 commuters, 11.5%), and 45 to 59 minutes (244 commuters, 10.9%).
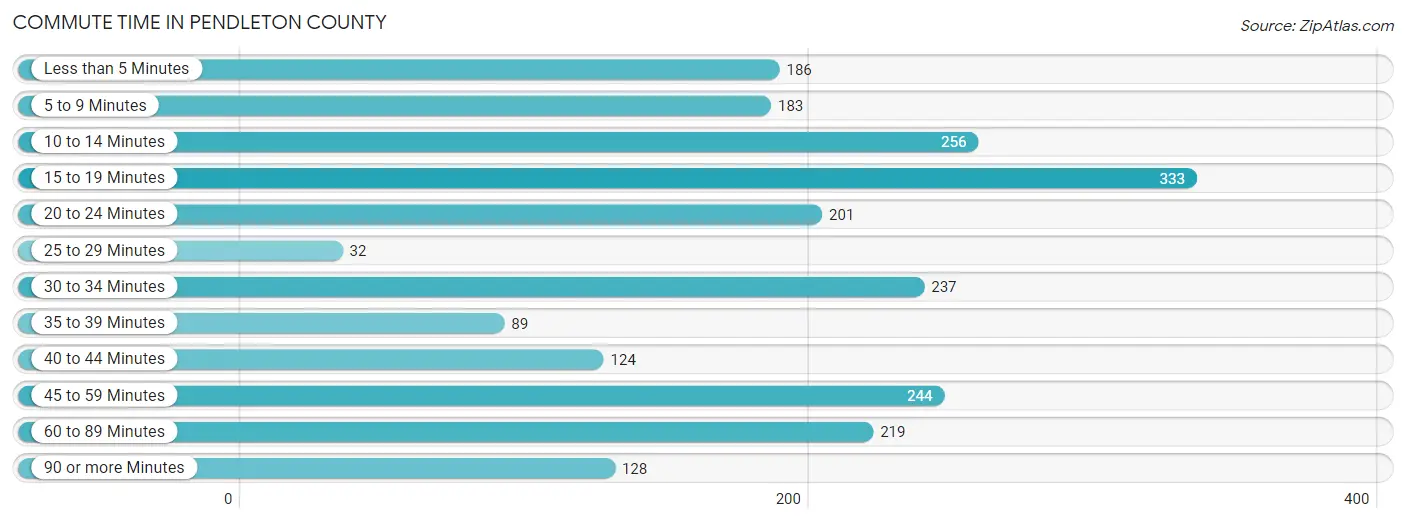
| Commute Time | # Commuters | % Commuters |
| Less than 5 Minutes | 186 | 8.3% |
| 5 to 9 Minutes | 183 | 8.2% |
| 10 to 14 Minutes | 256 | 11.5% |
| 15 to 19 Minutes | 333 | 14.9% |
| 20 to 24 Minutes | 201 | 9.0% |
| 25 to 29 Minutes | 32 | 1.4% |
| 30 to 34 Minutes | 237 | 10.6% |
| 35 to 39 Minutes | 89 | 4.0% |
| 40 to 44 Minutes | 124 | 5.6% |
| 45 to 59 Minutes | 244 | 10.9% |
| 60 to 89 Minutes | 219 | 9.8% |
| 90 or more Minutes | 128 | 5.7% |
Commute Time by Sex in Pendleton County
The most common commute times in Pendleton County are 15 to 19 minutes (189 commuters, 15.4%) for males and 10 to 14 minutes (146 commuters, 14.5%) for females.
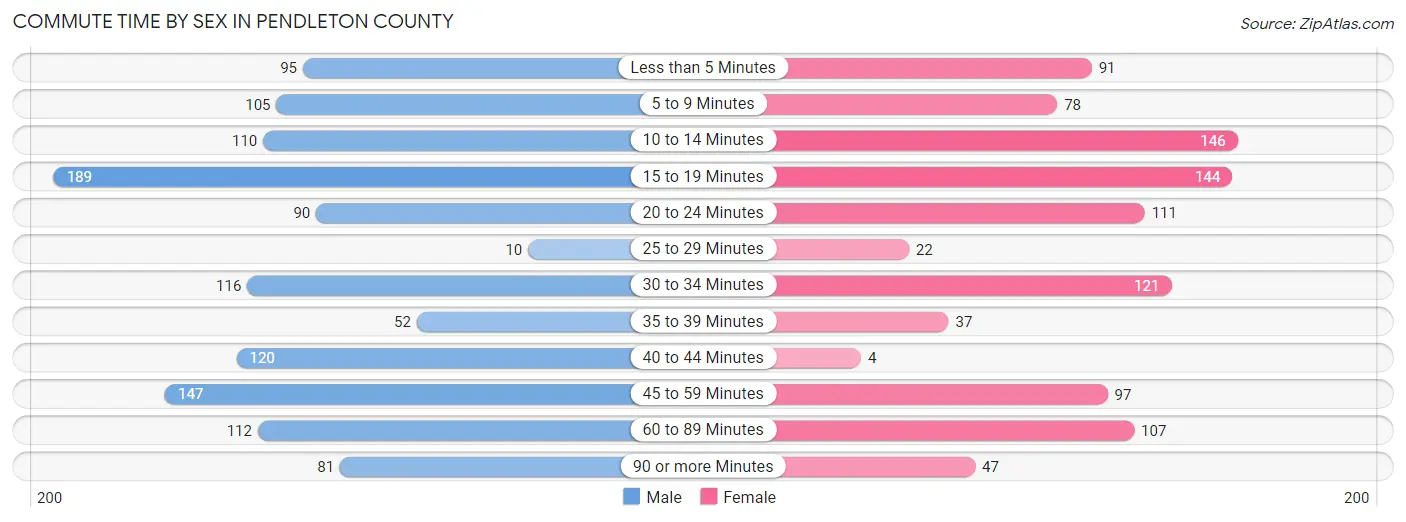
| Commute Time | Male | Female |
| Less than 5 Minutes | 95 (7.7%) | 91 (9.0%) |
| 5 to 9 Minutes | 105 (8.6%) | 78 (7.8%) |
| 10 to 14 Minutes | 110 (9.0%) | 146 (14.5%) |
| 15 to 19 Minutes | 189 (15.4%) | 144 (14.3%) |
| 20 to 24 Minutes | 90 (7.3%) | 111 (11.0%) |
| 25 to 29 Minutes | 10 (0.8%) | 22 (2.2%) |
| 30 to 34 Minutes | 116 (9.5%) | 121 (12.0%) |
| 35 to 39 Minutes | 52 (4.2%) | 37 (3.7%) |
| 40 to 44 Minutes | 120 (9.8%) | 4 (0.4%) |
| 45 to 59 Minutes | 147 (12.0%) | 97 (9.7%) |
| 60 to 89 Minutes | 112 (9.1%) | 107 (10.6%) |
| 90 or more Minutes | 81 (6.6%) | 47 (4.7%) |
Time of Departure to Work by Sex in Pendleton County
The most frequent times of departure to work in Pendleton County are 7:00 AM to 7:29 AM (200, 16.3%) for males and 7:00 AM to 7:29 AM (301, 29.9%) for females.
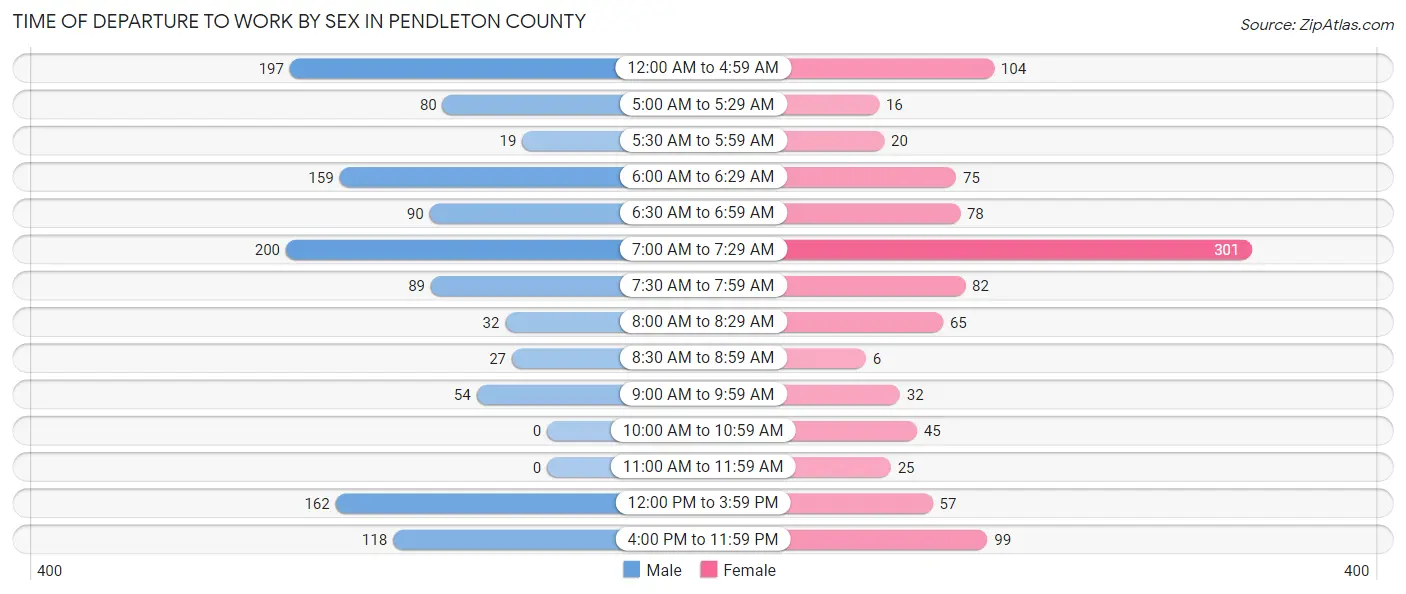
| Time of Departure | Male | Female |
| 12:00 AM to 4:59 AM | 197 (16.1%) | 104 (10.3%) |
| 5:00 AM to 5:29 AM | 80 (6.5%) | 16 (1.6%) |
| 5:30 AM to 5:59 AM | 19 (1.5%) | 20 (2.0%) |
| 6:00 AM to 6:29 AM | 159 (13.0%) | 75 (7.5%) |
| 6:30 AM to 6:59 AM | 90 (7.3%) | 78 (7.8%) |
| 7:00 AM to 7:29 AM | 200 (16.3%) | 301 (29.9%) |
| 7:30 AM to 7:59 AM | 89 (7.2%) | 82 (8.2%) |
| 8:00 AM to 8:29 AM | 32 (2.6%) | 65 (6.5%) |
| 8:30 AM to 8:59 AM | 27 (2.2%) | 6 (0.6%) |
| 9:00 AM to 9:59 AM | 54 (4.4%) | 32 (3.2%) |
| 10:00 AM to 10:59 AM | 0 (0.0%) | 45 (4.5%) |
| 11:00 AM to 11:59 AM | 0 (0.0%) | 25 (2.5%) |
| 12:00 PM to 3:59 PM | 162 (13.2%) | 57 (5.7%) |
| 4:00 PM to 11:59 PM | 118 (9.6%) | 99 (9.9%) |
| Total | 1,227 (100.0%) | 1,005 (100.0%) |
Housing Occupancy in Pendleton County
Occupancy by Ownership in Pendleton County
Of the total 2,361 dwellings in Pendleton County, owner-occupied units account for 1,955 (82.8%), while renter-occupied units make up 406 (17.2%).
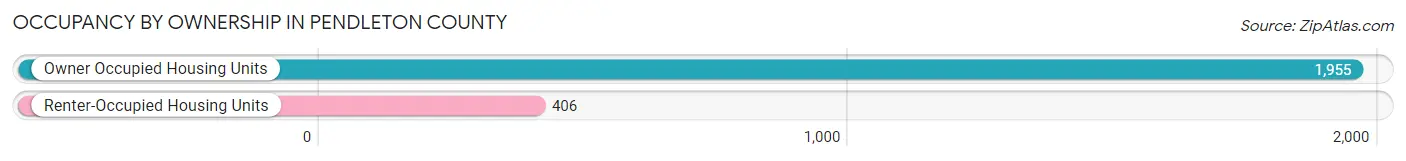
| Occupancy | # Housing Units | % Housing Units |
| Owner Occupied Housing Units | 1,955 | 82.8% |
| Renter-Occupied Housing Units | 406 | 17.2% |
| Total Occupied Housing Units | 2,361 | 100.0% |
Occupancy by Household Size in Pendleton County
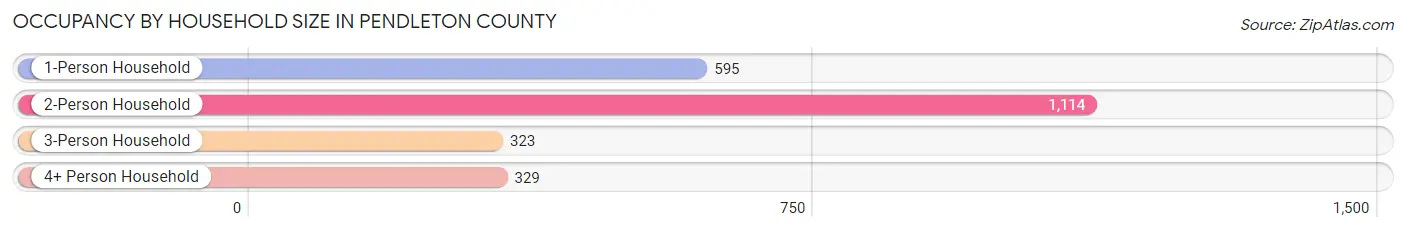
| Household Size | # Housing Units | % Housing Units |
| 1-Person Household | 595 | 25.2% |
| 2-Person Household | 1,114 | 47.2% |
| 3-Person Household | 323 | 13.7% |
| 4+ Person Household | 329 | 13.9% |
| Total Housing Units | 2,361 | 100.0% |
Occupancy by Ownership by Household Size in Pendleton County
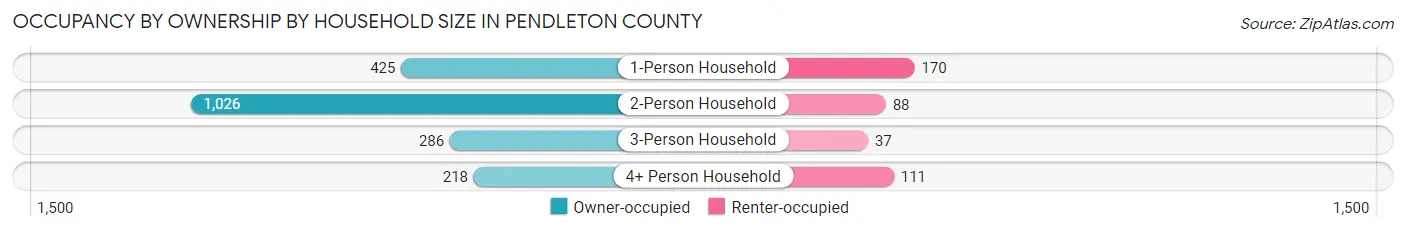
| Household Size | Owner-occupied | Renter-occupied |
| 1-Person Household | 425 (71.4%) | 170 (28.6%) |
| 2-Person Household | 1,026 (92.1%) | 88 (7.9%) |
| 3-Person Household | 286 (88.5%) | 37 (11.5%) |
| 4+ Person Household | 218 (66.3%) | 111 (33.7%) |
| Total Housing Units | 1,955 (82.8%) | 406 (17.2%) |
Occupancy by Educational Attainment in Pendleton County
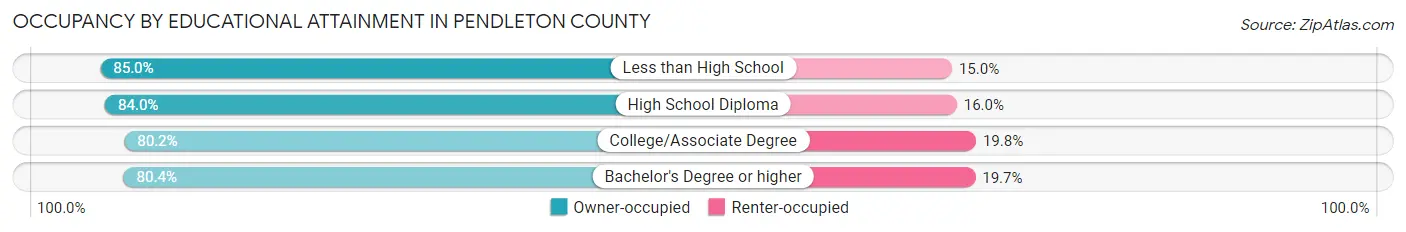
| Household Size | Owner-occupied | Renter-occupied |
| Less than High School | 373 (85.0%) | 66 (15.0%) |
| High School Diploma | 878 (84.0%) | 167 (16.0%) |
| College/Associate Degree | 381 (80.2%) | 94 (19.8%) |
| Bachelor's Degree or higher | 323 (80.3%) | 79 (19.7%) |
Occupancy by Age of Householder in Pendleton County
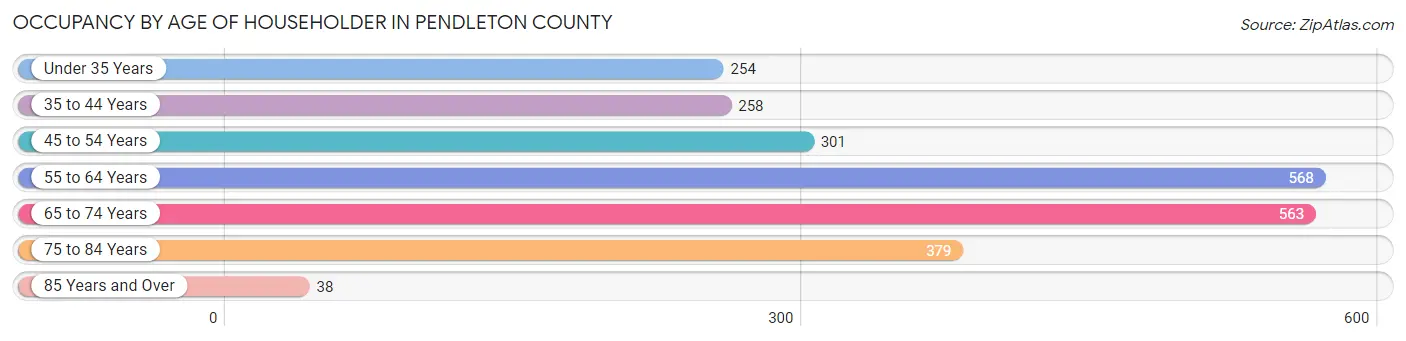
| Age Bracket | # Households | % Households |
| Under 35 Years | 254 | 10.8% |
| 35 to 44 Years | 258 | 10.9% |
| 45 to 54 Years | 301 | 12.8% |
| 55 to 64 Years | 568 | 24.1% |
| 65 to 74 Years | 563 | 23.8% |
| 75 to 84 Years | 379 | 16.1% |
| 85 Years and Over | 38 | 1.6% |
| Total | 2,361 | 100.0% |
Housing Finances in Pendleton County
Median Income by Occupancy in Pendleton County
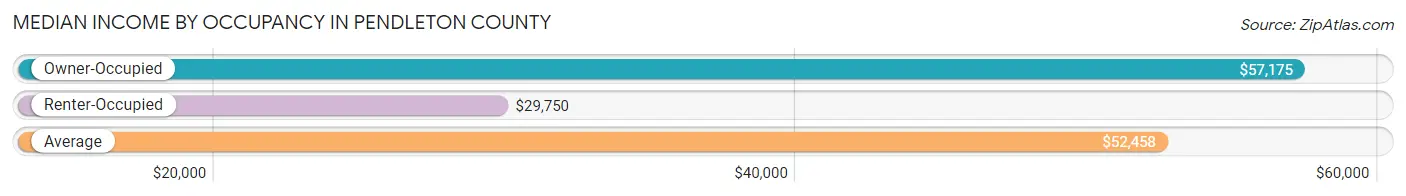
| Occupancy Type | # Households | Median Income |
| Owner-Occupied | 1,955 (82.8%) | $57,175 |
| Renter-Occupied | 406 (17.2%) | $29,750 |
| Average | 2,361 (100.0%) | $52,458 |
Occupancy by Householder Income Bracket in Pendleton County
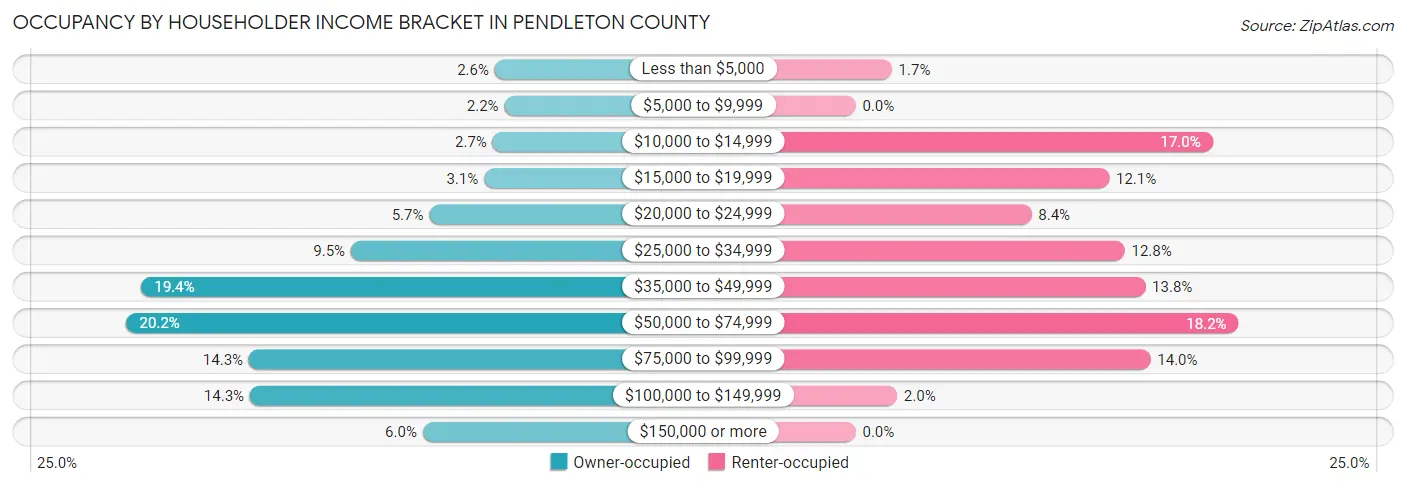
| Income Bracket | Owner-occupied | Renter-occupied |
| Less than $5,000 | 51 (2.6%) | 7 (1.7%) |
| $5,000 to $9,999 | 42 (2.1%) | 0 (0.0%) |
| $10,000 to $14,999 | 53 (2.7%) | 69 (17.0%) |
| $15,000 to $19,999 | 61 (3.1%) | 49 (12.1%) |
| $20,000 to $24,999 | 112 (5.7%) | 34 (8.4%) |
| $25,000 to $34,999 | 185 (9.5%) | 52 (12.8%) |
| $35,000 to $49,999 | 380 (19.4%) | 56 (13.8%) |
| $50,000 to $74,999 | 394 (20.2%) | 74 (18.2%) |
| $75,000 to $99,999 | 280 (14.3%) | 57 (14.0%) |
| $100,000 to $149,999 | 279 (14.3%) | 8 (2.0%) |
| $150,000 or more | 118 (6.0%) | 0 (0.0%) |
| Total | 1,955 (100.0%) | 406 (100.0%) |
Monthly Housing Cost Tiers in Pendleton County
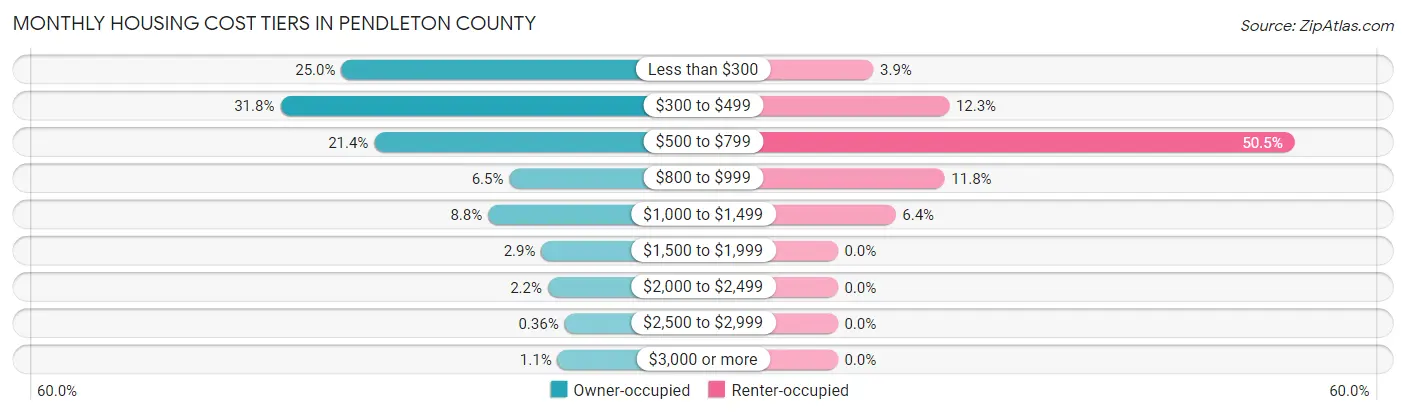
| Monthly Cost | Owner-occupied | Renter-occupied |
| Less than $300 | 489 (25.0%) | 16 (3.9%) |
| $300 to $499 | 621 (31.8%) | 50 (12.3%) |
| $500 to $799 | 418 (21.4%) | 205 (50.5%) |
| $800 to $999 | 126 (6.5%) | 48 (11.8%) |
| $1,000 to $1,499 | 172 (8.8%) | 26 (6.4%) |
| $1,500 to $1,999 | 57 (2.9%) | 0 (0.0%) |
| $2,000 to $2,499 | 43 (2.2%) | 0 (0.0%) |
| $2,500 to $2,999 | 7 (0.4%) | 0 (0.0%) |
| $3,000 or more | 22 (1.1%) | 0 (0.0%) |
| Total | 1,955 (100.0%) | 406 (100.0%) |
Physical Housing Characteristics in Pendleton County
Housing Structures in Pendleton County
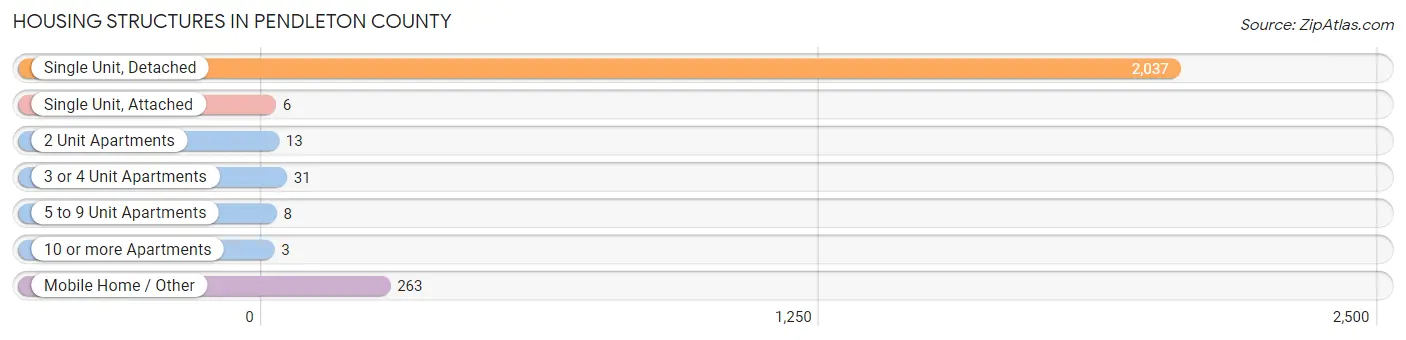
| Structure Type | # Housing Units | % Housing Units |
| Single Unit, Detached | 2,037 | 86.3% |
| Single Unit, Attached | 6 | 0.3% |
| 2 Unit Apartments | 13 | 0.5% |
| 3 or 4 Unit Apartments | 31 | 1.3% |
| 5 to 9 Unit Apartments | 8 | 0.3% |
| 10 or more Apartments | 3 | 0.1% |
| Mobile Home / Other | 263 | 11.1% |
| Total | 2,361 | 100.0% |
Housing Structures by Occupancy in Pendleton County
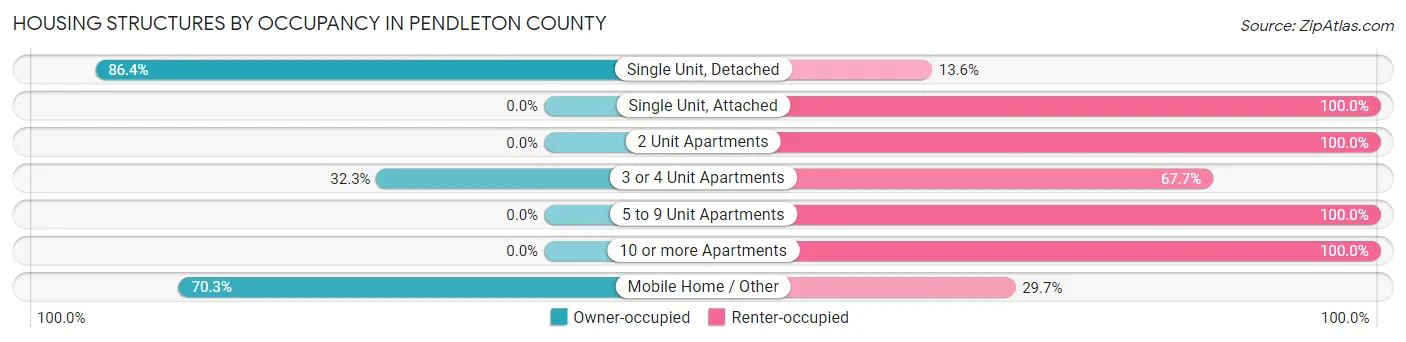
| Structure Type | Owner-occupied | Renter-occupied |
| Single Unit, Detached | 1,760 (86.4%) | 277 (13.6%) |
| Single Unit, Attached | 0 (0.0%) | 6 (100.0%) |
| 2 Unit Apartments | 0 (0.0%) | 13 (100.0%) |
| 3 or 4 Unit Apartments | 10 (32.3%) | 21 (67.7%) |
| 5 to 9 Unit Apartments | 0 (0.0%) | 8 (100.0%) |
| 10 or more Apartments | 0 (0.0%) | 3 (100.0%) |
| Mobile Home / Other | 185 (70.3%) | 78 (29.7%) |
| Total | 1,955 (82.8%) | 406 (17.2%) |
Housing Structures by Number of Rooms in Pendleton County
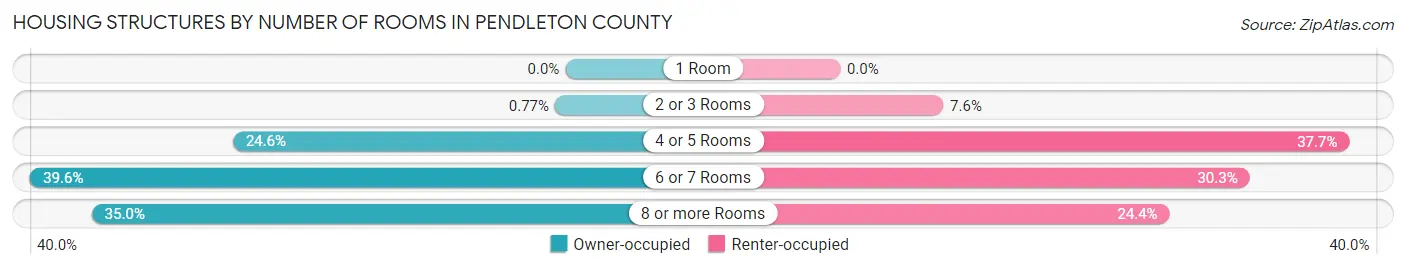
| Number of Rooms | Owner-occupied | Renter-occupied |
| 1 Room | 0 (0.0%) | 0 (0.0%) |
| 2 or 3 Rooms | 15 (0.8%) | 31 (7.6%) |
| 4 or 5 Rooms | 481 (24.6%) | 153 (37.7%) |
| 6 or 7 Rooms | 774 (39.6%) | 123 (30.3%) |
| 8 or more Rooms | 685 (35.0%) | 99 (24.4%) |
| Total | 1,955 (100.0%) | 406 (100.0%) |
Housing Structure by Heating Type in Pendleton County
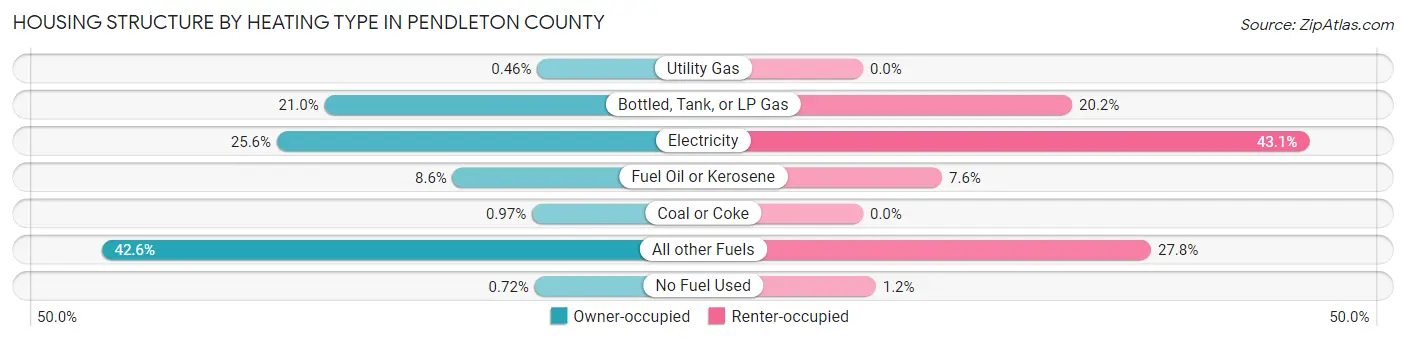
| Heating Type | Owner-occupied | Renter-occupied |
| Utility Gas | 9 (0.5%) | 0 (0.0%) |
| Bottled, Tank, or LP Gas | 411 (21.0%) | 82 (20.2%) |
| Electricity | 501 (25.6%) | 175 (43.1%) |
| Fuel Oil or Kerosene | 169 (8.6%) | 31 (7.6%) |
| Coal or Coke | 19 (1.0%) | 0 (0.0%) |
| All other Fuels | 832 (42.6%) | 113 (27.8%) |
| No Fuel Used | 14 (0.7%) | 5 (1.2%) |
| Total | 1,955 (100.0%) | 406 (100.0%) |
Household Vehicle Usage in Pendleton County
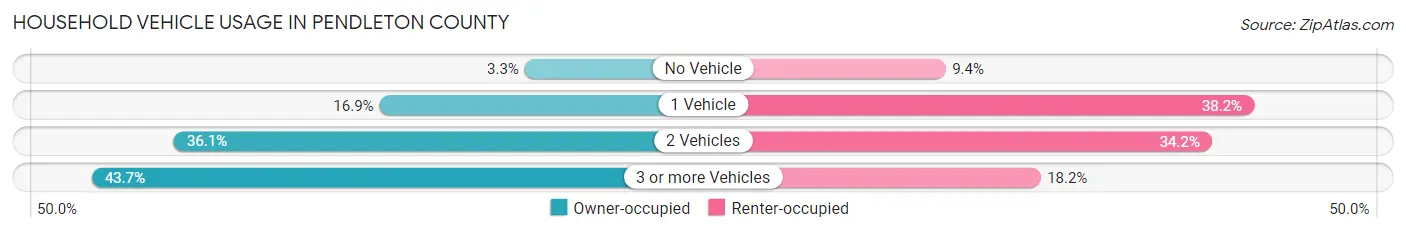
| Vehicles per Household | Owner-occupied | Renter-occupied |
| No Vehicle | 65 (3.3%) | 38 (9.4%) |
| 1 Vehicle | 330 (16.9%) | 155 (38.2%) |
| 2 Vehicles | 705 (36.1%) | 139 (34.2%) |
| 3 or more Vehicles | 855 (43.7%) | 74 (18.2%) |
| Total | 1,955 (100.0%) | 406 (100.0%) |
Real Estate & Mortgages in Pendleton County
Real Estate and Mortgage Overview in Pendleton County
| Characteristic | Without Mortgage | With Mortgage |
| Housing Units | 1,306 | 649 |
| Median Property Value | $161,000 | $184,700 |
| Median Household Income | $56,688 | $55 |
| Monthly Housing Costs | $331 | $22 |
| Real Estate Taxes | $573 | $14 |
Property Value by Mortgage Status in Pendleton County
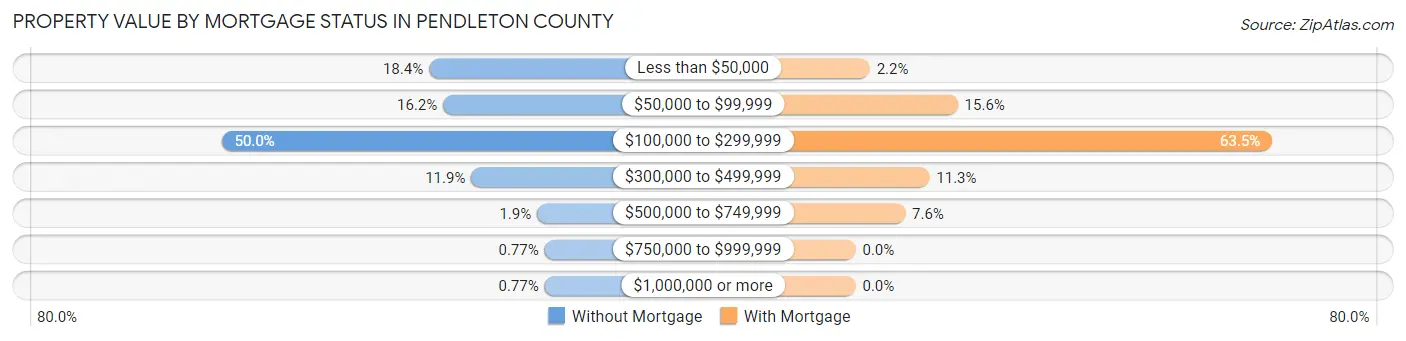
| Property Value | Without Mortgage | With Mortgage |
| Less than $50,000 | 240 (18.4%) | 14 (2.2%) |
| $50,000 to $99,999 | 212 (16.2%) | 101 (15.6%) |
| $100,000 to $299,999 | 653 (50.0%) | 412 (63.5%) |
| $300,000 to $499,999 | 156 (11.9%) | 73 (11.3%) |
| $500,000 to $749,999 | 25 (1.9%) | 49 (7.5%) |
| $750,000 to $999,999 | 10 (0.8%) | 0 (0.0%) |
| $1,000,000 or more | 10 (0.8%) | 0 (0.0%) |
| Total | 1,306 (100.0%) | 649 (100.0%) |
Household Income by Mortgage Status in Pendleton County
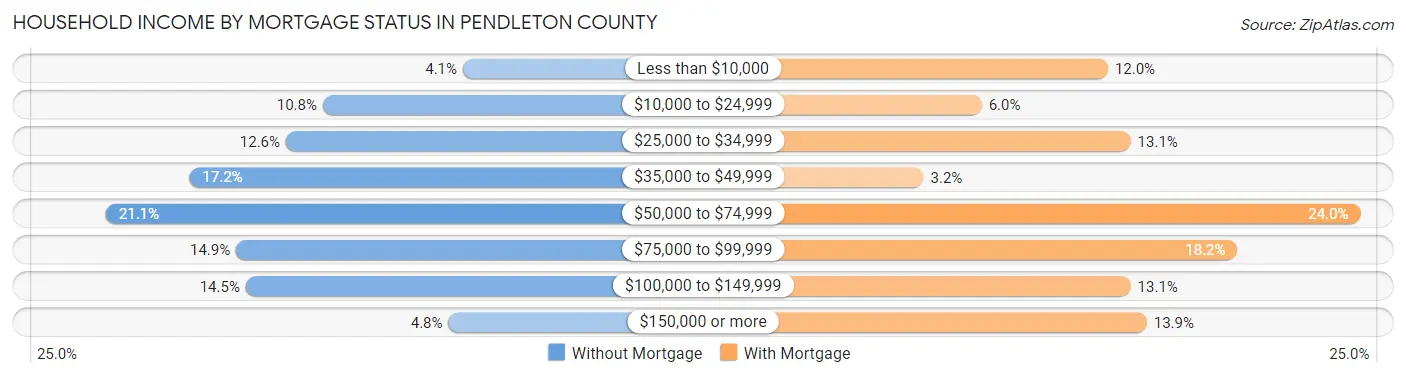
| Household Income | Without Mortgage | With Mortgage |
| Less than $10,000 | 54 (4.1%) | 78 (12.0%) |
| $10,000 to $24,999 | 141 (10.8%) | 39 (6.0%) |
| $25,000 to $34,999 | 164 (12.6%) | 85 (13.1%) |
| $35,000 to $49,999 | 224 (17.2%) | 21 (3.2%) |
| $50,000 to $74,999 | 276 (21.1%) | 156 (24.0%) |
| $75,000 to $99,999 | 195 (14.9%) | 118 (18.2%) |
| $100,000 to $149,999 | 189 (14.5%) | 85 (13.1%) |
| $150,000 or more | 63 (4.8%) | 90 (13.9%) |
| Total | 1,306 (100.0%) | 649 (100.0%) |
Property Value to Household Income Ratio in Pendleton County
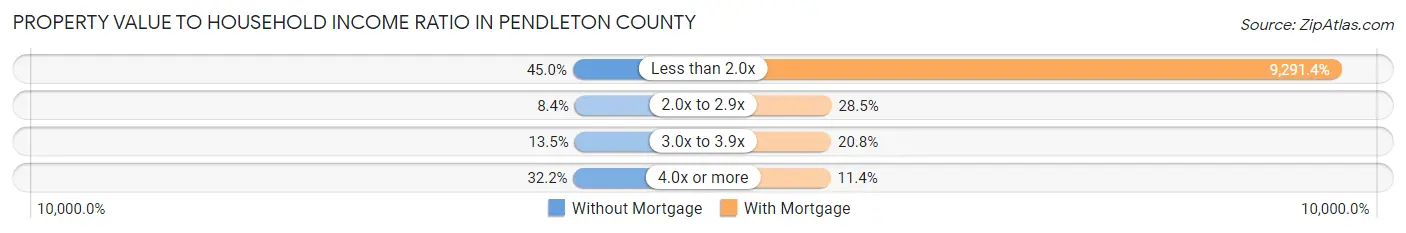
| Value-to-Income Ratio | Without Mortgage | With Mortgage |
| Less than 2.0x | 587 (45.0%) | 60,301 (9,291.4%) |
| 2.0x to 2.9x | 110 (8.4%) | 185 (28.5%) |
| 3.0x to 3.9x | 176 (13.5%) | 135 (20.8%) |
| 4.0x or more | 420 (32.2%) | 74 (11.4%) |
| Total | 1,306 (100.0%) | 649 (100.0%) |
Real Estate Taxes by Mortgage Status in Pendleton County
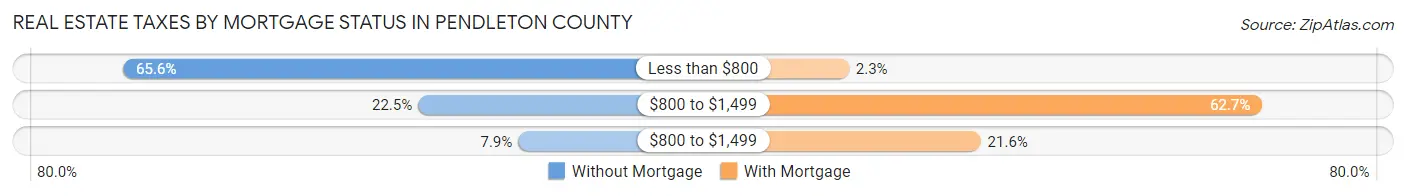
| Property Taxes | Without Mortgage | With Mortgage |
| Less than $800 | 857 (65.6%) | 15 (2.3%) |
| $800 to $1,499 | 294 (22.5%) | 407 (62.7%) |
| $800 to $1,499 | 103 (7.9%) | 140 (21.6%) |
| Total | 1,306 (100.0%) | 649 (100.0%) |
Health & Disability in Pendleton County
Health Insurance Coverage by Age in Pendleton County
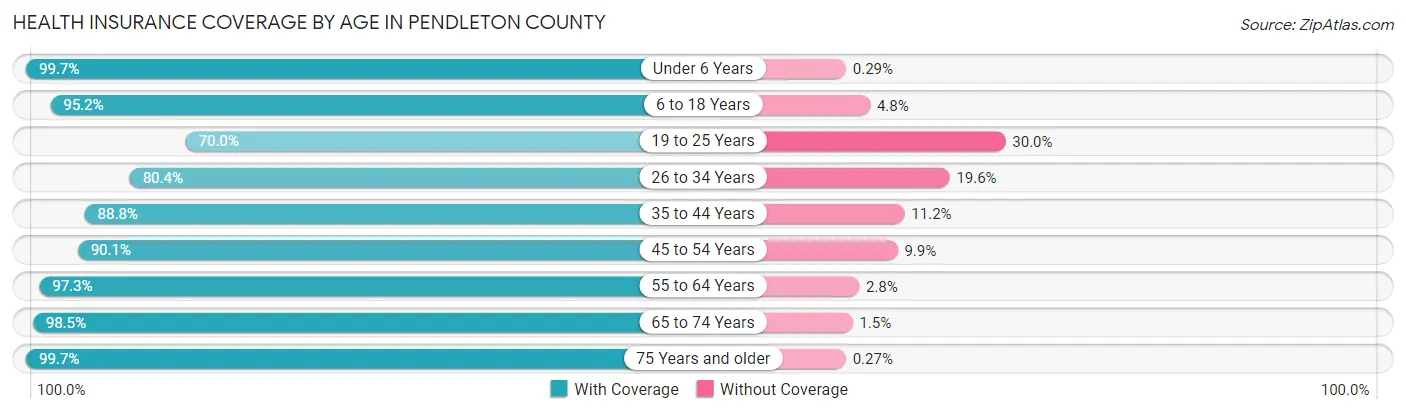
| Age Bracket | With Coverage | Without Coverage |
| Under 6 Years | 348 (99.7%) | 1 (0.3%) |
| 6 to 18 Years | 775 (95.2%) | 39 (4.8%) |
| 19 to 25 Years | 268 (70.0%) | 115 (30.0%) |
| 26 to 34 Years | 369 (80.4%) | 90 (19.6%) |
| 35 to 44 Years | 578 (88.8%) | 73 (11.2%) |
| 45 to 54 Years | 627 (90.1%) | 69 (9.9%) |
| 55 to 64 Years | 1,027 (97.3%) | 29 (2.8%) |
| 65 to 74 Years | 897 (98.5%) | 14 (1.5%) |
| 75 Years and older | 742 (99.7%) | 2 (0.3%) |
| Total | 5,631 (92.9%) | 432 (7.1%) |
Health Insurance Coverage by Citizenship Status in Pendleton County
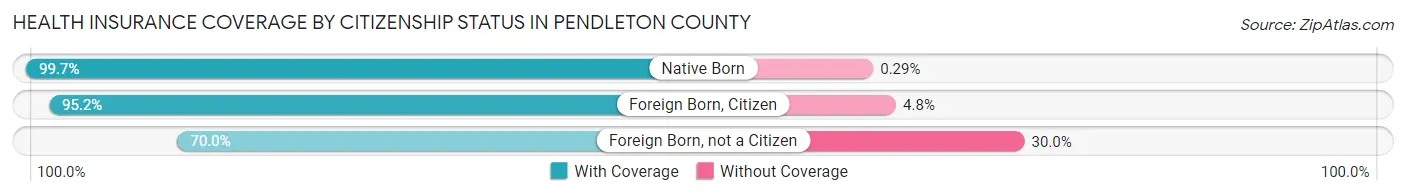
| Citizenship Status | With Coverage | Without Coverage |
| Native Born | 348 (99.7%) | 1 (0.3%) |
| Foreign Born, Citizen | 775 (95.2%) | 39 (4.8%) |
| Foreign Born, not a Citizen | 268 (70.0%) | 115 (30.0%) |
Health Insurance Coverage by Household Income in Pendleton County
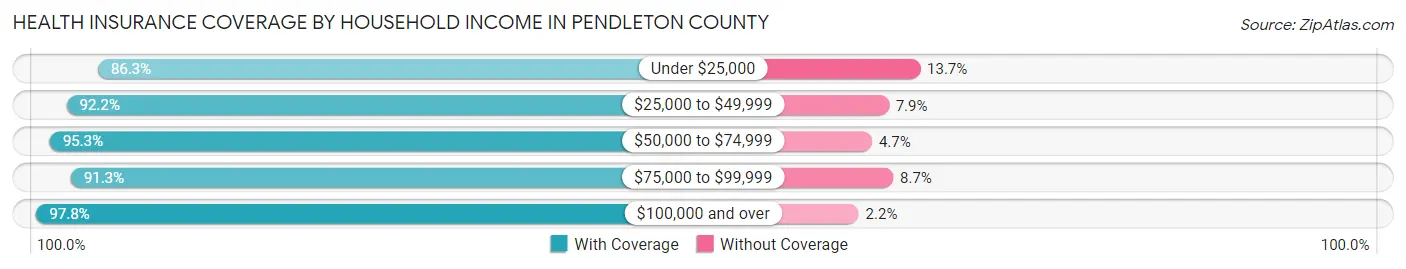
| Household Income | With Coverage | Without Coverage |
| Under $25,000 | 886 (86.3%) | 141 (13.7%) |
| $25,000 to $49,999 | 1,326 (92.1%) | 113 (7.9%) |
| $50,000 to $74,999 | 1,231 (95.3%) | 61 (4.7%) |
| $75,000 to $99,999 | 938 (91.3%) | 89 (8.7%) |
| $100,000 and over | 1,233 (97.8%) | 28 (2.2%) |
Public vs Private Health Insurance Coverage by Age in Pendleton County
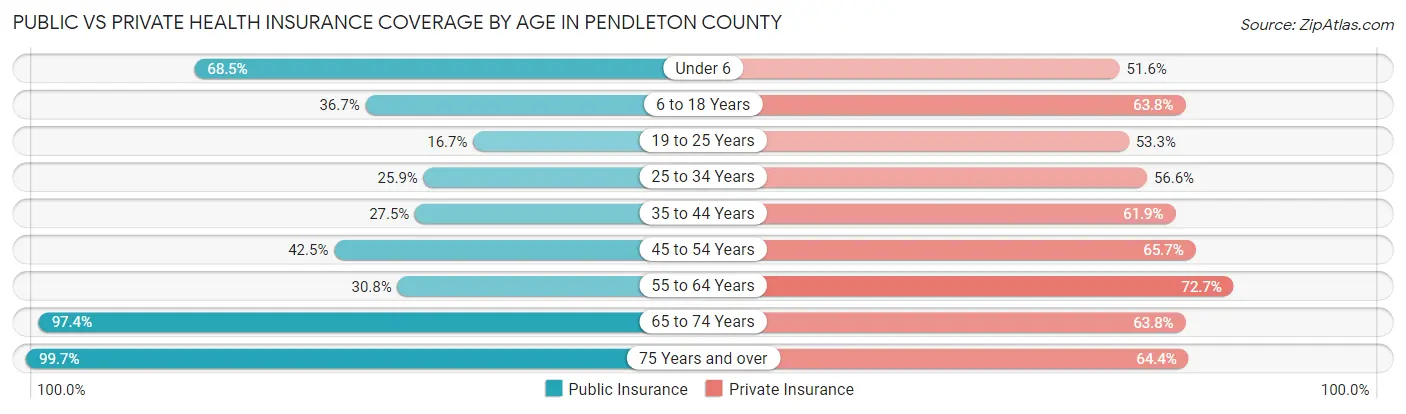
| Age Bracket | Public Insurance | Private Insurance |
| Under 6 | 239 (68.5%) | 180 (51.6%) |
| 6 to 18 Years | 299 (36.7%) | 519 (63.8%) |
| 19 to 25 Years | 64 (16.7%) | 204 (53.3%) |
| 25 to 34 Years | 119 (25.9%) | 260 (56.6%) |
| 35 to 44 Years | 179 (27.5%) | 403 (61.9%) |
| 45 to 54 Years | 296 (42.5%) | 457 (65.7%) |
| 55 to 64 Years | 325 (30.8%) | 768 (72.7%) |
| 65 to 74 Years | 887 (97.4%) | 581 (63.8%) |
| 75 Years and over | 742 (99.7%) | 479 (64.4%) |
| Total | 3,150 (51.9%) | 3,851 (63.5%) |
Disability Status by Sex by Age in Pendleton County
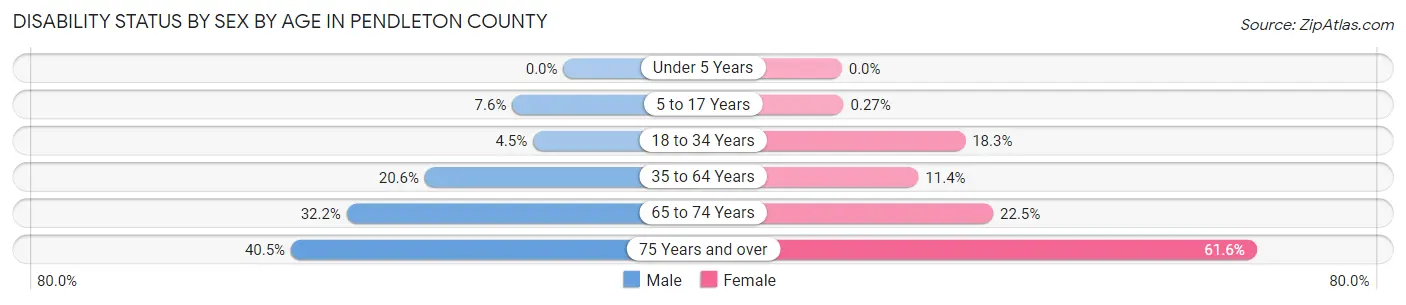
| Age Bracket | Male | Female |
| Under 5 Years | 0 (0.0%) | 0 (0.0%) |
| 5 to 17 Years | 34 (7.6%) | 1 (0.3%) |
| 18 to 34 Years | 21 (4.5%) | 79 (18.3%) |
| 35 to 64 Years | 261 (20.6%) | 129 (11.4%) |
| 65 to 74 Years | 147 (32.2%) | 102 (22.5%) |
| 75 Years and over | 144 (40.5%) | 239 (61.6%) |
Disability Class by Sex by Age in Pendleton County
Disability Class: Hearing Difficulty
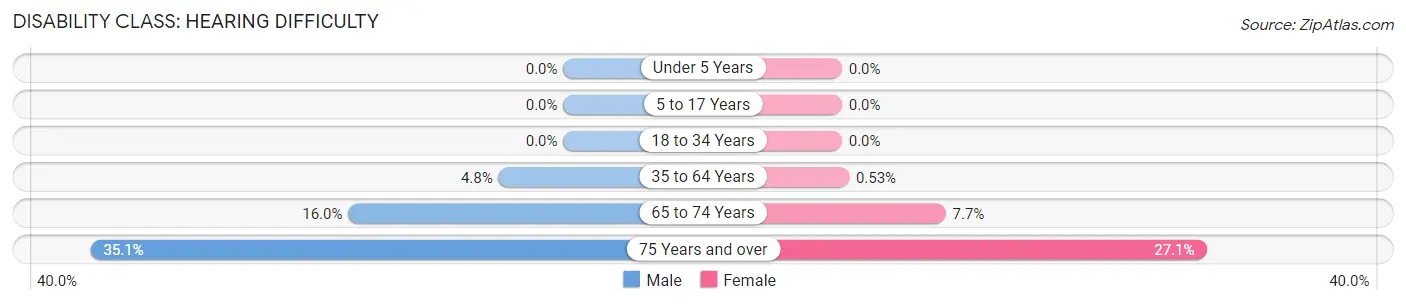
| Age Bracket | Male | Female |
| Under 5 Years | 0 (0.0%) | 0 (0.0%) |
| 5 to 17 Years | 0 (0.0%) | 0 (0.0%) |
| 18 to 34 Years | 0 (0.0%) | 0 (0.0%) |
| 35 to 64 Years | 61 (4.8%) | 6 (0.5%) |
| 65 to 74 Years | 73 (16.0%) | 35 (7.7%) |
| 75 Years and over | 125 (35.1%) | 105 (27.1%) |
Disability Class: Vision Difficulty
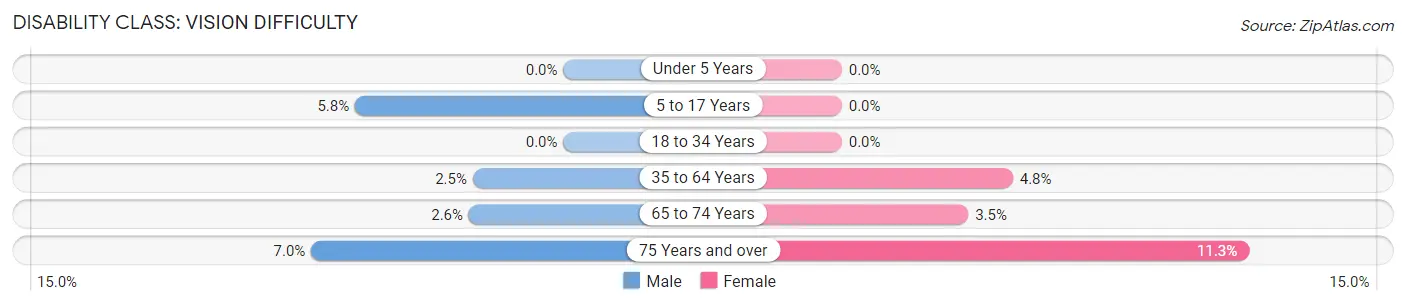
| Age Bracket | Male | Female |
| Under 5 Years | 0 (0.0%) | 0 (0.0%) |
| 5 to 17 Years | 26 (5.8%) | 0 (0.0%) |
| 18 to 34 Years | 0 (0.0%) | 0 (0.0%) |
| 35 to 64 Years | 32 (2.5%) | 54 (4.8%) |
| 65 to 74 Years | 12 (2.6%) | 16 (3.5%) |
| 75 Years and over | 25 (7.0%) | 44 (11.3%) |
Disability Class: Cognitive Difficulty
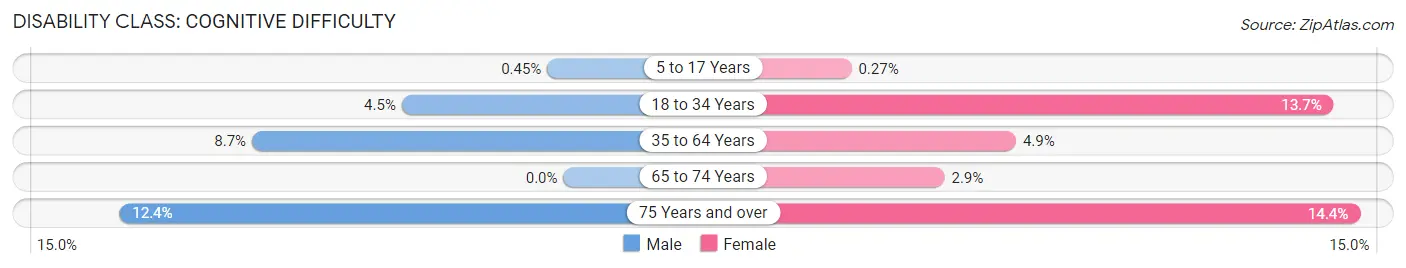
| Age Bracket | Male | Female |
| 5 to 17 Years | 2 (0.4%) | 1 (0.3%) |
| 18 to 34 Years | 21 (4.5%) | 59 (13.7%) |
| 35 to 64 Years | 110 (8.7%) | 55 (4.9%) |
| 65 to 74 Years | 0 (0.0%) | 13 (2.9%) |
| 75 Years and over | 44 (12.4%) | 56 (14.4%) |
Disability Class: Ambulatory Difficulty
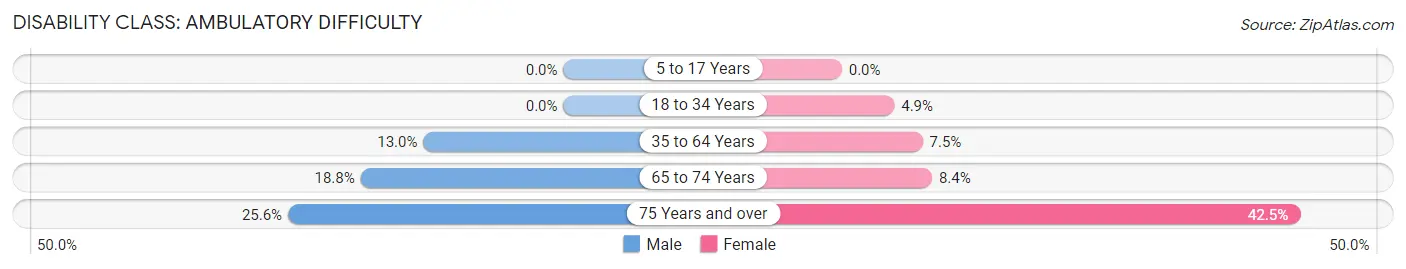
| Age Bracket | Male | Female |
| 5 to 17 Years | 0 (0.0%) | 0 (0.0%) |
| 18 to 34 Years | 0 (0.0%) | 21 (4.9%) |
| 35 to 64 Years | 165 (13.0%) | 85 (7.5%) |
| 65 to 74 Years | 86 (18.8%) | 38 (8.4%) |
| 75 Years and over | 91 (25.6%) | 165 (42.5%) |
Disability Class: Self-Care Difficulty
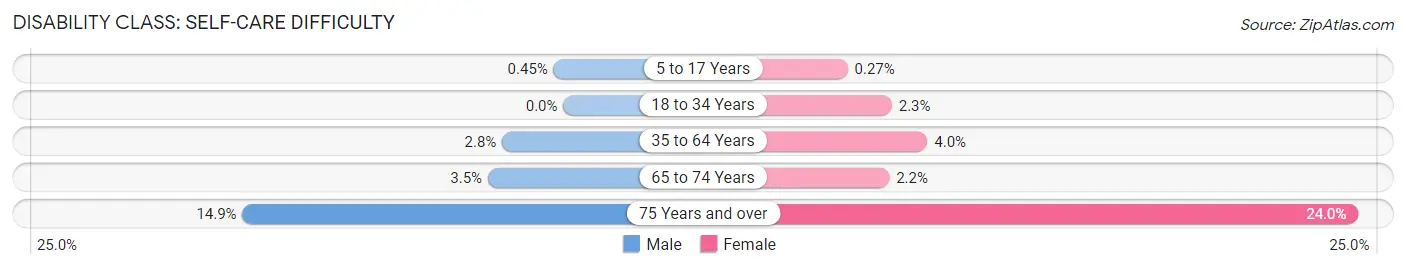
| Age Bracket | Male | Female |
| 5 to 17 Years | 2 (0.4%) | 1 (0.3%) |
| 18 to 34 Years | 0 (0.0%) | 10 (2.3%) |
| 35 to 64 Years | 36 (2.8%) | 45 (4.0%) |
| 65 to 74 Years | 16 (3.5%) | 10 (2.2%) |
| 75 Years and over | 53 (14.9%) | 93 (24.0%) |
Technology Access in Pendleton County
Computing Device Access in Pendleton County
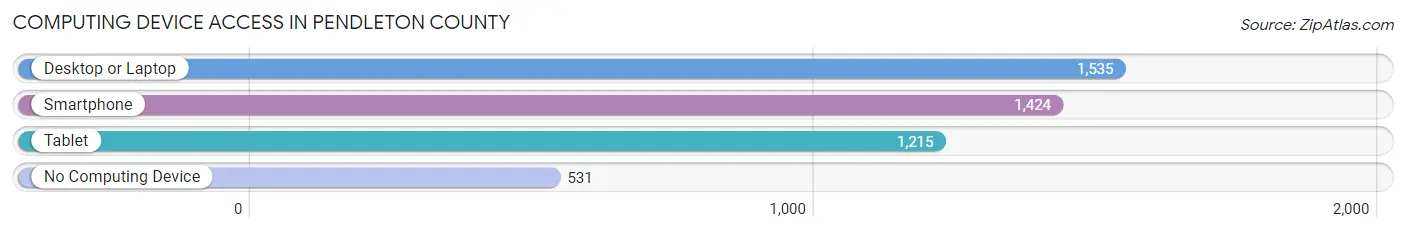
| Device Type | # Households | % Households |
| Desktop or Laptop | 1,535 | 65.0% |
| Smartphone | 1,424 | 60.3% |
| Tablet | 1,215 | 51.5% |
| No Computing Device | 531 | 22.5% |
| Total | 2,361 | 100.0% |
Internet Access in Pendleton County
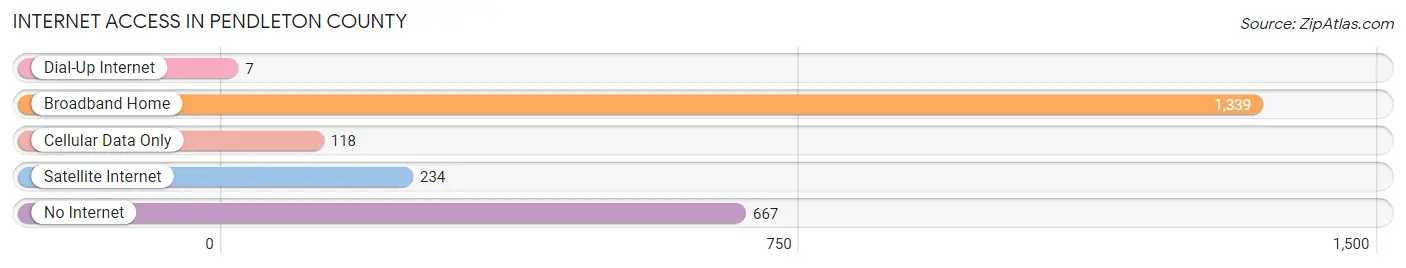
| Internet Type | # Households | % Households |
| Dial-Up Internet | 7 | 0.3% |
| Broadband Home | 1,339 | 56.7% |
| Cellular Data Only | 118 | 5.0% |
| Satellite Internet | 234 | 9.9% |
| No Internet | 667 | 28.2% |
| Total | 2,361 | 100.0% |
Pendleton County Summary
Pendleton County, West Virginia is located in the eastern part of the state, in the Appalachian Mountains. It is bordered by Grant County to the north, Hardy County to the east, Augusta County, Virginia to the south, and Highland County, Virginia to the west. The county seat is Franklin, and the county was formed in 1788 from parts of Augusta and Hardy counties. The county has a total area of 437 square miles, of which 435 square miles is land and 2 square miles is water.
History
The area that is now Pendleton County was originally inhabited by Native Americans, including the Monacan, Shawnee, and Cherokee tribes. The first European settlers arrived in the area in the late 1700s, and the county was officially formed in 1788. The county was named for Edmund Pendleton, a prominent Virginia lawyer and statesman.
During the Civil War, Pendleton County was divided in its loyalties, with some residents supporting the Union and others supporting the Confederacy. The county was the site of several skirmishes, including the Battle of Franklin in 1863.
Geography
Pendleton County is located in the Appalachian Mountains of West Virginia. The county is mostly mountainous, with elevations ranging from 1,000 to 4,000 feet. The highest point in the county is Spruce Knob, which has an elevation of 4,863 feet. The county is home to several rivers, including the South Branch of the Potomac River, the North Fork of the South Branch, and the North Fork of the Shenandoah River.
The county is home to several state parks, including Seneca Rocks State Park, Spruce Knob Lake State Park, and Smoke Hole Caverns State Park. The county also contains part of the George Washington National Forest.
Economy
The economy of Pendleton County is largely based on agriculture and tourism. The county is home to several farms, which produce a variety of crops, including corn, hay, and apples. The county is also home to several wineries, which produce a variety of wines.
Tourism is an important part of the county’s economy. The county is home to several state parks, which attract visitors from all over the country. The county is also home to several historic sites, including the Civil War battlefields at Franklin and Moorefield.
Demographics
As of the 2010 census, the population of Pendleton County was 7,695. The population is largely white (96.2%), with small percentages of African Americans (1.7%), Native Americans (0.3%), and Asians (0.2%). The median household income in the county is $37,945, and the median age is 44.7 years.
Conclusion
Pendleton County, West Virginia is a rural county located in the Appalachian Mountains. The county has a long history, and was divided in its loyalties during the Civil War. The county is largely mountainous, and is home to several state parks and historic sites. The economy of the county is largely based on agriculture and tourism, and the population is largely white.
Common Questions
What is Per Capita Income in Pendleton County?
Per Capita income in Pendleton County is $27,513.
What is the Median Family Income in Pendleton County?
Median Family Income in Pendleton County is $63,016.
What is the Median Household income in Pendleton County?
Median Household Income in Pendleton County is $52,458.
What is Income or Wage Gap in Pendleton County?
Income or Wage Gap in Pendleton County is 24.8%.
Women in Pendleton County earn 75.2 cents for every dollar earned by a man.
What is Inequality or Gini Index in Pendleton County?
Inequality or Gini Index in Pendleton County is 0.40.
What is the Total Population of Pendleton County?
Total Population of Pendleton County is 6,156.
What is the Total Male Population of Pendleton County?
Total Male Population of Pendleton County is 3,178.
What is the Total Female Population of Pendleton County?
Total Female Population of Pendleton County is 2,978.
What is the Ratio of Males per 100 Females in Pendleton County?
There are 106.72 Males per 100 Females in Pendleton County.
What is the Ratio of Females per 100 Males in Pendleton County?
There are 93.71 Females per 100 Males in Pendleton County.
What is the Median Population Age in Pendleton County?
Median Population Age in Pendleton County is 50.9 Years.
What is the Average Family Size in Pendleton County
Average Family Size in Pendleton County is 3.0 People.
What is the Average Household Size in Pendleton County
Average Household Size in Pendleton County is 2.6 People.
How Large is the Labor Force in Pendleton County?
There are 2,665 People in the Labor Forcein in Pendleton County.
What is the Percentage of People in the Labor Force in Pendleton County?
51.5% of People are in the Labor Force in Pendleton County.
What is the Unemployment Rate in Pendleton County?
Unemployment Rate in Pendleton County is 7.3%.