Monroe County, WV Map & Demographics
Monroe County Map
Monroe County Overview
$26,120
PER CAPITA INCOME
$65,034
AVG FAMILY INCOME
$52,392
AVG HOUSEHOLD INCOME
30.5%
WAGE / INCOME GAP [ % ]
69.5¢/ $1
WAGE / INCOME GAP [ $ ]
$9,019
FAMILY INCOME DEFICIT
0.40
INEQUALITY / GINI INDEX
12,438
TOTAL POPULATION
6,210
MALE POPULATION
6,228
FEMALE POPULATION
99.71
MALES / 100 FEMALES
100.29
FEMALES / 100 MALES
45.9
MEDIAN AGE
3.4
AVG FAMILY SIZE
2.7
AVG HOUSEHOLD SIZE
5,183
LABOR FORCE [ PEOPLE ]
50.6%
PERCENT IN LABOR FORCE
10.6%
UNEMPLOYMENT RATE
Monroe County Area Codes
Income in Monroe County
Income Overview in Monroe County
Per Capita Income in Monroe County is $26,120, while median incomes of families and households are $65,034 and $52,392 respectively.
| Characteristic | Number | Measure |
| Per Capita Income | 12,438 | $26,120 |
| Median Family Income | 3,042 | $65,034 |
| Mean Family Income | 3,042 | $75,570 |
| Median Household Income | 4,596 | $52,392 |
| Mean Household Income | 4,596 | $63,766 |
| Income Deficit | 3,042 | $9,019 |
| Wage / Income Gap (%) | 12,438 | 30.49% |
| Wage / Income Gap ($) | 12,438 | 69.51¢ per $1 |
| Gini / Inequality Index | 12,438 | 0.40 |
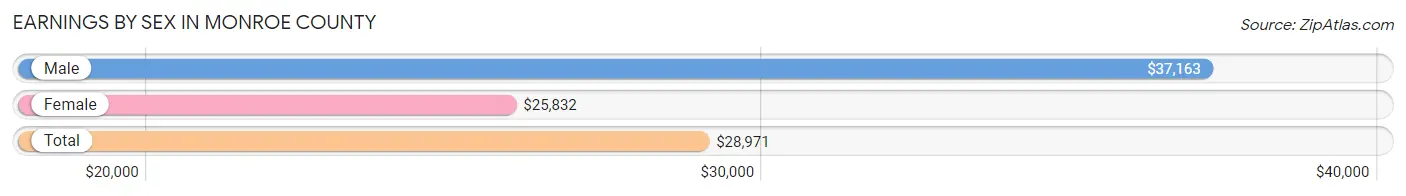
Earnings by Sex in Monroe County
Average Earnings in Monroe County are $28,971, $37,163 for men and $25,832 for women, a difference of 30.5%.
| Sex | Number | Average Earnings |
| Male | 2,792 (51.8%) | $37,163 |
| Female | 2,601 (48.2%) | $25,832 |
| Total | 5,393 (100.0%) | $28,971 |
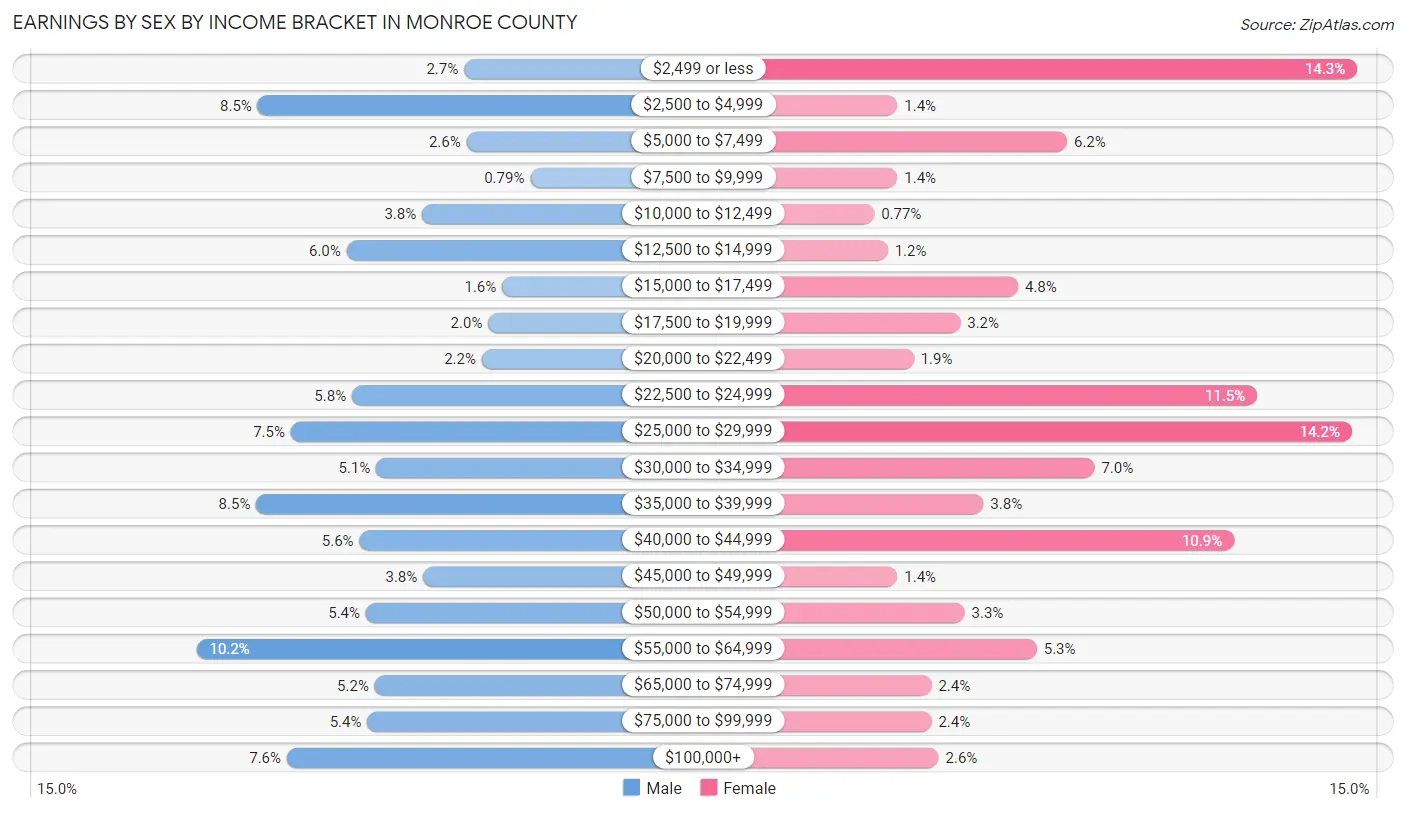
Earnings by Sex by Income Bracket in Monroe County
The most common earnings brackets in Monroe County are $55,000 to $64,999 for men (284 | 10.2%) and $2,499 or less for women (373 | 14.3%).
| Income | Male | Female |
| $2,499 or less | 74 (2.6%) | 373 (14.3%) |
| $2,500 to $4,999 | 236 (8.5%) | 37 (1.4%) |
| $5,000 to $7,499 | 72 (2.6%) | 161 (6.2%) |
| $7,500 to $9,999 | 22 (0.8%) | 37 (1.4%) |
| $10,000 to $12,499 | 107 (3.8%) | 20 (0.8%) |
| $12,500 to $14,999 | 166 (5.9%) | 30 (1.1%) |
| $15,000 to $17,499 | 44 (1.6%) | 125 (4.8%) |
| $17,500 to $19,999 | 55 (2.0%) | 83 (3.2%) |
| $20,000 to $22,499 | 60 (2.1%) | 49 (1.9%) |
| $22,500 to $24,999 | 162 (5.8%) | 300 (11.5%) |
| $25,000 to $29,999 | 210 (7.5%) | 369 (14.2%) |
| $30,000 to $34,999 | 143 (5.1%) | 181 (7.0%) |
| $35,000 to $39,999 | 237 (8.5%) | 100 (3.8%) |
| $40,000 to $44,999 | 156 (5.6%) | 283 (10.9%) |
| $45,000 to $49,999 | 106 (3.8%) | 37 (1.4%) |
| $50,000 to $54,999 | 151 (5.4%) | 86 (3.3%) |
| $55,000 to $64,999 | 284 (10.2%) | 139 (5.3%) |
| $65,000 to $74,999 | 144 (5.2%) | 62 (2.4%) |
| $75,000 to $99,999 | 150 (5.4%) | 62 (2.4%) |
| $100,000+ | 213 (7.6%) | 67 (2.6%) |
| Total | 2,792 (100.0%) | 2,601 (100.0%) |
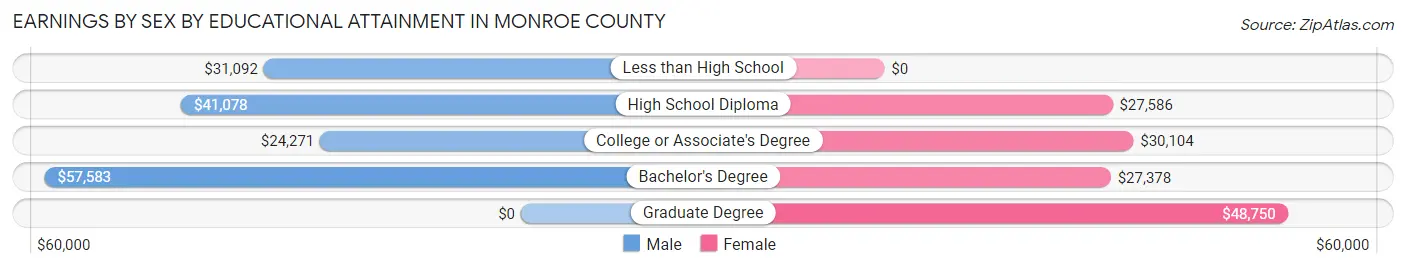
Earnings by Sex by Educational Attainment in Monroe County
Average earnings in Monroe County are $39,514 for men and $28,516 for women, a difference of 27.8%. Men with an educational attainment of bachelor's degree enjoy the highest average annual earnings of $57,583, while those with college or associate's degree education earn the least with $24,271. Women with an educational attainment of graduate degree earn the most with the average annual earnings of $48,750, while those with bachelor's degree education have the smallest earnings of $27,378.
| Educational Attainment | Male Income | Female Income |
| Less than High School | $31,092 | $0 |
| High School Diploma | $41,078 | $27,586 |
| College or Associate's Degree | $24,271 | $30,104 |
| Bachelor's Degree | $57,583 | $27,378 |
| Graduate Degree | - | - |
| Total | $39,514 | $28,516 |
Family Income in Monroe County
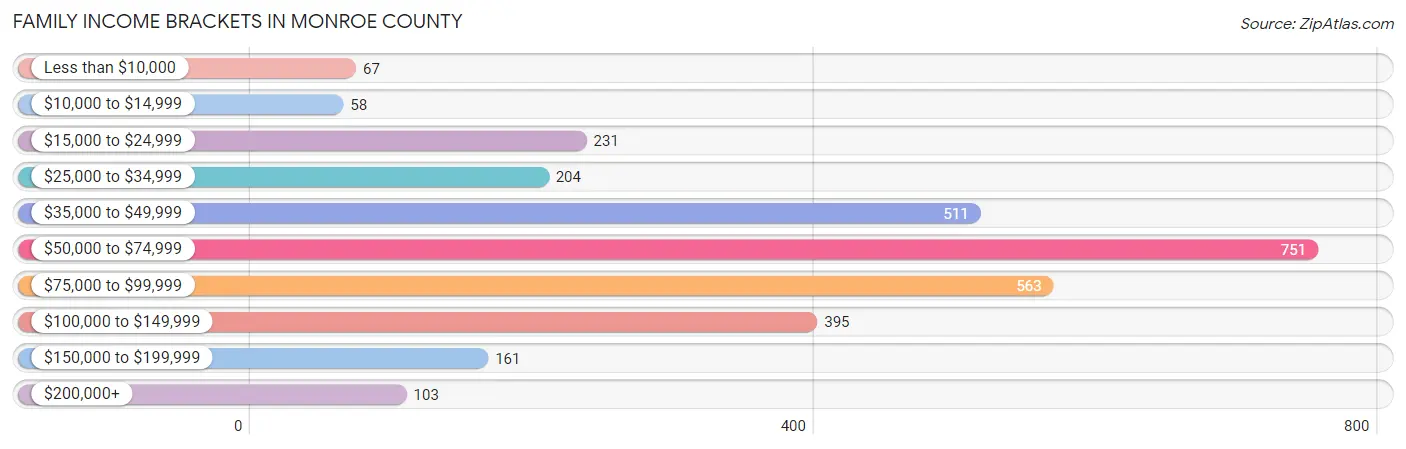
Family Income Brackets in Monroe County
According to the Monroe County family income data, there are 751 families falling into the $50,000 to $74,999 income range, which is the most common income bracket and makes up 24.7% of all families. Conversely, the $10,000 to $14,999 income bracket is the least frequent group with only 58 families (1.9%) belonging to this category.
| Income Bracket | # Families | % Families |
| Less than $10,000 | 67 | 2.2% |
| $10,000 to $14,999 | 58 | 1.9% |
| $15,000 to $24,999 | 231 | 7.6% |
| $25,000 to $34,999 | 204 | 6.7% |
| $35,000 to $49,999 | 511 | 16.8% |
| $50,000 to $74,999 | 751 | 24.7% |
| $75,000 to $99,999 | 563 | 18.5% |
| $100,000 to $149,999 | 395 | 13.0% |
| $150,000 to $199,999 | 161 | 5.3% |
| $200,000+ | 103 | 3.4% |
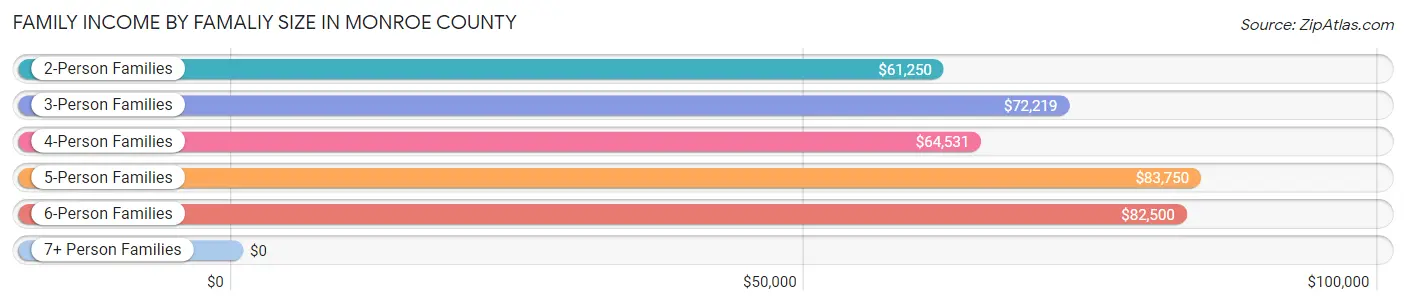
Family Income by Famaliy Size in Monroe County
5-person families (60 | 2.0%) account for the highest median family income in Monroe County with $83,750 per family, while 2-person families (1,866 | 61.3%) have the highest median income of $30,625 per family member.
| Income Bracket | # Families | Median Income |
| 2-Person Families | 1,866 (61.3%) | $61,250 |
| 3-Person Families | 747 (24.6%) | $72,219 |
| 4-Person Families | 256 (8.4%) | $64,531 |
| 5-Person Families | 60 (2.0%) | $83,750 |
| 6-Person Families | 96 (3.2%) | $82,500 |
| 7+ Person Families | 17 (0.6%) | $0 |
| Total | 3,042 (100.0%) | $65,034 |
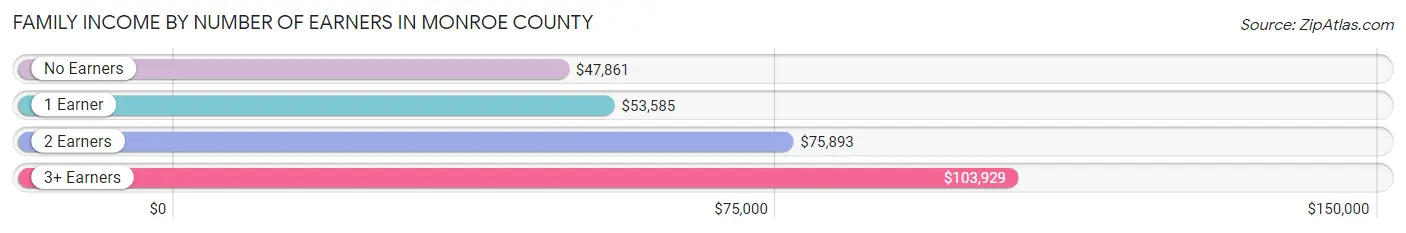
Family Income by Number of Earners in Monroe County
The median family income in Monroe County is $65,034, with families comprising 3+ earners (250) having the highest median family income of $103,929, while families with no earners (927) have the lowest median family income of $47,861, accounting for 8.2% and 30.5% of families, respectively.
| Number of Earners | # Families | Median Income |
| No Earners | 927 (30.5%) | $47,861 |
| 1 Earner | 1,013 (33.3%) | $53,585 |
| 2 Earners | 852 (28.0%) | $75,893 |
| 3+ Earners | 250 (8.2%) | $103,929 |
| Total | 3,042 (100.0%) | $65,034 |
Household Income in Monroe County
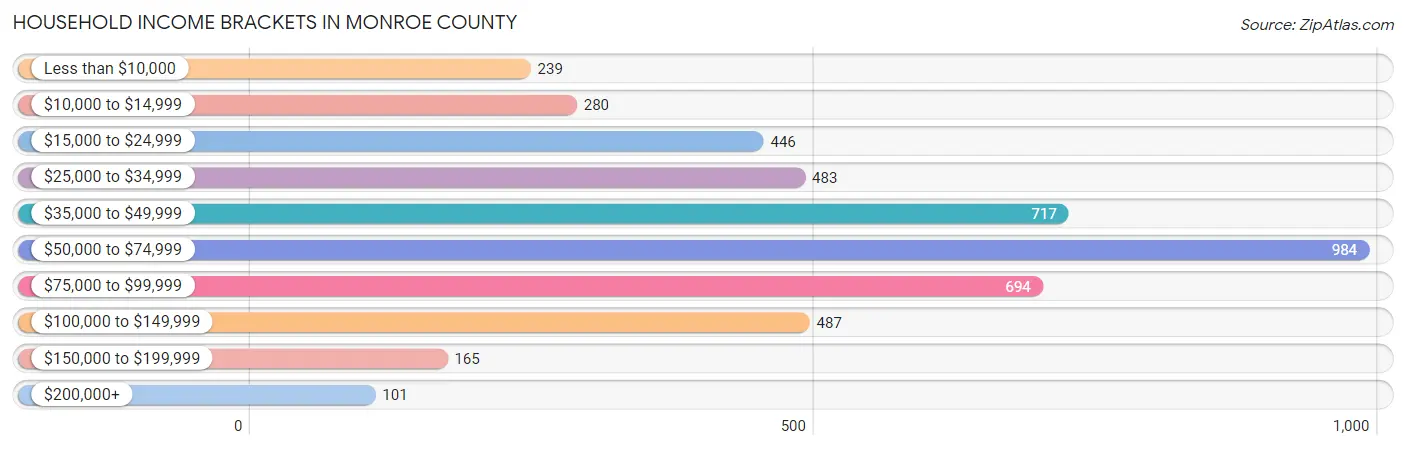
Household Income Brackets in Monroe County
With 984 households falling in the category, the $50,000 to $74,999 income range is the most frequent in Monroe County, accounting for 21.4% of all households. In contrast, only 101 households (2.2%) fall into the $200,000+ income bracket, making it the least populous group.
| Income Bracket | # Households | % Households |
| Less than $10,000 | 239 | 5.2% |
| $10,000 to $14,999 | 280 | 6.1% |
| $15,000 to $24,999 | 446 | 9.7% |
| $25,000 to $34,999 | 483 | 10.5% |
| $35,000 to $49,999 | 717 | 15.6% |
| $50,000 to $74,999 | 984 | 21.4% |
| $75,000 to $99,999 | 694 | 15.1% |
| $100,000 to $149,999 | 487 | 10.6% |
| $150,000 to $199,999 | 165 | 3.6% |
| $200,000+ | 101 | 2.2% |
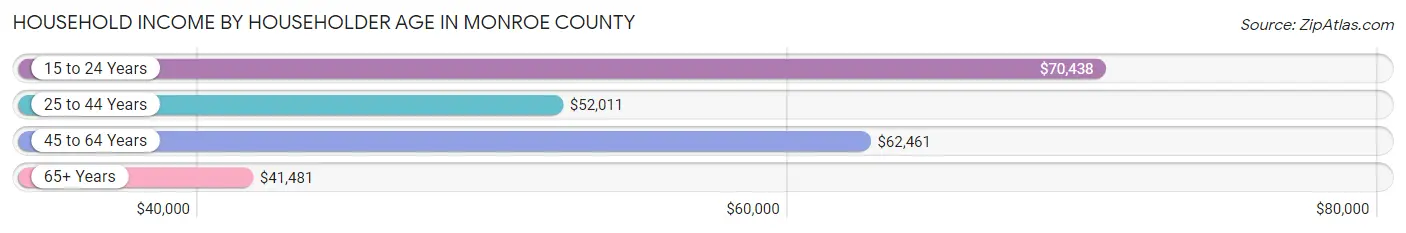
Household Income by Householder Age in Monroe County
The median household income in Monroe County is $52,392, with the highest median household income of $70,438 found in the 15 to 24 years age bracket for the primary householder. A total of 80 households (1.7%) fall into this category. Meanwhile, the 65+ years age bracket for the primary householder has the lowest median household income of $41,481, with 1,870 households (40.7%) in this group.
| Income Bracket | # Households | Median Income |
| 15 to 24 Years | 80 (1.7%) | $70,438 |
| 25 to 44 Years | 940 (20.4%) | $52,011 |
| 45 to 64 Years | 1,706 (37.1%) | $62,461 |
| 65+ Years | 1,870 (40.7%) | $41,481 |
| Total | 4,596 (100.0%) | $52,392 |
Poverty in Monroe County
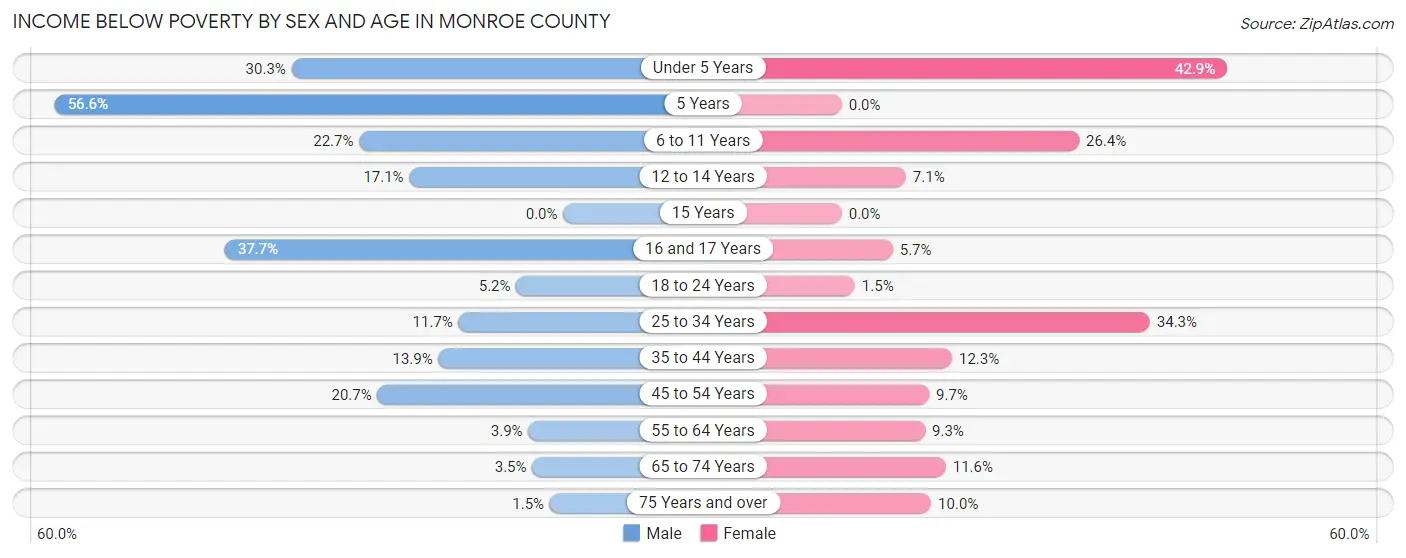
Income Below Poverty by Sex and Age in Monroe County
With 11.8% poverty level for males and 14.5% for females among the residents of Monroe County, 5 year old males and under 5 year old females are the most vulnerable to poverty, with 64 males (56.6%) and 121 females (42.9%) in their respective age groups living below the poverty level.
| Age Bracket | Male | Female |
| Under 5 Years | 92 (30.3%) | 121 (42.9%) |
| 5 Years | 64 (56.6%) | 0 (0.0%) |
| 6 to 11 Years | 90 (22.7%) | 106 (26.4%) |
| 12 to 14 Years | 36 (17.1%) | 12 (7.1%) |
| 15 Years | 0 (0.0%) | 0 (0.0%) |
| 16 and 17 Years | 23 (37.7%) | 15 (5.7%) |
| 18 to 24 Years | 32 (5.2%) | 5 (1.5%) |
| 25 to 34 Years | 61 (11.7%) | 235 (34.3%) |
| 35 to 44 Years | 97 (13.9%) | 76 (12.3%) |
| 45 to 54 Years | 162 (20.7%) | 74 (9.7%) |
| 55 to 64 Years | 36 (3.9%) | 85 (9.3%) |
| 65 to 74 Years | 29 (3.5%) | 104 (11.6%) |
| 75 Years and over | 9 (1.5%) | 64 (10.0%) |
| Total | 731 (11.8%) | 897 (14.5%) |
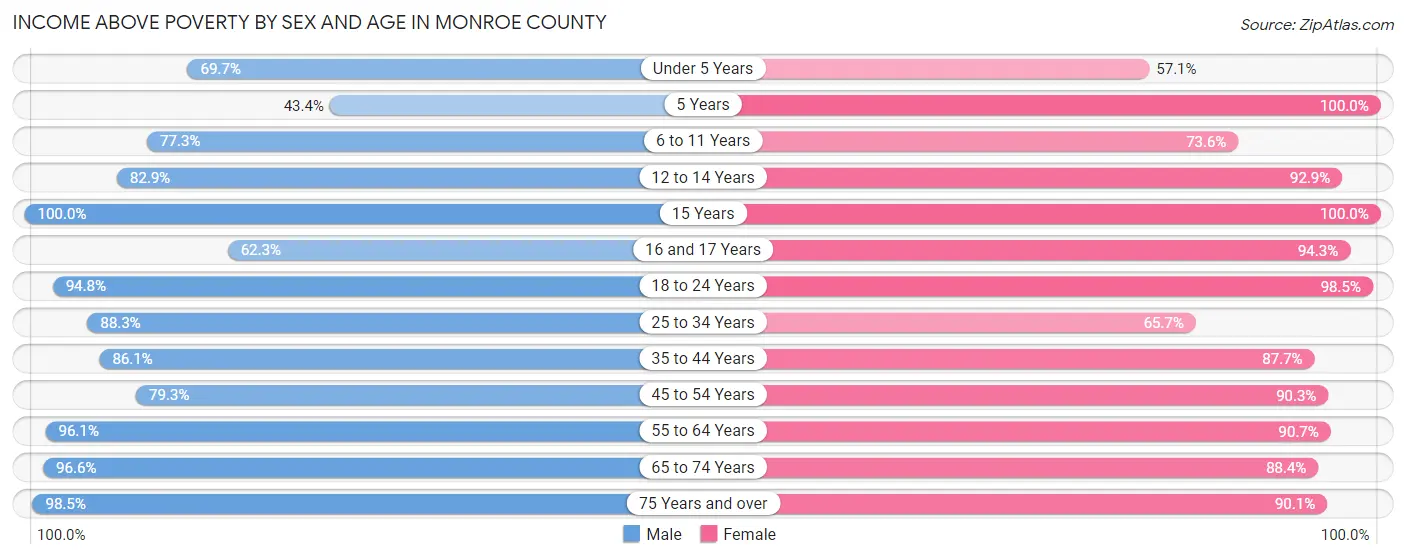
Income Above Poverty by Sex and Age in Monroe County
According to the poverty statistics in Monroe County, males aged 15 years and females aged 5 years are the age groups that are most secure financially, with 100.0% of males and 100.0% of females in these age groups living above the poverty line.
| Age Bracket | Male | Female |
| Under 5 Years | 212 (69.7%) | 161 (57.1%) |
| 5 Years | 49 (43.4%) | 142 (100.0%) |
| 6 to 11 Years | 306 (77.3%) | 295 (73.6%) |
| 12 to 14 Years | 174 (82.9%) | 156 (92.9%) |
| 15 Years | 118 (100.0%) | 49 (100.0%) |
| 16 and 17 Years | 38 (62.3%) | 249 (94.3%) |
| 18 to 24 Years | 580 (94.8%) | 338 (98.5%) |
| 25 to 34 Years | 462 (88.3%) | 450 (65.7%) |
| 35 to 44 Years | 601 (86.1%) | 543 (87.7%) |
| 45 to 54 Years | 621 (79.3%) | 687 (90.3%) |
| 55 to 64 Years | 889 (96.1%) | 831 (90.7%) |
| 65 to 74 Years | 812 (96.6%) | 794 (88.4%) |
| 75 Years and over | 594 (98.5%) | 579 (90.0%) |
| Total | 5,456 (88.2%) | 5,274 (85.5%) |
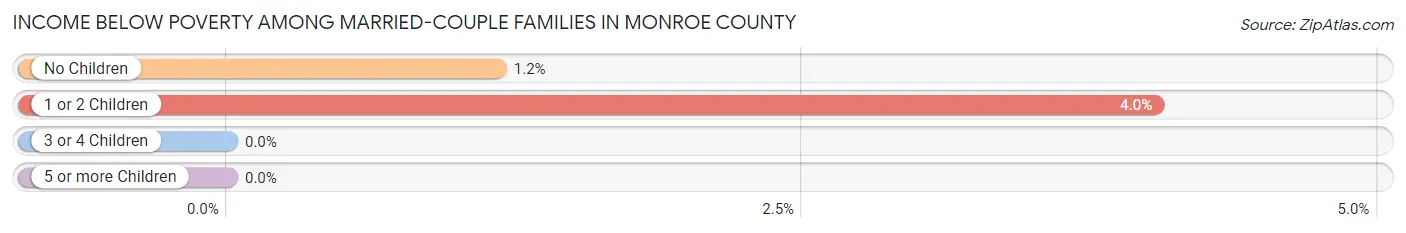
Income Below Poverty Among Married-Couple Families in Monroe County
The poverty statistics for married-couple families in Monroe County show that 1.7% or 40 of the total 2,393 families live below the poverty line. Families with 1 or 2 children have the highest poverty rate of 4.0%, comprising of 19 families. On the other hand, families with 3 or 4 children have the lowest poverty rate of 0.0%, which includes 0 families.
| Children | Above Poverty | Below Poverty |
| No Children | 1,779 (98.8%) | 21 (1.2%) |
| 1 or 2 Children | 452 (96.0%) | 19 (4.0%) |
| 3 or 4 Children | 122 (100.0%) | 0 (0.0%) |
| 5 or more Children | 0 (0.0%) | 0 (0.0%) |
| Total | 2,353 (98.3%) | 40 (1.7%) |
Income Below Poverty Among Single-Parent Households in Monroe County
According to the poverty data in Monroe County, 23.6% or 55 single-father households and 34.1% or 142 single-mother households are living below the poverty line. Among single-father households, those with 5 or more children have the highest poverty rate, with 10 households (100.0%) experiencing poverty. Likewise, among single-mother households, those with 1 or 2 children have the highest poverty rate, with 90 households (45.5%) falling below the poverty line.
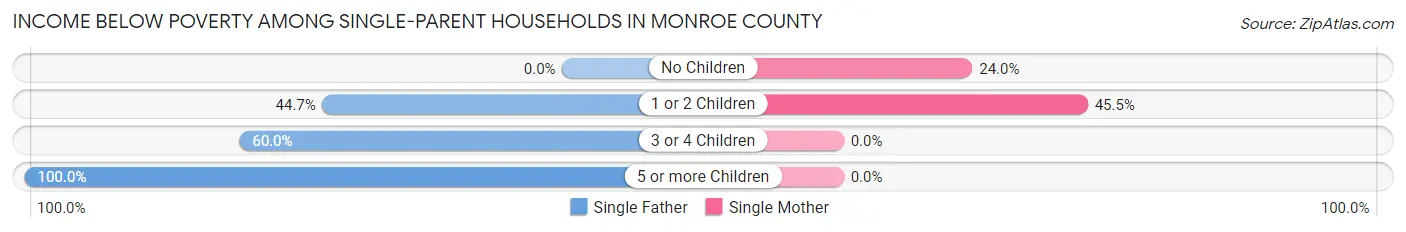
| Children | Single Father | Single Mother |
| No Children | 0 (0.0%) | 52 (24.0%) |
| 1 or 2 Children | 42 (44.7%) | 90 (45.5%) |
| 3 or 4 Children | 3 (60.0%) | 0 (0.0%) |
| 5 or more Children | 10 (100.0%) | 0 (0.0%) |
| Total | 55 (23.6%) | 142 (34.1%) |
Income Below Poverty Among Married-Couple vs Single-Parent Households in Monroe County
The poverty data for Monroe County shows that 40 of the married-couple family households (1.7%) and 197 of the single-parent households (30.3%) are living below the poverty level. Within the married-couple family households, those with 1 or 2 children have the highest poverty rate, with 19 households (4.0%) falling below the poverty line. Among the single-parent households, those with 5 or more children have the highest poverty rate, with 10 household (100.0%) living below poverty.
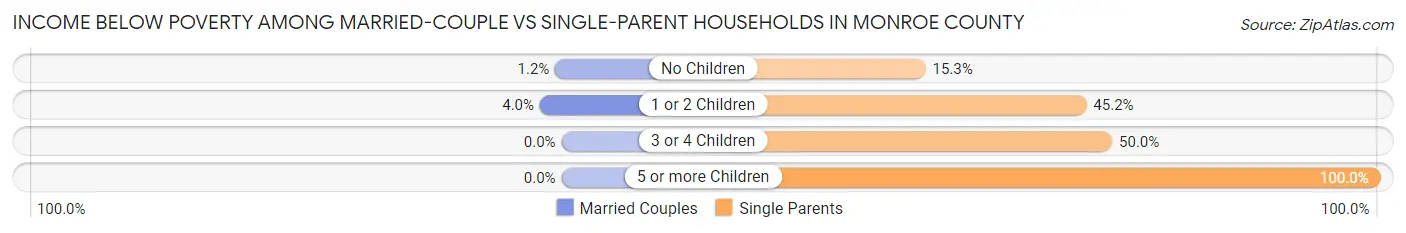
| Children | Married-Couple Families | Single-Parent Households |
| No Children | 21 (1.2%) | 52 (15.2%) |
| 1 or 2 Children | 19 (4.0%) | 132 (45.2%) |
| 3 or 4 Children | 0 (0.0%) | 3 (50.0%) |
| 5 or more Children | 0 (0.0%) | 10 (100.0%) |
| Total | 40 (1.7%) | 197 (30.3%) |
Race in Monroe County
The most populous races in Monroe County are White / Caucasian (11,963 | 96.2%), Two or more Races (382 | 3.1%), and Hispanic or Latino (244 | 2.0%).
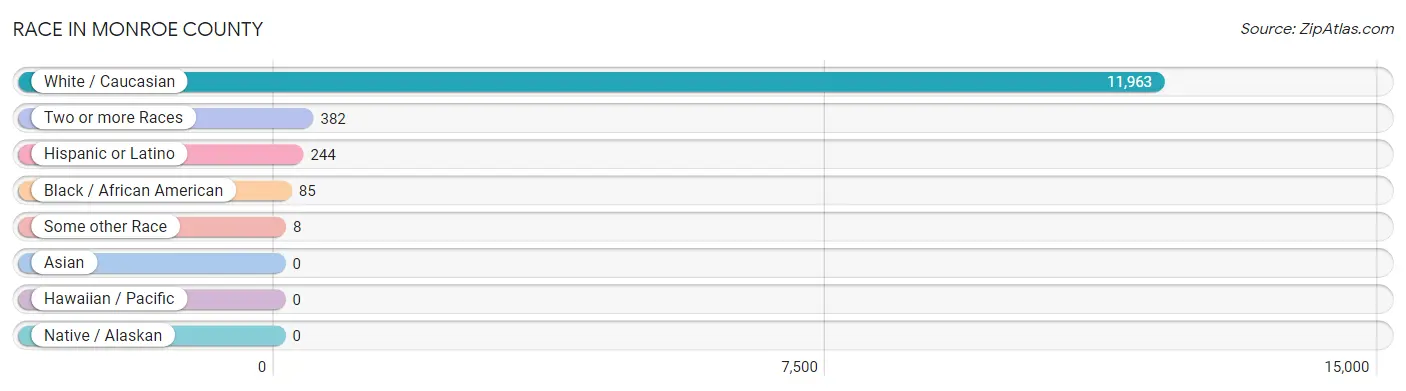
| Race | # Population | % Population |
| Asian | 0 | 0.0% |
| Black / African American | 85 | 0.7% |
| Hawaiian / Pacific | 0 | 0.0% |
| Hispanic or Latino | 244 | 2.0% |
| Native / Alaskan | 0 | 0.0% |
| White / Caucasian | 11,963 | 96.2% |
| Two or more Races | 382 | 3.1% |
| Some other Race | 8 | 0.1% |
| Total | 12,438 | 100.0% |
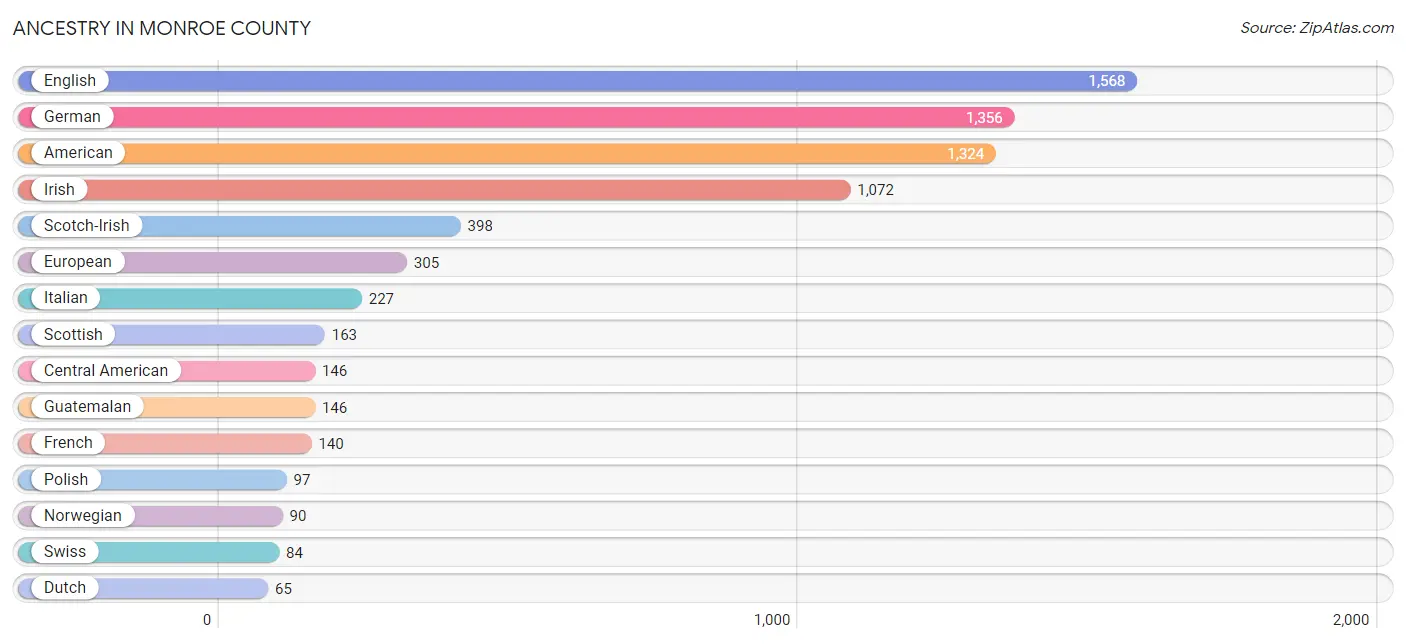
Ancestry in Monroe County
The most populous ancestries reported in Monroe County are English (1,568 | 12.6%), German (1,356 | 10.9%), American (1,324 | 10.6%), Irish (1,072 | 8.6%), and Scotch-Irish (398 | 3.2%), together accounting for 46.0% of all Monroe County residents.
| Ancestry | # Population | % Population |
| American | 1,324 | 10.6% |
| Arab | 36 | 0.3% |
| Austrian | 46 | 0.4% |
| Bhutanese | 7 | 0.1% |
| British | 9 | 0.1% |
| Burmese | 8 | 0.1% |
| Central American | 146 | 1.2% |
| Cherokee | 6 | 0.1% |
| Cuban | 12 | 0.1% |
| Czech | 12 | 0.1% |
| Danish | 13 | 0.1% |
| Dutch | 65 | 0.5% |
| Eastern European | 9 | 0.1% |
| English | 1,568 | 12.6% |
| European | 305 | 2.5% |
| French | 140 | 1.1% |
| German | 1,356 | 10.9% |
| Guatemalan | 146 | 1.2% |
| Hungarian | 30 | 0.2% |
| Irish | 1,072 | 8.6% |
| Italian | 227 | 1.8% |
| Jamaican | 20 | 0.2% |
| Korean | 7 | 0.1% |
| Lebanese | 36 | 0.3% |
| Mexican | 50 | 0.4% |
| Norwegian | 90 | 0.7% |
| Polish | 97 | 0.8% |
| Puerto Rican | 14 | 0.1% |
| Russian | 15 | 0.1% |
| Scandinavian | 32 | 0.3% |
| Scotch-Irish | 398 | 3.2% |
| Scottish | 163 | 1.3% |
| South African | 15 | 0.1% |
| Spaniard | 5 | 0.0% |
| Subsaharan African | 15 | 0.1% |
| Swedish | 21 | 0.2% |
| Swiss | 84 | 0.7% |
| Ukrainian | 1 | 0.0% |
| Welsh | 11 | 0.1% | View All 39 Rows |
Immigrants in Monroe County
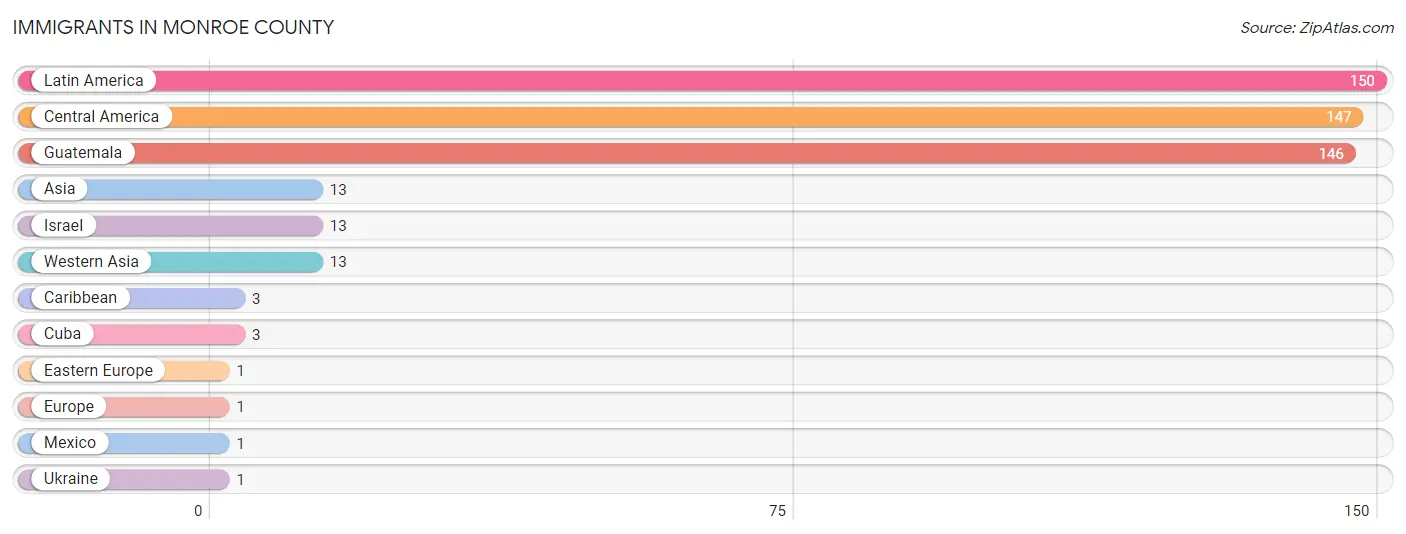
The most numerous immigrant groups reported in Monroe County came from Latin America (150 | 1.2%), Central America (147 | 1.2%), Guatemala (146 | 1.2%), Asia (13 | 0.1%), and Israel (13 | 0.1%), together accounting for 3.8% of all Monroe County residents.
| Immigration Origin | # Population | % Population |
| Asia | 13 | 0.1% |
| Caribbean | 3 | 0.0% |
| Central America | 147 | 1.2% |
| Cuba | 3 | 0.0% |
| Eastern Europe | 1 | 0.0% |
| Europe | 1 | 0.0% |
| Guatemala | 146 | 1.2% |
| Israel | 13 | 0.1% |
| Latin America | 150 | 1.2% |
| Mexico | 1 | 0.0% |
| Ukraine | 1 | 0.0% |
| Western Asia | 13 | 0.1% | View All 12 Rows |
Sex and Age in Monroe County
Sex and Age in Monroe County
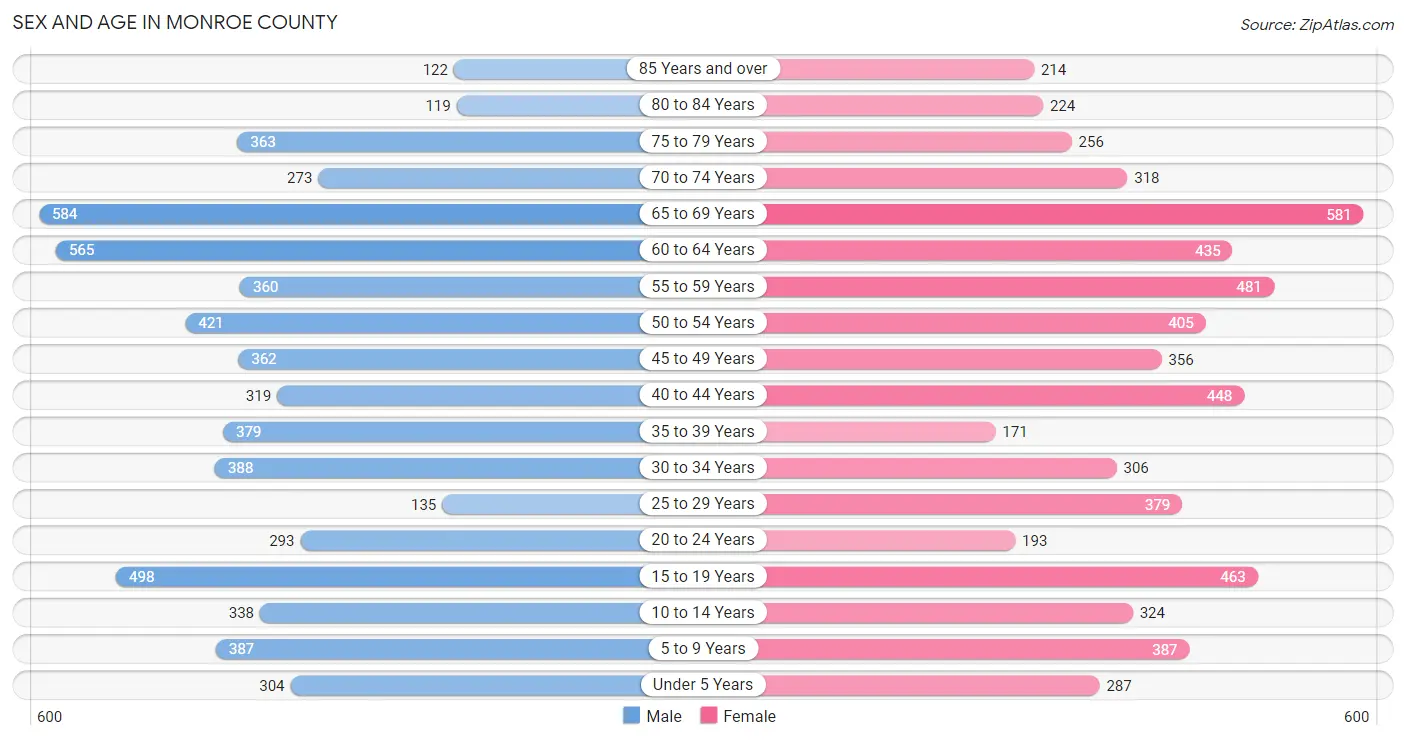
The most populous age groups in Monroe County are 65 to 69 Years (584 | 9.4%) for men and 65 to 69 Years (581 | 9.3%) for women.
| Age Bracket | Male | Female |
| Under 5 Years | 304 (4.9%) | 287 (4.6%) |
| 5 to 9 Years | 387 (6.2%) | 387 (6.2%) |
| 10 to 14 Years | 338 (5.4%) | 324 (5.2%) |
| 15 to 19 Years | 498 (8.0%) | 463 (7.4%) |
| 20 to 24 Years | 293 (4.7%) | 193 (3.1%) |
| 25 to 29 Years | 135 (2.2%) | 379 (6.1%) |
| 30 to 34 Years | 388 (6.2%) | 306 (4.9%) |
| 35 to 39 Years | 379 (6.1%) | 171 (2.8%) |
| 40 to 44 Years | 319 (5.1%) | 448 (7.2%) |
| 45 to 49 Years | 362 (5.8%) | 356 (5.7%) |
| 50 to 54 Years | 421 (6.8%) | 405 (6.5%) |
| 55 to 59 Years | 360 (5.8%) | 481 (7.7%) |
| 60 to 64 Years | 565 (9.1%) | 435 (7.0%) |
| 65 to 69 Years | 584 (9.4%) | 581 (9.3%) |
| 70 to 74 Years | 273 (4.4%) | 318 (5.1%) |
| 75 to 79 Years | 363 (5.9%) | 256 (4.1%) |
| 80 to 84 Years | 119 (1.9%) | 224 (3.6%) |
| 85 Years and over | 122 (2.0%) | 214 (3.4%) |
| Total | 6,210 (100.0%) | 6,228 (100.0%) |
Families and Households in Monroe County
Median Family Size in Monroe County
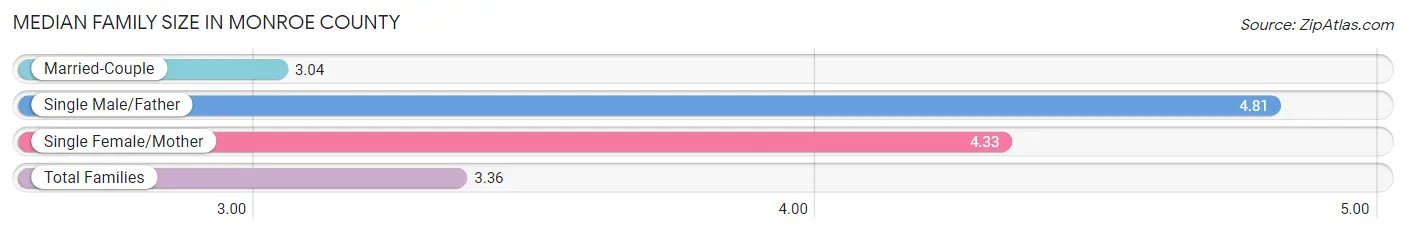
The median family size in Monroe County is 3.36 persons per family, with single male/father families (233 | 7.7%) accounting for the largest median family size of 4.81 persons per family. On the other hand, married-couple families (2,393 | 78.7%) represent the smallest median family size with 3.04 persons per family.
| Family Type | # Families | Family Size |
| Married-Couple | 2,393 (78.7%) | 3.04 |
| Single Male/Father | 233 (7.7%) | 4.81 |
| Single Female/Mother | 416 (13.7%) | 4.33 |
| Total Families | 3,042 (100.0%) | 3.36 |
Median Household Size in Monroe County
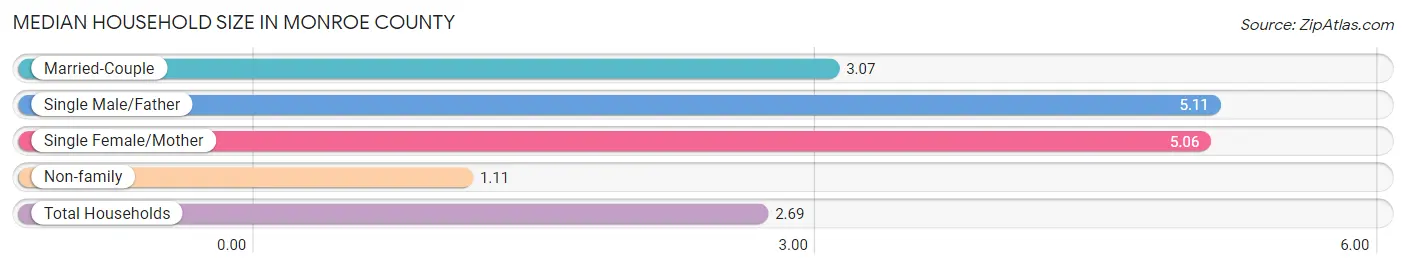
The median household size in Monroe County is 2.69 persons per household, with single male/father households (233 | 5.1%) accounting for the largest median household size of 5.11 persons per household. non-family households (1,554 | 33.8%) represent the smallest median household size with 1.11 persons per household.
| Household Type | # Households | Household Size |
| Married-Couple | 2,393 (52.1%) | 3.07 |
| Single Male/Father | 233 (5.1%) | 5.11 |
| Single Female/Mother | 416 (9.0%) | 5.06 |
| Non-family | 1,554 (33.8%) | 1.11 |
| Total Households | 4,596 (100.0%) | 2.69 |
Household Size by Marriage Status in Monroe County
Out of a total of 4,596 households in Monroe County, 3,042 (66.2%) are family households, while 1,554 (33.8%) are nonfamily households. The most numerous type of family households are 2-person households, comprising 1,832, and the most common type of nonfamily households are 1-person households, comprising 1,460.
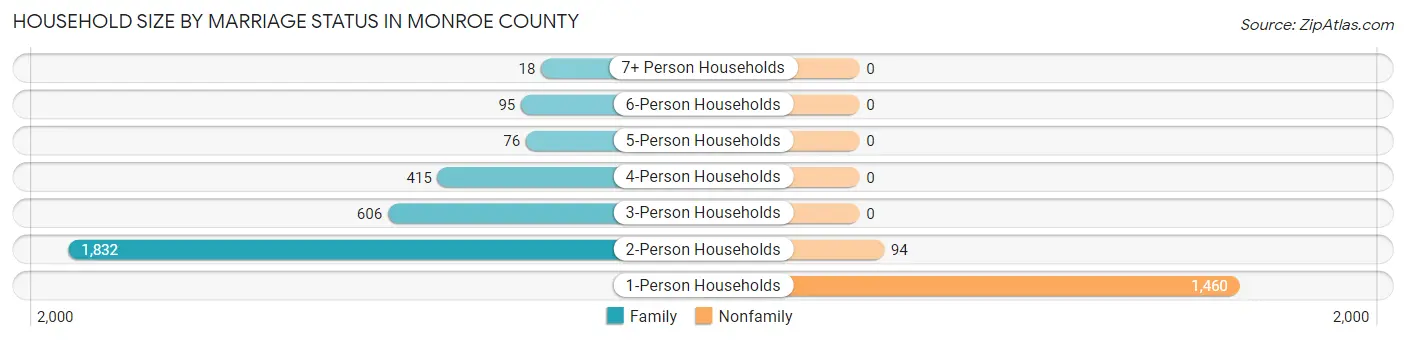
| Household Size | Family Households | Nonfamily Households |
| 1-Person Households | - | 1,460 (31.8%) |
| 2-Person Households | 1,832 (39.9%) | 94 (2.1%) |
| 3-Person Households | 606 (13.2%) | 0 (0.0%) |
| 4-Person Households | 415 (9.0%) | 0 (0.0%) |
| 5-Person Households | 76 (1.7%) | 0 (0.0%) |
| 6-Person Households | 95 (2.1%) | 0 (0.0%) |
| 7+ Person Households | 18 (0.4%) | 0 (0.0%) |
| Total | 3,042 (66.2%) | 1,554 (33.8%) |
Female Fertility in Monroe County
Fertility by Age in Monroe County
Average fertility rate in Monroe County is 37.0 births per 1,000 women. Women in the age bracket of 20 to 34 years have the highest fertility rate with 89.0 births per 1,000 women. Women in the age bracket of 20 to 34 years acount for 86.7% of all women with births.
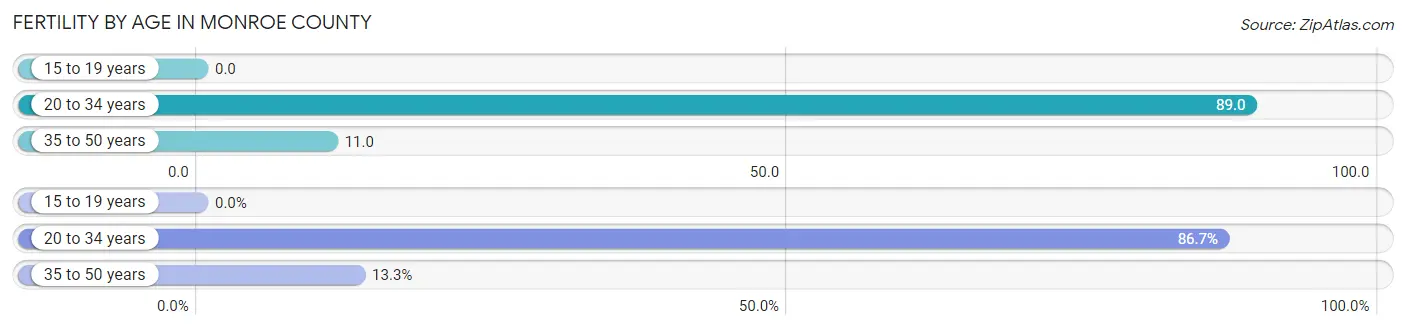
| Age Bracket | Women with Births | Births / 1,000 Women |
| 15 to 19 years | 0 (0.0%) | 0.0 |
| 20 to 34 years | 78 (86.7%) | 89.0 |
| 35 to 50 years | 12 (13.3%) | 11.0 |
| Total | 90 (100.0%) | 37.0 |
Fertility by Age by Marriage Status in Monroe County
74.4% of women with births (90) in Monroe County are married. The highest percentage of unmarried women with births falls into 20 to 34 years age bracket with 29.5% of them unmarried at the time of birth, while the lowest percentage of unmarried women with births belong to 35 to 50 years age bracket with 0.0% of them unmarried.
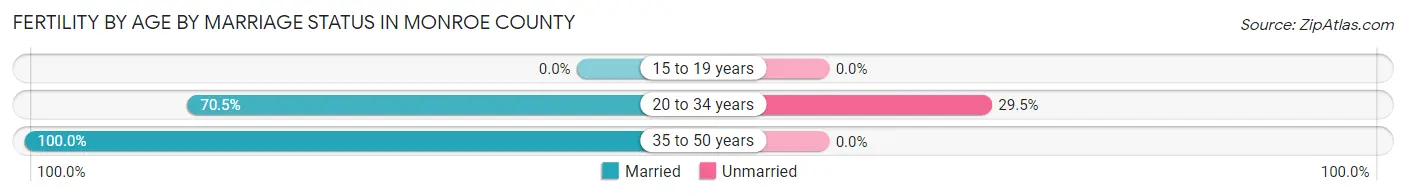
| Age Bracket | Married | Unmarried |
| 15 to 19 years | 0 (0.0%) | 0 (0.0%) |
| 20 to 34 years | 55 (70.5%) | 23 (29.5%) |
| 35 to 50 years | 12 (100.0%) | 0 (0.0%) |
| Total | 67 (74.4%) | 23 (25.6%) |
Fertility by Education in Monroe County
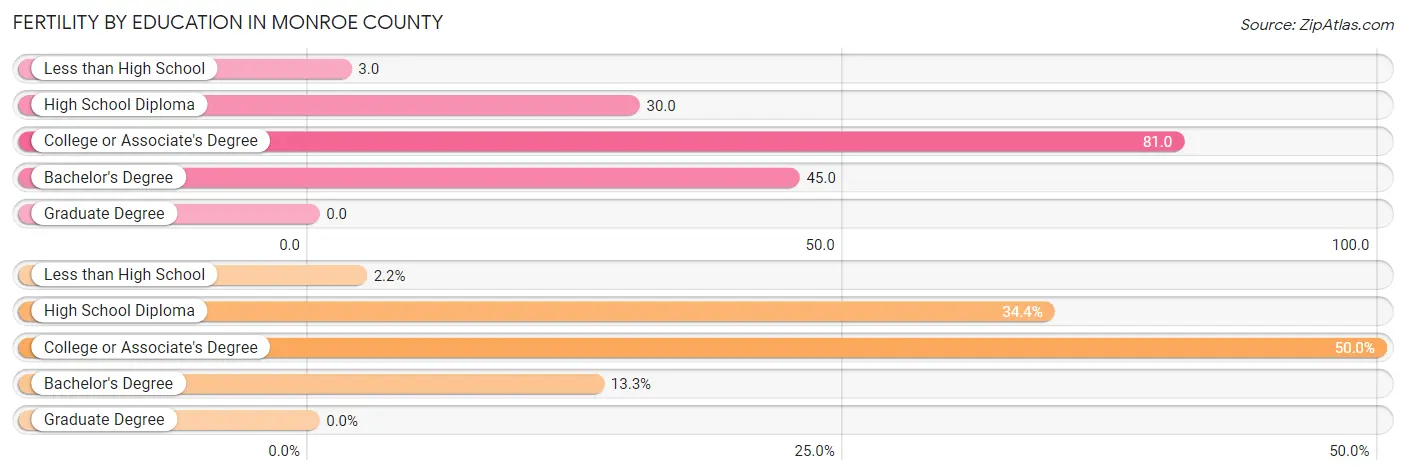
| Educational Attainment | Women with Births | Births / 1,000 Women |
| Less than High School | 2 (2.2%) | 3.0 |
| High School Diploma | 31 (34.4%) | 30.0 |
| College or Associate's Degree | 45 (50.0%) | 81.0 |
| Bachelor's Degree | 12 (13.3%) | 45.0 |
| Graduate Degree | 0 (0.0%) | 0.0 |
| Total | 90 (100.0%) | 37.0 |
Fertility by Education by Marriage Status in Monroe County
25.6% of women with births in Monroe County are unmarried. Women with the educational attainment of less than high school are most likely to be married with 100.0% of them married at childbirth, while women with the educational attainment of college or associate's degree are least likely to be married with 51.1% of them unmarried at childbirth.
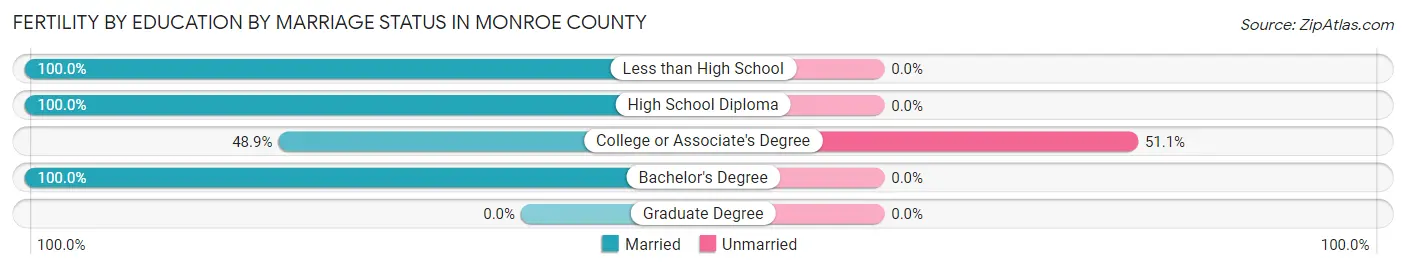
| Educational Attainment | Married | Unmarried |
| Less than High School | 2 (100.0%) | 0 (0.0%) |
| High School Diploma | 31 (100.0%) | 0 (0.0%) |
| College or Associate's Degree | 22 (48.9%) | 23 (51.1%) |
| Bachelor's Degree | 12 (100.0%) | 0 (0.0%) |
| Graduate Degree | 0 (0.0%) | 0 (0.0%) |
| Total | 67 (74.4%) | 23 (25.6%) |
Employment Characteristics in Monroe County
Employment by Class of Employer in Monroe County
Among the 4,208 employed individuals in Monroe County, private company employees (2,955 | 70.2%), not-for-profit organizations (352 | 8.4%), and local government employees (319 | 7.6%) make up the most common classes of employment.
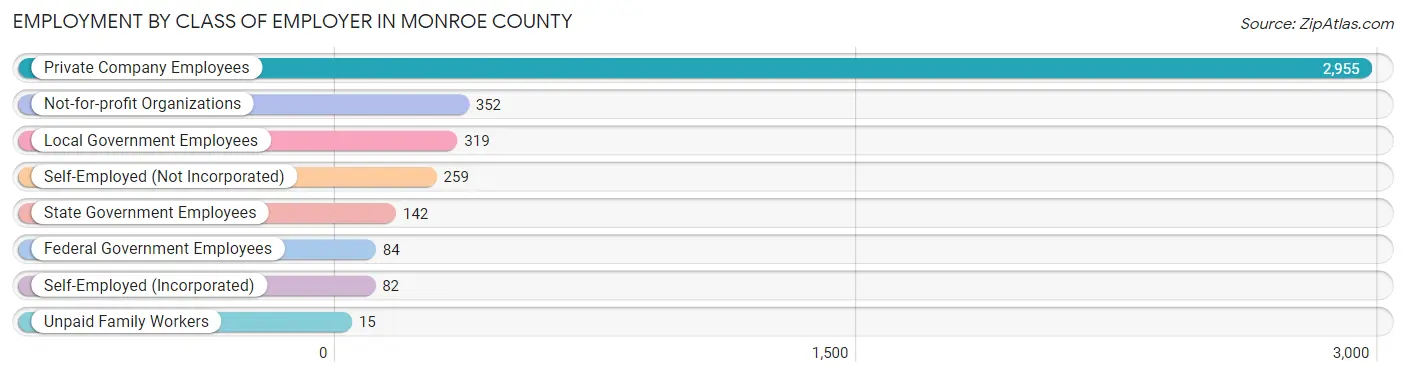
| Employer Class | # Employees | % Employees |
| Private Company Employees | 2,955 | 70.2% |
| Self-Employed (Incorporated) | 82 | 1.9% |
| Self-Employed (Not Incorporated) | 259 | 6.1% |
| Not-for-profit Organizations | 352 | 8.4% |
| Local Government Employees | 319 | 7.6% |
| State Government Employees | 142 | 3.4% |
| Federal Government Employees | 84 | 2.0% |
| Unpaid Family Workers | 15 | 0.4% |
| Total | 4,208 | 100.0% |
Employment Status by Age in Monroe County
According to the labor force statistics for Monroe County, out of the total population over 16 years of age (10,244), 50.6% or 5,183 individuals are in the labor force, with 10.6% or 549 of them unemployed. The age group with the highest labor force participation rate is 20 to 24 years, with 88.7% or 431 individuals in the labor force. Within the labor force, the 30 to 34 years age range has the highest percentage of unemployed individuals, with 39.8% or 220 of them being unemployed.
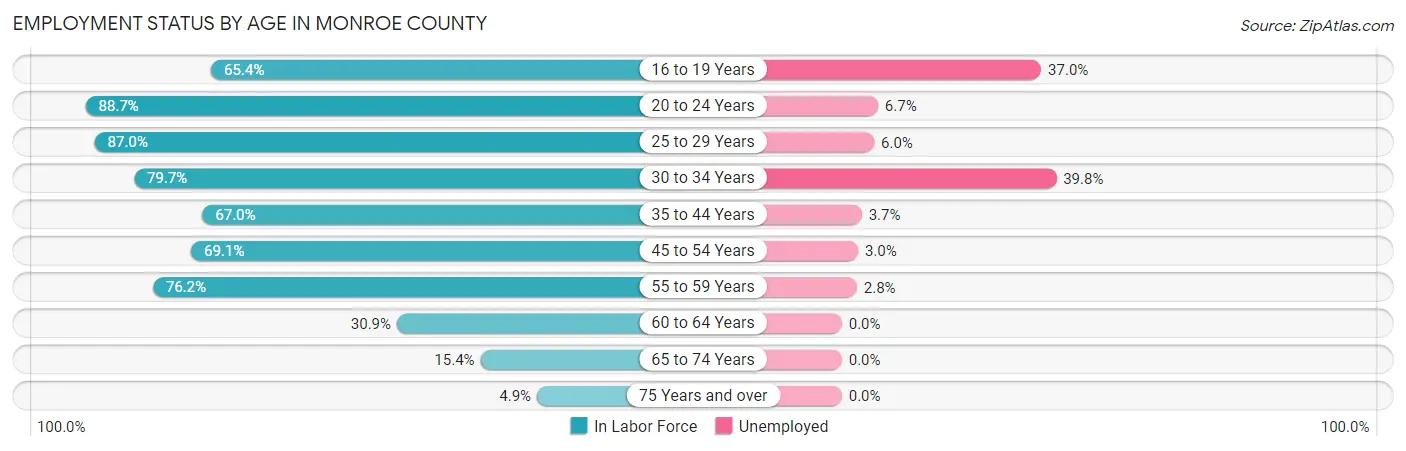
| Age Bracket | In Labor Force | Unemployed |
| 16 to 19 Years | 519 (65.4%) | 192 (37.0%) |
| 20 to 24 Years | 431 (88.7%) | 29 (6.7%) |
| 25 to 29 Years | 447 (87.0%) | 27 (6.0%) |
| 30 to 34 Years | 553 (79.7%) | 220 (39.8%) |
| 35 to 44 Years | 882 (67.0%) | 33 (3.7%) |
| 45 to 54 Years | 1,067 (69.1%) | 32 (3.0%) |
| 55 to 59 Years | 641 (76.2%) | 18 (2.8%) |
| 60 to 64 Years | 309 (30.9%) | 0 (0.0%) |
| 65 to 74 Years | 270 (15.4%) | 0 (0.0%) |
| 75 Years and over | 64 (4.9%) | 0 (0.0%) |
| Total | 5,183 (50.6%) | 549 (10.6%) |
Employment Status by Educational Attainment in Monroe County
According to labor force statistics for Monroe County, 66.0% of individuals (3,901) out of the total population between 25 and 64 years of age (5,910) are in the labor force, with 8.5% or 332 of them being unemployed. The group with the highest labor force participation rate are those with the educational attainment of bachelor's degree or higher, with 86.9% or 745 individuals in the labor force. Within the labor force, individuals with college / associate degree education have the highest percentage of unemployment, with 15.9% or 140 of them being unemployed.
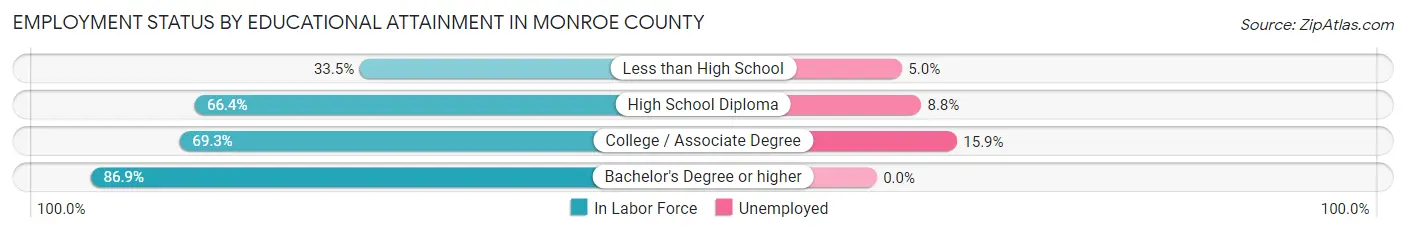
| Educational Attainment | In Labor Force | Unemployed |
| Less than High School | 241 (33.5%) | 36 (5.0%) |
| High School Diploma | 2,035 (66.4%) | 270 (8.8%) |
| College / Associate Degree | 879 (69.3%) | 202 (15.9%) |
| Bachelor's Degree or higher | 745 (86.9%) | 0 (0.0%) |
| Total | 3,901 (66.0%) | 502 (8.5%) |
Employment Occupations by Sex in Monroe County
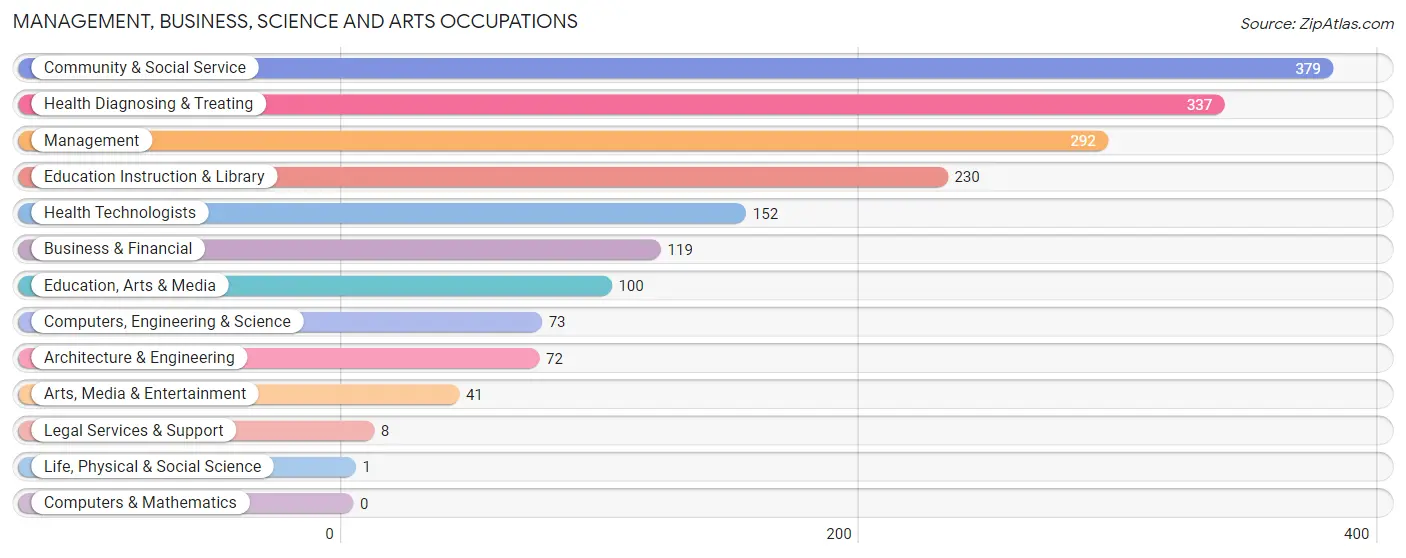
Management, Business, Science and Arts Occupations
The most common Management, Business, Science and Arts occupations in Monroe County are Community & Social Service (379 | 8.2%), Health Diagnosing & Treating (337 | 7.3%), Management (292 | 6.3%), Education Instruction & Library (230 | 5.0%), and Health Technologists (152 | 3.3%).
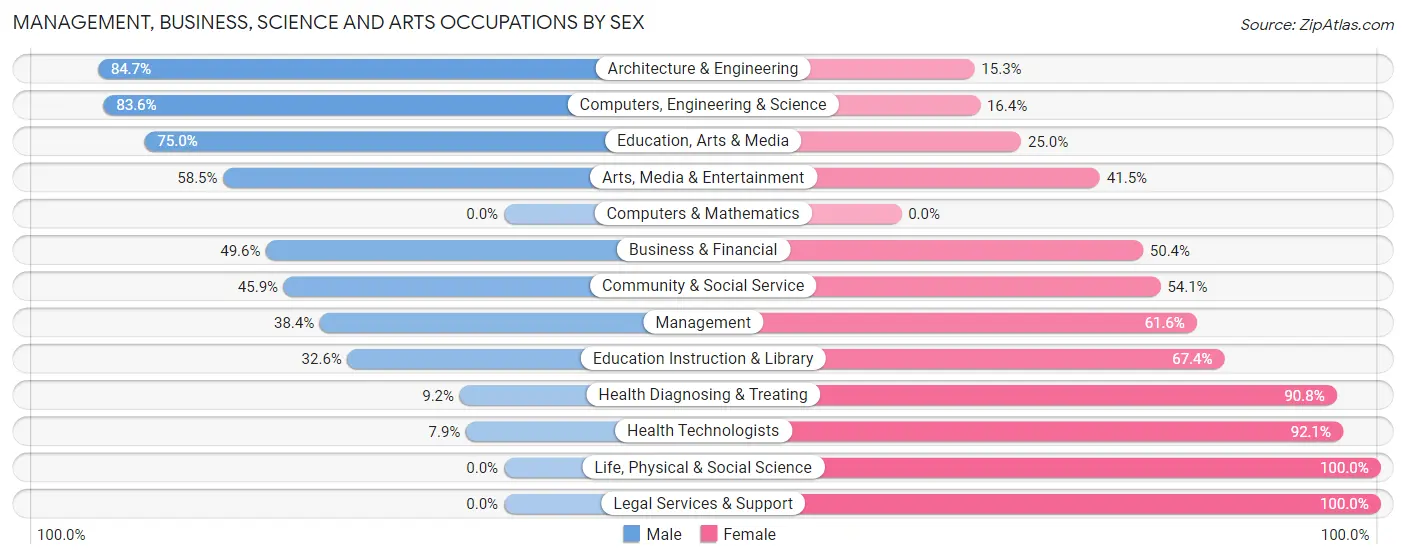
Management, Business, Science and Arts Occupations by Sex
Within the Management, Business, Science and Arts occupations in Monroe County, the most male-oriented occupations are Architecture & Engineering (84.7%), Computers, Engineering & Science (83.6%), and Education, Arts & Media (75.0%), while the most female-oriented occupations are Life, Physical & Social Science (100.0%), Legal Services & Support (100.0%), and Health Technologists (92.1%).
| Occupation | Male | Female |
| Management | 112 (38.4%) | 180 (61.6%) |
| Business & Financial | 59 (49.6%) | 60 (50.4%) |
| Computers, Engineering & Science | 61 (83.6%) | 12 (16.4%) |
| Computers & Mathematics | 0 (0.0%) | 0 (0.0%) |
| Architecture & Engineering | 61 (84.7%) | 11 (15.3%) |
| Life, Physical & Social Science | 0 (0.0%) | 1 (100.0%) |
| Community & Social Service | 174 (45.9%) | 205 (54.1%) |
| Education, Arts & Media | 75 (75.0%) | 25 (25.0%) |
| Legal Services & Support | 0 (0.0%) | 8 (100.0%) |
| Education Instruction & Library | 75 (32.6%) | 155 (67.4%) |
| Arts, Media & Entertainment | 24 (58.5%) | 17 (41.5%) |
| Health Diagnosing & Treating | 31 (9.2%) | 306 (90.8%) |
| Health Technologists | 12 (7.9%) | 140 (92.1%) |
| Total (Category) | 437 (36.4%) | 763 (63.6%) |
| Total (Overall) | 2,451 (52.9%) | 2,181 (47.1%) |
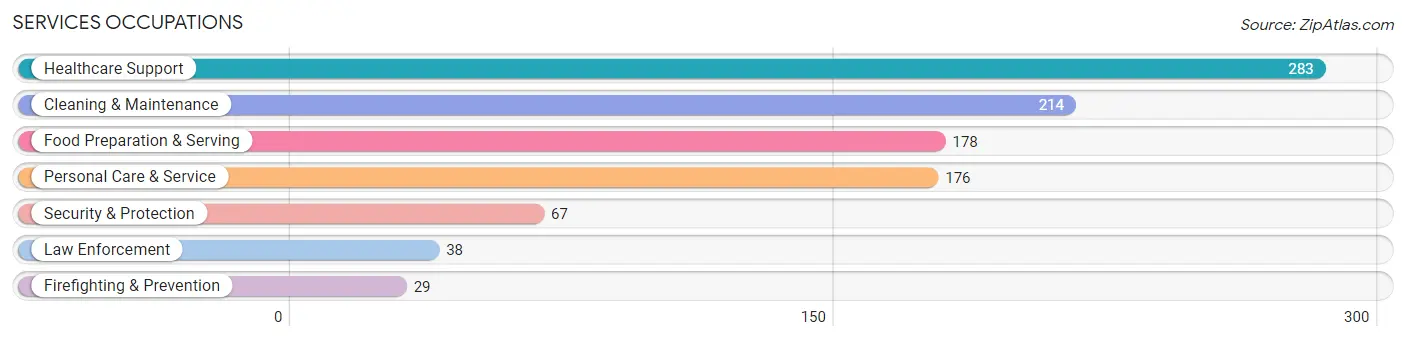
Services Occupations
The most common Services occupations in Monroe County are Healthcare Support (283 | 6.1%), Cleaning & Maintenance (214 | 4.6%), Food Preparation & Serving (178 | 3.8%), Personal Care & Service (176 | 3.8%), and Security & Protection (67 | 1.5%).
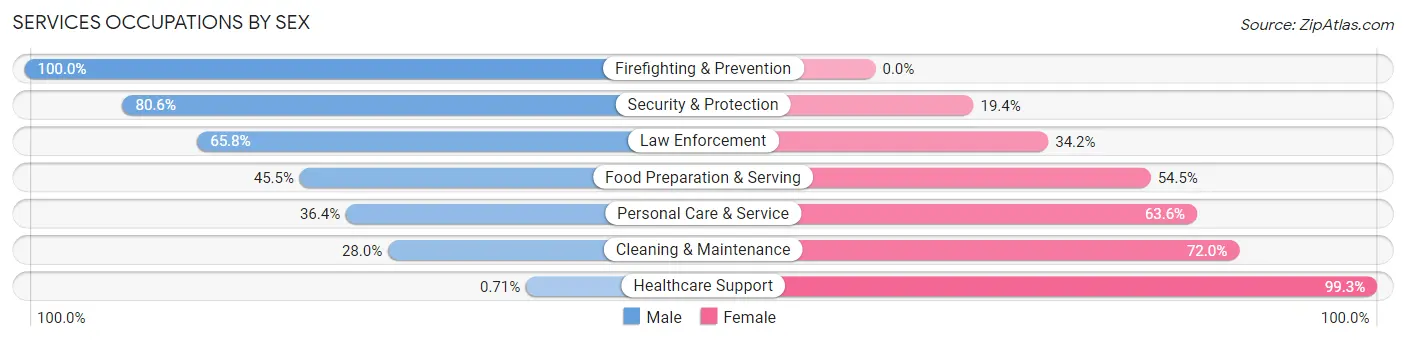
Services Occupations by Sex
Within the Services occupations in Monroe County, the most male-oriented occupations are Firefighting & Prevention (100.0%), Security & Protection (80.6%), and Law Enforcement (65.8%), while the most female-oriented occupations are Healthcare Support (99.3%), Cleaning & Maintenance (72.0%), and Personal Care & Service (63.6%).
| Occupation | Male | Female |
| Healthcare Support | 2 (0.7%) | 281 (99.3%) |
| Security & Protection | 54 (80.6%) | 13 (19.4%) |
| Firefighting & Prevention | 29 (100.0%) | 0 (0.0%) |
| Law Enforcement | 25 (65.8%) | 13 (34.2%) |
| Food Preparation & Serving | 81 (45.5%) | 97 (54.5%) |
| Cleaning & Maintenance | 60 (28.0%) | 154 (72.0%) |
| Personal Care & Service | 64 (36.4%) | 112 (63.6%) |
| Total (Category) | 261 (28.4%) | 657 (71.6%) |
| Total (Overall) | 2,451 (52.9%) | 2,181 (47.1%) |
Sales and Office Occupations
The most common Sales and Office occupations in Monroe County are Office & Administration (449 | 9.7%), and Sales & Related (292 | 6.3%).

Sales and Office Occupations by Sex
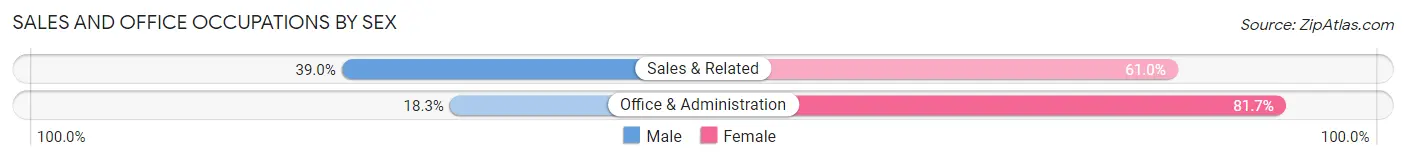
| Occupation | Male | Female |
| Sales & Related | 114 (39.0%) | 178 (61.0%) |
| Office & Administration | 82 (18.3%) | 367 (81.7%) |
| Total (Category) | 196 (26.5%) | 545 (73.6%) |
| Total (Overall) | 2,451 (52.9%) | 2,181 (47.1%) |
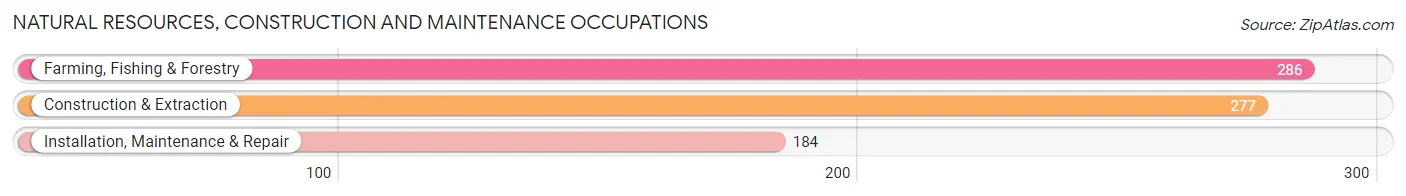
Natural Resources, Construction and Maintenance Occupations
The most common Natural Resources, Construction and Maintenance occupations in Monroe County are Farming, Fishing & Forestry (286 | 6.2%), Construction & Extraction (277 | 6.0%), and Installation, Maintenance & Repair (184 | 4.0%).
Natural Resources, Construction and Maintenance Occupations by Sex
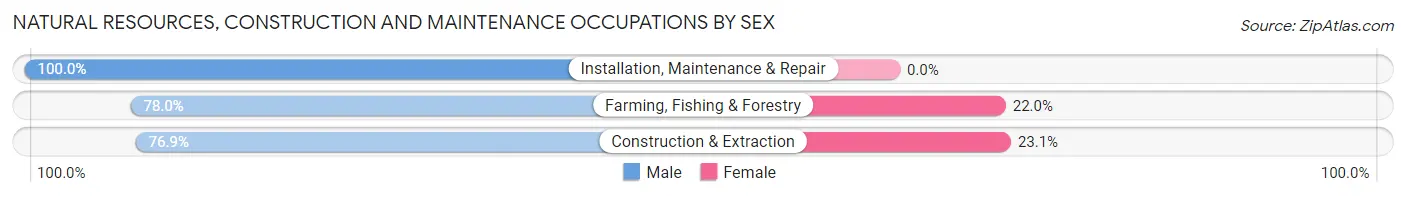
| Occupation | Male | Female |
| Farming, Fishing & Forestry | 223 (78.0%) | 63 (22.0%) |
| Construction & Extraction | 213 (76.9%) | 64 (23.1%) |
| Installation, Maintenance & Repair | 184 (100.0%) | 0 (0.0%) |
| Total (Category) | 620 (83.0%) | 127 (17.0%) |
| Total (Overall) | 2,451 (52.9%) | 2,181 (47.1%) |
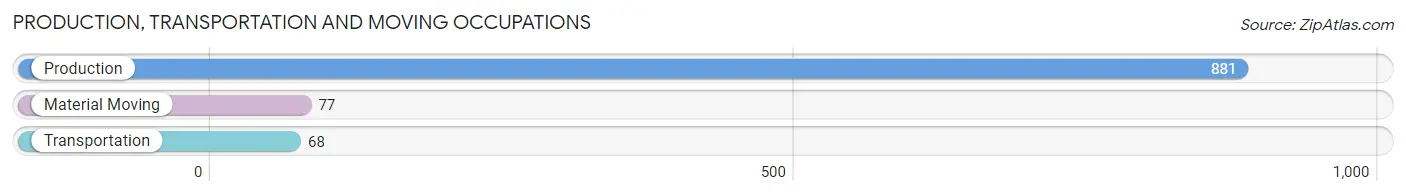
Production, Transportation and Moving Occupations
The most common Production, Transportation and Moving occupations in Monroe County are Production (881 | 19.0%), Material Moving (77 | 1.7%), and Transportation (68 | 1.5%).
Production, Transportation and Moving Occupations by Sex
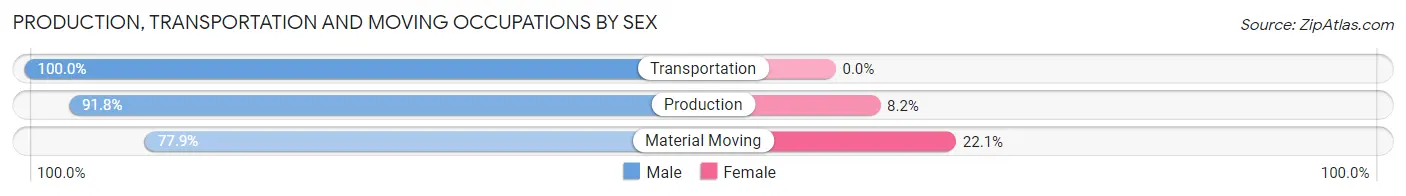
| Occupation | Male | Female |
| Production | 809 (91.8%) | 72 (8.2%) |
| Transportation | 68 (100.0%) | 0 (0.0%) |
| Material Moving | 60 (77.9%) | 17 (22.1%) |
| Total (Category) | 937 (91.3%) | 89 (8.7%) |
| Total (Overall) | 2,451 (52.9%) | 2,181 (47.1%) |
Employment Industries by Sex in Monroe County
Employment Industries in Monroe County
The major employment industries in Monroe County include Health Care & Social Assistance (807 | 17.4%), Manufacturing (707 | 15.3%), Construction (533 | 11.5%), Retail Trade (468 | 10.1%), and Agriculture, Fishing & Hunting (390 | 8.4%).

Employment Industries by Sex in Monroe County
The Monroe County industries that see more men than women are Mining, Quarrying, & Extraction (100.0%), Wholesale Trade (100.0%), and Utilities (100.0%), whereas the industries that tend to have a higher number of women are Information (100.0%), Arts, Entertainment & Recreation (100.0%), and Health Care & Social Assistance (90.0%).
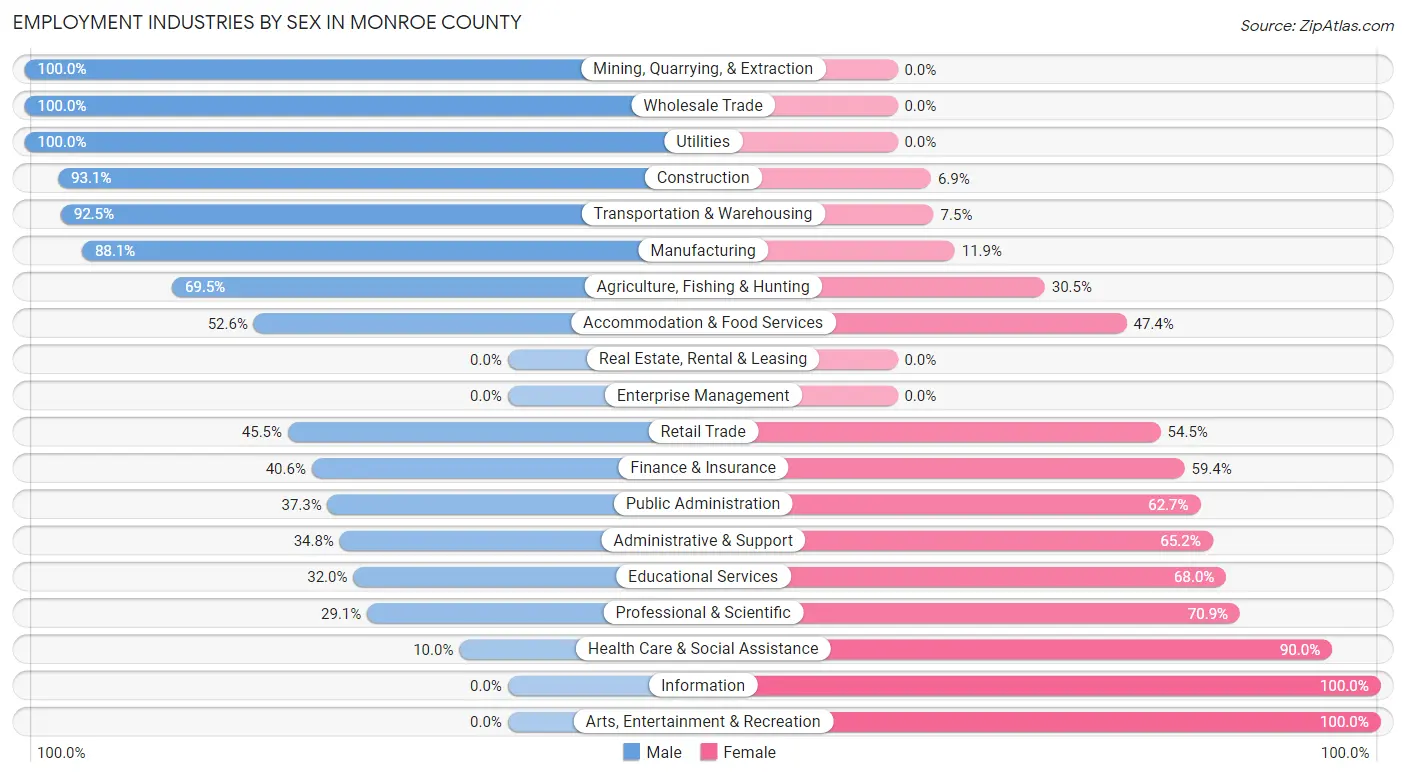
| Industry | Male | Female |
| Agriculture, Fishing & Hunting | 271 (69.5%) | 119 (30.5%) |
| Mining, Quarrying, & Extraction | 12 (100.0%) | 0 (0.0%) |
| Construction | 496 (93.1%) | 37 (6.9%) |
| Manufacturing | 623 (88.1%) | 84 (11.9%) |
| Wholesale Trade | 45 (100.0%) | 0 (0.0%) |
| Retail Trade | 213 (45.5%) | 255 (54.5%) |
| Transportation & Warehousing | 74 (92.5%) | 6 (7.5%) |
| Utilities | 33 (100.0%) | 0 (0.0%) |
| Information | 0 (0.0%) | 28 (100.0%) |
| Finance & Insurance | 43 (40.6%) | 63 (59.4%) |
| Real Estate, Rental & Leasing | 0 (0.0%) | 0 (0.0%) |
| Professional & Scientific | 85 (29.1%) | 207 (70.9%) |
| Enterprise Management | 0 (0.0%) | 0 (0.0%) |
| Administrative & Support | 40 (34.8%) | 75 (65.2%) |
| Educational Services | 109 (32.0%) | 232 (68.0%) |
| Health Care & Social Assistance | 81 (10.0%) | 726 (90.0%) |
| Arts, Entertainment & Recreation | 0 (0.0%) | 7 (100.0%) |
| Accommodation & Food Services | 133 (52.6%) | 120 (47.4%) |
| Public Administration | 69 (37.3%) | 116 (62.7%) |
| Total | 2,451 (52.9%) | 2,181 (47.1%) |
Education in Monroe County
School Enrollment in Monroe County
The most common levels of schooling among the 2,335 students in Monroe County are high school (642 | 27.5%), middle school (601 | 25.7%), and elementary school (473 | 20.3%).
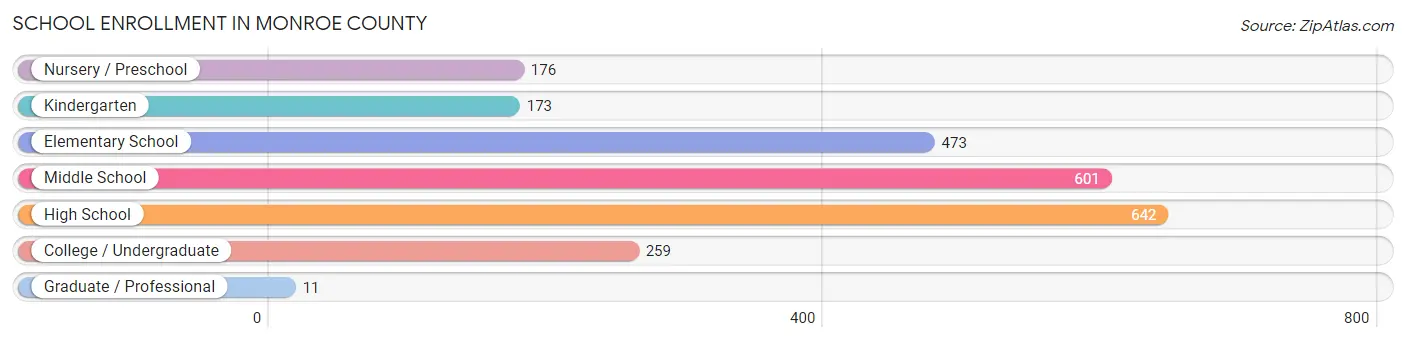
| School Level | # Students | % Students |
| Nursery / Preschool | 176 | 7.5% |
| Kindergarten | 173 | 7.4% |
| Elementary School | 473 | 20.3% |
| Middle School | 601 | 25.7% |
| High School | 642 | 27.5% |
| College / Undergraduate | 259 | 11.1% |
| Graduate / Professional | 11 | 0.5% |
| Total | 2,335 | 100.0% |
School Enrollment by Age by Funding Source in Monroe County
Out of a total of 2,335 students who are enrolled in schools in Monroe County, 219 (9.4%) attend a private institution, while the remaining 2,116 (90.6%) are enrolled in public schools. The age group of 35 years and over has the highest likelihood of being enrolled in private schools, with 14 (30.4% in the age bracket) enrolled. Conversely, the age group of 3 to 4 year olds has the lowest likelihood of being enrolled in a private school, with 33 (100.0% in the age bracket) attending a public institution.
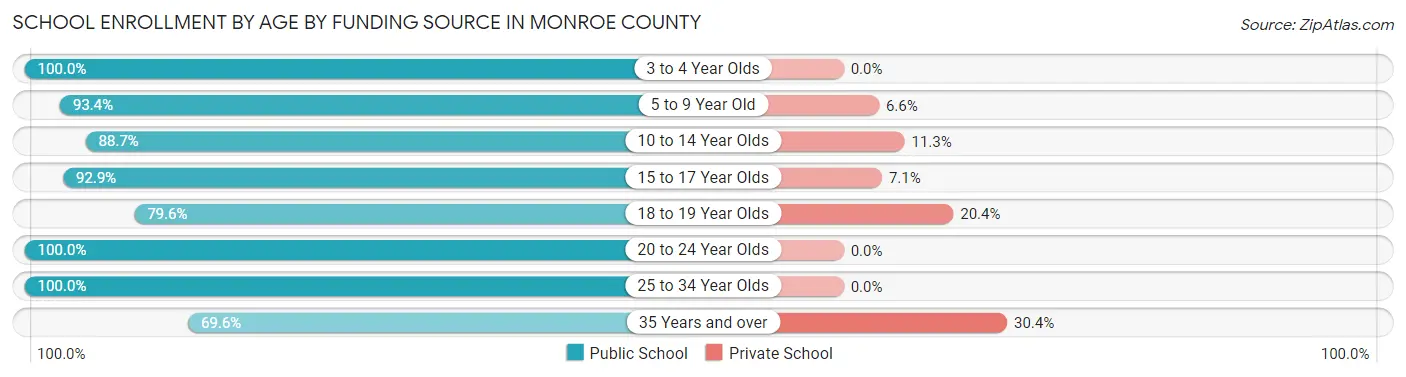
| Age Bracket | Public School | Private School |
| 3 to 4 Year Olds | 33 (100.0%) | 0 (0.0%) |
| 5 to 9 Year Old | 697 (93.4%) | 49 (6.6%) |
| 10 to 14 Year Olds | 571 (88.7%) | 73 (11.3%) |
| 15 to 17 Year Olds | 442 (92.9%) | 34 (7.1%) |
| 18 to 19 Year Olds | 191 (79.6%) | 49 (20.4%) |
| 20 to 24 Year Olds | 86 (100.0%) | 0 (0.0%) |
| 25 to 34 Year Olds | 64 (100.0%) | 0 (0.0%) |
| 35 Years and over | 32 (69.6%) | 14 (30.4%) |
| Total | 2,116 (90.6%) | 219 (9.4%) |
Educational Attainment by Field of Study in Monroe County
Education (309 | 19.7%), bio, nature & agricultural (267 | 17.1%), science & technology (185 | 11.8%), arts & humanities (179 | 11.4%), and business (133 | 8.5%) are the most common fields of study among 1,566 individuals in Monroe County who have obtained a bachelor's degree or higher.
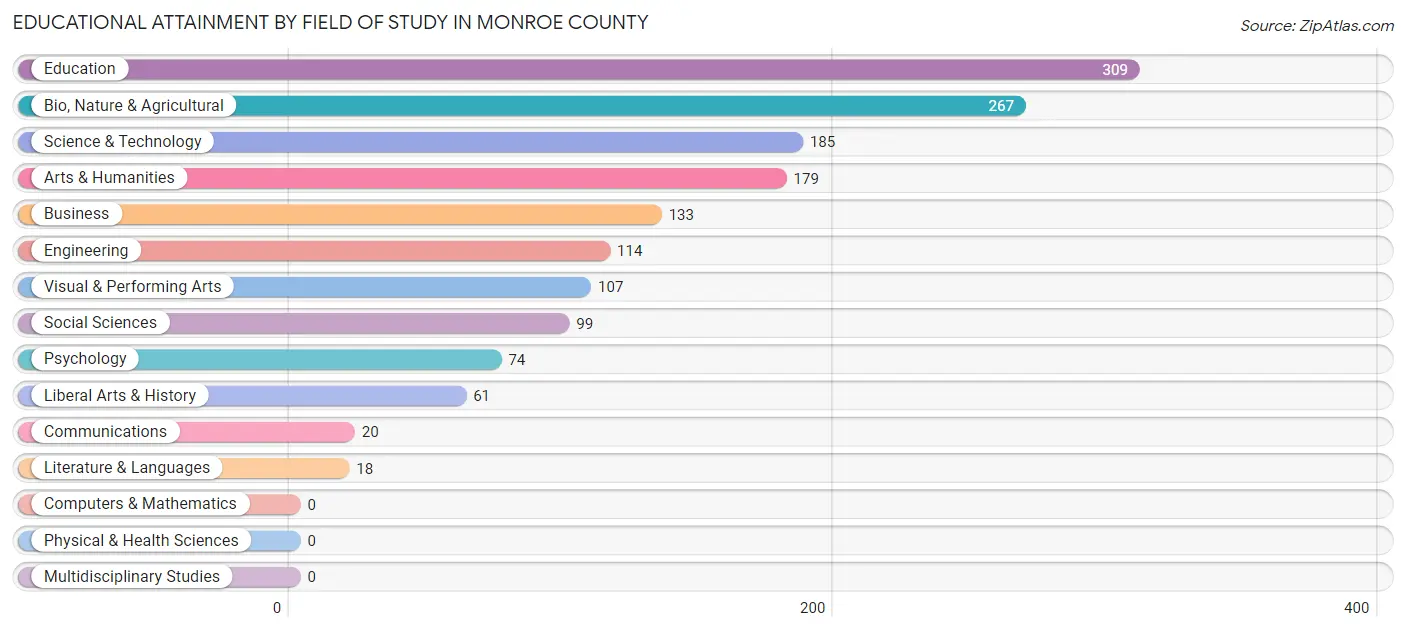
| Field of Study | # Graduates | % Graduates |
| Computers & Mathematics | 0 | 0.0% |
| Bio, Nature & Agricultural | 267 | 17.1% |
| Physical & Health Sciences | 0 | 0.0% |
| Psychology | 74 | 4.7% |
| Social Sciences | 99 | 6.3% |
| Engineering | 114 | 7.3% |
| Multidisciplinary Studies | 0 | 0.0% |
| Science & Technology | 185 | 11.8% |
| Business | 133 | 8.5% |
| Education | 309 | 19.7% |
| Literature & Languages | 18 | 1.1% |
| Liberal Arts & History | 61 | 3.9% |
| Visual & Performing Arts | 107 | 6.8% |
| Communications | 20 | 1.3% |
| Arts & Humanities | 179 | 11.4% |
| Total | 1,566 | 100.0% |
Transportation & Commute in Monroe County
Vehicle Availability by Sex in Monroe County
The most prevalent vehicle ownership categories in Monroe County are males with 3 vehicles (776, accounting for 35.5%) and females with 3 vehicles (442, making up 38.4%).
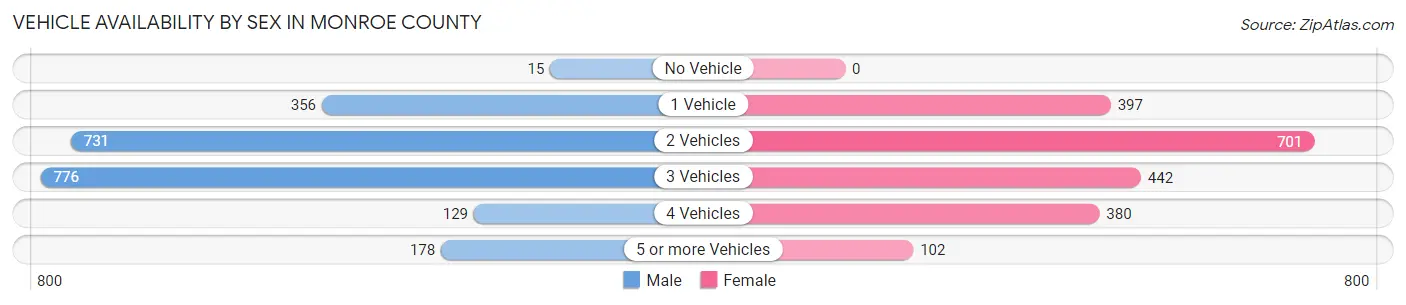
| Vehicles Available | Male | Female |
| No Vehicle | 15 (0.7%) | 0 (0.0%) |
| 1 Vehicle | 356 (16.3%) | 397 (19.6%) |
| 2 Vehicles | 731 (33.5%) | 701 (34.7%) |
| 3 Vehicles | 776 (35.5%) | 442 (21.9%) |
| 4 Vehicles | 129 (5.9%) | 380 (18.8%) |
| 5 or more Vehicles | 178 (8.2%) | 102 (5.0%) |
| Total | 2,185 (100.0%) | 2,022 (100.0%) |
Commute Time in Monroe County
The most frequently occuring commute durations in Monroe County are 60 to 89 minutes (659 commuters, 16.3%), 30 to 34 minutes (542 commuters, 13.4%), and 45 to 59 minutes (413 commuters, 10.2%).
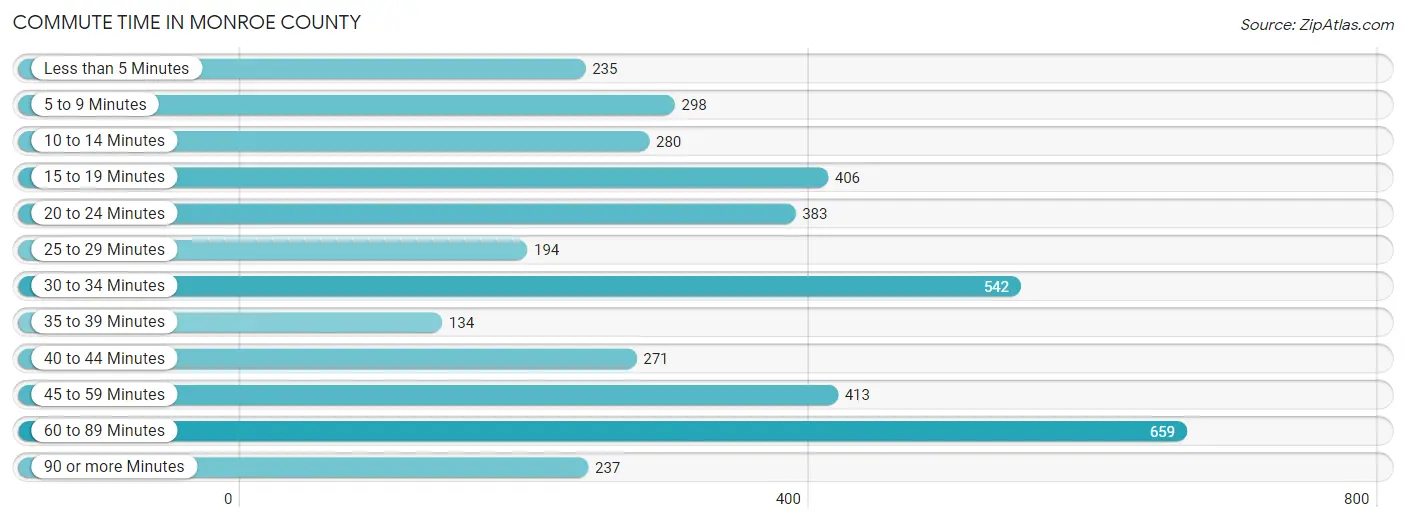
| Commute Time | # Commuters | % Commuters |
| Less than 5 Minutes | 235 | 5.8% |
| 5 to 9 Minutes | 298 | 7.3% |
| 10 to 14 Minutes | 280 | 6.9% |
| 15 to 19 Minutes | 406 | 10.0% |
| 20 to 24 Minutes | 383 | 9.5% |
| 25 to 29 Minutes | 194 | 4.8% |
| 30 to 34 Minutes | 542 | 13.4% |
| 35 to 39 Minutes | 134 | 3.3% |
| 40 to 44 Minutes | 271 | 6.7% |
| 45 to 59 Minutes | 413 | 10.2% |
| 60 to 89 Minutes | 659 | 16.3% |
| 90 or more Minutes | 237 | 5.9% |
Commute Time by Sex in Monroe County
The most common commute times in Monroe County are 30 to 34 minutes (342 commuters, 16.1%) for males and 60 to 89 minutes (426 commuters, 22.0%) for females.
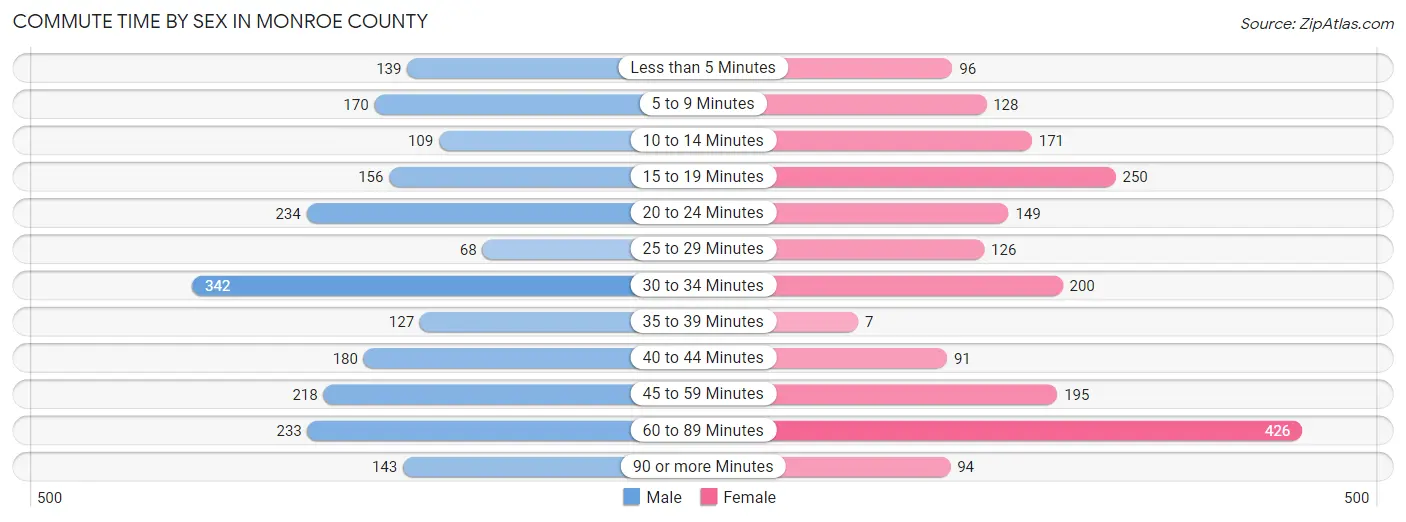
| Commute Time | Male | Female |
| Less than 5 Minutes | 139 (6.6%) | 96 (5.0%) |
| 5 to 9 Minutes | 170 (8.0%) | 128 (6.6%) |
| 10 to 14 Minutes | 109 (5.1%) | 171 (8.8%) |
| 15 to 19 Minutes | 156 (7.4%) | 250 (12.9%) |
| 20 to 24 Minutes | 234 (11.0%) | 149 (7.7%) |
| 25 to 29 Minutes | 68 (3.2%) | 126 (6.5%) |
| 30 to 34 Minutes | 342 (16.1%) | 200 (10.3%) |
| 35 to 39 Minutes | 127 (6.0%) | 7 (0.4%) |
| 40 to 44 Minutes | 180 (8.5%) | 91 (4.7%) |
| 45 to 59 Minutes | 218 (10.3%) | 195 (10.1%) |
| 60 to 89 Minutes | 233 (11.0%) | 426 (22.0%) |
| 90 or more Minutes | 143 (6.8%) | 94 (4.9%) |
Time of Departure to Work by Sex in Monroe County
The most frequent times of departure to work in Monroe County are 6:00 AM to 6:29 AM (293, 13.8%) for males and 7:00 AM to 7:29 AM (348, 18.0%) for females.
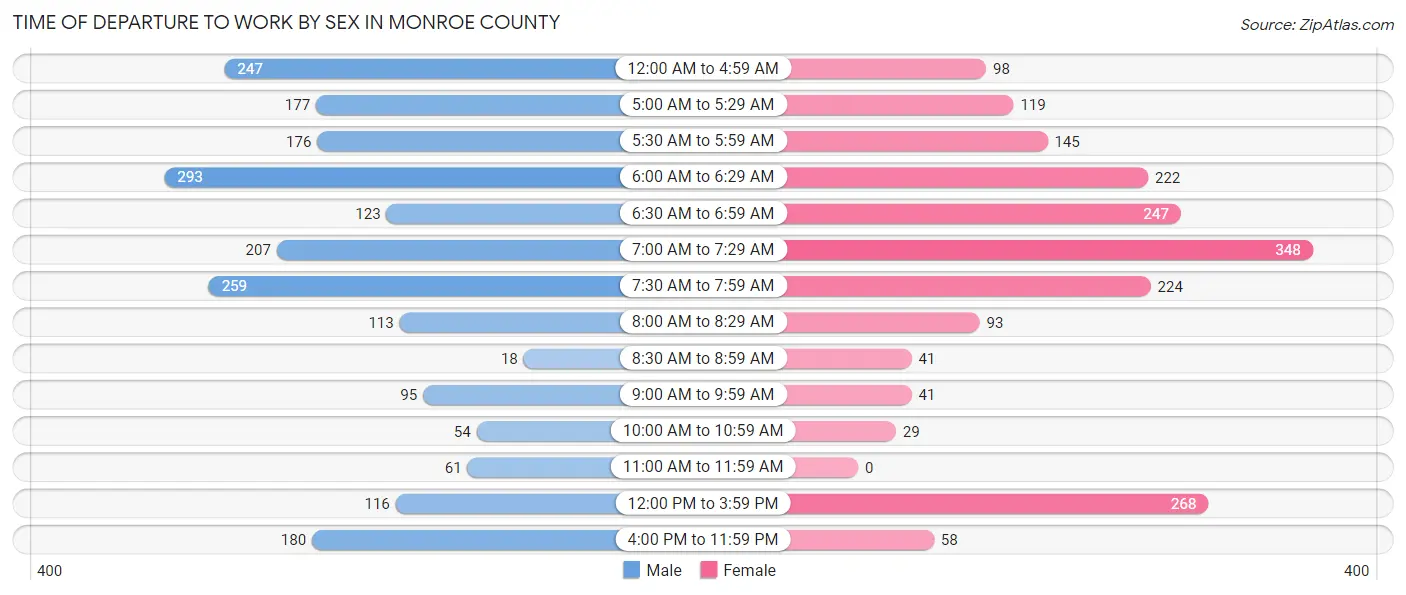
| Time of Departure | Male | Female |
| 12:00 AM to 4:59 AM | 247 (11.7%) | 98 (5.1%) |
| 5:00 AM to 5:29 AM | 177 (8.4%) | 119 (6.2%) |
| 5:30 AM to 5:59 AM | 176 (8.3%) | 145 (7.5%) |
| 6:00 AM to 6:29 AM | 293 (13.8%) | 222 (11.5%) |
| 6:30 AM to 6:59 AM | 123 (5.8%) | 247 (12.8%) |
| 7:00 AM to 7:29 AM | 207 (9.8%) | 348 (18.0%) |
| 7:30 AM to 7:59 AM | 259 (12.2%) | 224 (11.6%) |
| 8:00 AM to 8:29 AM | 113 (5.3%) | 93 (4.8%) |
| 8:30 AM to 8:59 AM | 18 (0.9%) | 41 (2.1%) |
| 9:00 AM to 9:59 AM | 95 (4.5%) | 41 (2.1%) |
| 10:00 AM to 10:59 AM | 54 (2.5%) | 29 (1.5%) |
| 11:00 AM to 11:59 AM | 61 (2.9%) | 0 (0.0%) |
| 12:00 PM to 3:59 PM | 116 (5.5%) | 268 (13.9%) |
| 4:00 PM to 11:59 PM | 180 (8.5%) | 58 (3.0%) |
| Total | 2,119 (100.0%) | 1,933 (100.0%) |
Housing Occupancy in Monroe County
Occupancy by Ownership in Monroe County
Of the total 4,596 dwellings in Monroe County, owner-occupied units account for 3,753 (81.7%), while renter-occupied units make up 843 (18.3%).
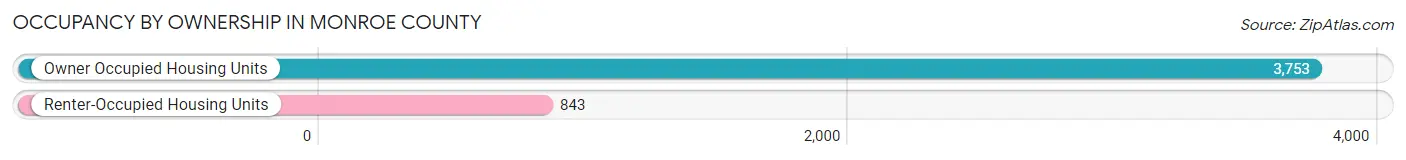
| Occupancy | # Housing Units | % Housing Units |
| Owner Occupied Housing Units | 3,753 | 81.7% |
| Renter-Occupied Housing Units | 843 | 18.3% |
| Total Occupied Housing Units | 4,596 | 100.0% |
Occupancy by Household Size in Monroe County
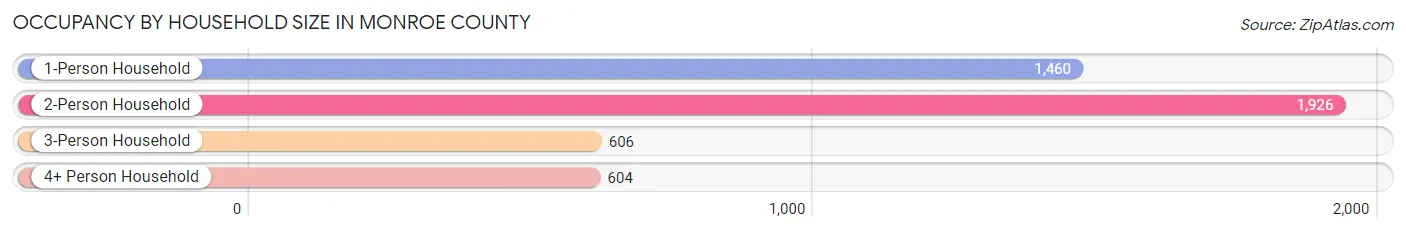
| Household Size | # Housing Units | % Housing Units |
| 1-Person Household | 1,460 | 31.8% |
| 2-Person Household | 1,926 | 41.9% |
| 3-Person Household | 606 | 13.2% |
| 4+ Person Household | 604 | 13.1% |
| Total Housing Units | 4,596 | 100.0% |
Occupancy by Ownership by Household Size in Monroe County
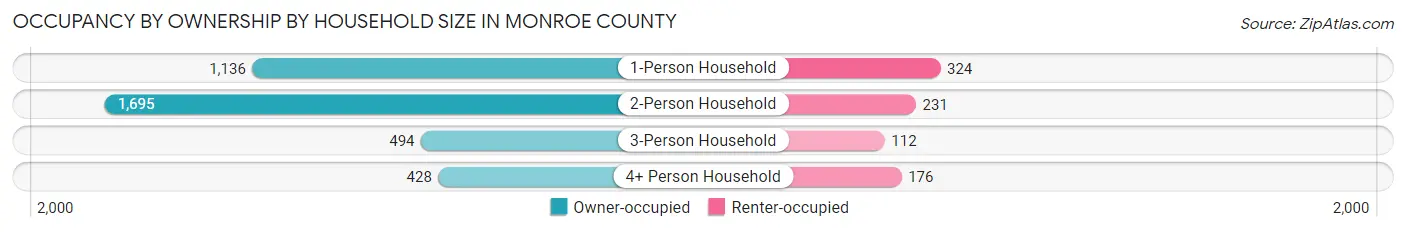
| Household Size | Owner-occupied | Renter-occupied |
| 1-Person Household | 1,136 (77.8%) | 324 (22.2%) |
| 2-Person Household | 1,695 (88.0%) | 231 (12.0%) |
| 3-Person Household | 494 (81.5%) | 112 (18.5%) |
| 4+ Person Household | 428 (70.9%) | 176 (29.1%) |
| Total Housing Units | 3,753 (81.7%) | 843 (18.3%) |
Occupancy by Educational Attainment in Monroe County
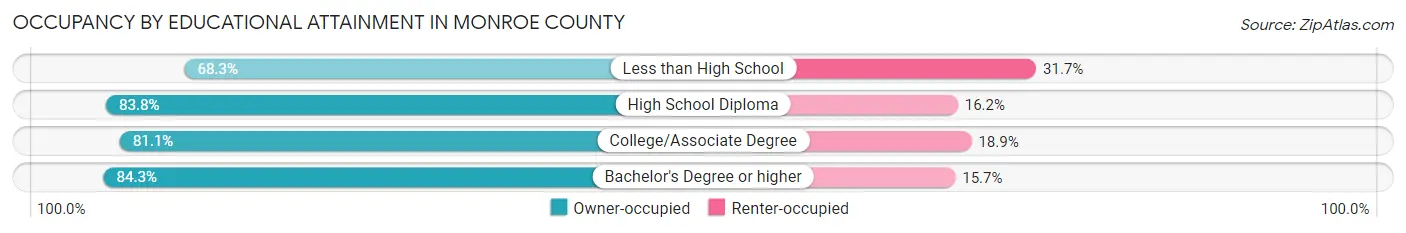
| Household Size | Owner-occupied | Renter-occupied |
| Less than High School | 338 (68.3%) | 157 (31.7%) |
| High School Diploma | 1,875 (83.8%) | 362 (16.2%) |
| College/Associate Degree | 798 (81.1%) | 186 (18.9%) |
| Bachelor's Degree or higher | 742 (84.3%) | 138 (15.7%) |
Occupancy by Age of Householder in Monroe County
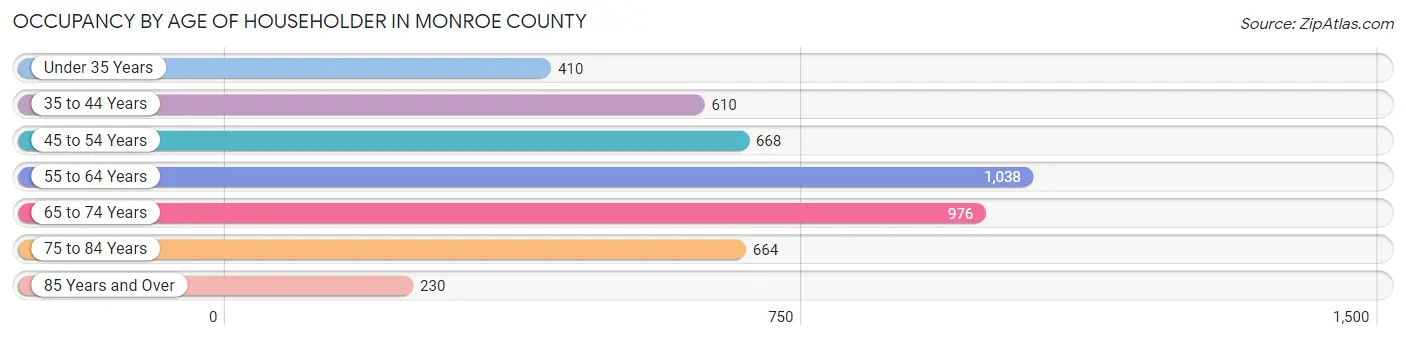
| Age Bracket | # Households | % Households |
| Under 35 Years | 410 | 8.9% |
| 35 to 44 Years | 610 | 13.3% |
| 45 to 54 Years | 668 | 14.5% |
| 55 to 64 Years | 1,038 | 22.6% |
| 65 to 74 Years | 976 | 21.2% |
| 75 to 84 Years | 664 | 14.4% |
| 85 Years and Over | 230 | 5.0% |
| Total | 4,596 | 100.0% |
Housing Finances in Monroe County
Median Income by Occupancy in Monroe County
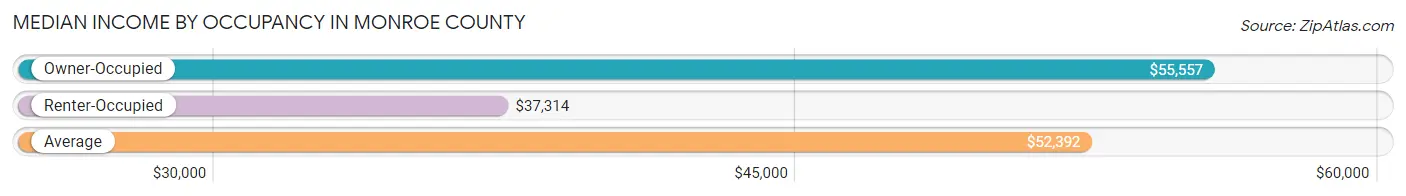
| Occupancy Type | # Households | Median Income |
| Owner-Occupied | 3,753 (81.7%) | $55,557 |
| Renter-Occupied | 843 (18.3%) | $37,314 |
| Average | 4,596 (100.0%) | $52,392 |
Occupancy by Householder Income Bracket in Monroe County
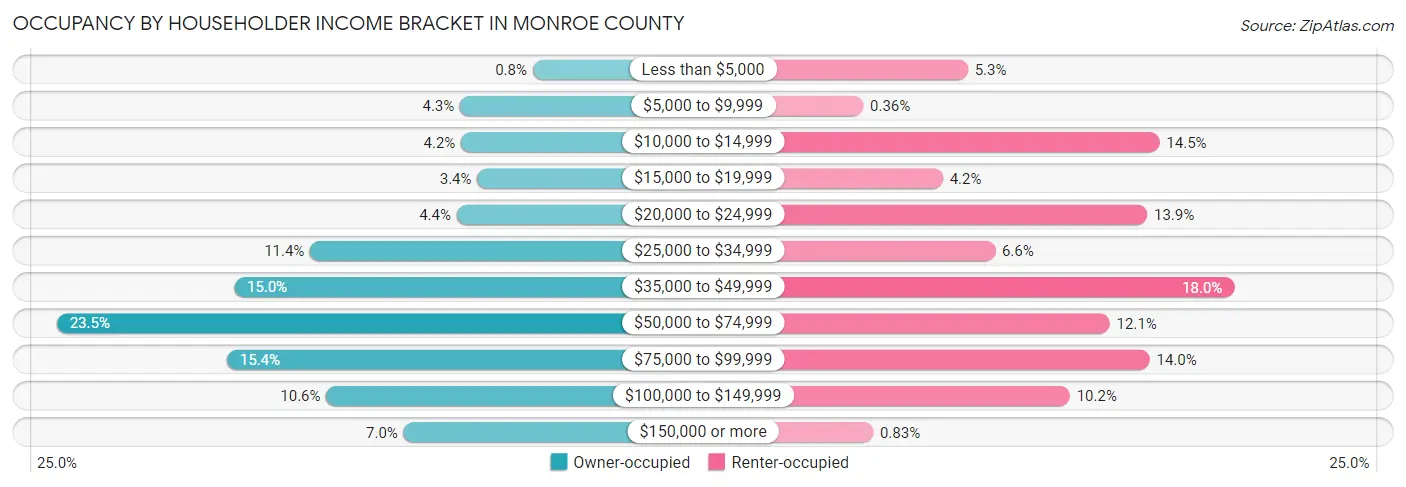
| Income Bracket | Owner-occupied | Renter-occupied |
| Less than $5,000 | 30 (0.8%) | 45 (5.3%) |
| $5,000 to $9,999 | 160 (4.3%) | 3 (0.4%) |
| $10,000 to $14,999 | 158 (4.2%) | 122 (14.5%) |
| $15,000 to $19,999 | 129 (3.4%) | 35 (4.2%) |
| $20,000 to $24,999 | 166 (4.4%) | 117 (13.9%) |
| $25,000 to $34,999 | 428 (11.4%) | 56 (6.6%) |
| $35,000 to $49,999 | 564 (15.0%) | 152 (18.0%) |
| $50,000 to $74,999 | 881 (23.5%) | 102 (12.1%) |
| $75,000 to $99,999 | 577 (15.4%) | 118 (14.0%) |
| $100,000 to $149,999 | 399 (10.6%) | 86 (10.2%) |
| $150,000 or more | 261 (7.0%) | 7 (0.8%) |
| Total | 3,753 (100.0%) | 843 (100.0%) |
Monthly Housing Cost Tiers in Monroe County
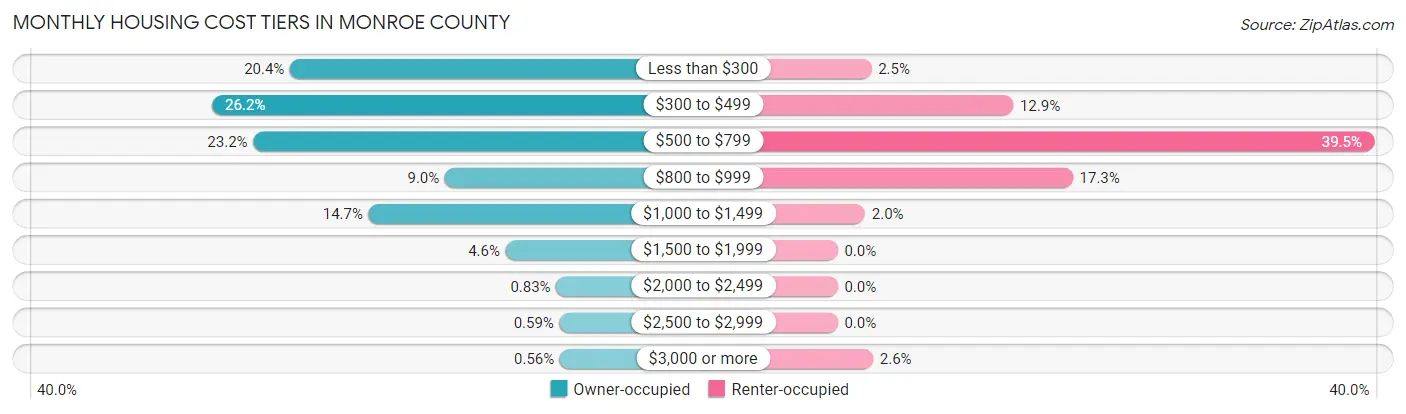
| Monthly Cost | Owner-occupied | Renter-occupied |
| Less than $300 | 767 (20.4%) | 21 (2.5%) |
| $300 to $499 | 983 (26.2%) | 109 (12.9%) |
| $500 to $799 | 869 (23.2%) | 333 (39.5%) |
| $800 to $999 | 339 (9.0%) | 146 (17.3%) |
| $1,000 to $1,499 | 550 (14.6%) | 17 (2.0%) |
| $1,500 to $1,999 | 171 (4.6%) | 0 (0.0%) |
| $2,000 to $2,499 | 31 (0.8%) | 0 (0.0%) |
| $2,500 to $2,999 | 22 (0.6%) | 0 (0.0%) |
| $3,000 or more | 21 (0.6%) | 22 (2.6%) |
| Total | 3,753 (100.0%) | 843 (100.0%) |
Physical Housing Characteristics in Monroe County
Housing Structures in Monroe County
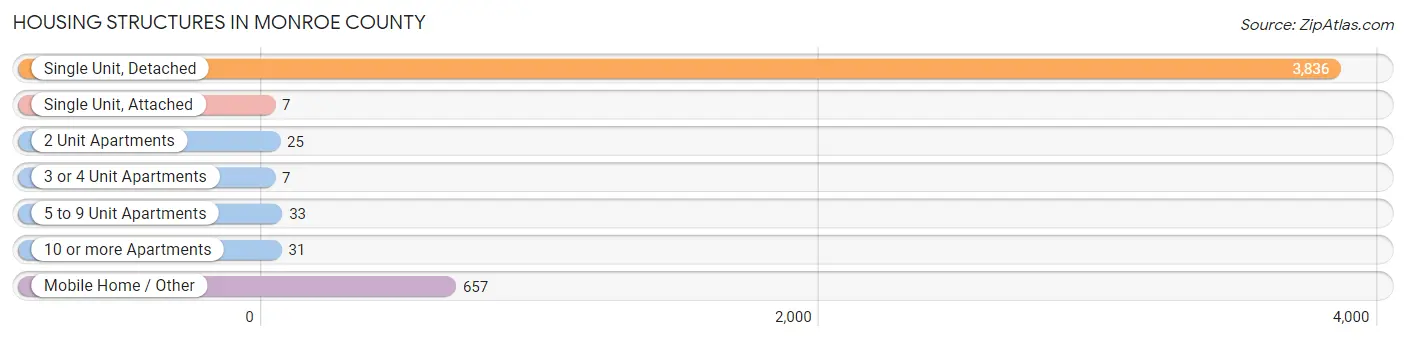
| Structure Type | # Housing Units | % Housing Units |
| Single Unit, Detached | 3,836 | 83.5% |
| Single Unit, Attached | 7 | 0.2% |
| 2 Unit Apartments | 25 | 0.5% |
| 3 or 4 Unit Apartments | 7 | 0.2% |
| 5 to 9 Unit Apartments | 33 | 0.7% |
| 10 or more Apartments | 31 | 0.7% |
| Mobile Home / Other | 657 | 14.3% |
| Total | 4,596 | 100.0% |
Housing Structures by Occupancy in Monroe County
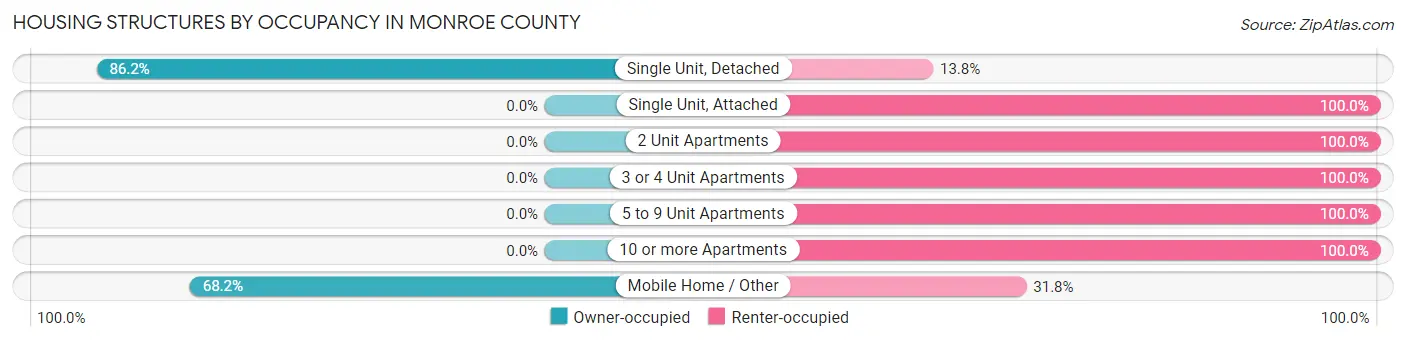
| Structure Type | Owner-occupied | Renter-occupied |
| Single Unit, Detached | 3,305 (86.2%) | 531 (13.8%) |
| Single Unit, Attached | 0 (0.0%) | 7 (100.0%) |
| 2 Unit Apartments | 0 (0.0%) | 25 (100.0%) |
| 3 or 4 Unit Apartments | 0 (0.0%) | 7 (100.0%) |
| 5 to 9 Unit Apartments | 0 (0.0%) | 33 (100.0%) |
| 10 or more Apartments | 0 (0.0%) | 31 (100.0%) |
| Mobile Home / Other | 448 (68.2%) | 209 (31.8%) |
| Total | 3,753 (81.7%) | 843 (18.3%) |
Housing Structures by Number of Rooms in Monroe County
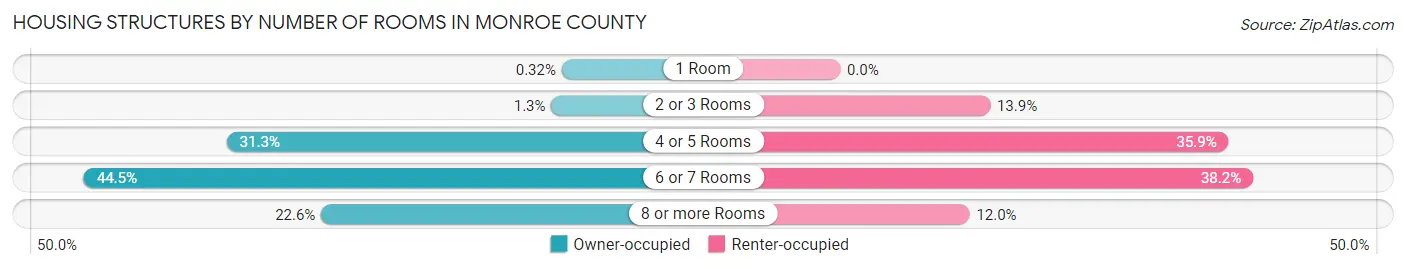
| Number of Rooms | Owner-occupied | Renter-occupied |
| 1 Room | 12 (0.3%) | 0 (0.0%) |
| 2 or 3 Rooms | 48 (1.3%) | 117 (13.9%) |
| 4 or 5 Rooms | 1,175 (31.3%) | 303 (35.9%) |
| 6 or 7 Rooms | 1,671 (44.5%) | 322 (38.2%) |
| 8 or more Rooms | 847 (22.6%) | 101 (12.0%) |
| Total | 3,753 (100.0%) | 843 (100.0%) |
Housing Structure by Heating Type in Monroe County
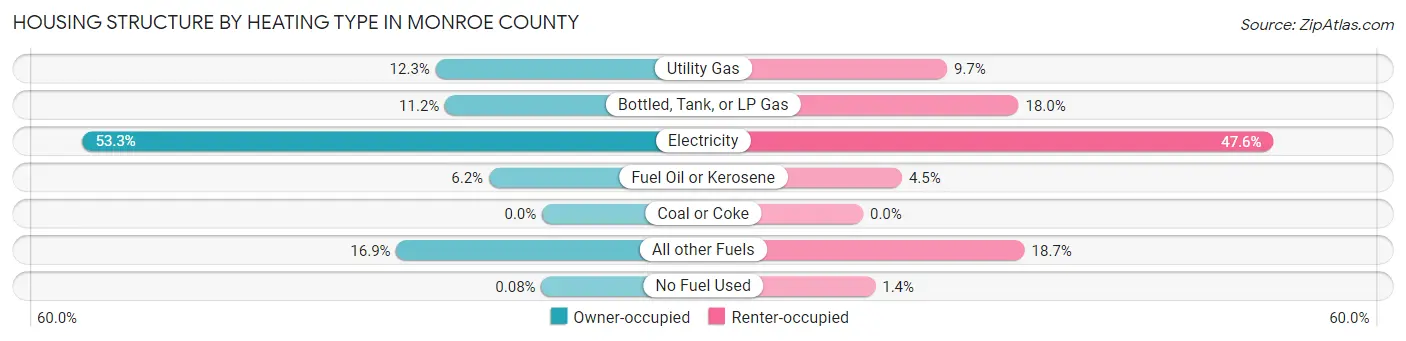
| Heating Type | Owner-occupied | Renter-occupied |
| Utility Gas | 463 (12.3%) | 82 (9.7%) |
| Bottled, Tank, or LP Gas | 422 (11.2%) | 152 (18.0%) |
| Electricity | 2,000 (53.3%) | 401 (47.6%) |
| Fuel Oil or Kerosene | 231 (6.2%) | 38 (4.5%) |
| Coal or Coke | 0 (0.0%) | 0 (0.0%) |
| All other Fuels | 634 (16.9%) | 158 (18.7%) |
| No Fuel Used | 3 (0.1%) | 12 (1.4%) |
| Total | 3,753 (100.0%) | 843 (100.0%) |
Household Vehicle Usage in Monroe County

| Vehicles per Household | Owner-occupied | Renter-occupied |
| No Vehicle | 216 (5.8%) | 85 (10.1%) |
| 1 Vehicle | 1,020 (27.2%) | 400 (47.4%) |
| 2 Vehicles | 1,338 (35.6%) | 211 (25.0%) |
| 3 or more Vehicles | 1,179 (31.4%) | 147 (17.4%) |
| Total | 3,753 (100.0%) | 843 (100.0%) |
Real Estate & Mortgages in Monroe County
Real Estate and Mortgage Overview in Monroe County
| Characteristic | Without Mortgage | With Mortgage |
| Housing Units | 2,187 | 1,566 |
| Median Property Value | $156,600 | $122,200 |
| Median Household Income | $43,477 | $204 |
| Monthly Housing Costs | $381 | $10 |
| Real Estate Taxes | $606 | $36 |
Property Value by Mortgage Status in Monroe County
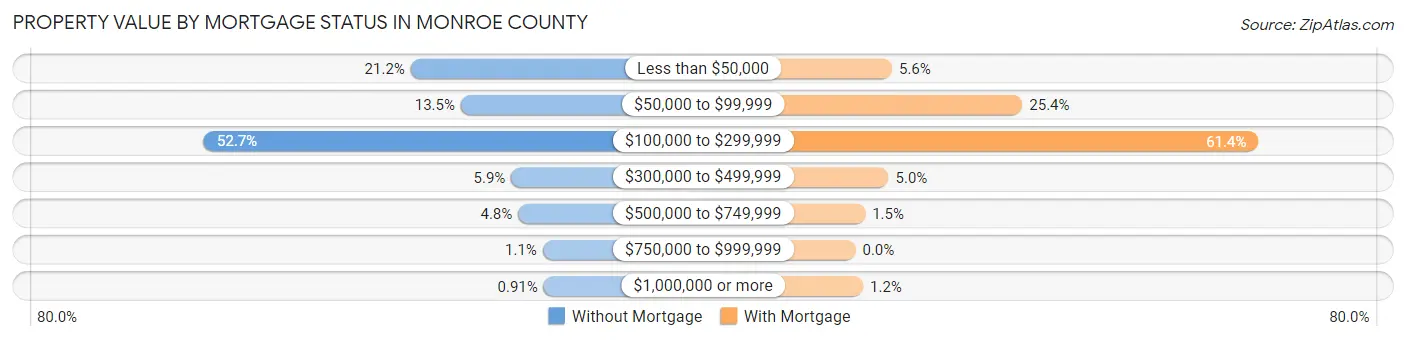
| Property Value | Without Mortgage | With Mortgage |
| Less than $50,000 | 463 (21.2%) | 87 (5.6%) |
| $50,000 to $99,999 | 296 (13.5%) | 398 (25.4%) |
| $100,000 to $299,999 | 1,152 (52.7%) | 961 (61.4%) |
| $300,000 to $499,999 | 128 (5.9%) | 79 (5.0%) |
| $500,000 to $749,999 | 105 (4.8%) | 23 (1.5%) |
| $750,000 to $999,999 | 23 (1.1%) | 0 (0.0%) |
| $1,000,000 or more | 20 (0.9%) | 18 (1.1%) |
| Total | 2,187 (100.0%) | 1,566 (100.0%) |
Household Income by Mortgage Status in Monroe County
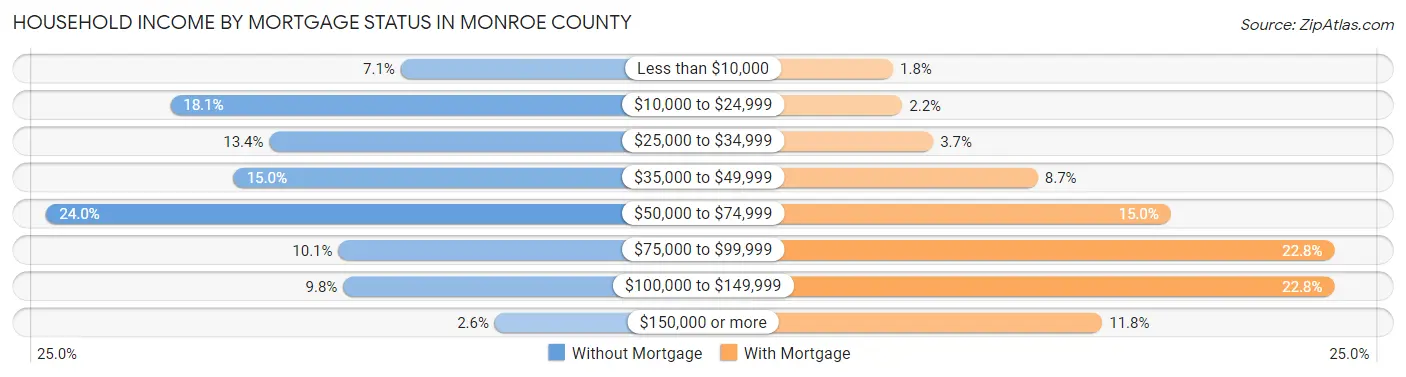
| Household Income | Without Mortgage | With Mortgage |
| Less than $10,000 | 155 (7.1%) | 28 (1.8%) |
| $10,000 to $24,999 | 395 (18.1%) | 35 (2.2%) |
| $25,000 to $34,999 | 292 (13.4%) | 58 (3.7%) |
| $35,000 to $49,999 | 329 (15.0%) | 136 (8.7%) |
| $50,000 to $74,999 | 524 (24.0%) | 235 (15.0%) |
| $75,000 to $99,999 | 220 (10.1%) | 357 (22.8%) |
| $100,000 to $149,999 | 215 (9.8%) | 357 (22.8%) |
| $150,000 or more | 57 (2.6%) | 184 (11.7%) |
| Total | 2,187 (100.0%) | 1,566 (100.0%) |
Property Value to Household Income Ratio in Monroe County
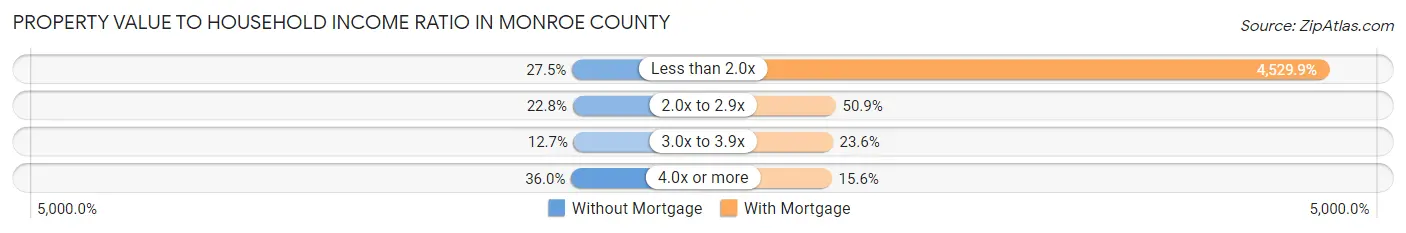
| Value-to-Income Ratio | Without Mortgage | With Mortgage |
| Less than 2.0x | 602 (27.5%) | 70,938 (4,529.9%) |
| 2.0x to 2.9x | 498 (22.8%) | 797 (50.9%) |
| 3.0x to 3.9x | 277 (12.7%) | 369 (23.6%) |
| 4.0x or more | 788 (36.0%) | 245 (15.6%) |
| Total | 2,187 (100.0%) | 1,566 (100.0%) |
Real Estate Taxes by Mortgage Status in Monroe County
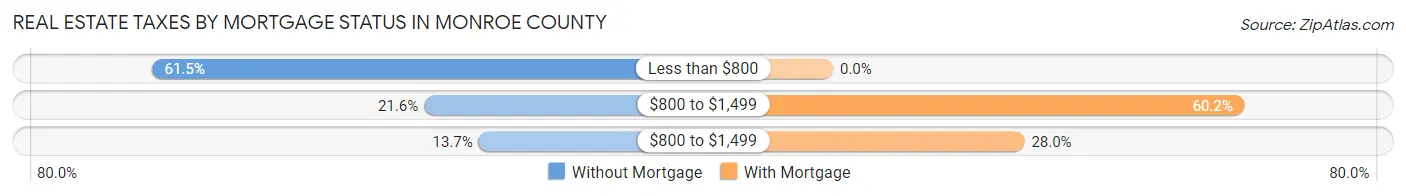
| Property Taxes | Without Mortgage | With Mortgage |
| Less than $800 | 1,344 (61.5%) | 0 (0.0%) |
| $800 to $1,499 | 473 (21.6%) | 942 (60.2%) |
| $800 to $1,499 | 299 (13.7%) | 438 (28.0%) |
| Total | 2,187 (100.0%) | 1,566 (100.0%) |
Health & Disability in Monroe County
Health Insurance Coverage by Age in Monroe County
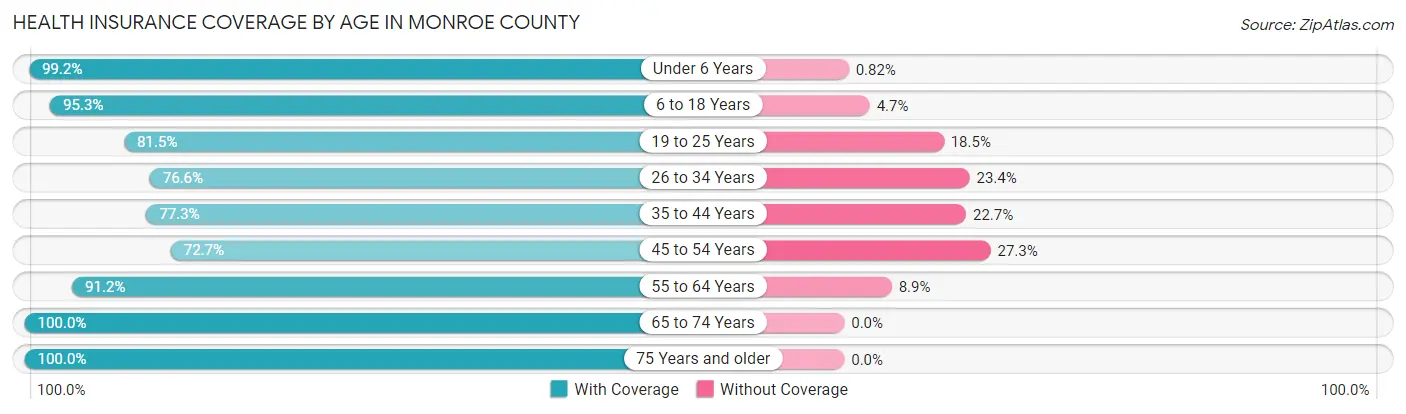
| Age Bracket | With Coverage | Without Coverage |
| Under 6 Years | 845 (99.2%) | 7 (0.8%) |
| 6 to 18 Years | 1,868 (95.3%) | 93 (4.7%) |
| 19 to 25 Years | 738 (81.5%) | 168 (18.5%) |
| 26 to 34 Years | 738 (76.6%) | 225 (23.4%) |
| 35 to 44 Years | 1,018 (77.3%) | 299 (22.7%) |
| 45 to 54 Years | 1,123 (72.7%) | 421 (27.3%) |
| 55 to 64 Years | 1,678 (91.1%) | 163 (8.8%) |
| 65 to 74 Years | 1,739 (100.0%) | 0 (0.0%) |
| 75 Years and older | 1,246 (100.0%) | 0 (0.0%) |
| Total | 10,993 (88.9%) | 1,376 (11.1%) |
Health Insurance Coverage by Citizenship Status in Monroe County
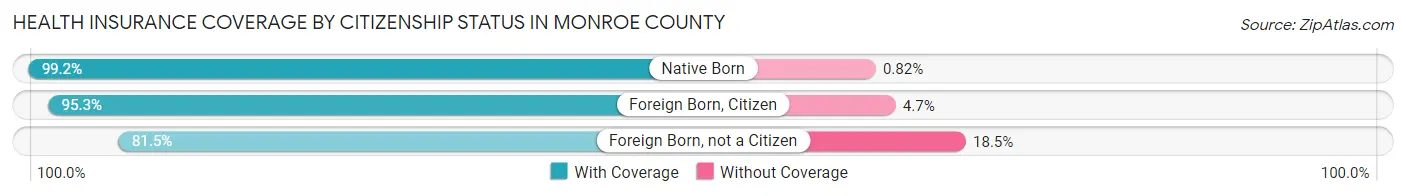
| Citizenship Status | With Coverage | Without Coverage |
| Native Born | 845 (99.2%) | 7 (0.8%) |
| Foreign Born, Citizen | 1,868 (95.3%) | 93 (4.7%) |
| Foreign Born, not a Citizen | 738 (81.5%) | 168 (18.5%) |
Health Insurance Coverage by Household Income in Monroe County
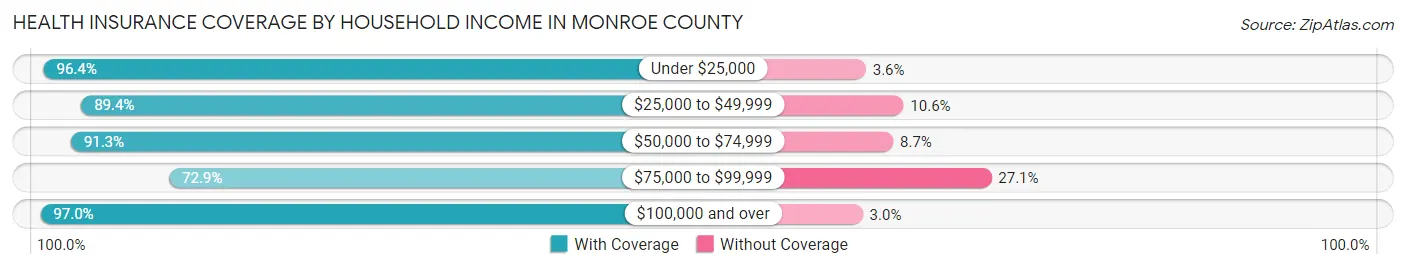
| Household Income | With Coverage | Without Coverage |
| Under $25,000 | 1,682 (96.4%) | 62 (3.6%) |
| $25,000 to $49,999 | 2,552 (89.4%) | 303 (10.6%) |
| $50,000 to $74,999 | 2,528 (91.3%) | 240 (8.7%) |
| $75,000 to $99,999 | 1,877 (72.9%) | 697 (27.1%) |
| $100,000 and over | 2,352 (97.0%) | 72 (3.0%) |
Public vs Private Health Insurance Coverage by Age in Monroe County
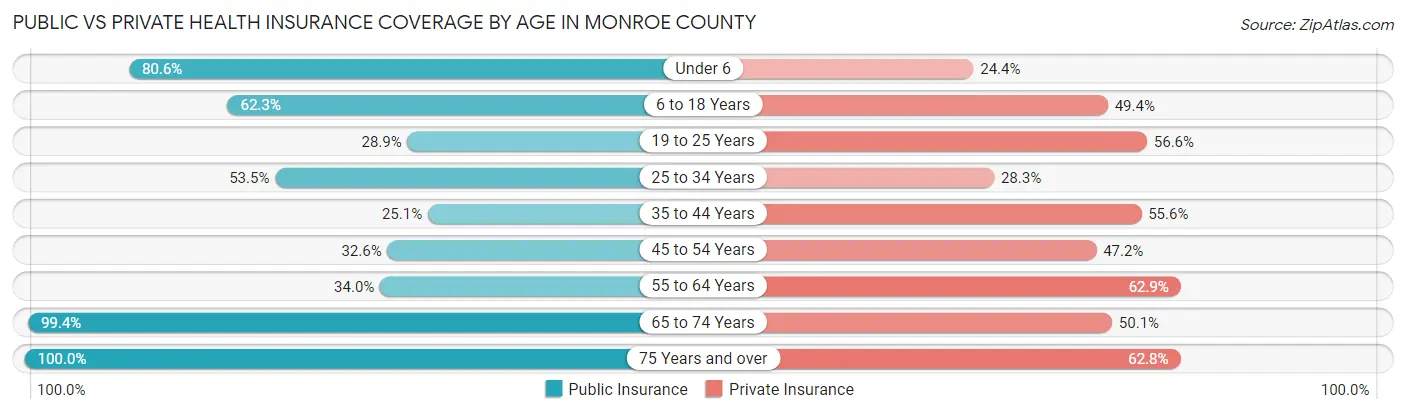
| Age Bracket | Public Insurance | Private Insurance |
| Under 6 | 687 (80.6%) | 208 (24.4%) |
| 6 to 18 Years | 1,222 (62.3%) | 968 (49.4%) |
| 19 to 25 Years | 262 (28.9%) | 513 (56.6%) |
| 25 to 34 Years | 515 (53.5%) | 272 (28.2%) |
| 35 to 44 Years | 331 (25.1%) | 732 (55.6%) |
| 45 to 54 Years | 504 (32.6%) | 729 (47.2%) |
| 55 to 64 Years | 626 (34.0%) | 1,158 (62.9%) |
| 65 to 74 Years | 1,728 (99.4%) | 872 (50.1%) |
| 75 Years and over | 1,246 (100.0%) | 783 (62.8%) |
| Total | 7,121 (57.6%) | 6,235 (50.4%) |
Disability Status by Sex by Age in Monroe County

| Age Bracket | Male | Female |
| Under 5 Years | 0 (0.0%) | 0 (0.0%) |
| 5 to 17 Years | 140 (15.5%) | 82 (8.0%) |
| 18 to 34 Years | 127 (11.2%) | 159 (15.5%) |
| 35 to 64 Years | 689 (28.6%) | 413 (18.0%) |
| 65 to 74 Years | 289 (34.4%) | 245 (27.3%) |
| 75 Years and over | 362 (60.0%) | 369 (57.4%) |
Disability Class by Sex by Age in Monroe County
Disability Class: Hearing Difficulty
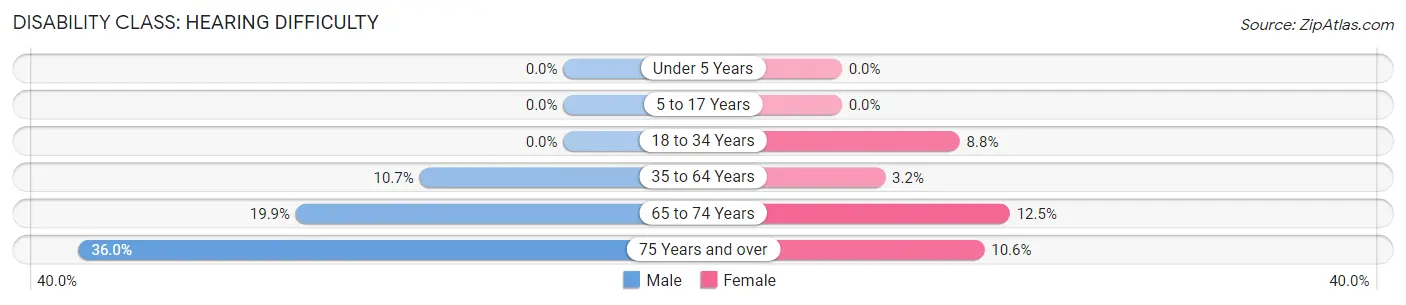
| Age Bracket | Male | Female |
| Under 5 Years | 0 (0.0%) | 0 (0.0%) |
| 5 to 17 Years | 0 (0.0%) | 0 (0.0%) |
| 18 to 34 Years | 0 (0.0%) | 90 (8.7%) |
| 35 to 64 Years | 257 (10.7%) | 74 (3.2%) |
| 65 to 74 Years | 167 (19.9%) | 112 (12.5%) |
| 75 Years and over | 217 (36.0%) | 68 (10.6%) |
Disability Class: Vision Difficulty
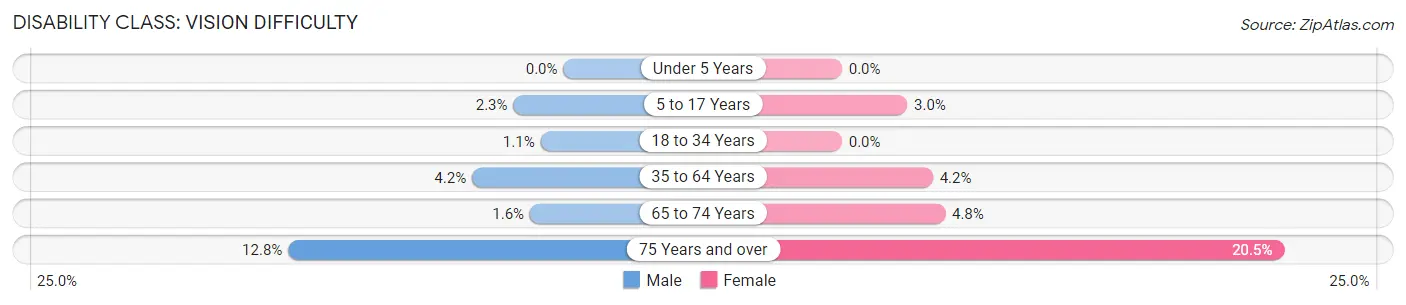
| Age Bracket | Male | Female |
| Under 5 Years | 0 (0.0%) | 0 (0.0%) |
| 5 to 17 Years | 21 (2.3%) | 31 (3.0%) |
| 18 to 34 Years | 12 (1.1%) | 0 (0.0%) |
| 35 to 64 Years | 102 (4.2%) | 97 (4.2%) |
| 65 to 74 Years | 13 (1.5%) | 43 (4.8%) |
| 75 Years and over | 77 (12.8%) | 132 (20.5%) |
Disability Class: Cognitive Difficulty
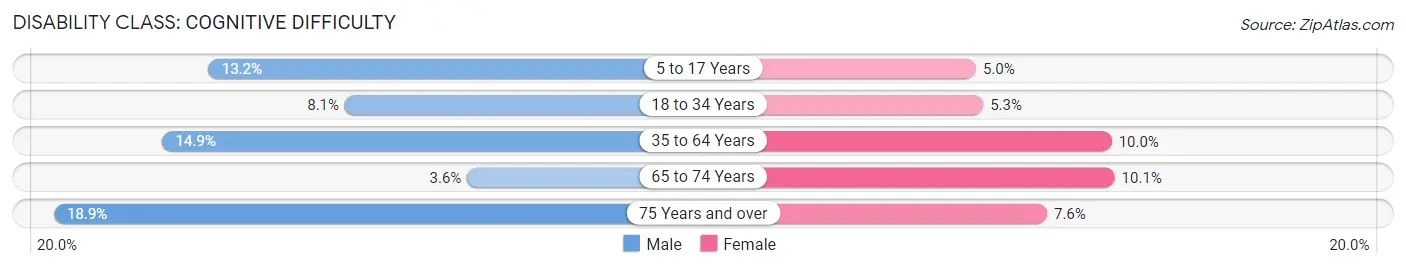
| Age Bracket | Male | Female |
| 5 to 17 Years | 119 (13.2%) | 51 (5.0%) |
| 18 to 34 Years | 92 (8.1%) | 54 (5.2%) |
| 35 to 64 Years | 358 (14.9%) | 230 (10.0%) |
| 65 to 74 Years | 30 (3.6%) | 91 (10.1%) |
| 75 Years and over | 114 (18.9%) | 49 (7.6%) |
Disability Class: Ambulatory Difficulty
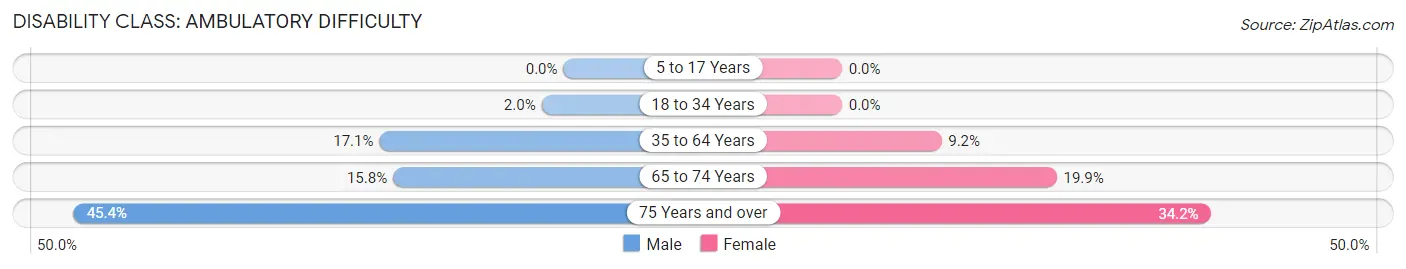
| Age Bracket | Male | Female |
| 5 to 17 Years | 0 (0.0%) | 0 (0.0%) |
| 18 to 34 Years | 23 (2.0%) | 0 (0.0%) |
| 35 to 64 Years | 411 (17.1%) | 212 (9.2%) |
| 65 to 74 Years | 133 (15.8%) | 179 (19.9%) |
| 75 Years and over | 274 (45.4%) | 220 (34.2%) |
Disability Class: Self-Care Difficulty
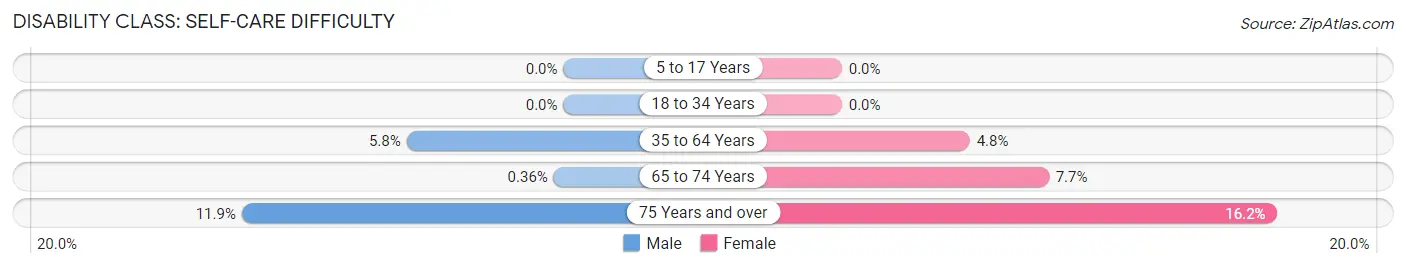
| Age Bracket | Male | Female |
| 5 to 17 Years | 0 (0.0%) | 0 (0.0%) |
| 18 to 34 Years | 0 (0.0%) | 0 (0.0%) |
| 35 to 64 Years | 140 (5.8%) | 109 (4.8%) |
| 65 to 74 Years | 3 (0.4%) | 69 (7.7%) |
| 75 Years and over | 72 (11.9%) | 104 (16.2%) |
Technology Access in Monroe County
Computing Device Access in Monroe County
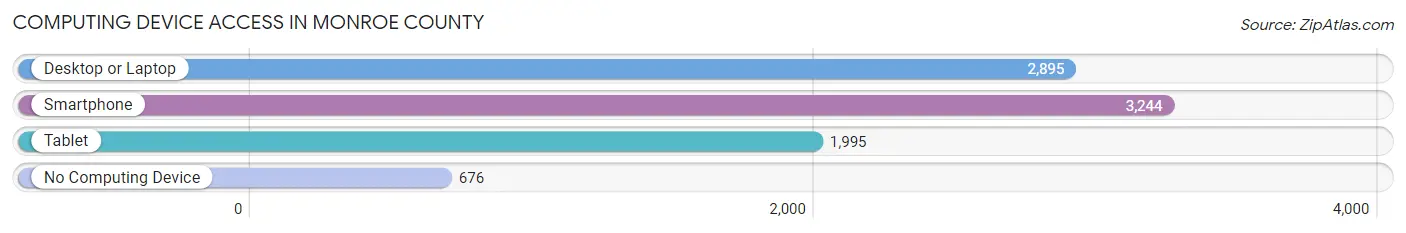
| Device Type | # Households | % Households |
| Desktop or Laptop | 2,895 | 63.0% |
| Smartphone | 3,244 | 70.6% |
| Tablet | 1,995 | 43.4% |
| No Computing Device | 676 | 14.7% |
| Total | 4,596 | 100.0% |
Internet Access in Monroe County
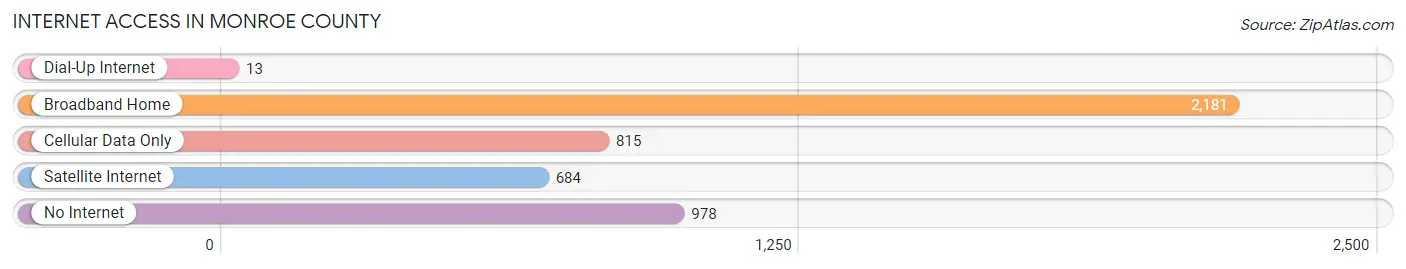
| Internet Type | # Households | % Households |
| Dial-Up Internet | 13 | 0.3% |
| Broadband Home | 2,181 | 47.4% |
| Cellular Data Only | 815 | 17.7% |
| Satellite Internet | 684 | 14.9% |
| No Internet | 978 | 21.3% |
| Total | 4,596 | 100.0% |
Monroe County Summary
Monroe County, West Virginia is located in the southeastern part of the state and is part of the Appalachian region. It is bordered by Greenbrier County to the north, Summers County to the east, Mercer County to the south, and Giles County, Virginia to the west. The county seat is Union, and the county was created in 1799 from parts of Greenbrier and Giles counties.
Geography
Monroe County is located in the Appalachian Mountains and is part of the Allegheny Plateau. The county is mostly mountainous, with the highest point being the summit of Peters Mountain at 4,072 feet. The county is drained by the Greenbrier River, which flows through the county from north to south. The county also contains several smaller streams, including the Wolf Creek, Indian Creek, and the Little Wolf Creek. The county is mostly forested, with the majority of the land being used for timber production.
Economy
The economy of Monroe County is largely based on agriculture and timber production. The county is home to several large farms, and the county is also home to several large timber companies. The county also has a large tourism industry, with many visitors coming to the area to enjoy the natural beauty of the Appalachian Mountains.
Demographics
As of the 2010 census, Monroe County had a population of 13,502. The population was spread out with a median age of 43.7 years. The racial makeup of the county was 97.2% White, 0.7% African American, 0.2% Native American, 0.2% Asian, 0.1% Pacific Islander, 0.3% from other races, and 1.3% from two or more races. Hispanic or Latino of any race were 0.9% of the population.
The median income for a household in the county was $30,945, and the median income for a family was $37,917. The per capita income for the county was $17,845. About 16.2% of families and 20.2% of the population were below the poverty line, including 28.2% of those under age 18 and 11.2% of those age 65 or over.
Conclusion
Monroe County, West Virginia is a rural county located in the Appalachian Mountains. The county is largely agricultural and timber-based, and the county also has a large tourism industry. The population of the county is mostly white, with a median age of 43.7 years. The median income for a household in the county is $30,945, and the per capita income is $17,845. The county has a poverty rate of 16.2%, with 28.2% of those under the age of 18 living in poverty.
Common Questions
What is Per Capita Income in Monroe County?
Per Capita income in Monroe County is $26,120.
What is the Median Family Income in Monroe County?
Median Family Income in Monroe County is $65,034.
What is the Median Household income in Monroe County?
Median Household Income in Monroe County is $52,392.
What is Income or Wage Gap in Monroe County?
Income or Wage Gap in Monroe County is 30.5%.
Women in Monroe County earn 69.5 cents for every dollar earned by a man.
What is Family Income Deficit in Monroe County?
Family Income Deficit in Monroe County is $9,019.
Families that are below poverty line in Monroe County earn $9,019 less on average than the poverty threshold level.
What is Inequality or Gini Index in Monroe County?
Inequality or Gini Index in Monroe County is 0.40.
What is the Total Population of Monroe County?
Total Population of Monroe County is 12,438.
What is the Total Male Population of Monroe County?
Total Male Population of Monroe County is 6,210.
What is the Total Female Population of Monroe County?
Total Female Population of Monroe County is 6,228.
What is the Ratio of Males per 100 Females in Monroe County?
There are 99.71 Males per 100 Females in Monroe County.
What is the Ratio of Females per 100 Males in Monroe County?
There are 100.29 Females per 100 Males in Monroe County.
What is the Median Population Age in Monroe County?
Median Population Age in Monroe County is 45.9 Years.
What is the Average Family Size in Monroe County
Average Family Size in Monroe County is 3.4 People.
What is the Average Household Size in Monroe County
Average Household Size in Monroe County is 2.7 People.
How Large is the Labor Force in Monroe County?
There are 5,183 People in the Labor Forcein in Monroe County.
What is the Percentage of People in the Labor Force in Monroe County?
50.6% of People are in the Labor Force in Monroe County.
What is the Unemployment Rate in Monroe County?
Unemployment Rate in Monroe County is 10.6%.