Zip Codes with the Highest Percentage of Population Employed in Community & Social Service in Richland, WA
RELATED REPORTS & OPTIONS
Community & Social Service
Richland
Compare Zip Codes
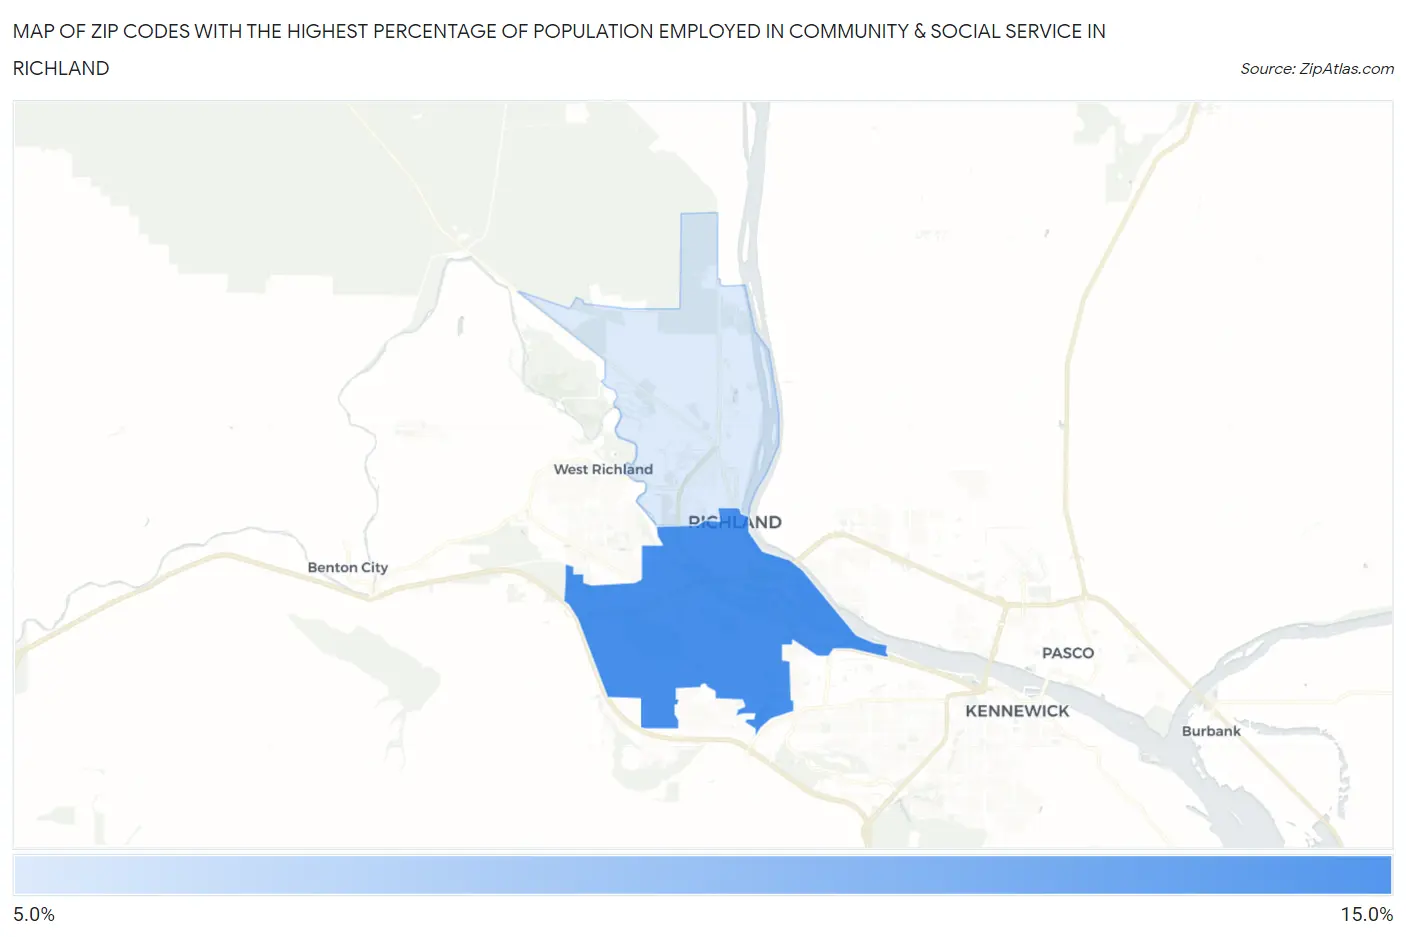
Map of Zip Codes with the Highest Percentage of Population Employed in Community & Social Service in Richland
10.4%
12.6%
Zip Codes with the Highest Percentage of Population Employed in Community & Social Service in Richland, WA
| Zip Code | % Employed | vs State | vs National | |
| 1. | 99352 | 12.6% | 10.7%(+1.91)#177 | 11.2%(+1.41)#8,201 |
| 2. | 99354 | 10.4% | 10.7%(-0.348)#270 | 11.2%(-0.845)#13,183 |
1
Common Questions
What are the Top Zip Codes with the Highest Percentage of Population Employed in Community & Social Service in Richland, WA?
Top Zip Codes with the Highest Percentage of Population Employed in Community & Social Service in Richland, WA are:
What zip code has the Highest Percentage of Population Employed in Community & Social Service in Richland, WA?
99352 has the Highest Percentage of Population Employed in Community & Social Service in Richland, WA with 12.6%.
What is the Percentage of Population Employed in Community & Social Service in Richland, WA?
Percentage of Population Employed in Community & Social Service in Richland is 11.8%.
What is the Percentage of Population Employed in Community & Social Service in Washington?
Percentage of Population Employed in Community & Social Service in Washington is 10.7%.
What is the Percentage of Population Employed in Community & Social Service in the United States?
Percentage of Population Employed in Community & Social Service in the United States is 11.2%.