West Indian vs White/Caucasian 1 or more Vehicles in Household
COMPARE
West Indian
White/Caucasian
1 or more Vehicles in Household
1 or more Vehicles in Household Comparison
West Indians
Whites/Caucasians
76.4%
1 OR MORE VEHICLES IN HOUSEHOLD
0.0/ 100
METRIC RATING
331st/ 347
METRIC RANK
93.1%
1 OR MORE VEHICLES IN HOUSEHOLD
100.0/ 100
METRIC RATING
13th/ 347
METRIC RANK
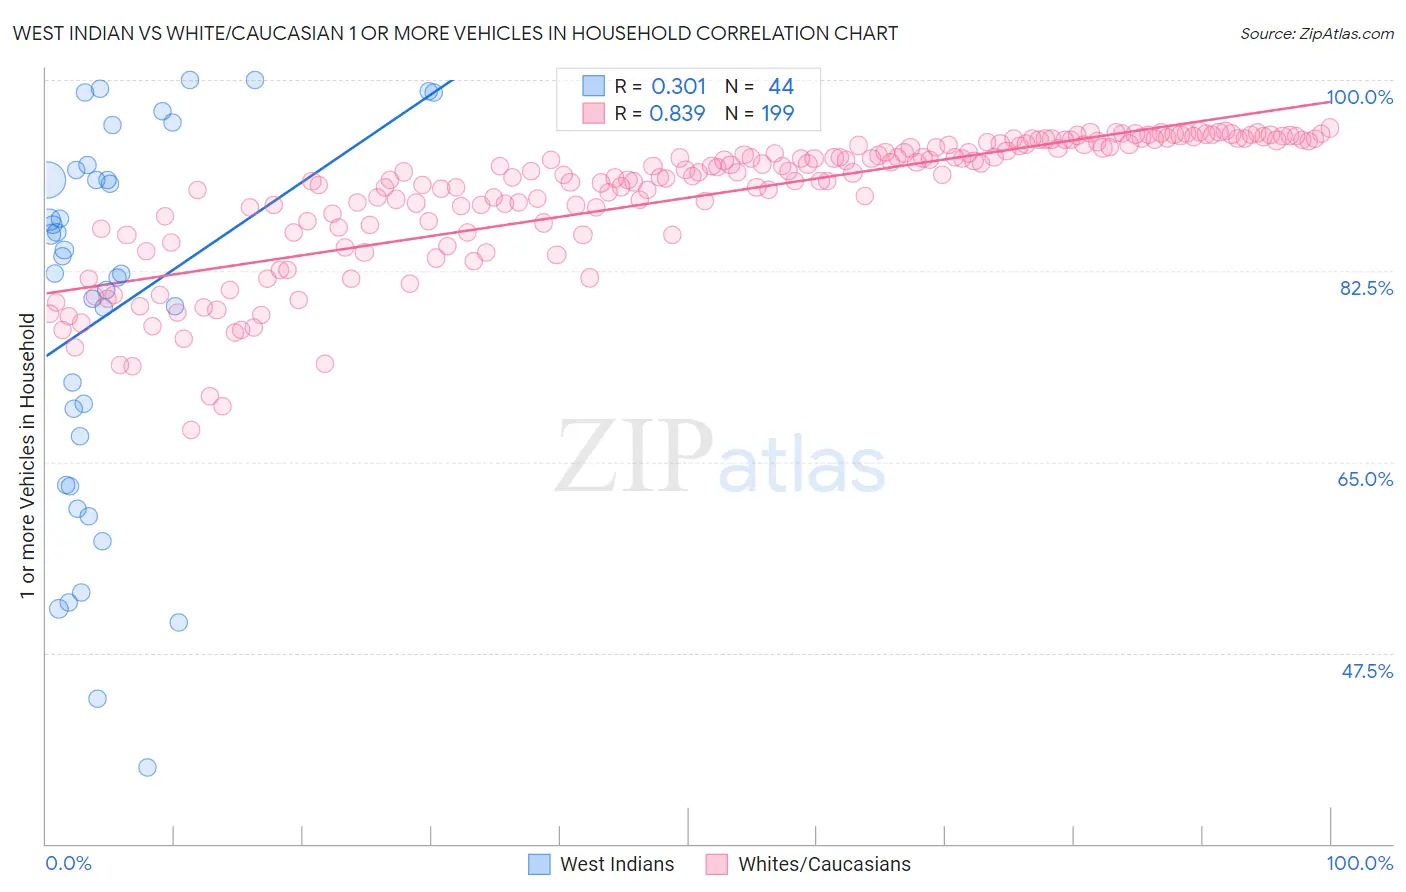
West Indian vs White/Caucasian 1 or more Vehicles in Household Correlation Chart
The statistical analysis conducted on geographies consisting of 253,892,207 people shows a mild positive correlation between the proportion of West Indians and percentage of households with 1 or more vehicles available in the United States with a correlation coefficient (R) of 0.301 and weighted average of 76.4%. Similarly, the statistical analysis conducted on geographies consisting of 571,958,607 people shows a very strong positive correlation between the proportion of Whites/Caucasians and percentage of households with 1 or more vehicles available in the United States with a correlation coefficient (R) of 0.839 and weighted average of 93.1%, a difference of 21.9%.
1 or more Vehicles in Household Correlation Summary
| Measurement | West Indian | White/Caucasian |
| Minimum | 37.0% | 68.0% |
| Maximum | 100.0% | 95.6% |
| Range | 63.0% | 27.6% |
| Mean | 78.9% | 89.2% |
| Median | 83.1% | 91.3% |
| Interquartile 25% (IQ1) | 65.1% | 86.4% |
| Interquartile 75% (IQ3) | 91.3% | 94.0% |
| Interquartile Range (IQR) | 26.2% | 7.6% |
| Standard Deviation (Sample) | 17.2% | 6.1% |
| Standard Deviation (Population) | 17.0% | 6.1% |
Similar Demographics by 1 or more Vehicles in Household
Demographics Similar to West Indians by 1 or more Vehicles in Household
In terms of 1 or more vehicles in household, the demographic groups most similar to West Indians are Trinidadian and Tobagonian (76.3%, a difference of 0.080%), Immigrants from Ecuador (76.2%, a difference of 0.18%), Immigrants from Trinidad and Tobago (76.8%, a difference of 0.55%), Immigrants from Dominica (77.8%, a difference of 1.9%), and Ecuadorian (77.9%, a difference of 2.1%).
| Demographics | Rating | Rank | 1 or more Vehicles in Household |
| Immigrants | Caribbean | 0.0 /100 | #324 | Tragic 80.4% |
| Senegalese | 0.0 /100 | #325 | Tragic 80.4% |
| Immigrants | West Indies | 0.0 /100 | #326 | Tragic 79.5% |
| Immigrants | Senegal | 0.0 /100 | #327 | Tragic 79.0% |
| Ecuadorians | 0.0 /100 | #328 | Tragic 77.9% |
| Immigrants | Dominica | 0.0 /100 | #329 | Tragic 77.8% |
| Immigrants | Trinidad and Tobago | 0.0 /100 | #330 | Tragic 76.8% |
| West Indians | 0.0 /100 | #331 | Tragic 76.4% |
| Trinidadians and Tobagonians | 0.0 /100 | #332 | Tragic 76.3% |
| Immigrants | Ecuador | 0.0 /100 | #333 | Tragic 76.2% |
| Immigrants | Bangladesh | 0.0 /100 | #334 | Tragic 74.3% |
| Barbadians | 0.0 /100 | #335 | Tragic 74.0% |
| Vietnamese | 0.0 /100 | #336 | Tragic 73.8% |
| Immigrants | Uzbekistan | 0.0 /100 | #337 | Tragic 73.4% |
| Inupiat | 0.0 /100 | #338 | Tragic 71.5% |
Demographics Similar to Whites/Caucasians by 1 or more Vehicles in Household
In terms of 1 or more vehicles in household, the demographic groups most similar to Whites/Caucasians are Scandinavian (93.1%, a difference of 0.020%), Irish (93.1%, a difference of 0.040%), Mexican (93.0%, a difference of 0.060%), Assyrian/Chaldean/Syriac (93.0%, a difference of 0.060%), and European (93.0%, a difference of 0.090%).
| Demographics | Rating | Rank | 1 or more Vehicles in Household |
| Danes | 100.0 /100 | #6 | Exceptional 93.5% |
| Scottish | 100.0 /100 | #7 | Exceptional 93.4% |
| Swedes | 100.0 /100 | #8 | Exceptional 93.3% |
| Scotch-Irish | 100.0 /100 | #9 | Exceptional 93.3% |
| Dutch | 100.0 /100 | #10 | Exceptional 93.3% |
| Czechs | 100.0 /100 | #11 | Exceptional 93.3% |
| Scandinavians | 100.0 /100 | #12 | Exceptional 93.1% |
| Whites/Caucasians | 100.0 /100 | #13 | Exceptional 93.1% |
| Irish | 100.0 /100 | #14 | Exceptional 93.1% |
| Mexicans | 100.0 /100 | #15 | Exceptional 93.0% |
| Assyrians/Chaldeans/Syriacs | 100.0 /100 | #16 | Exceptional 93.0% |
| Europeans | 100.0 /100 | #17 | Exceptional 93.0% |
| Welsh | 100.0 /100 | #18 | Exceptional 93.0% |
| Tongans | 100.0 /100 | #19 | Exceptional 92.9% |
| Arapaho | 100.0 /100 | #20 | Exceptional 92.7% |