West Indian vs Armenian 1 or more Vehicles in Household
COMPARE
West Indian
Armenian
1 or more Vehicles in Household
1 or more Vehicles in Household Comparison
West Indians
Armenians
76.4%
1 OR MORE VEHICLES IN HOUSEHOLD
0.0/ 100
METRIC RATING
331st/ 347
METRIC RANK
90.7%
1 OR MORE VEHICLES IN HOUSEHOLD
94.5/ 100
METRIC RATING
114th/ 347
METRIC RANK
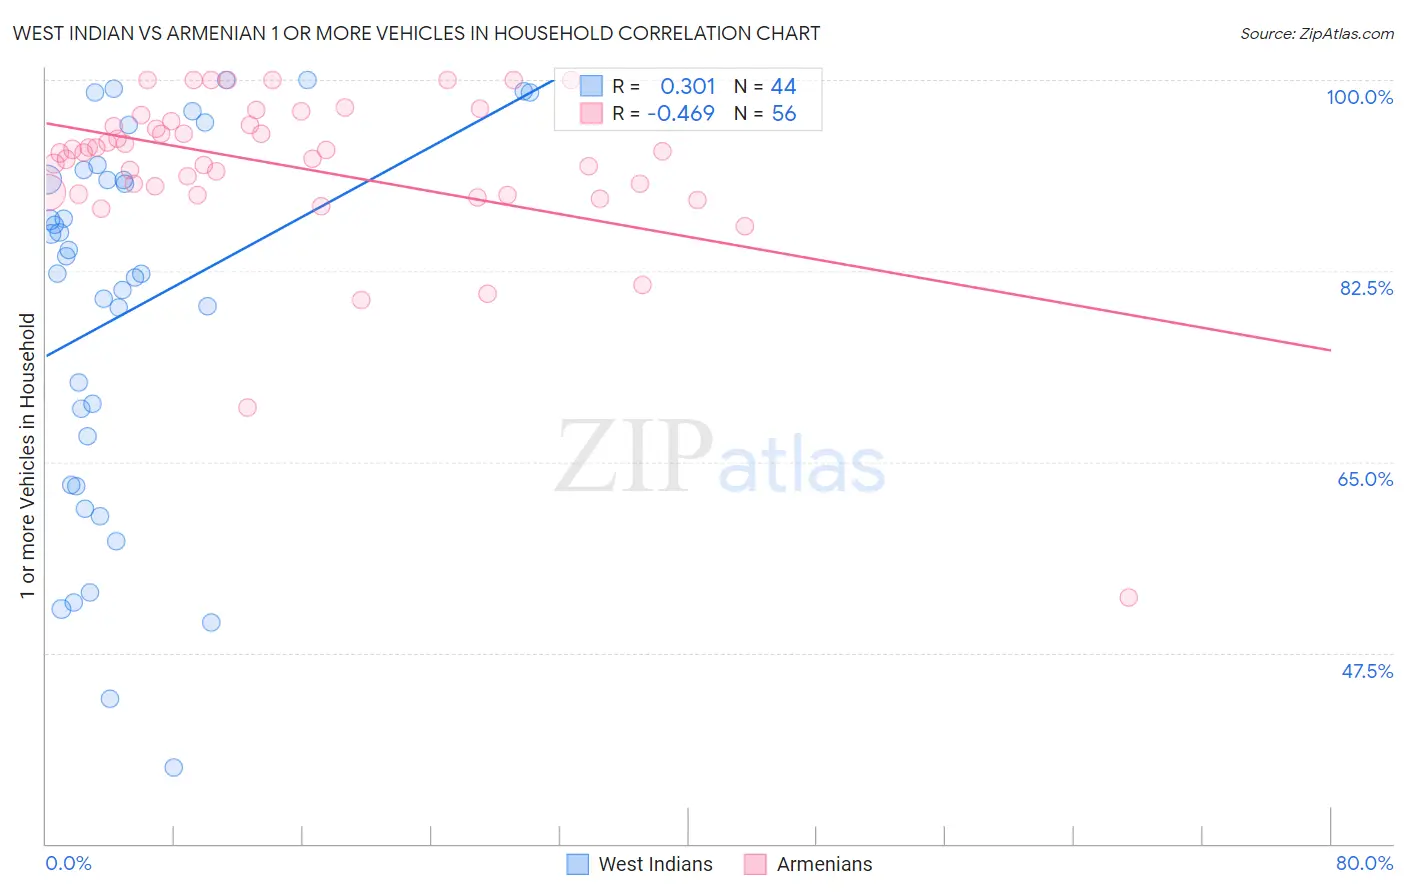
West Indian vs Armenian 1 or more Vehicles in Household Correlation Chart
The statistical analysis conducted on geographies consisting of 253,892,207 people shows a mild positive correlation between the proportion of West Indians and percentage of households with 1 or more vehicles available in the United States with a correlation coefficient (R) of 0.301 and weighted average of 76.4%. Similarly, the statistical analysis conducted on geographies consisting of 310,834,623 people shows a moderate negative correlation between the proportion of Armenians and percentage of households with 1 or more vehicles available in the United States with a correlation coefficient (R) of -0.469 and weighted average of 90.7%, a difference of 18.7%.
1 or more Vehicles in Household Correlation Summary
| Measurement | West Indian | Armenian |
| Minimum | 37.0% | 52.6% |
| Maximum | 100.0% | 100.0% |
| Range | 63.0% | 47.4% |
| Mean | 78.9% | 92.0% |
| Median | 83.1% | 93.4% |
| Interquartile 25% (IQ1) | 65.1% | 89.6% |
| Interquartile 75% (IQ3) | 91.3% | 96.1% |
| Interquartile Range (IQR) | 26.2% | 6.5% |
| Standard Deviation (Sample) | 17.2% | 7.8% |
| Standard Deviation (Population) | 17.0% | 7.7% |
Similar Demographics by 1 or more Vehicles in Household
Demographics Similar to West Indians by 1 or more Vehicles in Household
In terms of 1 or more vehicles in household, the demographic groups most similar to West Indians are Trinidadian and Tobagonian (76.3%, a difference of 0.080%), Immigrants from Ecuador (76.2%, a difference of 0.18%), Immigrants from Trinidad and Tobago (76.8%, a difference of 0.55%), Immigrants from Dominica (77.8%, a difference of 1.9%), and Ecuadorian (77.9%, a difference of 2.1%).
| Demographics | Rating | Rank | 1 or more Vehicles in Household |
| Immigrants | Caribbean | 0.0 /100 | #324 | Tragic 80.4% |
| Senegalese | 0.0 /100 | #325 | Tragic 80.4% |
| Immigrants | West Indies | 0.0 /100 | #326 | Tragic 79.5% |
| Immigrants | Senegal | 0.0 /100 | #327 | Tragic 79.0% |
| Ecuadorians | 0.0 /100 | #328 | Tragic 77.9% |
| Immigrants | Dominica | 0.0 /100 | #329 | Tragic 77.8% |
| Immigrants | Trinidad and Tobago | 0.0 /100 | #330 | Tragic 76.8% |
| West Indians | 0.0 /100 | #331 | Tragic 76.4% |
| Trinidadians and Tobagonians | 0.0 /100 | #332 | Tragic 76.3% |
| Immigrants | Ecuador | 0.0 /100 | #333 | Tragic 76.2% |
| Immigrants | Bangladesh | 0.0 /100 | #334 | Tragic 74.3% |
| Barbadians | 0.0 /100 | #335 | Tragic 74.0% |
| Vietnamese | 0.0 /100 | #336 | Tragic 73.8% |
| Immigrants | Uzbekistan | 0.0 /100 | #337 | Tragic 73.4% |
| Inupiat | 0.0 /100 | #338 | Tragic 71.5% |
Demographics Similar to Armenians by 1 or more Vehicles in Household
In terms of 1 or more vehicles in household, the demographic groups most similar to Armenians are Immigrants from Kuwait (90.7%, a difference of 0.020%), Serbian (90.7%, a difference of 0.020%), Chippewa (90.7%, a difference of 0.020%), Greek (90.6%, a difference of 0.070%), and Japanese (90.6%, a difference of 0.080%).
| Demographics | Rating | Rank | 1 or more Vehicles in Household |
| Maltese | 97.7 /100 | #107 | Exceptional 91.0% |
| Hispanics or Latinos | 97.6 /100 | #108 | Exceptional 91.0% |
| Delaware | 97.6 /100 | #109 | Exceptional 91.0% |
| Mexican American Indians | 97.4 /100 | #110 | Exceptional 91.0% |
| Navajo | 95.8 /100 | #111 | Exceptional 90.8% |
| Immigrants | Netherlands | 95.7 /100 | #112 | Exceptional 90.8% |
| Immigrants | Kuwait | 94.7 /100 | #113 | Exceptional 90.7% |
| Armenians | 94.5 /100 | #114 | Exceptional 90.7% |
| Serbians | 94.3 /100 | #115 | Exceptional 90.7% |
| Chippewa | 94.3 /100 | #116 | Exceptional 90.7% |
| Greeks | 93.5 /100 | #117 | Exceptional 90.6% |
| Japanese | 93.4 /100 | #118 | Exceptional 90.6% |
| Blackfeet | 92.6 /100 | #119 | Exceptional 90.6% |
| Immigrants | Thailand | 92.3 /100 | #120 | Exceptional 90.6% |
| Icelanders | 92.1 /100 | #121 | Exceptional 90.5% |