West Indian vs Menominee 1 or more Vehicles in Household
COMPARE
West Indian
Menominee
1 or more Vehicles in Household
1 or more Vehicles in Household Comparison
West Indians
Menominee
76.4%
1 OR MORE VEHICLES IN HOUSEHOLD
0.0/ 100
METRIC RATING
331st/ 347
METRIC RANK
88.3%
1 OR MORE VEHICLES IN HOUSEHOLD
1.9/ 100
METRIC RATING
246th/ 347
METRIC RANK
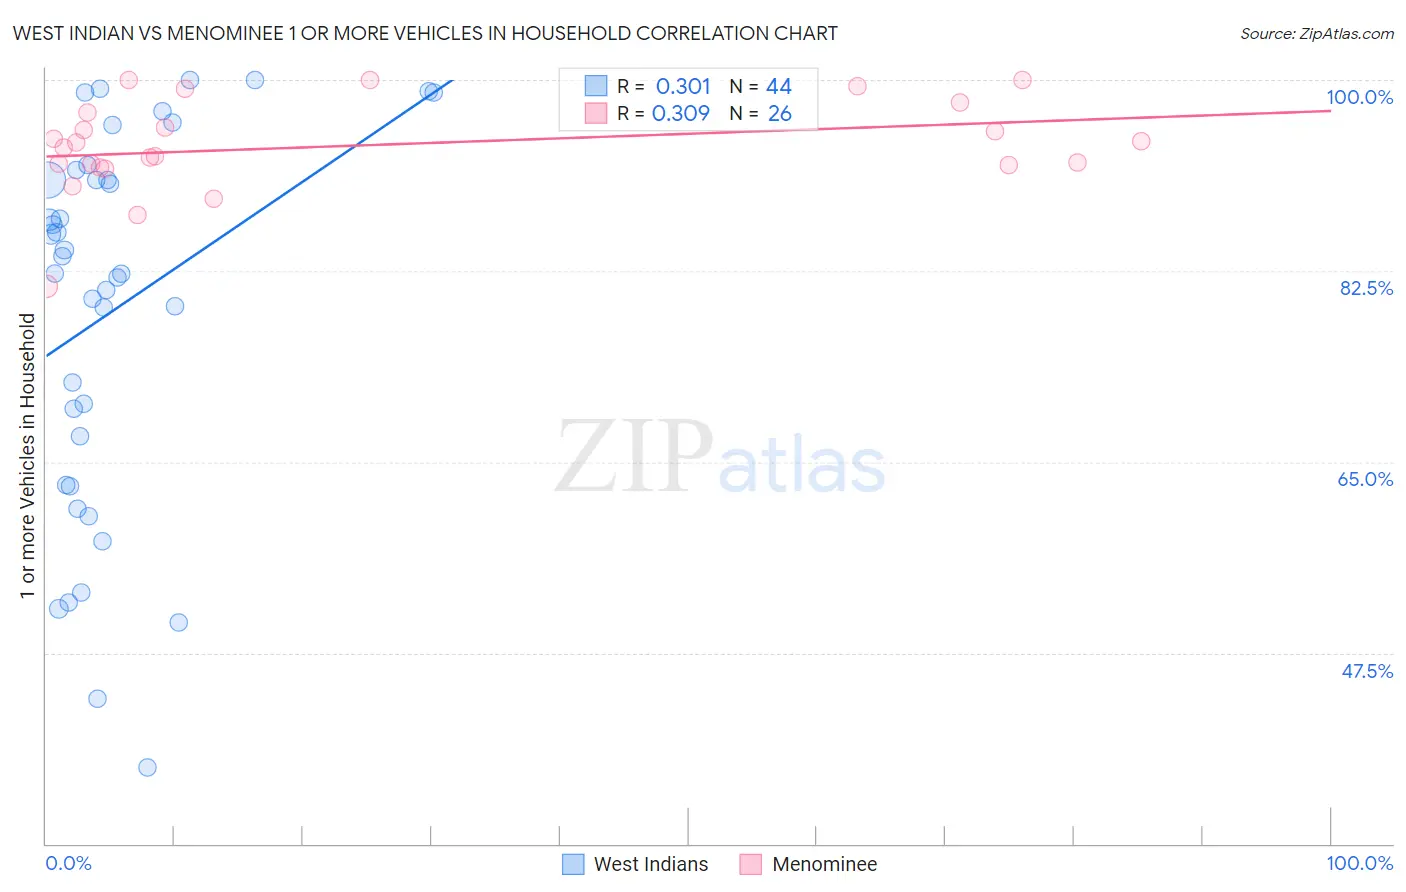
West Indian vs Menominee 1 or more Vehicles in Household Correlation Chart
The statistical analysis conducted on geographies consisting of 253,892,207 people shows a mild positive correlation between the proportion of West Indians and percentage of households with 1 or more vehicles available in the United States with a correlation coefficient (R) of 0.301 and weighted average of 76.4%. Similarly, the statistical analysis conducted on geographies consisting of 45,777,849 people shows a mild positive correlation between the proportion of Menominee and percentage of households with 1 or more vehicles available in the United States with a correlation coefficient (R) of 0.309 and weighted average of 88.3%, a difference of 15.6%.
1 or more Vehicles in Household Correlation Summary
| Measurement | West Indian | Menominee |
| Minimum | 37.0% | 81.1% |
| Maximum | 100.0% | 100.0% |
| Range | 63.0% | 18.9% |
| Mean | 78.9% | 94.0% |
| Median | 83.1% | 94.1% |
| Interquartile 25% (IQ1) | 65.1% | 92.2% |
| Interquartile 75% (IQ3) | 91.3% | 97.0% |
| Interquartile Range (IQR) | 26.2% | 4.7% |
| Standard Deviation (Sample) | 17.2% | 4.3% |
| Standard Deviation (Population) | 17.0% | 4.2% |
Similar Demographics by 1 or more Vehicles in Household
Demographics Similar to West Indians by 1 or more Vehicles in Household
In terms of 1 or more vehicles in household, the demographic groups most similar to West Indians are Trinidadian and Tobagonian (76.3%, a difference of 0.080%), Immigrants from Ecuador (76.2%, a difference of 0.18%), Immigrants from Trinidad and Tobago (76.8%, a difference of 0.55%), Immigrants from Dominica (77.8%, a difference of 1.9%), and Ecuadorian (77.9%, a difference of 2.1%).
| Demographics | Rating | Rank | 1 or more Vehicles in Household |
| Immigrants | Caribbean | 0.0 /100 | #324 | Tragic 80.4% |
| Senegalese | 0.0 /100 | #325 | Tragic 80.4% |
| Immigrants | West Indies | 0.0 /100 | #326 | Tragic 79.5% |
| Immigrants | Senegal | 0.0 /100 | #327 | Tragic 79.0% |
| Ecuadorians | 0.0 /100 | #328 | Tragic 77.9% |
| Immigrants | Dominica | 0.0 /100 | #329 | Tragic 77.8% |
| Immigrants | Trinidad and Tobago | 0.0 /100 | #330 | Tragic 76.8% |
| West Indians | 0.0 /100 | #331 | Tragic 76.4% |
| Trinidadians and Tobagonians | 0.0 /100 | #332 | Tragic 76.3% |
| Immigrants | Ecuador | 0.0 /100 | #333 | Tragic 76.2% |
| Immigrants | Bangladesh | 0.0 /100 | #334 | Tragic 74.3% |
| Barbadians | 0.0 /100 | #335 | Tragic 74.0% |
| Vietnamese | 0.0 /100 | #336 | Tragic 73.8% |
| Immigrants | Uzbekistan | 0.0 /100 | #337 | Tragic 73.4% |
| Inupiat | 0.0 /100 | #338 | Tragic 71.5% |
Demographics Similar to Menominee by 1 or more Vehicles in Household
In terms of 1 or more vehicles in household, the demographic groups most similar to Menominee are Immigrants from Czechoslovakia (88.3%, a difference of 0.010%), Immigrants from Portugal (88.3%, a difference of 0.030%), Immigrants from Honduras (88.3%, a difference of 0.040%), Immigrants from Belgium (88.4%, a difference of 0.050%), and Immigrants from Nigeria (88.2%, a difference of 0.080%).
| Demographics | Rating | Rank | 1 or more Vehicles in Household |
| Kiowa | 3.8 /100 | #239 | Tragic 88.6% |
| Eastern Europeans | 3.0 /100 | #240 | Tragic 88.5% |
| Taiwanese | 2.6 /100 | #241 | Tragic 88.4% |
| Turks | 2.5 /100 | #242 | Tragic 88.4% |
| Immigrants | Belgium | 2.1 /100 | #243 | Tragic 88.4% |
| Immigrants | Portugal | 2.0 /100 | #244 | Tragic 88.3% |
| Immigrants | Czechoslovakia | 1.9 /100 | #245 | Tragic 88.3% |
| Menominee | 1.9 /100 | #246 | Tragic 88.3% |
| Immigrants | Honduras | 1.7 /100 | #247 | Tragic 88.3% |
| Immigrants | Nigeria | 1.5 /100 | #248 | Tragic 88.2% |
| Blacks/African Americans | 1.4 /100 | #249 | Tragic 88.2% |
| Egyptians | 1.2 /100 | #250 | Tragic 88.2% |
| Immigrants | Serbia | 1.2 /100 | #251 | Tragic 88.2% |
| Immigrants | Uruguay | 1.1 /100 | #252 | Tragic 88.1% |
| Hondurans | 1.0 /100 | #253 | Tragic 88.1% |