Alsatian vs Colombian 1 or more Vehicles in Household
COMPARE
Alsatian
Colombian
1 or more Vehicles in Household
1 or more Vehicles in Household Comparison
Alsatians
Colombians
87.1%
1 OR MORE VEHICLES IN HOUSEHOLD
0.1/ 100
METRIC RATING
277th/ 347
METRIC RANK
88.0%
1 OR MORE VEHICLES IN HOUSEHOLD
0.9/ 100
METRIC RATING
256th/ 347
METRIC RANK
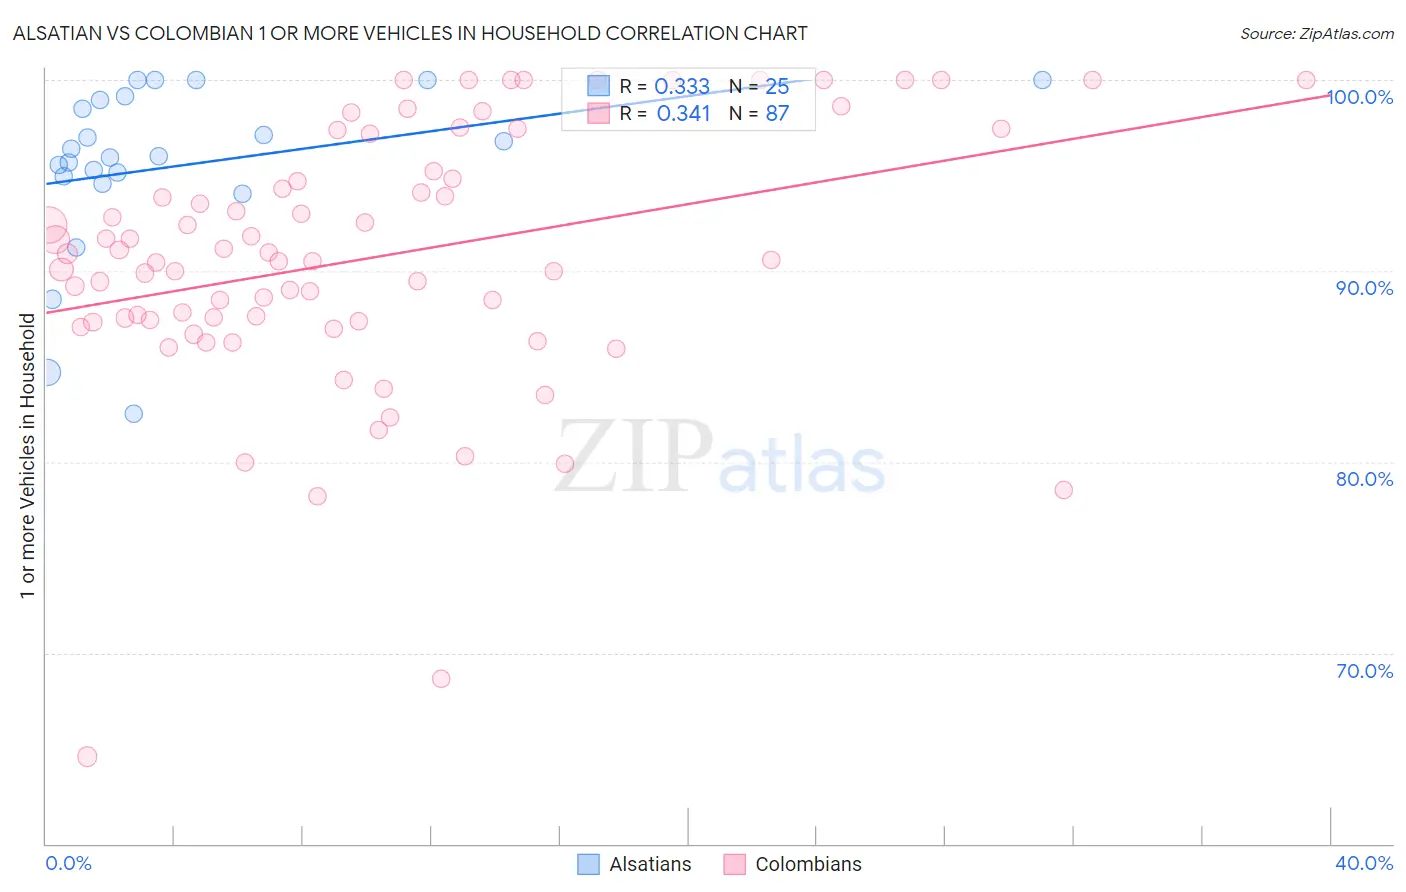
Alsatian vs Colombian 1 or more Vehicles in Household Correlation Chart
The statistical analysis conducted on geographies consisting of 82,680,020 people shows a mild positive correlation between the proportion of Alsatians and percentage of households with 1 or more vehicles available in the United States with a correlation coefficient (R) of 0.333 and weighted average of 87.1%. Similarly, the statistical analysis conducted on geographies consisting of 419,307,896 people shows a mild positive correlation between the proportion of Colombians and percentage of households with 1 or more vehicles available in the United States with a correlation coefficient (R) of 0.341 and weighted average of 88.0%, a difference of 1.1%.
1 or more Vehicles in Household Correlation Summary
| Measurement | Alsatian | Colombian |
| Minimum | 82.5% | 64.6% |
| Maximum | 100.0% | 100.0% |
| Range | 17.5% | 35.4% |
| Mean | 95.5% | 90.7% |
| Median | 96.0% | 90.6% |
| Interquartile 25% (IQ1) | 94.8% | 87.4% |
| Interquartile 75% (IQ3) | 99.0% | 95.2% |
| Interquartile Range (IQR) | 4.3% | 7.9% |
| Standard Deviation (Sample) | 4.6% | 6.8% |
| Standard Deviation (Population) | 4.5% | 6.8% |
Similar Demographics by 1 or more Vehicles in Household
Demographics Similar to Alsatians by 1 or more Vehicles in Household
In terms of 1 or more vehicles in household, the demographic groups most similar to Alsatians are Immigrants from Southern Europe (87.1%, a difference of 0.040%), Immigrants from Albania (87.1%, a difference of 0.040%), Immigrants from France (87.1%, a difference of 0.060%), Immigrants from Croatia (87.0%, a difference of 0.070%), and Immigrants from Singapore (87.2%, a difference of 0.13%).
| Demographics | Rating | Rank | 1 or more Vehicles in Household |
| Panamanians | 0.2 /100 | #270 | Tragic 87.5% |
| Bermudans | 0.2 /100 | #271 | Tragic 87.5% |
| Aleuts | 0.2 /100 | #272 | Tragic 87.5% |
| Immigrants | Northern Africa | 0.2 /100 | #273 | Tragic 87.4% |
| Immigrants | Morocco | 0.1 /100 | #274 | Tragic 87.4% |
| Immigrants | Singapore | 0.1 /100 | #275 | Tragic 87.2% |
| Immigrants | France | 0.1 /100 | #276 | Tragic 87.1% |
| Alsatians | 0.1 /100 | #277 | Tragic 87.1% |
| Immigrants | Southern Europe | 0.1 /100 | #278 | Tragic 87.1% |
| Immigrants | Albania | 0.1 /100 | #279 | Tragic 87.1% |
| Immigrants | Croatia | 0.0 /100 | #280 | Tragic 87.0% |
| Mongolians | 0.0 /100 | #281 | Tragic 87.0% |
| Colville | 0.0 /100 | #282 | Tragic 86.8% |
| Immigrants | Eastern Europe | 0.0 /100 | #283 | Tragic 86.7% |
| Central American Indians | 0.0 /100 | #284 | Tragic 86.7% |
Demographics Similar to Colombians by 1 or more Vehicles in Household
In terms of 1 or more vehicles in household, the demographic groups most similar to Colombians are Liberian (88.0%, a difference of 0.0%), Immigrants from Latvia (88.1%, a difference of 0.010%), South American Indian (88.0%, a difference of 0.010%), Haitian (88.1%, a difference of 0.030%), and Honduran (88.1%, a difference of 0.040%).
| Demographics | Rating | Rank | 1 or more Vehicles in Household |
| Blacks/African Americans | 1.4 /100 | #249 | Tragic 88.2% |
| Egyptians | 1.2 /100 | #250 | Tragic 88.2% |
| Immigrants | Serbia | 1.2 /100 | #251 | Tragic 88.2% |
| Immigrants | Uruguay | 1.1 /100 | #252 | Tragic 88.1% |
| Hondurans | 1.0 /100 | #253 | Tragic 88.1% |
| Haitians | 0.9 /100 | #254 | Tragic 88.1% |
| Immigrants | Latvia | 0.9 /100 | #255 | Tragic 88.1% |
| Colombians | 0.9 /100 | #256 | Tragic 88.0% |
| Liberians | 0.9 /100 | #257 | Tragic 88.0% |
| South American Indians | 0.9 /100 | #258 | Tragic 88.0% |
| Nigerians | 0.8 /100 | #259 | Tragic 88.0% |
| Macedonians | 0.6 /100 | #260 | Tragic 87.9% |
| Immigrants | Switzerland | 0.6 /100 | #261 | Tragic 87.9% |
| Sub-Saharan Africans | 0.5 /100 | #262 | Tragic 87.9% |
| Immigrants | Egypt | 0.5 /100 | #263 | Tragic 87.8% |