Zip Codes with the Highest Percentage of Population Employed in Health Diagnosing & Treating in Richmond, VA
RELATED REPORTS & OPTIONS
Health Diagnosing & Treating
Richmond
Compare Zip Codes
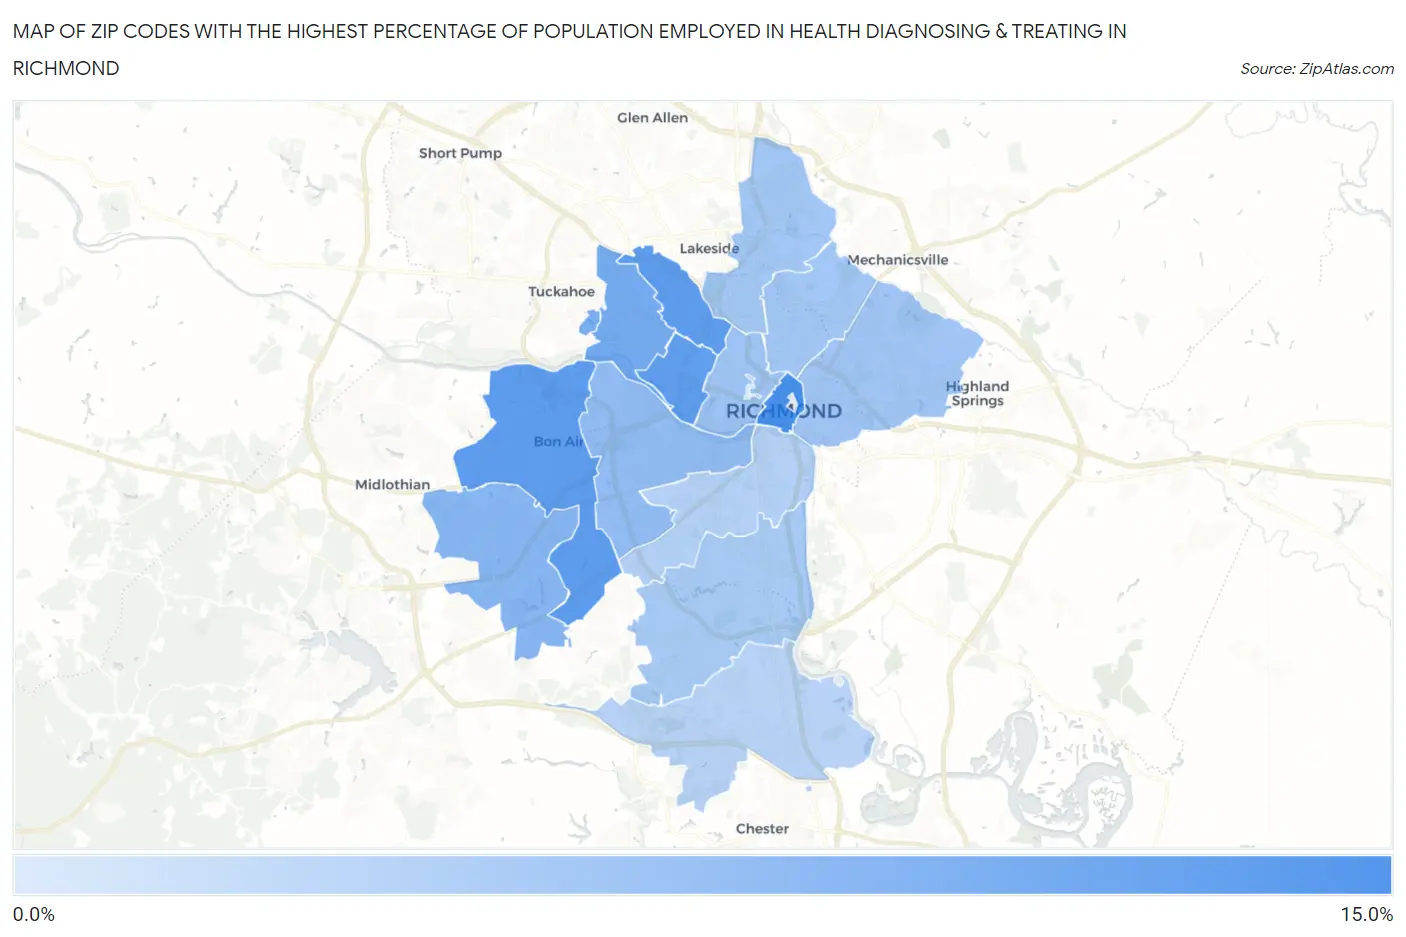
Map of Zip Codes with the Highest Percentage of Population Employed in Health Diagnosing & Treating in Richmond
1.6%
10.9%
Zip Codes with the Highest Percentage of Population Employed in Health Diagnosing & Treating in Richmond, VA
| Zip Code | % Employed | vs State | vs National | |
| 1. | 23219 | 10.9% | 5.7%(+5.20)#81 | 6.2%(+4.61)#3,006 |
| 2. | 23230 | 9.4% | 5.7%(+3.79)#127 | 6.2%(+3.20)#4,625 |
| 3. | 23235 | 9.4% | 5.7%(+3.74)#129 | 6.2%(+3.15)#4,697 |
| 4. | 23221 | 9.2% | 5.7%(+3.53)#136 | 6.2%(+2.95)#5,039 |
| 5. | 23226 | 8.0% | 5.7%(+2.34)#194 | 6.2%(+1.75)#7,511 |
| 6. | 23173 | 7.7% | 5.7%(+2.06)#211 | 6.2%(+1.47)#8,206 |
| 7. | 23236 | 6.8% | 5.7%(+1.14)#274 | 6.2%(+0.556)#10,996 |
| 8. | 23225 | 6.2% | 5.7%(+0.574)#312 | 6.2%(-0.014)#13,042 |
| 9. | 23220 | 5.3% | 5.7%(-0.320)#386 | 6.2%(-0.907)#16,404 |
| 10. | 23223 | 5.2% | 5.7%(-0.451)#399 | 6.2%(-1.04)#16,910 |
| 11. | 23227 | 5.1% | 5.7%(-0.519)#406 | 6.2%(-1.11)#17,166 |
| 12. | 23222 | 5.1% | 5.7%(-0.527)#408 | 6.2%(-1.12)#17,209 |
| 13. | 23234 | 4.8% | 5.7%(-0.860)#449 | 6.2%(-1.45)#18,504 |
| 14. | 23224 | 4.1% | 5.7%(-1.59)#525 | 6.2%(-2.17)#21,138 |
| 15. | 23237 | 3.9% | 5.7%(-1.79)#554 | 6.2%(-2.37)#21,777 |
| 16. | 23284 | 1.6% | 5.7%(-4.04)#698 | 6.2%(-4.63)#27,061 |
1
Common Questions
What are the Top 10 Zip Codes with the Highest Percentage of Population Employed in Health Diagnosing & Treating in Richmond, VA?
Top 10 Zip Codes with the Highest Percentage of Population Employed in Health Diagnosing & Treating in Richmond, VA are:
What zip code has the Highest Percentage of Population Employed in Health Diagnosing & Treating in Richmond, VA?
23219 has the Highest Percentage of Population Employed in Health Diagnosing & Treating in Richmond, VA with 10.9%.
What is the Percentage of Population Employed in Health Diagnosing & Treating in Richmond, VA?
Percentage of Population Employed in Health Diagnosing & Treating in Richmond is 5.9%.
What is the Percentage of Population Employed in Health Diagnosing & Treating in Virginia?
Percentage of Population Employed in Health Diagnosing & Treating in Virginia is 5.7%.
What is the Percentage of Population Employed in Health Diagnosing & Treating in the United States?
Percentage of Population Employed in Health Diagnosing & Treating in the United States is 6.2%.