Zip Codes with the Highest Percentage of Households with Income Above $100,000 in Lynchburg, VA
RELATED REPORTS & OPTIONS
Household Income | $100k+
Lynchburg
Compare Zip Codes
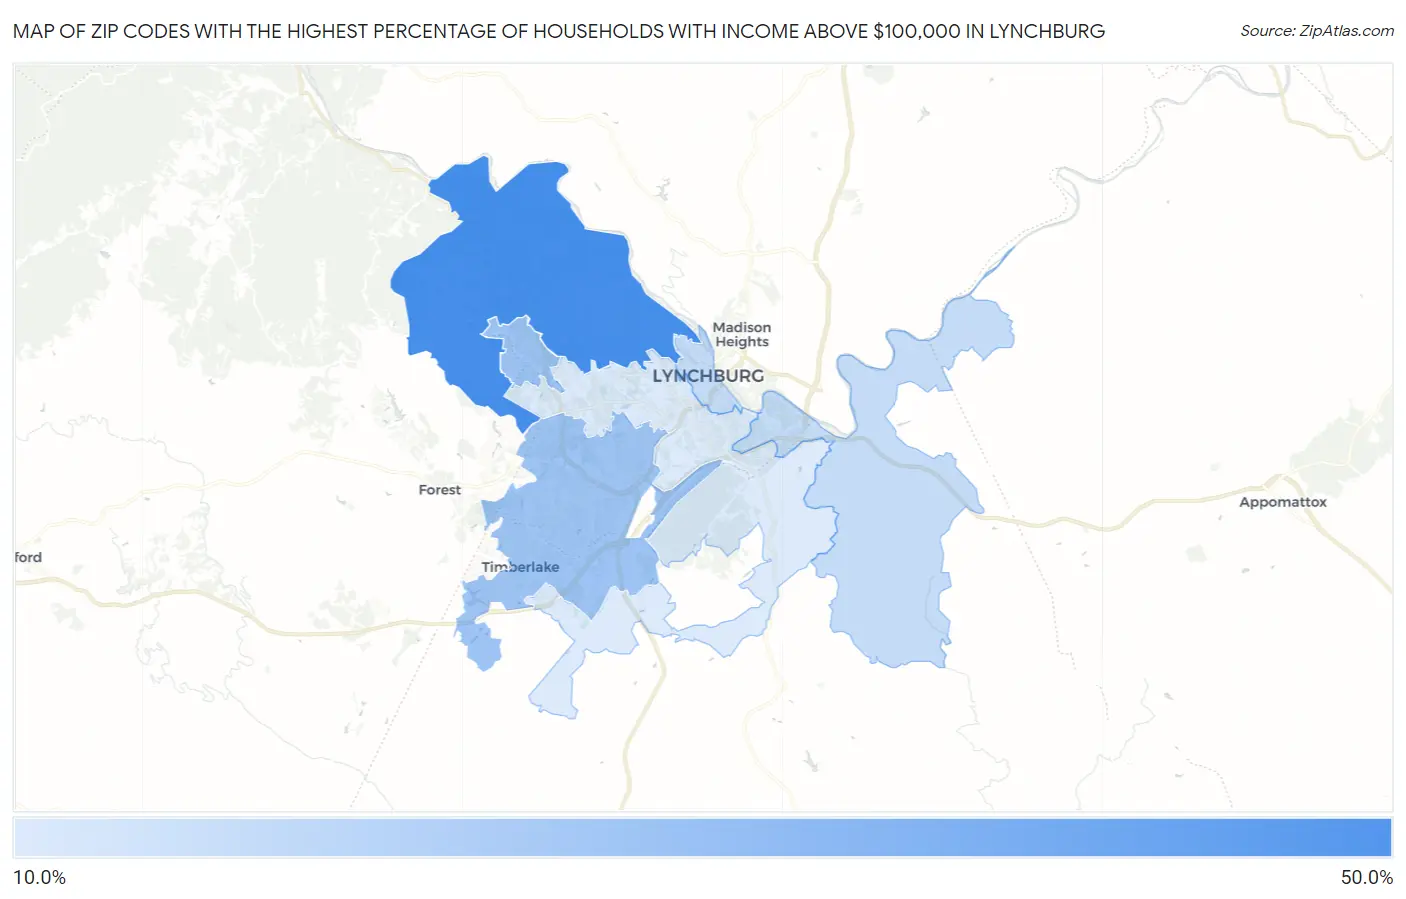
Map of Zip Codes with the Highest Percentage of Households with Income Above $100,000 in Lynchburg
15.5%
44.6%
Zip Codes with the Highest Percentage of Households with Income Above $100,000 in Lynchburg, VA
| Zip Code | Households with Income > $100k | vs State | vs National | |
| 1. | 24503 | 44.6% | 44.1%(+0.500)#256 | 37.3%(+7.30)#6,779 |
| 2. | 24502 | 26.7% | 44.1%(-17.4)#513 | 37.3%(-10.6)#18,218 |
| 3. | 24504 | 19.4% | 44.1%(-24.7)#649 | 37.3%(-17.9)#24,523 |
| 4. | 24501 | 15.5% | 44.1%(-28.6)#718 | 37.3%(-21.8)#27,241 |
1
Common Questions
What are the Top 3 Zip Codes with the Highest Percentage of Households with Income Above $100,000 in Lynchburg, VA?
Top 3 Zip Codes with the Highest Percentage of Households with Income Above $100,000 in Lynchburg, VA are:
What zip code has the Highest Percentage of Households with Income Above $100,000 in Lynchburg, VA?
24503 has the Highest Percentage of Households with Income Above $100,000 in Lynchburg, VA with 44.6%.
What is the Percentage of Households with Income Above $100,000 in Lynchburg, VA?
Percentage of Households with Income Above $100,000 in Lynchburg is 24.1%.
What is the Percentage of Households with Income Above $100,000 in Virginia?
Percentage of Households with Income Above $100,000 in Virginia is 44.1%.
What is the Percentage of Households with Income Above $100,000 in the United States?
Percentage of Households with Income Above $100,000 in the United States is 37.3%.