Zip Codes with the Highest Percentage of Households with Income Below $10,000 in Pasadena, TX
RELATED REPORTS & OPTIONS
Household Income | $0-10k
Pasadena
Compare Zip Codes
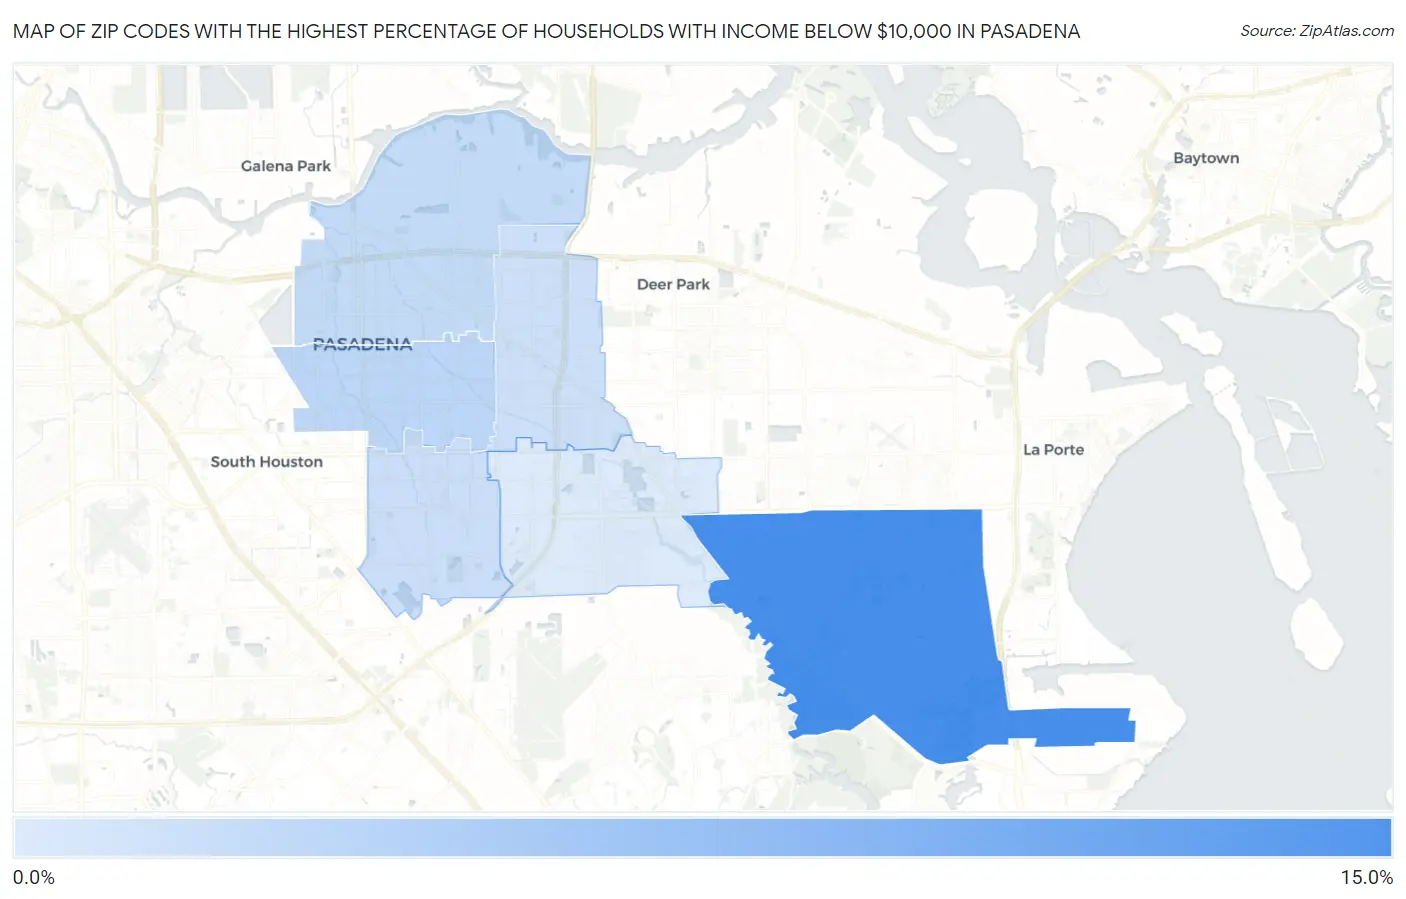
Map of Zip Codes with the Highest Percentage of Households with Income Below $10,000 in Pasadena
2.4%
13.8%
Zip Codes with the Highest Percentage of Households with Income Below $10,000 in Pasadena, TX
| Zip Code | Households with Income < $10k | vs State | vs National | |
| 1. | 77507 | 13.8% | 5.1%(+8.70)#88 | 4.9%(+8.90)#1,833 |
| 2. | 77502 | 4.7% | 5.1%(-0.400)#834 | 4.9%(-0.200)#12,644 |
| 3. | 77506 | 4.3% | 5.1%(-0.800)#905 | 4.9%(-0.600)#14,060 |
| 4. | 77504 | 3.7% | 5.1%(-1.40)#1,055 | 4.9%(-1.20)#16,441 |
| 5. | 77503 | 3.5% | 5.1%(-1.60)#1,105 | 4.9%(-1.40)#17,283 |
| 6. | 77505 | 2.4% | 5.1%(-2.70)#1,350 | 4.9%(-2.50)#22,059 |
1
Common Questions
What are the Top 5 Zip Codes with the Highest Percentage of Households with Income Below $10,000 in Pasadena, TX?
Top 5 Zip Codes with the Highest Percentage of Households with Income Below $10,000 in Pasadena, TX are:
What zip code has the Highest Percentage of Households with Income Below $10,000 in Pasadena, TX?
77507 has the Highest Percentage of Households with Income Below $10,000 in Pasadena, TX with 13.8%.
What is the Percentage of Households with Income Below $10,000 in Pasadena, TX?
Percentage of Households with Income Below $10,000 in Pasadena is 3.7%.
What is the Percentage of Households with Income Below $10,000 in Texas?
Percentage of Households with Income Below $10,000 in Texas is 5.1%.
What is the Percentage of Households with Income Below $10,000 in the United States?
Percentage of Households with Income Below $10,000 in the United States is 4.9%.