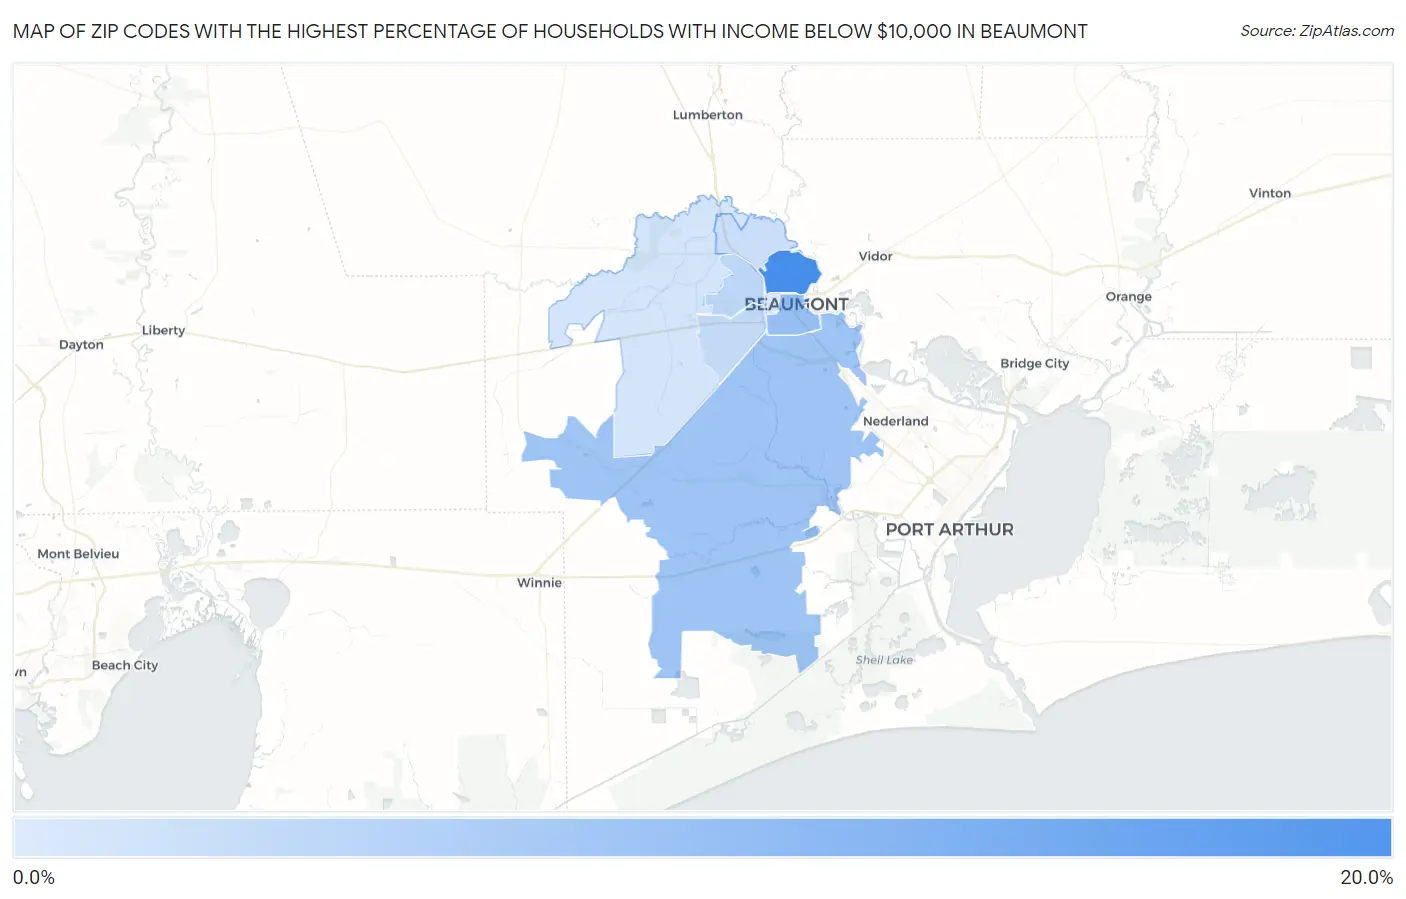
Zip Codes with the Highest Percentage of Households with Income Below $10,000 in Beaumont, TX
RELATED REPORTS & OPTIONS
Household Income | $0-10k
Beaumont
Compare Zip Codes
Map of Zip Codes with the Highest Percentage of Households with Income Below $10,000 in Beaumont
2.0%
18.9%
Zip Codes with the Highest Percentage of Households with Income Below $10,000 in Beaumont, TX
| Zip Code | Households with Income < $10k | vs State | vs National | |
| 1. | 77703 | 18.9% | 5.1%(+13.8)#48 | 4.9%(+14.0)#906 |
| 2. | 77701 | 9.5% | 5.1%(+4.40)#251 | 4.9%(+4.60)#3,966 |
| 3. | 77705 | 8.6% | 5.1%(+3.50)#305 | 4.9%(+3.70)#4,820 |
| 4. | 77706 | 5.3% | 5.1%(+0.200)#717 | 4.9%(+0.400)#10,756 |
| 5. | 77707 | 4.7% | 5.1%(-0.400)#840 | 4.9%(-0.200)#12,701 |
| 6. | 77708 | 3.9% | 5.1%(-1.20)#1,008 | 4.9%(-1.00)#15,718 |
| 7. | 77713 | 2.9% | 5.1%(-2.20)#1,228 | 4.9%(-2.00)#19,922 |
| 8. | 77702 | 2.0% | 5.1%(-3.10)#1,436 | 4.9%(-2.90)#23,784 |
1
Common Questions
What are the Top 5 Zip Codes with the Highest Percentage of Households with Income Below $10,000 in Beaumont, TX?
Top 5 Zip Codes with the Highest Percentage of Households with Income Below $10,000 in Beaumont, TX are:
What zip code has the Highest Percentage of Households with Income Below $10,000 in Beaumont, TX?
77703 has the Highest Percentage of Households with Income Below $10,000 in Beaumont, TX with 18.9%.
What is the Percentage of Households with Income Below $10,000 in Beaumont, TX?
Percentage of Households with Income Below $10,000 in Beaumont is 7.5%.
What is the Percentage of Households with Income Below $10,000 in Texas?
Percentage of Households with Income Below $10,000 in Texas is 5.1%.
What is the Percentage of Households with Income Below $10,000 in the United States?
Percentage of Households with Income Below $10,000 in the United States is 4.9%.