Zip Codes with the Highest Percentage of Households with Income Below $10,000 in Orange, TX
RELATED REPORTS & OPTIONS
Household Income | $0-10k
Orange
Compare Zip Codes
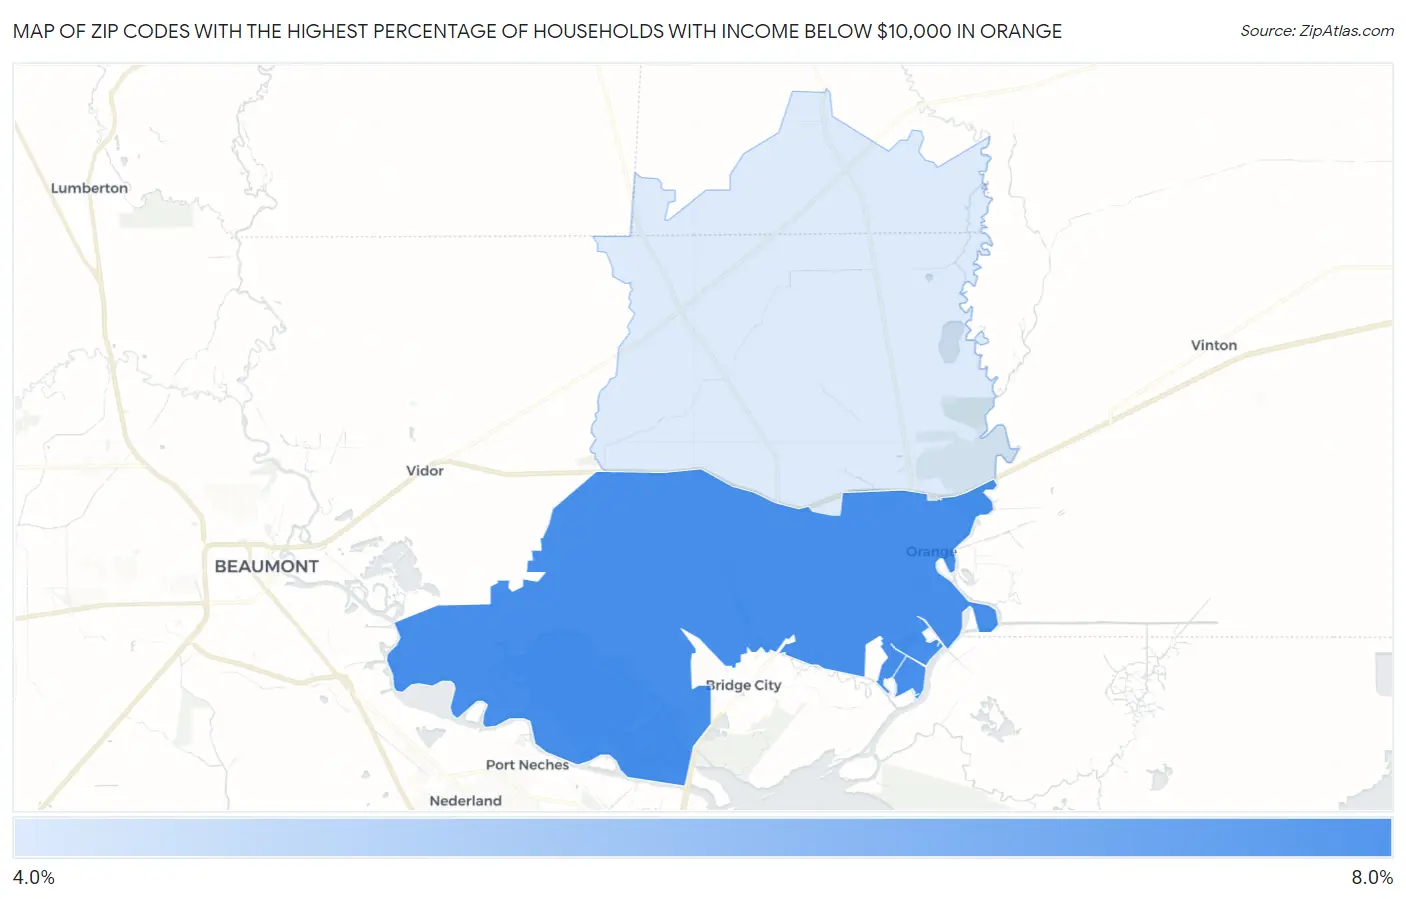
Map of Zip Codes with the Highest Percentage of Households with Income Below $10,000 in Orange
4.0%
7.2%
Zip Codes with the Highest Percentage of Households with Income Below $10,000 in Orange, TX
| Zip Code | Households with Income < $10k | vs State | vs National | |
| 1. | 77630 | 7.2% | 5.1%(+2.10)#451 | 4.9%(+2.30)#6,639 |
| 2. | 77632 | 4.0% | 5.1%(-1.10)#984 | 4.9%(-0.900)#15,288 |
1
Common Questions
What are the Top Zip Codes with the Highest Percentage of Households with Income Below $10,000 in Orange, TX?
Top Zip Codes with the Highest Percentage of Households with Income Below $10,000 in Orange, TX are:
What zip code has the Highest Percentage of Households with Income Below $10,000 in Orange, TX?
77630 has the Highest Percentage of Households with Income Below $10,000 in Orange, TX with 7.2%.
What is the Percentage of Households with Income Below $10,000 in Orange, TX?
Percentage of Households with Income Below $10,000 in Orange is 5.9%.
What is the Percentage of Households with Income Below $10,000 in Texas?
Percentage of Households with Income Below $10,000 in Texas is 5.1%.
What is the Percentage of Households with Income Below $10,000 in the United States?
Percentage of Households with Income Below $10,000 in the United States is 4.9%.