Zip Codes with the Highest Percentage of Households with Income Below $10,000 in Mission, TX
RELATED REPORTS & OPTIONS
Household Income | $0-10k
Mission
Compare Zip Codes
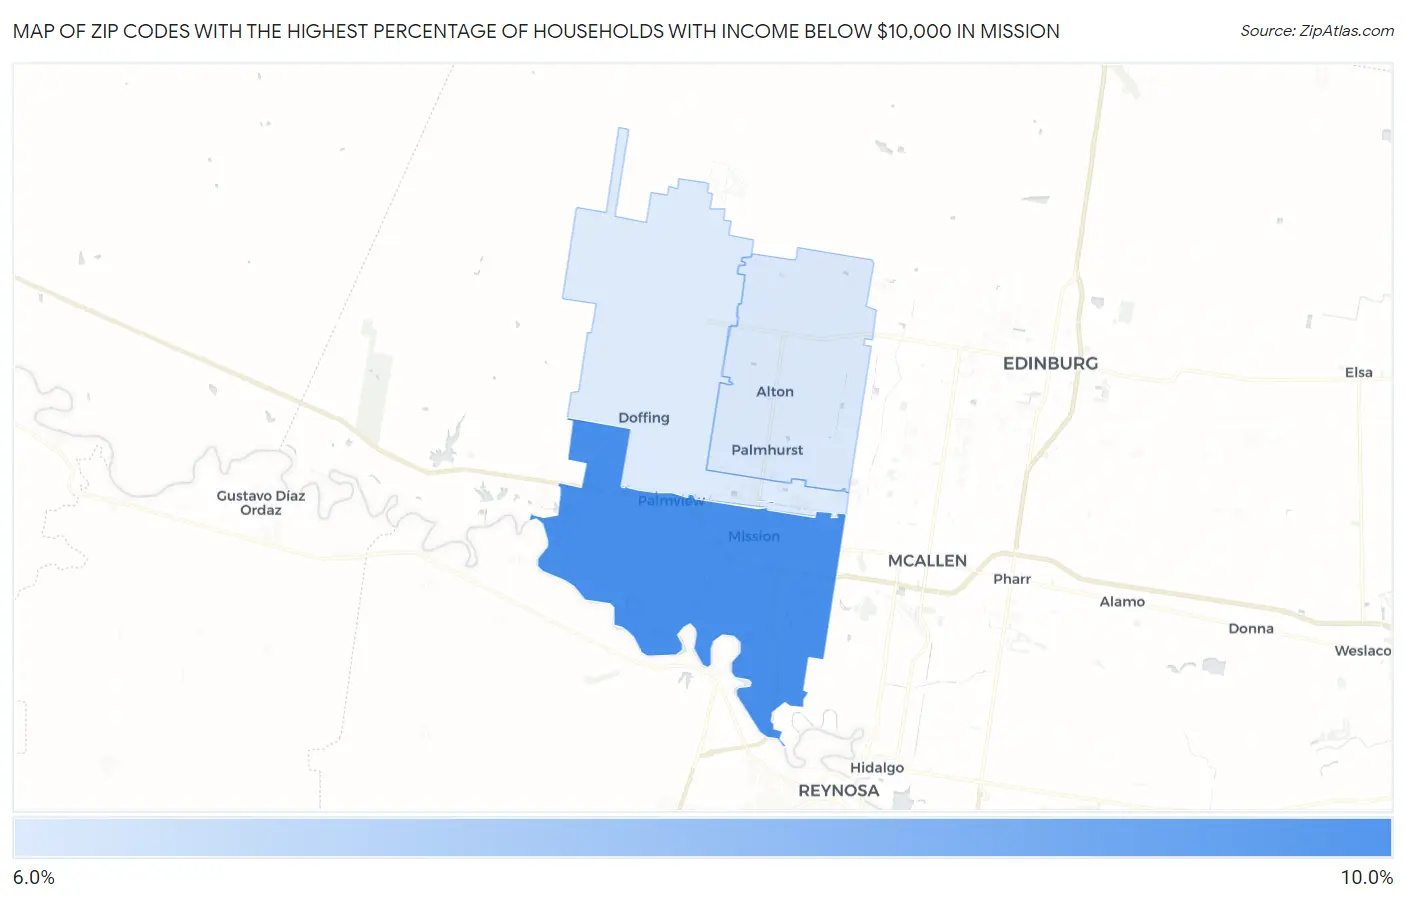
Map of Zip Codes with the Highest Percentage of Households with Income Below $10,000 in Mission
6.9%
9.6%
Zip Codes with the Highest Percentage of Households with Income Below $10,000 in Mission, TX
| Zip Code | Households with Income < $10k | vs State | vs National | |
| 1. | 78572 | 9.6% | 5.1%(+4.50)#240 | 4.9%(+4.70)#3,863 |
| 2. | 78573 | 7.0% | 5.1%(+1.90)#479 | 4.9%(+2.10)#6,947 |
| 3. | 78574 | 6.9% | 5.1%(+1.80)#486 | 4.9%(+2.00)#7,096 |
1
Common Questions
What are the Top Zip Codes with the Highest Percentage of Households with Income Below $10,000 in Mission, TX?
Top Zip Codes with the Highest Percentage of Households with Income Below $10,000 in Mission, TX are:
What zip code has the Highest Percentage of Households with Income Below $10,000 in Mission, TX?
78572 has the Highest Percentage of Households with Income Below $10,000 in Mission, TX with 9.6%.
What is the Percentage of Households with Income Below $10,000 in Mission, TX?
Percentage of Households with Income Below $10,000 in Mission is 8.4%.
What is the Percentage of Households with Income Below $10,000 in Texas?
Percentage of Households with Income Below $10,000 in Texas is 5.1%.
What is the Percentage of Households with Income Below $10,000 in the United States?
Percentage of Households with Income Below $10,000 in the United States is 4.9%.