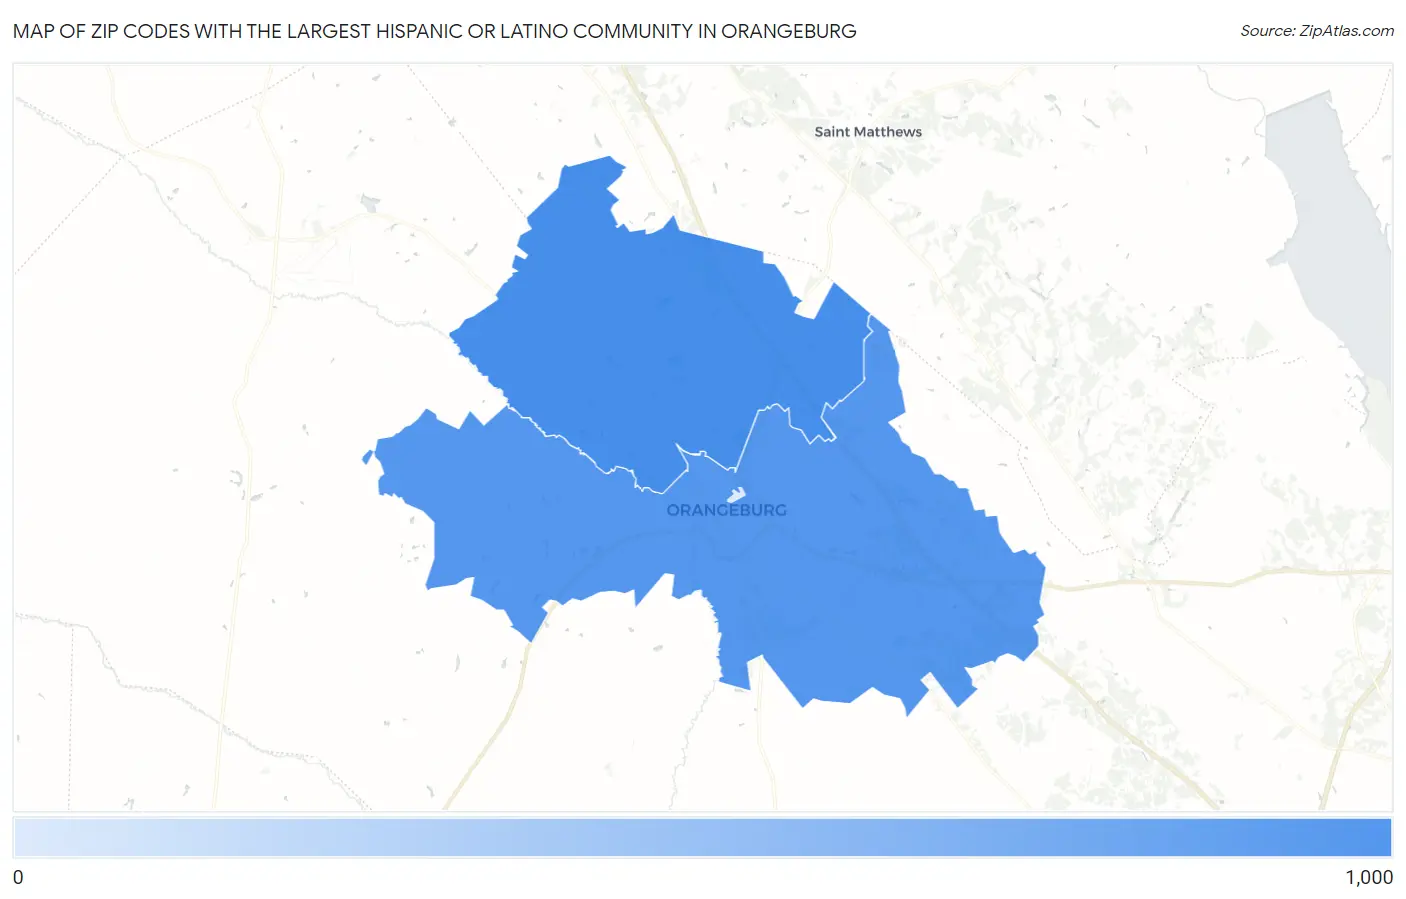
Zip Codes with the Largest Hispanic or Latino Community in Orangeburg, SC
RELATED REPORTS & OPTIONS
Hispanic or Latino
Orangeburg
Compare Zip Codes
Map of Zip Codes with the Largest Hispanic or Latino Community in Orangeburg
6
850
Zip Codes with the Largest Hispanic or Latino Community in Orangeburg, SC
| Zip Code | Hispanic or Latino | vs State | vs National | |
| 1. | 29118 | 850 | 318,875(0.27%)#111 | 61,755,866(0.00%)#8,804 |
| 2. | 29115 | 528 | 318,875(0.17%)#149 | 61,755,866(0.00%)#10,536 |
| 3. | 29117 | 6 | 318,875(0.00%)#348 | 61,755,866(0.00%)#25,471 |
1
Common Questions
What are the Top Zip Codes with the Largest Hispanic or Latino Community in Orangeburg, SC?
Top Zip Codes with the Largest Hispanic or Latino Community in Orangeburg, SC are:
What zip code has the Largest Hispanic or Latino Community in Orangeburg, SC?
29118 has the Largest Hispanic or Latino Community in Orangeburg, SC with 850.
What is the Total Hispanic or Latino Population in Orangeburg, SC?
Total Hispanic or Latino Population in Orangeburg is 30.
What is the Total Hispanic or Latino Population in South Carolina?
Total Hispanic or Latino Population in South Carolina is 318,875.
What is the Total Hispanic or Latino Population in the United States?
Total Hispanic or Latino Population in the United States is 61,755,866.