Tlingit-Haida vs South American Indian Family Poverty
COMPARE
Tlingit-Haida
South American Indian
Family Poverty
Family Poverty Comparison
Tlingit-Haida
South American Indians
8.0%
FAMILY POVERTY
96.7/ 100
METRIC RATING
93rd/ 347
METRIC RANK
9.1%
FAMILY POVERTY
38.7/ 100
METRIC RATING
184th/ 347
METRIC RANK
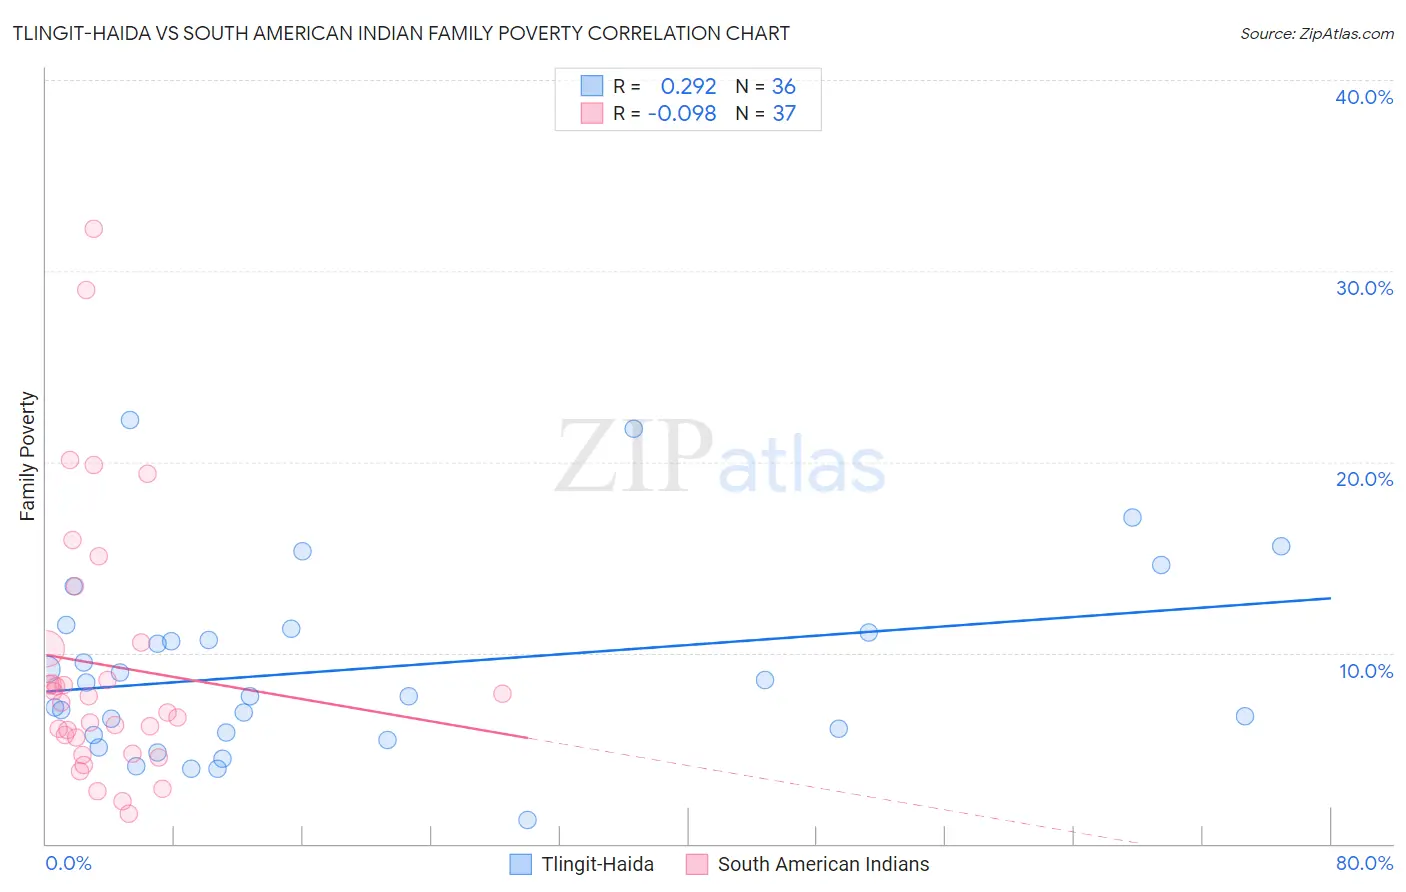
Tlingit-Haida vs South American Indian Family Poverty Correlation Chart
The statistical analysis conducted on geographies consisting of 60,804,034 people shows a weak positive correlation between the proportion of Tlingit-Haida and poverty level among families in the United States with a correlation coefficient (R) of 0.292 and weighted average of 8.0%. Similarly, the statistical analysis conducted on geographies consisting of 164,455,459 people shows a slight negative correlation between the proportion of South American Indians and poverty level among families in the United States with a correlation coefficient (R) of -0.098 and weighted average of 9.1%, a difference of 14.1%.
Family Poverty Correlation Summary
| Measurement | Tlingit-Haida | South American Indian |
| Minimum | 1.3% | 1.6% |
| Maximum | 22.2% | 32.2% |
| Range | 21.0% | 30.7% |
| Mean | 9.2% | 9.3% |
| Median | 8.1% | 7.4% |
| Interquartile 25% (IQ1) | 5.8% | 5.1% |
| Interquartile 75% (IQ3) | 11.2% | 10.4% |
| Interquartile Range (IQR) | 5.4% | 5.2% |
| Standard Deviation (Sample) | 4.8% | 7.0% |
| Standard Deviation (Population) | 4.8% | 6.9% |
Similar Demographics by Family Poverty
Demographics Similar to Tlingit-Haida by Family Poverty
In terms of family poverty, the demographic groups most similar to Tlingit-Haida are Immigrants from Pakistan (8.0%, a difference of 0.11%), Immigrants from Philippines (8.0%, a difference of 0.12%), Immigrants from Turkey (8.0%, a difference of 0.14%), Czechoslovakian (8.0%, a difference of 0.18%), and Immigrants from Italy (8.0%, a difference of 0.42%).
| Demographics | Rating | Rank | Family Poverty |
| Scottish | 97.3 /100 | #86 | Exceptional 7.9% |
| Belgians | 97.3 /100 | #87 | Exceptional 8.0% |
| Serbians | 97.2 /100 | #88 | Exceptional 8.0% |
| Immigrants | Denmark | 97.1 /100 | #89 | Exceptional 8.0% |
| Immigrants | England | 97.1 /100 | #90 | Exceptional 8.0% |
| Immigrants | Italy | 97.0 /100 | #91 | Exceptional 8.0% |
| Czechoslovakians | 96.8 /100 | #92 | Exceptional 8.0% |
| Tlingit-Haida | 96.7 /100 | #93 | Exceptional 8.0% |
| Immigrants | Pakistan | 96.6 /100 | #94 | Exceptional 8.0% |
| Immigrants | Philippines | 96.5 /100 | #95 | Exceptional 8.0% |
| Immigrants | Turkey | 96.5 /100 | #96 | Exceptional 8.0% |
| Immigrants | Switzerland | 96.1 /100 | #97 | Exceptional 8.1% |
| Immigrants | South Africa | 95.9 /100 | #98 | Exceptional 8.1% |
| Welsh | 95.8 /100 | #99 | Exceptional 8.1% |
| New Zealanders | 95.8 /100 | #100 | Exceptional 8.1% |
Demographics Similar to South American Indians by Family Poverty
In terms of family poverty, the demographic groups most similar to South American Indians are Immigrants from Saudi Arabia (9.1%, a difference of 0.010%), Uruguayan (9.1%, a difference of 0.070%), Immigrants from Morocco (9.1%, a difference of 0.20%), Hmong (9.1%, a difference of 0.21%), and Colombian (9.2%, a difference of 0.36%).
| Demographics | Rating | Rank | Family Poverty |
| Hawaiians | 47.2 /100 | #177 | Average 9.0% |
| Immigrants | Cameroon | 47.1 /100 | #178 | Average 9.0% |
| Immigrants | Iraq | 44.4 /100 | #179 | Average 9.1% |
| Immigrants | Uganda | 43.4 /100 | #180 | Average 9.1% |
| Hmong | 40.2 /100 | #181 | Average 9.1% |
| Immigrants | Morocco | 40.2 /100 | #182 | Average 9.1% |
| Uruguayans | 39.2 /100 | #183 | Fair 9.1% |
| South American Indians | 38.7 /100 | #184 | Fair 9.1% |
| Immigrants | Saudi Arabia | 38.6 /100 | #185 | Fair 9.1% |
| Colombians | 36.1 /100 | #186 | Fair 9.2% |
| Delaware | 35.4 /100 | #187 | Fair 9.2% |
| Immigrants | Kenya | 34.0 /100 | #188 | Fair 9.2% |
| Immigrants | Afghanistan | 32.1 /100 | #189 | Fair 9.2% |
| Arabs | 31.5 /100 | #190 | Fair 9.2% |
| Ugandans | 28.7 /100 | #191 | Fair 9.3% |