Tlingit-Haida vs Immigrants from Micronesia Family Poverty
COMPARE
Tlingit-Haida
Immigrants from Micronesia
Family Poverty
Family Poverty Comparison
Tlingit-Haida
Immigrants from Micronesia
8.0%
FAMILY POVERTY
96.7/ 100
METRIC RATING
93rd/ 347
METRIC RANK
9.8%
FAMILY POVERTY
6.7/ 100
METRIC RATING
214th/ 347
METRIC RANK
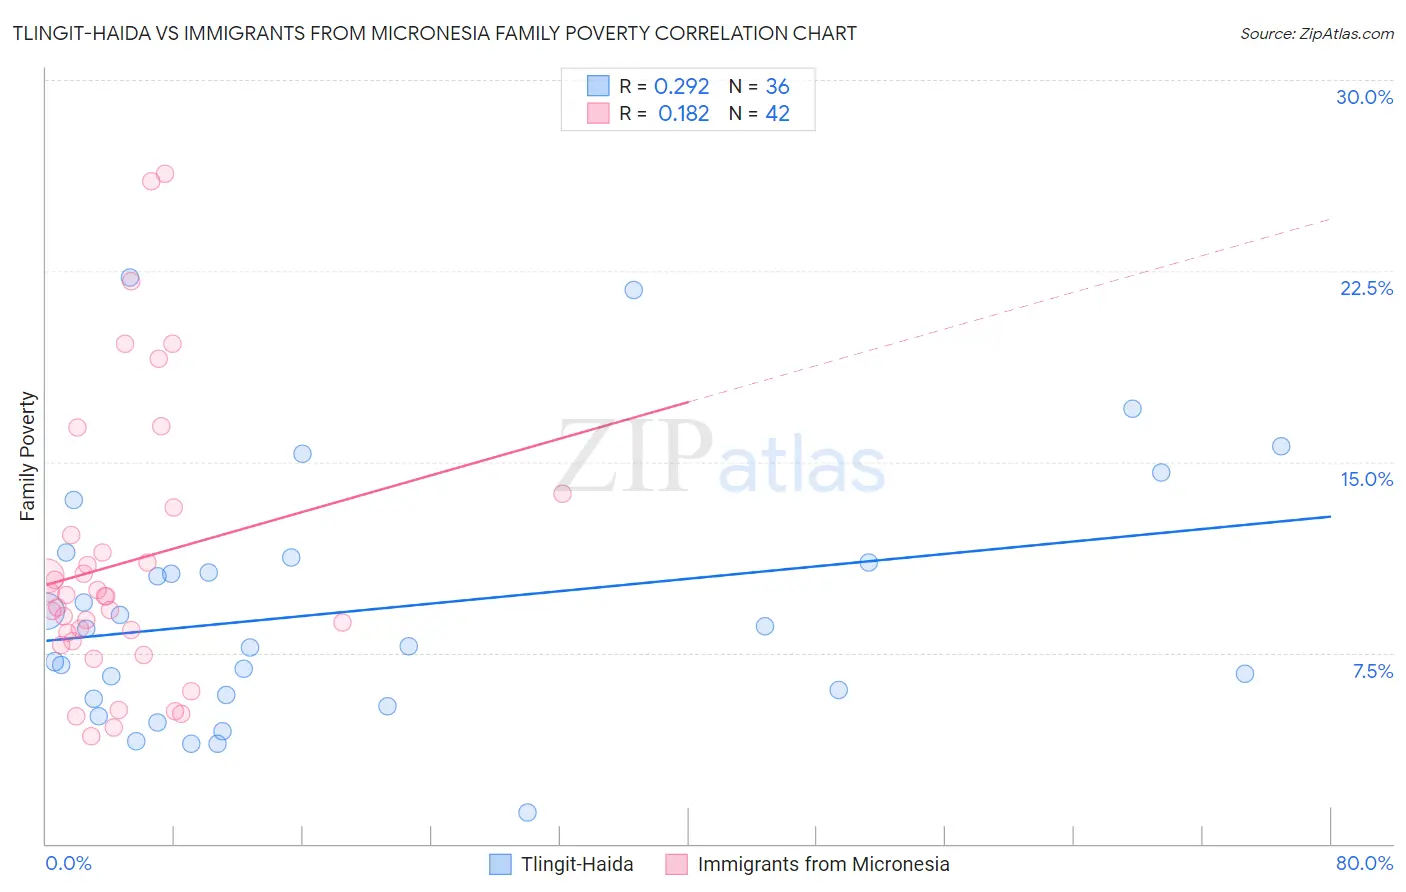
Tlingit-Haida vs Immigrants from Micronesia Family Poverty Correlation Chart
The statistical analysis conducted on geographies consisting of 60,804,034 people shows a weak positive correlation between the proportion of Tlingit-Haida and poverty level among families in the United States with a correlation coefficient (R) of 0.292 and weighted average of 8.0%. Similarly, the statistical analysis conducted on geographies consisting of 61,589,197 people shows a poor positive correlation between the proportion of Immigrants from Micronesia and poverty level among families in the United States with a correlation coefficient (R) of 0.182 and weighted average of 9.8%, a difference of 22.0%.
Family Poverty Correlation Summary
| Measurement | Tlingit-Haida | Immigrants from Micronesia |
| Minimum | 1.3% | 4.2% |
| Maximum | 22.2% | 26.3% |
| Range | 21.0% | 22.1% |
| Mean | 9.2% | 11.0% |
| Median | 8.1% | 9.7% |
| Interquartile 25% (IQ1) | 5.8% | 7.9% |
| Interquartile 75% (IQ3) | 11.2% | 12.1% |
| Interquartile Range (IQR) | 5.4% | 4.2% |
| Standard Deviation (Sample) | 4.8% | 5.5% |
| Standard Deviation (Population) | 4.8% | 5.4% |
Similar Demographics by Family Poverty
Demographics Similar to Tlingit-Haida by Family Poverty
In terms of family poverty, the demographic groups most similar to Tlingit-Haida are Immigrants from Pakistan (8.0%, a difference of 0.11%), Immigrants from Philippines (8.0%, a difference of 0.12%), Immigrants from Turkey (8.0%, a difference of 0.14%), Czechoslovakian (8.0%, a difference of 0.18%), and Immigrants from Italy (8.0%, a difference of 0.42%).
| Demographics | Rating | Rank | Family Poverty |
| Scottish | 97.3 /100 | #86 | Exceptional 7.9% |
| Belgians | 97.3 /100 | #87 | Exceptional 8.0% |
| Serbians | 97.2 /100 | #88 | Exceptional 8.0% |
| Immigrants | Denmark | 97.1 /100 | #89 | Exceptional 8.0% |
| Immigrants | England | 97.1 /100 | #90 | Exceptional 8.0% |
| Immigrants | Italy | 97.0 /100 | #91 | Exceptional 8.0% |
| Czechoslovakians | 96.8 /100 | #92 | Exceptional 8.0% |
| Tlingit-Haida | 96.7 /100 | #93 | Exceptional 8.0% |
| Immigrants | Pakistan | 96.6 /100 | #94 | Exceptional 8.0% |
| Immigrants | Philippines | 96.5 /100 | #95 | Exceptional 8.0% |
| Immigrants | Turkey | 96.5 /100 | #96 | Exceptional 8.0% |
| Immigrants | Switzerland | 96.1 /100 | #97 | Exceptional 8.1% |
| Immigrants | South Africa | 95.9 /100 | #98 | Exceptional 8.1% |
| Welsh | 95.8 /100 | #99 | Exceptional 8.1% |
| New Zealanders | 95.8 /100 | #100 | Exceptional 8.1% |
Demographics Similar to Immigrants from Micronesia by Family Poverty
In terms of family poverty, the demographic groups most similar to Immigrants from Micronesia are Nonimmigrants (9.8%, a difference of 0.030%), Moroccan (9.8%, a difference of 0.090%), American (9.8%, a difference of 0.29%), Osage (9.7%, a difference of 0.58%), and Panamanian (9.8%, a difference of 0.61%).
| Demographics | Rating | Rank | Family Poverty |
| Sierra Leoneans | 15.6 /100 | #207 | Poor 9.5% |
| Immigrants | Eastern Africa | 15.1 /100 | #208 | Poor 9.5% |
| Immigrants | Uruguay | 14.0 /100 | #209 | Poor 9.5% |
| Alsatians | 11.3 /100 | #210 | Poor 9.6% |
| Malaysians | 10.6 /100 | #211 | Poor 9.6% |
| Immigrants | Thailand | 9.7 /100 | #212 | Tragic 9.7% |
| Osage | 8.0 /100 | #213 | Tragic 9.7% |
| Immigrants | Micronesia | 6.7 /100 | #214 | Tragic 9.8% |
| Immigrants | Nonimmigrants | 6.7 /100 | #215 | Tragic 9.8% |
| Moroccans | 6.5 /100 | #216 | Tragic 9.8% |
| Americans | 6.2 /100 | #217 | Tragic 9.8% |
| Panamanians | 5.6 /100 | #218 | Tragic 9.8% |
| Immigrants | Eritrea | 5.4 /100 | #219 | Tragic 9.9% |
| Bermudans | 5.3 /100 | #220 | Tragic 9.9% |
| Immigrants | Cambodia | 4.8 /100 | #221 | Tragic 9.9% |