Tlingit-Haida vs African Family Poverty
COMPARE
Tlingit-Haida
African
Family Poverty
Family Poverty Comparison
Tlingit-Haida
Africans
8.0%
FAMILY POVERTY
96.7/ 100
METRIC RATING
93rd/ 347
METRIC RANK
11.8%
FAMILY POVERTY
0.0/ 100
METRIC RATING
303rd/ 347
METRIC RANK
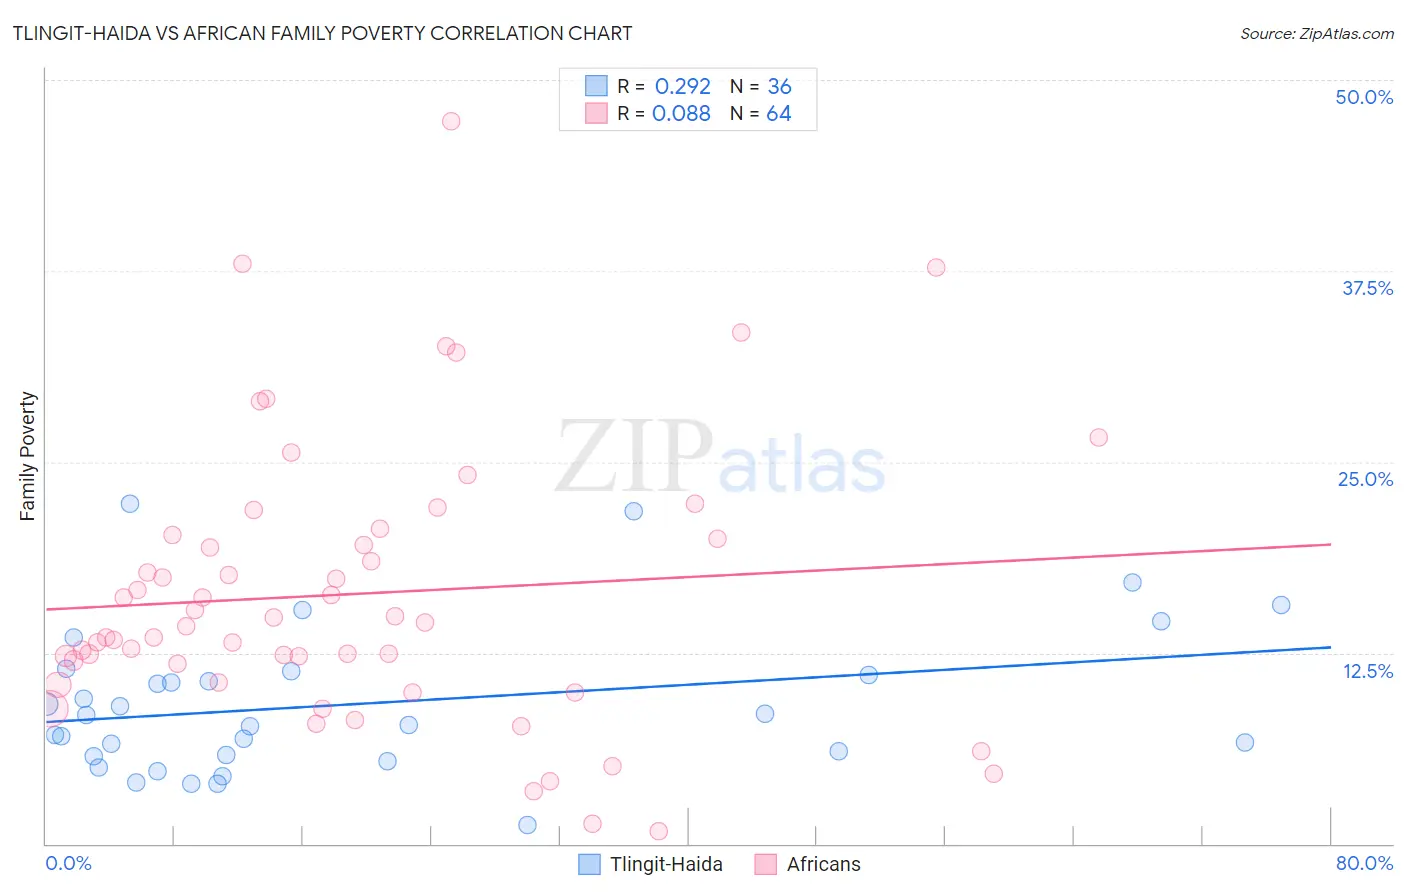
Tlingit-Haida vs African Family Poverty Correlation Chart
The statistical analysis conducted on geographies consisting of 60,804,034 people shows a weak positive correlation between the proportion of Tlingit-Haida and poverty level among families in the United States with a correlation coefficient (R) of 0.292 and weighted average of 8.0%. Similarly, the statistical analysis conducted on geographies consisting of 468,652,941 people shows a slight positive correlation between the proportion of Africans and poverty level among families in the United States with a correlation coefficient (R) of 0.088 and weighted average of 11.8%, a difference of 46.9%.
Family Poverty Correlation Summary
| Measurement | Tlingit-Haida | African |
| Minimum | 1.3% | 0.78% |
| Maximum | 22.2% | 47.3% |
| Range | 21.0% | 46.5% |
| Mean | 9.2% | 16.4% |
| Median | 8.1% | 14.4% |
| Interquartile 25% (IQ1) | 5.8% | 11.2% |
| Interquartile 75% (IQ3) | 11.2% | 20.1% |
| Interquartile Range (IQR) | 5.4% | 9.0% |
| Standard Deviation (Sample) | 4.8% | 9.2% |
| Standard Deviation (Population) | 4.8% | 9.1% |
Similar Demographics by Family Poverty
Demographics Similar to Tlingit-Haida by Family Poverty
In terms of family poverty, the demographic groups most similar to Tlingit-Haida are Immigrants from Pakistan (8.0%, a difference of 0.11%), Immigrants from Philippines (8.0%, a difference of 0.12%), Immigrants from Turkey (8.0%, a difference of 0.14%), Czechoslovakian (8.0%, a difference of 0.18%), and Immigrants from Italy (8.0%, a difference of 0.42%).
| Demographics | Rating | Rank | Family Poverty |
| Scottish | 97.3 /100 | #86 | Exceptional 7.9% |
| Belgians | 97.3 /100 | #87 | Exceptional 8.0% |
| Serbians | 97.2 /100 | #88 | Exceptional 8.0% |
| Immigrants | Denmark | 97.1 /100 | #89 | Exceptional 8.0% |
| Immigrants | England | 97.1 /100 | #90 | Exceptional 8.0% |
| Immigrants | Italy | 97.0 /100 | #91 | Exceptional 8.0% |
| Czechoslovakians | 96.8 /100 | #92 | Exceptional 8.0% |
| Tlingit-Haida | 96.7 /100 | #93 | Exceptional 8.0% |
| Immigrants | Pakistan | 96.6 /100 | #94 | Exceptional 8.0% |
| Immigrants | Philippines | 96.5 /100 | #95 | Exceptional 8.0% |
| Immigrants | Turkey | 96.5 /100 | #96 | Exceptional 8.0% |
| Immigrants | Switzerland | 96.1 /100 | #97 | Exceptional 8.1% |
| Immigrants | South Africa | 95.9 /100 | #98 | Exceptional 8.1% |
| Welsh | 95.8 /100 | #99 | Exceptional 8.1% |
| New Zealanders | 95.8 /100 | #100 | Exceptional 8.1% |
Demographics Similar to Africans by Family Poverty
In terms of family poverty, the demographic groups most similar to Africans are Immigrants from Latin America (11.8%, a difference of 0.19%), Mexican (11.8%, a difference of 0.37%), Guatemalan (11.7%, a difference of 0.50%), Bahamian (11.7%, a difference of 0.54%), and Immigrants from Bangladesh (11.7%, a difference of 0.80%).
| Demographics | Rating | Rank | Family Poverty |
| Choctaw | 0.0 /100 | #296 | Tragic 11.6% |
| Creek | 0.0 /100 | #297 | Tragic 11.7% |
| Immigrants | Senegal | 0.0 /100 | #298 | Tragic 11.7% |
| Dutch West Indians | 0.0 /100 | #299 | Tragic 11.7% |
| Immigrants | Bangladesh | 0.0 /100 | #300 | Tragic 11.7% |
| Bahamians | 0.0 /100 | #301 | Tragic 11.7% |
| Guatemalans | 0.0 /100 | #302 | Tragic 11.7% |
| Africans | 0.0 /100 | #303 | Tragic 11.8% |
| Immigrants | Latin America | 0.0 /100 | #304 | Tragic 11.8% |
| Mexicans | 0.0 /100 | #305 | Tragic 11.8% |
| Cajuns | 0.0 /100 | #306 | Tragic 11.9% |
| Immigrants | Congo | 0.0 /100 | #307 | Tragic 11.9% |
| Seminole | 0.0 /100 | #308 | Tragic 11.9% |
| Hispanics or Latinos | 0.0 /100 | #309 | Tragic 12.0% |
| Immigrants | Guatemala | 0.0 /100 | #310 | Tragic 12.0% |