Tlingit-Haida vs Apache Family Poverty
COMPARE
Tlingit-Haida
Apache
Family Poverty
Family Poverty Comparison
Tlingit-Haida
Apache
8.0%
FAMILY POVERTY
96.7/ 100
METRIC RATING
93rd/ 347
METRIC RANK
14.7%
FAMILY POVERTY
0.0/ 100
METRIC RATING
335th/ 347
METRIC RANK
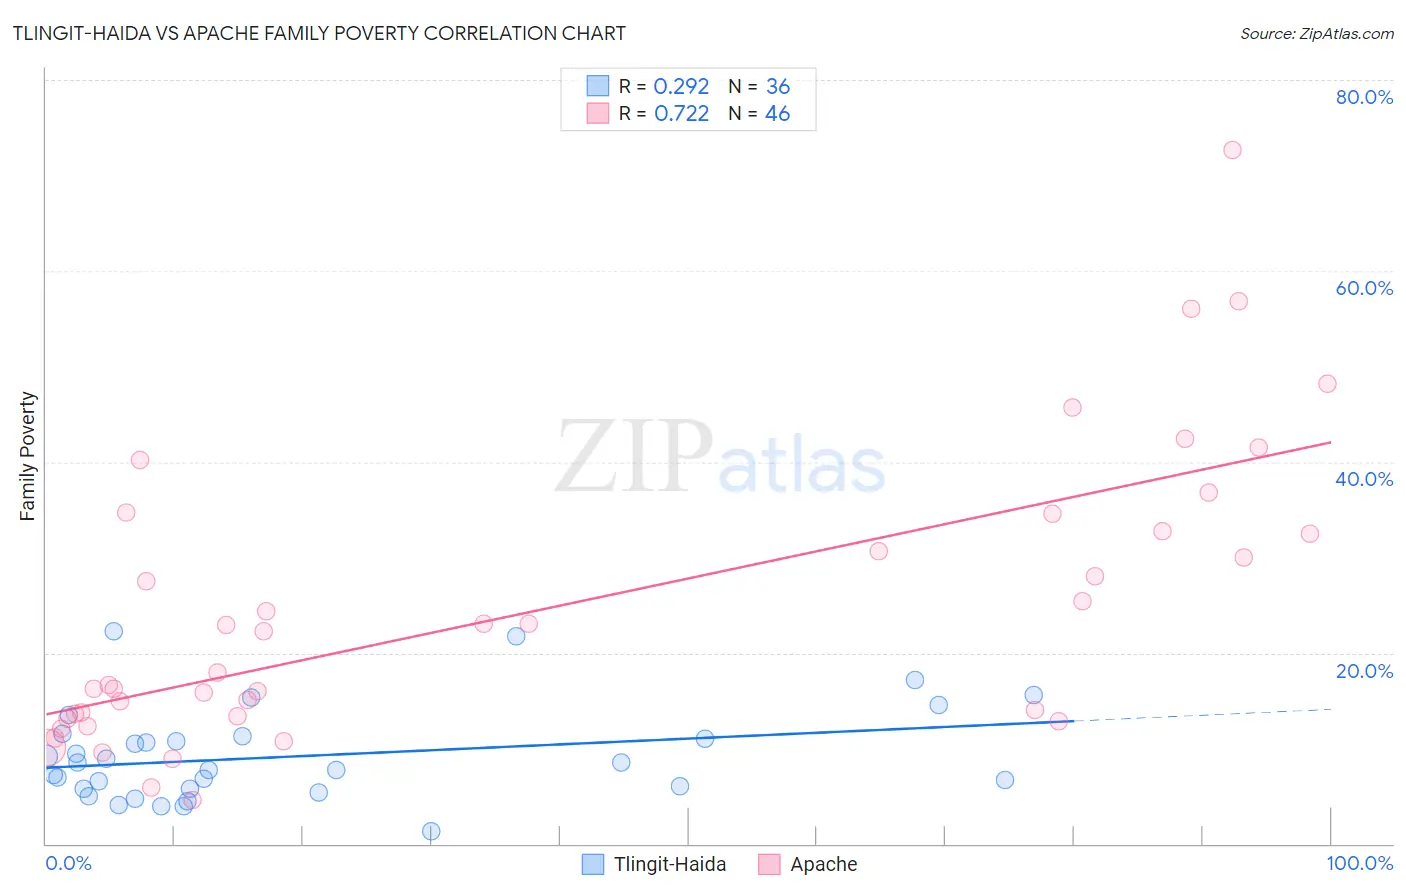
Tlingit-Haida vs Apache Family Poverty Correlation Chart
The statistical analysis conducted on geographies consisting of 60,804,034 people shows a weak positive correlation between the proportion of Tlingit-Haida and poverty level among families in the United States with a correlation coefficient (R) of 0.292 and weighted average of 8.0%. Similarly, the statistical analysis conducted on geographies consisting of 230,899,358 people shows a strong positive correlation between the proportion of Apache and poverty level among families in the United States with a correlation coefficient (R) of 0.722 and weighted average of 14.7%, a difference of 83.9%.
Family Poverty Correlation Summary
| Measurement | Tlingit-Haida | Apache |
| Minimum | 1.3% | 4.6% |
| Maximum | 22.2% | 72.7% |
| Range | 21.0% | 68.1% |
| Mean | 9.2% | 24.5% |
| Median | 8.1% | 20.1% |
| Interquartile 25% (IQ1) | 5.8% | 13.3% |
| Interquartile 75% (IQ3) | 11.2% | 32.7% |
| Interquartile Range (IQR) | 5.4% | 19.4% |
| Standard Deviation (Sample) | 4.8% | 15.1% |
| Standard Deviation (Population) | 4.8% | 14.9% |
Similar Demographics by Family Poverty
Demographics Similar to Tlingit-Haida by Family Poverty
In terms of family poverty, the demographic groups most similar to Tlingit-Haida are Immigrants from Pakistan (8.0%, a difference of 0.11%), Immigrants from Philippines (8.0%, a difference of 0.12%), Immigrants from Turkey (8.0%, a difference of 0.14%), Czechoslovakian (8.0%, a difference of 0.18%), and Immigrants from Italy (8.0%, a difference of 0.42%).
| Demographics | Rating | Rank | Family Poverty |
| Scottish | 97.3 /100 | #86 | Exceptional 7.9% |
| Belgians | 97.3 /100 | #87 | Exceptional 8.0% |
| Serbians | 97.2 /100 | #88 | Exceptional 8.0% |
| Immigrants | Denmark | 97.1 /100 | #89 | Exceptional 8.0% |
| Immigrants | England | 97.1 /100 | #90 | Exceptional 8.0% |
| Immigrants | Italy | 97.0 /100 | #91 | Exceptional 8.0% |
| Czechoslovakians | 96.8 /100 | #92 | Exceptional 8.0% |
| Tlingit-Haida | 96.7 /100 | #93 | Exceptional 8.0% |
| Immigrants | Pakistan | 96.6 /100 | #94 | Exceptional 8.0% |
| Immigrants | Philippines | 96.5 /100 | #95 | Exceptional 8.0% |
| Immigrants | Turkey | 96.5 /100 | #96 | Exceptional 8.0% |
| Immigrants | Switzerland | 96.1 /100 | #97 | Exceptional 8.1% |
| Immigrants | South Africa | 95.9 /100 | #98 | Exceptional 8.1% |
| Welsh | 95.8 /100 | #99 | Exceptional 8.1% |
| New Zealanders | 95.8 /100 | #100 | Exceptional 8.1% |
Demographics Similar to Apache by Family Poverty
In terms of family poverty, the demographic groups most similar to Apache are Houma (14.6%, a difference of 0.85%), Immigrants from Dominican Republic (14.4%, a difference of 2.1%), Dominican (14.3%, a difference of 2.8%), Cheyenne (14.3%, a difference of 3.2%), and Native/Alaskan (14.3%, a difference of 3.4%).
| Demographics | Rating | Rank | Family Poverty |
| Central American Indians | 0.0 /100 | #328 | Tragic 13.3% |
| Blacks/African Americans | 0.0 /100 | #329 | Tragic 13.3% |
| Natives/Alaskans | 0.0 /100 | #330 | Tragic 14.3% |
| Cheyenne | 0.0 /100 | #331 | Tragic 14.3% |
| Dominicans | 0.0 /100 | #332 | Tragic 14.3% |
| Immigrants | Dominican Republic | 0.0 /100 | #333 | Tragic 14.4% |
| Houma | 0.0 /100 | #334 | Tragic 14.6% |
| Apache | 0.0 /100 | #335 | Tragic 14.7% |
| Sioux | 0.0 /100 | #336 | Tragic 15.9% |
| Hopi | 0.0 /100 | #337 | Tragic 15.9% |
| Crow | 0.0 /100 | #338 | Tragic 16.1% |
| Yuman | 0.0 /100 | #339 | Tragic 16.6% |
| Pueblo | 0.0 /100 | #340 | Tragic 17.0% |
| Lumbee | 0.0 /100 | #341 | Tragic 17.0% |
| Immigrants | Yemen | 0.0 /100 | #342 | Tragic 17.5% |