Zip Codes with the Highest Percentage of Population Employed in Architecture & Engineering in Levittown, PA
RELATED REPORTS & OPTIONS
Architecture & Engineering
Levittown
Compare Zip Codes
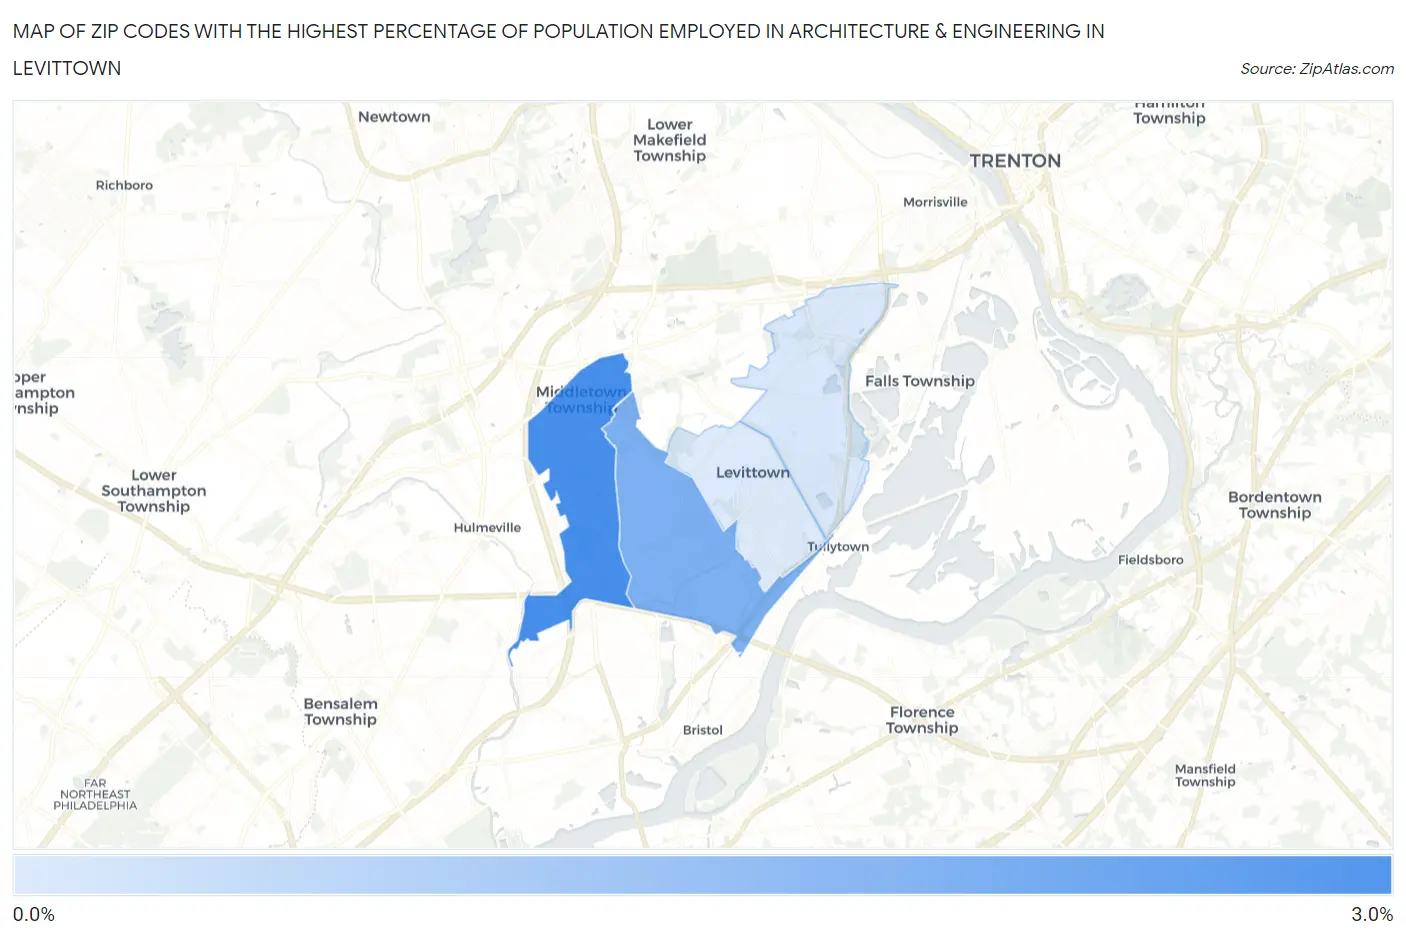
Map of Zip Codes with the Highest Percentage of Population Employed in Architecture & Engineering in Levittown
0.76%
2.6%
Zip Codes with the Highest Percentage of Population Employed in Architecture & Engineering in Levittown, PA
| Zip Code | % Employed | vs State | vs National | |
| 1. | 19056 | 2.6% | 2.0%(+0.544)#363 | 2.1%(+0.436)#6,645 |
| 2. | 19057 | 1.9% | 2.0%(-0.106)#573 | 2.1%(-0.214)#10,011 |
| 3. | 19054 | 0.81% | 2.0%(-1.23)#1,038 | 2.1%(-1.34)#18,061 |
| 4. | 19055 | 0.76% | 2.0%(-1.29)#1,056 | 2.1%(-1.39)#18,490 |
1
Common Questions
What are the Top 3 Zip Codes with the Highest Percentage of Population Employed in Architecture & Engineering in Levittown, PA?
Top 3 Zip Codes with the Highest Percentage of Population Employed in Architecture & Engineering in Levittown, PA are:
What zip code has the Highest Percentage of Population Employed in Architecture & Engineering in Levittown, PA?
19056 has the Highest Percentage of Population Employed in Architecture & Engineering in Levittown, PA with 2.6%.
What is the Percentage of Population Employed in Architecture & Engineering in Levittown, PA?
Percentage of Population Employed in Architecture & Engineering in Levittown is 1.7%.
What is the Percentage of Population Employed in Architecture & Engineering in Pennsylvania?
Percentage of Population Employed in Architecture & Engineering in Pennsylvania is 2.0%.
What is the Percentage of Population Employed in Architecture & Engineering in the United States?
Percentage of Population Employed in Architecture & Engineering in the United States is 2.1%.