Zip Codes with the Highest Percentage of Population Employed in Architecture & Engineering in Lebanon, PA
RELATED REPORTS & OPTIONS
Architecture & Engineering
Lebanon
Compare Zip Codes
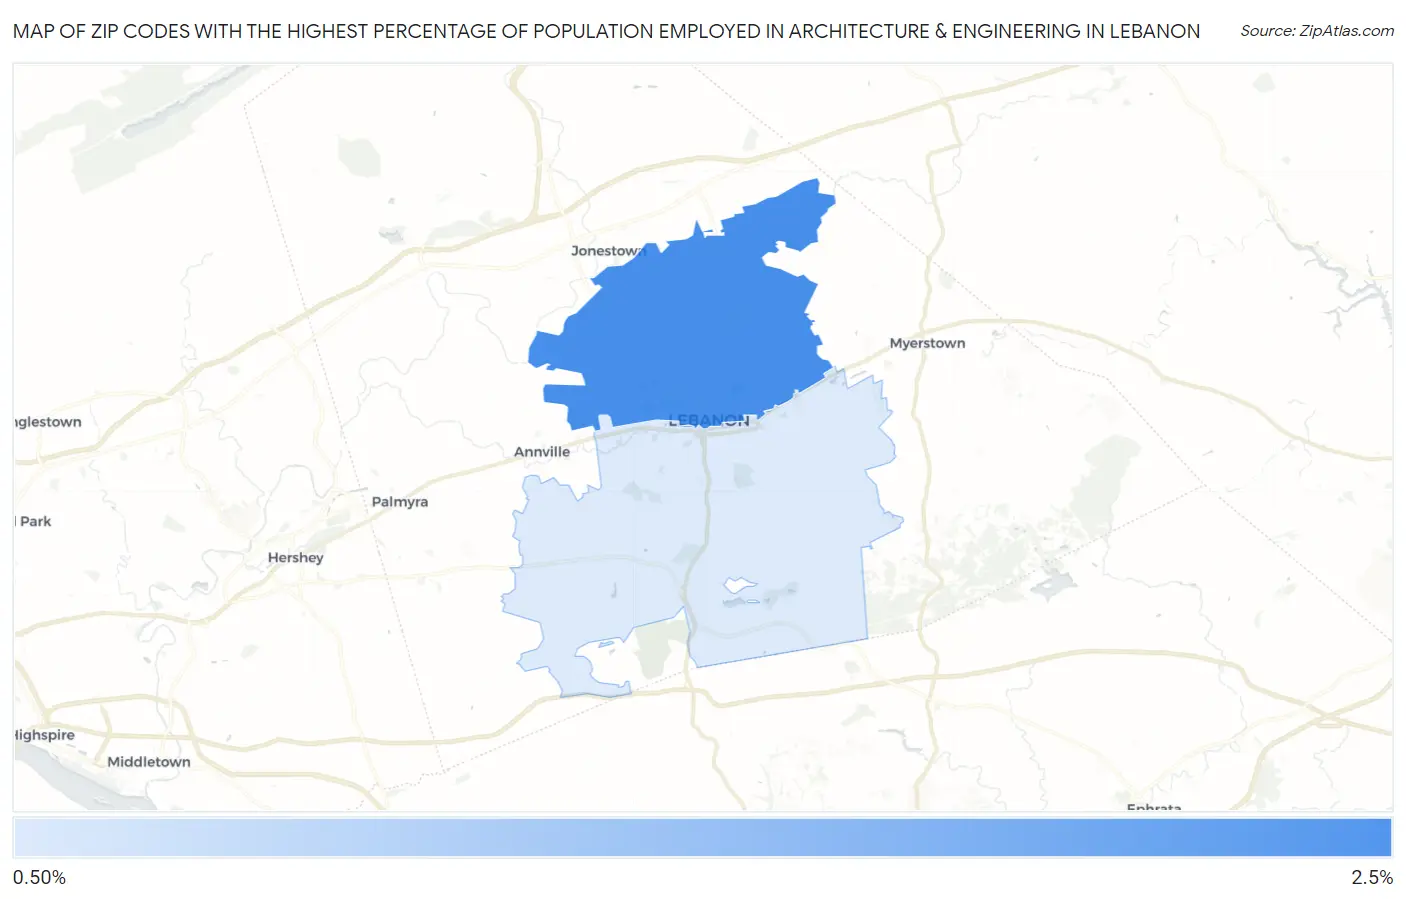
Map of Zip Codes with the Highest Percentage of Population Employed in Architecture & Engineering in Lebanon
1.4%
2.5%
Zip Codes with the Highest Percentage of Population Employed in Architecture & Engineering in Lebanon, PA
| Zip Code | % Employed | vs State | vs National | |
| 1. | 17046 | 2.5% | 2.0%(+0.423)#398 | 2.1%(+0.315)#7,156 |
| 2. | 17042 | 1.4% | 2.0%(-0.605)#779 | 2.1%(-0.713)#13,324 |
1
Common Questions
What are the Top Zip Codes with the Highest Percentage of Population Employed in Architecture & Engineering in Lebanon, PA?
Top Zip Codes with the Highest Percentage of Population Employed in Architecture & Engineering in Lebanon, PA are:
What zip code has the Highest Percentage of Population Employed in Architecture & Engineering in Lebanon, PA?
17046 has the Highest Percentage of Population Employed in Architecture & Engineering in Lebanon, PA with 2.5%.
What is the Percentage of Population Employed in Architecture & Engineering in Lebanon, PA?
Percentage of Population Employed in Architecture & Engineering in Lebanon is 0.61%.
What is the Percentage of Population Employed in Architecture & Engineering in Pennsylvania?
Percentage of Population Employed in Architecture & Engineering in Pennsylvania is 2.0%.
What is the Percentage of Population Employed in Architecture & Engineering in the United States?
Percentage of Population Employed in Architecture & Engineering in the United States is 2.1%.