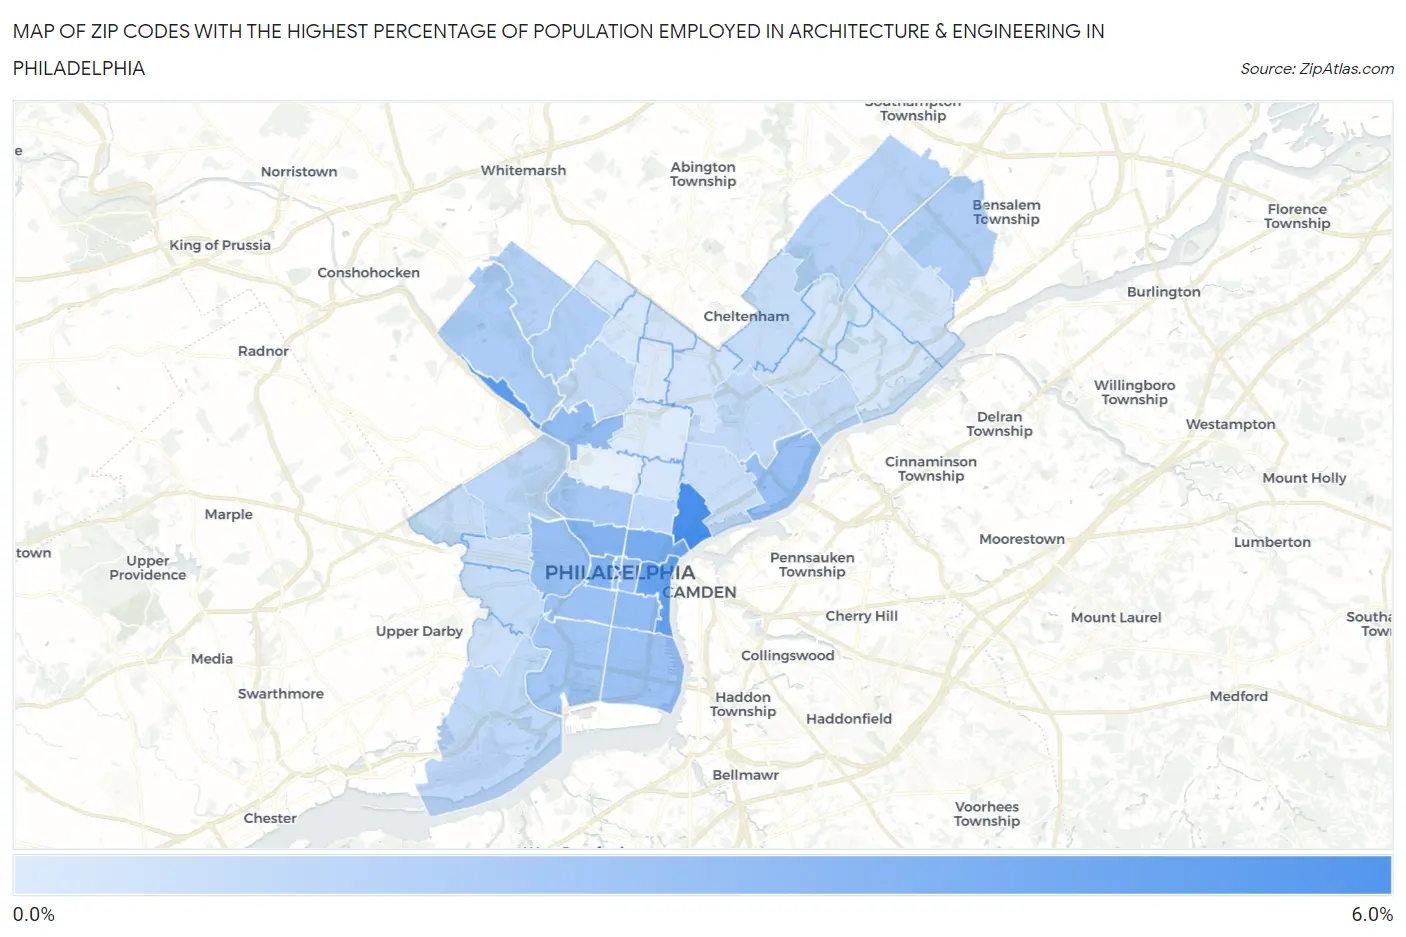
Zip Codes with the Highest Percentage of Population Employed in Architecture & Engineering in Philadelphia, PA
RELATED REPORTS & OPTIONS
Architecture & Engineering
Philadelphia
Compare Zip Codes
Map of Zip Codes with the Highest Percentage of Population Employed in Architecture & Engineering in Philadelphia
0.052%
5.5%
Zip Codes with the Highest Percentage of Population Employed in Architecture & Engineering in Philadelphia, PA
| Zip Code | % Employed | vs State | vs National | |
| 1. | 19125 | 5.5% | 2.0%(+3.44)#50 | 2.1%(+3.33)#1,342 |
| 2. | 19127 | 4.8% | 2.0%(+2.73)#85 | 2.1%(+2.62)#1,855 |
| 3. | 19106 | 4.2% | 2.0%(+2.15)#113 | 2.1%(+2.04)#2,507 |
| 4. | 19123 | 3.7% | 2.0%(+1.68)#147 | 2.1%(+1.57)#3,250 |
| 5. | 19130 | 3.3% | 2.0%(+1.31)#205 | 2.1%(+1.20)#4,071 |
| 6. | 19103 | 3.3% | 2.0%(+1.28)#210 | 2.1%(+1.17)#4,138 |
| 7. | 19147 | 2.8% | 2.0%(+0.763)#315 | 2.1%(+0.655)#5,775 |
| 8. | 19129 | 2.7% | 2.0%(+0.688)#332 | 2.1%(+0.580)#6,045 |
| 9. | 19107 | 2.6% | 2.0%(+0.510)#373 | 2.1%(+0.402)#6,783 |
| 10. | 19104 | 2.5% | 2.0%(+0.499)#377 | 2.1%(+0.391)#6,834 |
| 11. | 19137 | 2.5% | 2.0%(+0.468)#385 | 2.1%(+0.360)#6,950 |
| 12. | 19146 | 2.5% | 2.0%(+0.429)#396 | 2.1%(+0.321)#7,134 |
| 13. | 19148 | 2.5% | 2.0%(+0.415)#401 | 2.1%(+0.307)#7,196 |
| 14. | 19145 | 2.1% | 2.0%(+0.068)#508 | 2.1%(-0.040)#8,984 |
| 15. | 19102 | 2.1% | 2.0%(+0.056)#514 | 2.1%(-0.052)#9,059 |
| 16. | 19121 | 2.0% | 2.0%(-0.037)#543 | 2.1%(-0.145)#9,568 |
| 17. | 19128 | 1.8% | 2.0%(-0.248)#620 | 2.1%(-0.356)#10,865 |
| 18. | 19154 | 1.7% | 2.0%(-0.326)#657 | 2.1%(-0.434)#11,386 |
| 19. | 19119 | 1.6% | 2.0%(-0.446)#709 | 2.1%(-0.554)#12,221 |
| 20. | 19118 | 1.5% | 2.0%(-0.555)#759 | 2.1%(-0.664)#12,995 |
| 21. | 19116 | 1.4% | 2.0%(-0.611)#781 | 2.1%(-0.719)#13,356 |
| 22. | 19115 | 1.4% | 2.0%(-0.624)#790 | 2.1%(-0.733)#13,465 |
| 23. | 19131 | 1.2% | 2.0%(-0.858)#894 | 2.1%(-0.966)#15,216 |
| 24. | 19153 | 1.1% | 2.0%(-0.913)#919 | 2.1%(-1.02)#15,621 |
| 25. | 19122 | 1.1% | 2.0%(-0.963)#942 | 2.1%(-1.07)#16,036 |
| 26. | 19124 | 1.1% | 2.0%(-0.972)#946 | 2.1%(-1.08)#16,097 |
| 27. | 19144 | 1.1% | 2.0%(-0.985)#953 | 2.1%(-1.09)#16,205 |
| 28. | 19135 | 0.96% | 2.0%(-1.08)#979 | 2.1%(-1.19)#16,939 |
| 29. | 19143 | 0.89% | 2.0%(-1.15)#1,003 | 2.1%(-1.26)#17,442 |
| 30. | 19111 | 0.87% | 2.0%(-1.17)#1,011 | 2.1%(-1.28)#17,613 |
| 31. | 19151 | 0.83% | 2.0%(-1.21)#1,027 | 2.1%(-1.32)#17,910 |
| 32. | 19134 | 0.78% | 2.0%(-1.26)#1,048 | 2.1%(-1.37)#18,298 |
| 33. | 19139 | 0.70% | 2.0%(-1.35)#1,079 | 2.1%(-1.45)#18,924 |
| 34. | 19142 | 0.61% | 2.0%(-1.43)#1,112 | 2.1%(-1.54)#19,537 |
| 35. | 19149 | 0.56% | 2.0%(-1.48)#1,133 | 2.1%(-1.59)#19,936 |
| 36. | 19120 | 0.49% | 2.0%(-1.55)#1,154 | 2.1%(-1.66)#20,352 |
| 37. | 19114 | 0.44% | 2.0%(-1.60)#1,171 | 2.1%(-1.71)#20,681 |
| 38. | 19126 | 0.43% | 2.0%(-1.61)#1,173 | 2.1%(-1.72)#20,766 |
| 39. | 19152 | 0.39% | 2.0%(-1.65)#1,183 | 2.1%(-1.76)#21,020 |
| 40. | 19133 | 0.31% | 2.0%(-1.73)#1,195 | 2.1%(-1.84)#21,478 |
| 41. | 19136 | 0.28% | 2.0%(-1.76)#1,207 | 2.1%(-1.87)#21,659 |
| 42. | 19138 | 0.27% | 2.0%(-1.77)#1,210 | 2.1%(-1.88)#21,716 |
| 43. | 19150 | 0.20% | 2.0%(-1.85)#1,223 | 2.1%(-1.95)#22,060 |
| 44. | 19141 | 0.12% | 2.0%(-1.92)#1,229 | 2.1%(-2.03)#22,340 |
| 45. | 19140 | 0.052% | 2.0%(-1.99)#1,231 | 2.1%(-2.10)#22,453 |
1
Common Questions
What are the Top 10 Zip Codes with the Highest Percentage of Population Employed in Architecture & Engineering in Philadelphia, PA?
Top 10 Zip Codes with the Highest Percentage of Population Employed in Architecture & Engineering in Philadelphia, PA are:
What zip code has the Highest Percentage of Population Employed in Architecture & Engineering in Philadelphia, PA?
19125 has the Highest Percentage of Population Employed in Architecture & Engineering in Philadelphia, PA with 5.5%.
What is the Percentage of Population Employed in Architecture & Engineering in Philadelphia, PA?
Percentage of Population Employed in Architecture & Engineering in Philadelphia is 1.5%.
What is the Percentage of Population Employed in Architecture & Engineering in Pennsylvania?
Percentage of Population Employed in Architecture & Engineering in Pennsylvania is 2.0%.
What is the Percentage of Population Employed in Architecture & Engineering in the United States?
Percentage of Population Employed in Architecture & Engineering in the United States is 2.1%.