Zip Codes with the Highest Percentage of Population Employed in Architecture & Engineering in Williamsport, PA
RELATED REPORTS & OPTIONS
Architecture & Engineering
Williamsport
Compare Zip Codes
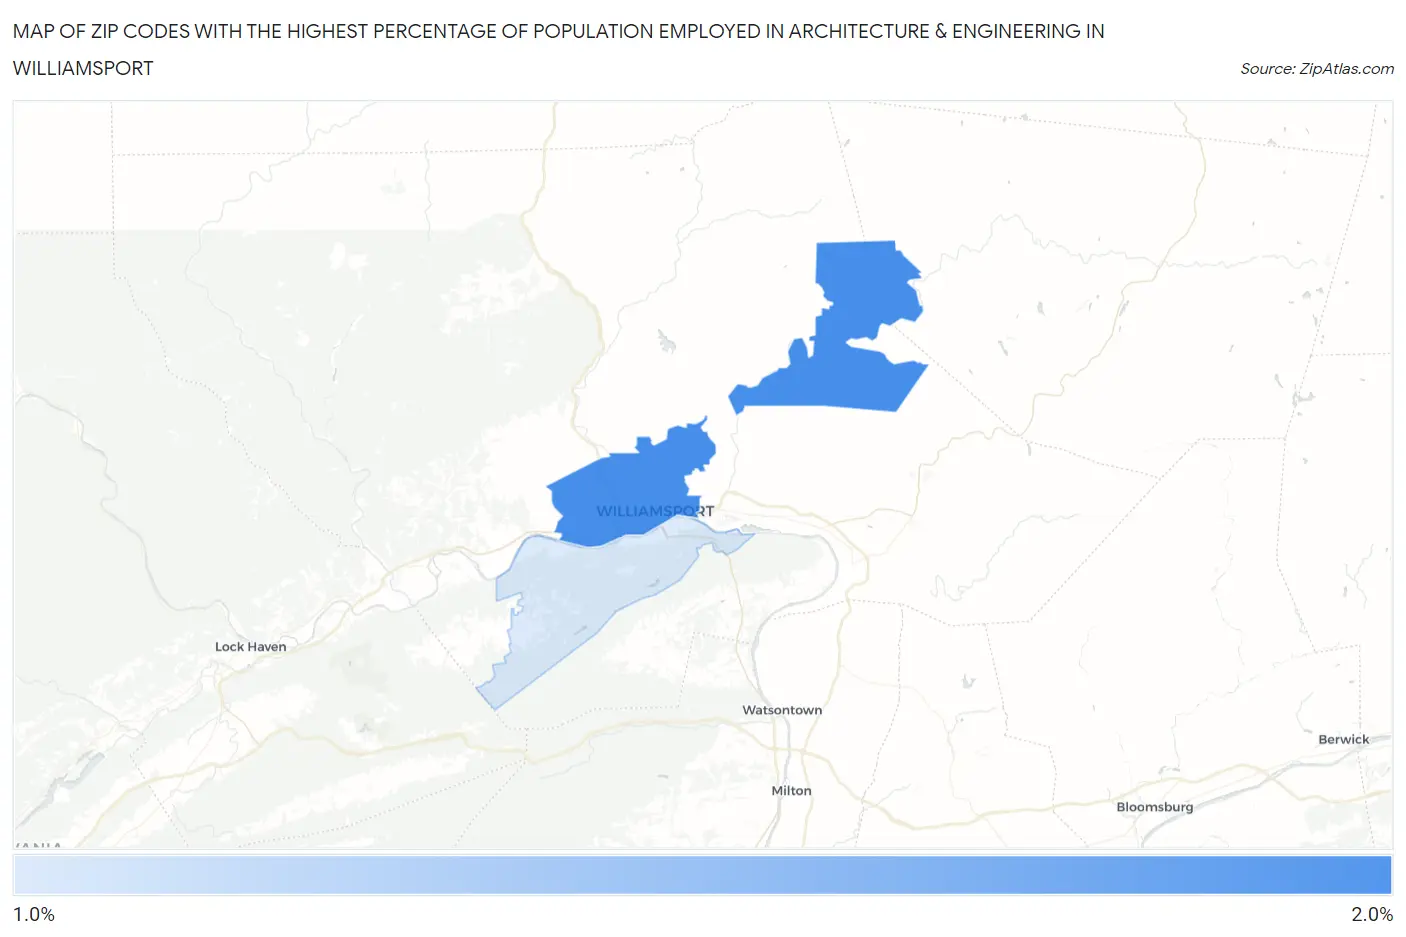
Map of Zip Codes with the Highest Percentage of Population Employed in Architecture & Engineering in Williamsport
1.4%
1.6%
Zip Codes with the Highest Percentage of Population Employed in Architecture & Engineering in Williamsport, PA
| Zip Code | % Employed | vs State | vs National | |
| 1. | 17701 | 1.6% | 2.0%(-0.428)#699 | 2.1%(-0.536)#12,092 |
| 2. | 17702 | 1.4% | 2.0%(-0.689)#822 | 2.1%(-0.797)#13,936 |
1
Common Questions
What are the Top Zip Codes with the Highest Percentage of Population Employed in Architecture & Engineering in Williamsport, PA?
Top Zip Codes with the Highest Percentage of Population Employed in Architecture & Engineering in Williamsport, PA are:
What zip code has the Highest Percentage of Population Employed in Architecture & Engineering in Williamsport, PA?
17701 has the Highest Percentage of Population Employed in Architecture & Engineering in Williamsport, PA with 1.6%.
What is the Percentage of Population Employed in Architecture & Engineering in Williamsport, PA?
Percentage of Population Employed in Architecture & Engineering in Williamsport is 1.1%.
What is the Percentage of Population Employed in Architecture & Engineering in Pennsylvania?
Percentage of Population Employed in Architecture & Engineering in Pennsylvania is 2.0%.
What is the Percentage of Population Employed in Architecture & Engineering in the United States?
Percentage of Population Employed in Architecture & Engineering in the United States is 2.1%.