Zip Codes with the Highest Percentage of Population Employed in Legal Services & Support in Butler, PA
RELATED REPORTS & OPTIONS
Legal Services & Support
Butler
Compare Zip Codes
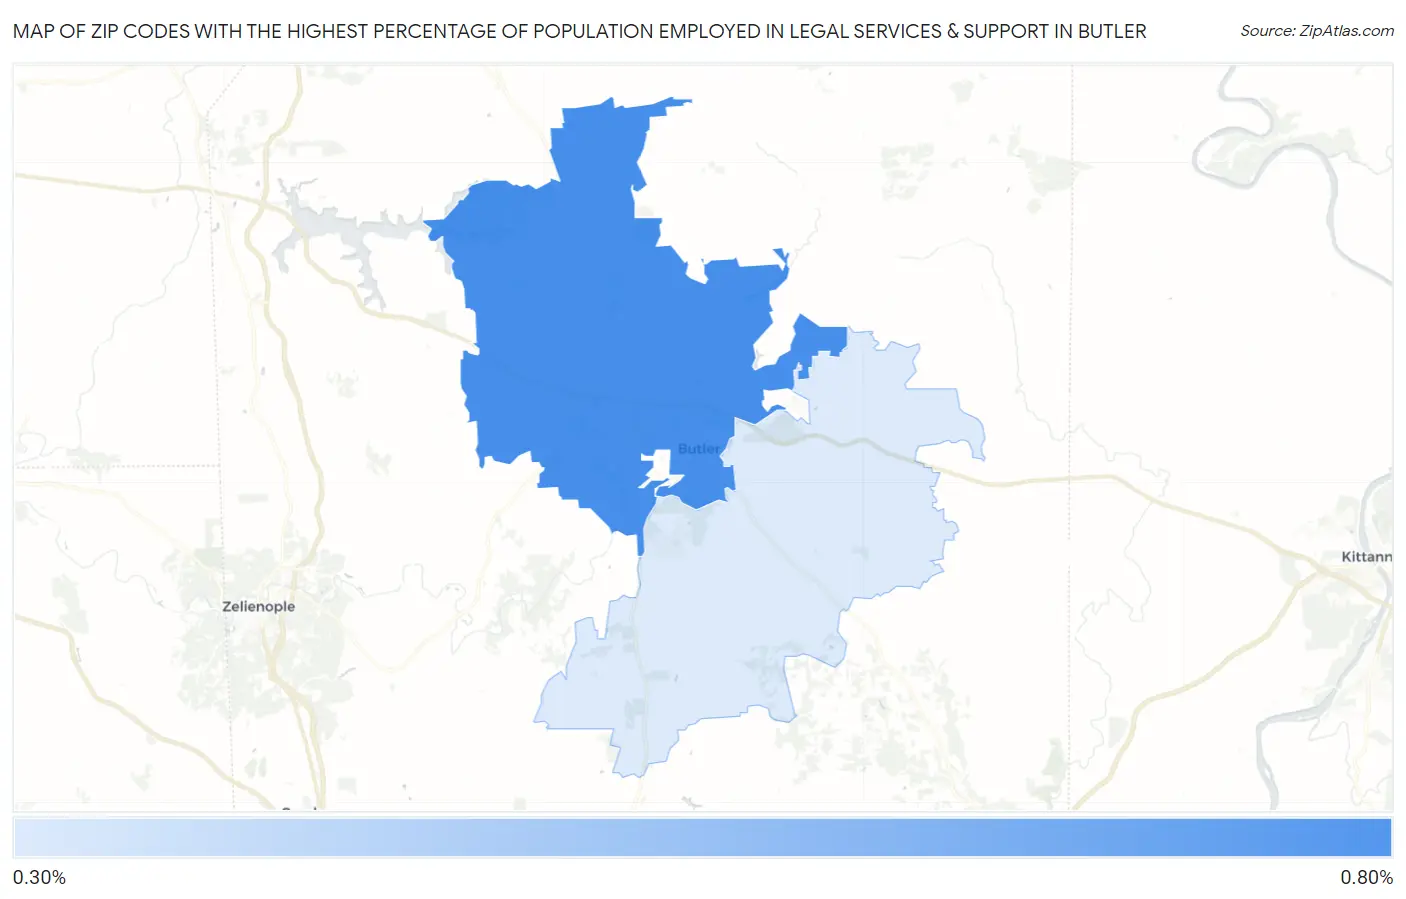
Map of Zip Codes with the Highest Percentage of Population Employed in Legal Services & Support in Butler
0.33%
0.74%
Zip Codes with the Highest Percentage of Population Employed in Legal Services & Support in Butler, PA
| Zip Code | % Employed | vs State | vs National | |
| 1. | 16001 | 0.74% | 1.1%(-0.410)#490 | 1.2%(-0.446)#10,030 |
| 2. | 16002 | 0.33% | 1.1%(-0.817)#737 | 1.2%(-0.853)#14,702 |
1
Common Questions
What are the Top Zip Codes with the Highest Percentage of Population Employed in Legal Services & Support in Butler, PA?
Top Zip Codes with the Highest Percentage of Population Employed in Legal Services & Support in Butler, PA are:
What zip code has the Highest Percentage of Population Employed in Legal Services & Support in Butler, PA?
16001 has the Highest Percentage of Population Employed in Legal Services & Support in Butler, PA with 0.74%.
What is the Percentage of Population Employed in Legal Services & Support in Butler, PA?
Percentage of Population Employed in Legal Services & Support in Butler is 0.48%.
What is the Percentage of Population Employed in Legal Services & Support in Pennsylvania?
Percentage of Population Employed in Legal Services & Support in Pennsylvania is 1.1%.
What is the Percentage of Population Employed in Legal Services & Support in the United States?
Percentage of Population Employed in Legal Services & Support in the United States is 1.2%.