Zip Codes with the Highest Percentage of Population Employed in Manufacturing in Stillwater, OK
RELATED REPORTS & OPTIONS
Manufacturing
Stillwater
Compare Zip Codes
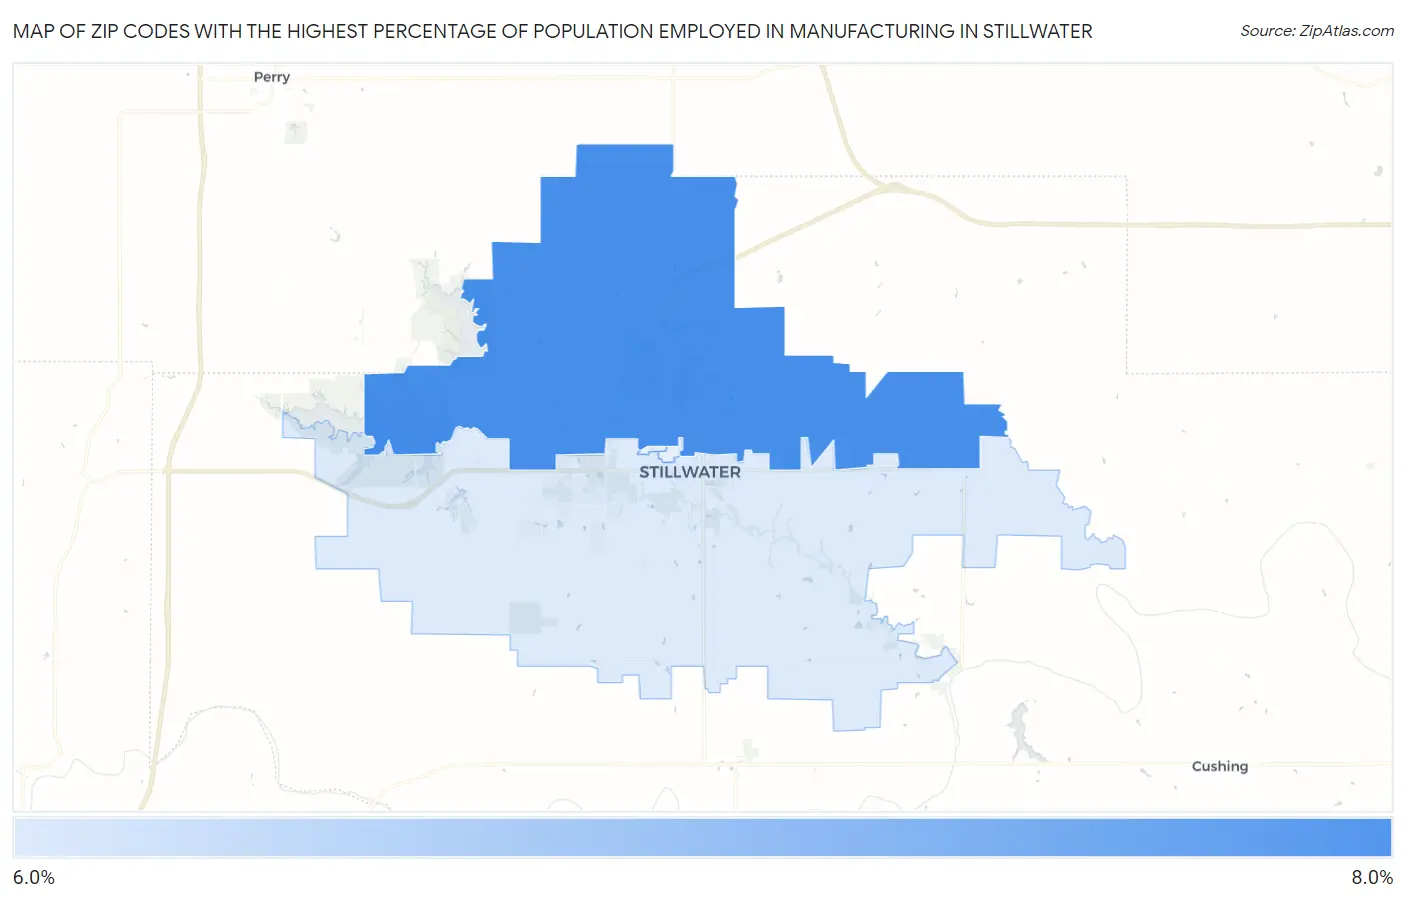
Map of Zip Codes with the Highest Percentage of Population Employed in Manufacturing in Stillwater
6.3%
6.6%
Zip Codes with the Highest Percentage of Population Employed in Manufacturing in Stillwater, OK
| Zip Code | % Employed | vs State | vs National | |
| 1. | 74075 | 6.6% | 9.4%(-2.81)#416 | 10.0%(-3.39)#21,685 |
| 2. | 74074 | 6.3% | 9.4%(-3.13)#436 | 10.0%(-3.71)#22,255 |
1
Common Questions
What are the Top 3 Zip Codes with the Highest Percentage of Population Employed in Manufacturing in Stillwater, OK?
Top 3 Zip Codes with the Highest Percentage of Population Employed in Manufacturing in Stillwater, OK are:
What zip code has the Highest Percentage of Population Employed in Manufacturing in Stillwater, OK?
74075 has the Highest Percentage of Population Employed in Manufacturing in Stillwater, OK with 6.6%.
What is the Percentage of Population Employed in Manufacturing in Stillwater, OK?
Percentage of Population Employed in Manufacturing in Stillwater is 5.9%.
What is the Percentage of Population Employed in Manufacturing in Oklahoma?
Percentage of Population Employed in Manufacturing in Oklahoma is 9.4%.
What is the Percentage of Population Employed in Manufacturing in the United States?
Percentage of Population Employed in Manufacturing in the United States is 10.0%.