Zip Codes with the Highest Percentage of State Government Employees in Stillwater, OK
RELATED REPORTS & OPTIONS
State Government Employees
Stillwater
Compare Zip Codes
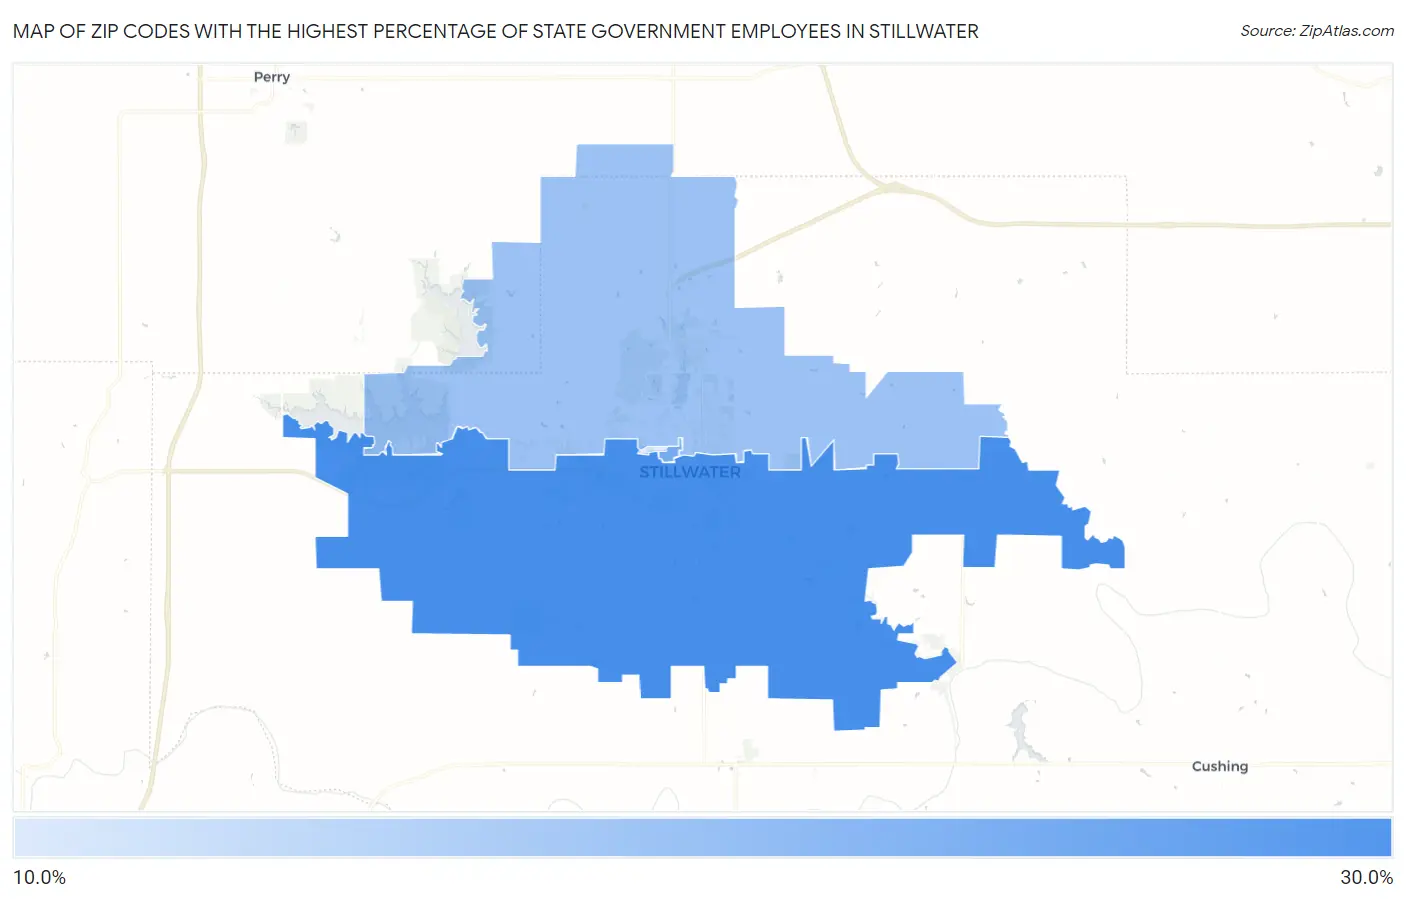
Map of Zip Codes with the Highest Percentage of State Government Employees in Stillwater
12.7%
26.1%
Zip Codes with the Highest Percentage of State Government Employees in Stillwater, OK
| Zip Code | % State Government Employees | vs State | vs National | |
| 1. | 74074 | 26.1% | 6.1%(+20.0)#13 | 4.2%(+21.9)#510 |
| 2. | 74077 | 21.9% | 6.1%(+15.8)#20 | 4.2%(+17.6)#731 |
| 3. | 74075 | 18.5% | 6.1%(+12.4)#30 | 4.2%(+14.2)#1,094 |
| 4. | 74078 | 12.7% | 6.1%(+6.56)#75 | 4.2%(+8.43)#2,423 |
1
Common Questions
What are the Top 3 Zip Codes with the Highest Percentage of State Government Employees in Stillwater, OK?
Top 3 Zip Codes with the Highest Percentage of State Government Employees in Stillwater, OK are:
What zip code has the Highest Percentage of State Government Employees in Stillwater, OK?
74074 has the Highest Percentage of State Government Employees in Stillwater, OK with 26.1%.
What is the Percentage of State Government Employees in Stillwater, OK?
Percentage of State Government Employees in Stillwater is 25.2%.
What is the Percentage of State Government Employees in Oklahoma?
Percentage of State Government Employees in Oklahoma is 6.1%.
What is the Percentage of State Government Employees in the United States?
Percentage of State Government Employees in the United States is 4.2%.